Investment Dashboard

Financial Highlights Template 1 Ppt PowerPoint Presentation Gallery Templates
This is a financial highlights template 1 ppt powerpoint presentation gallery templates. This is a four stage process. The stages in this process are sales, operating expenses, operating income, net income.
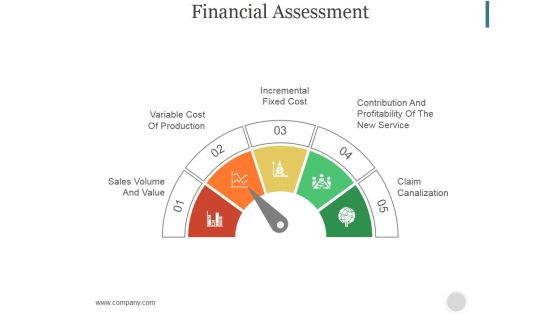
Financial Assessment Ppt PowerPoint Presentation Picture
This is a financial assessment ppt powerpoint presentation picture. This is a five stage process. The stages in this process are sales volume and value, variable cost of production, incremental fixed cost, contribution and profitability of the new service, claim canalization.
Enterprise Analysis Customer Satisfaction Ppt Icon Backgrounds PDF
This is a enterprise analysis customer satisfaction ppt icon backgrounds pdf template with various stages. Focus and dispense information on three stages using this creative set, that comes with editable features. It contains large content boxes to add your information on topics like overall satisfaction with service, satisfaction with value for money, overall satisfaction with relationship. You can also showcase facts, figures, and other relevant content using this PPT layout. Grab it now.
Deal Assessment Audit Process Customer Satisfaction Icons PDF
Presenting deal assessment audit process customer satisfaction icons pdf to provide visual cues and insights. Share and navigate important information on three stages that need your due attention. This template can be used to pitch topics like overall satisfaction with service, satisfaction with value for money, overall satisfaction with relationship. In addition, this PPT design contains high-resolution images, graphics, etc, that are easily editable and available for immediate download.
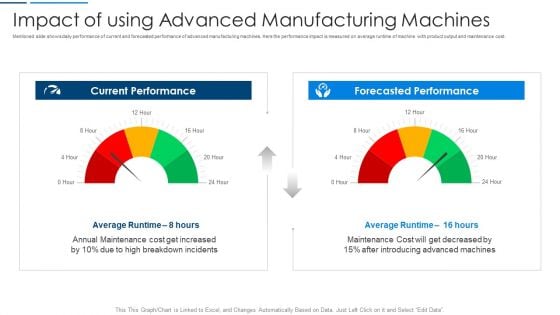
Information Technology Transformation Impact Of Using Advanced Manufacturing Machines Diagrams PDF
Mentioned slide shows daily performance of current and forecasted performance of advanced manufacturing machines. Here the performance impact is measured on average runtime of machine with product output and maintenance cost. This is a information technology transformation impact of using advanced manufacturing machines diagrams pdf template with various stages. Focus and dispense information on two stages using this creative set, that comes with editable features. It contains large content boxes to add your information on topics like forecasted performance, current performance, maintenance cost. You can also showcase facts, figures, and other relevant content using this PPT layout. Grab it now.
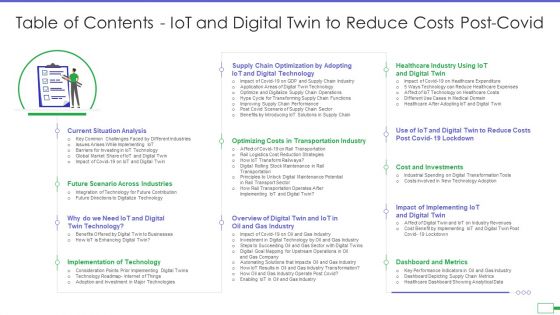
Table Of Contents Iot And Digital Twin To Reduce Costs Post Covid Background PDF
Presenting table of contents iot and digital twin to reduce costs post covid background pdf to provide visual cues and insights. Share and navigate important information on one stages that need your due attention. This template can be used to pitch topics like analysis, technology, dashboard and metrics, cost and investments. In addtion, this PPT design contains high resolution images, graphics, etc, that are easily editable and available for immediate download.
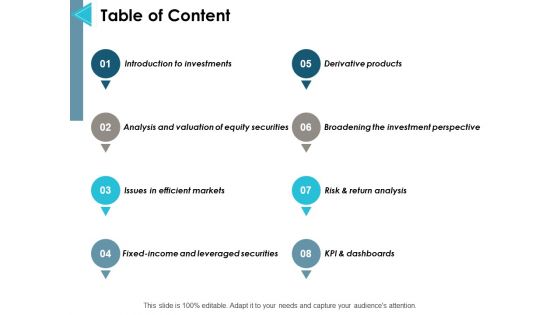
Table Of Content Ppt PowerPoint Presentation Gallery Graphic Tips
This is a table of content ppt powerpoint presentation gallery graphic tips. This is a eight stage process. The stages in this process are introduction to investments, risk and return analysis, issues in efficient markets, kpi and dashboards, management.
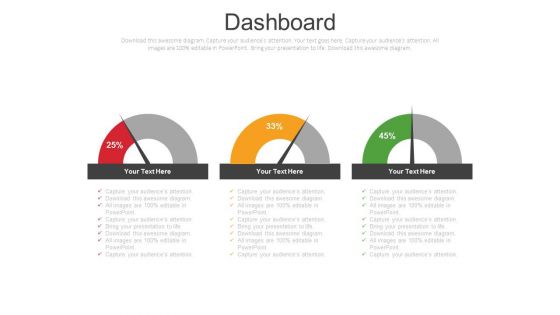
Parameters Of Growth And Development Powerpoint Slides
Dashboard design has been displayed in this business slide. This business diagram helps to exhibit parameters of growth and development. Download this PowerPoint template to build an exclusive presentation.
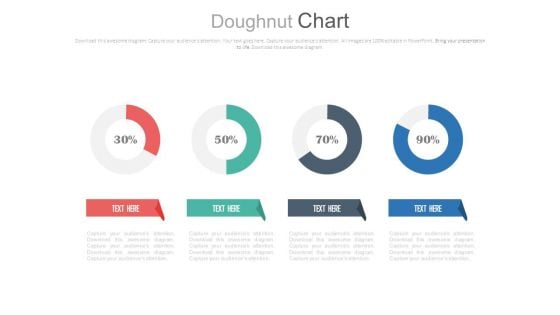
Four Circle Chart With Percentage Ratios Powerpoint Slides
This PowerPoint template has been designed with graphics of four circles and percentage ratios. You may use this dashboard slide design for topics like profit growth and financial planning. This PPT slide is powerful tool to describe your ideas.
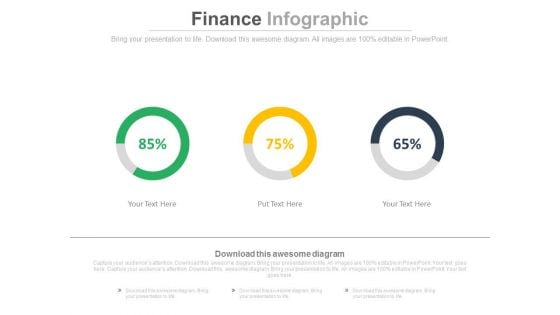
Linear Circles Percentage Analysis Charts Powerpoint Slides
This PowerPoint template has been designed with graphics of three circles and percentage ratios. You may use this dashboard slide design for topics like profit growth and financial planning. This PPT slide is powerful tool to describe your ideas.
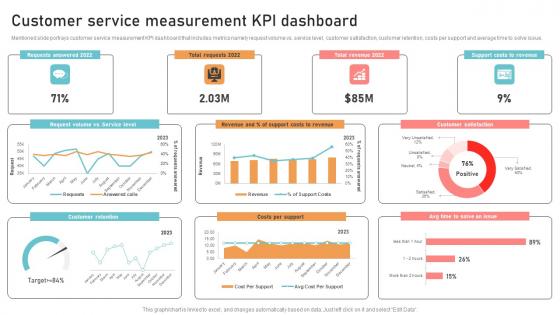
Optimizing Business Integration Customer Service Measurement KPI Template Pdf
Mentioned slide portrays customer service measurement KPI dashboard that includes metrics namely request volume vs. service level, customer satisfaction, customer retention, costs per support and average time to solve issue. Slidegeeks is here to make your presentations a breeze with Optimizing Business Integration Customer Service Measurement KPI Template Pdf With our easy to use and customizable templates, you can focus on delivering your ideas rather than worrying about formatting. With a variety of designs to choose from, you are sure to find one that suits your needs. And with animations and unique photos, illustrations, and fonts, you can make your presentation pop. So whether you are giving a sales pitch or presenting to the board, make sure to check out Slidegeeks first. Mentioned slide portrays customer service measurement KPI dashboard that includes metrics namely request volume vs. service level, customer satisfaction, customer retention, costs per support and average time to solve issue.
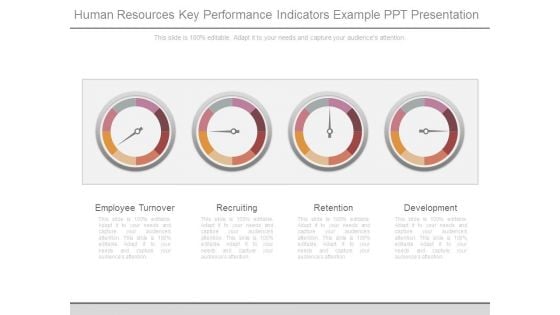
Human Resources Key Performance Indicators Example Ppt Presentation
This is a human resources key performance indicators example ppt presentation. This is a four stage process. The stages in this process are employee turnover, recruiting, retention, development.
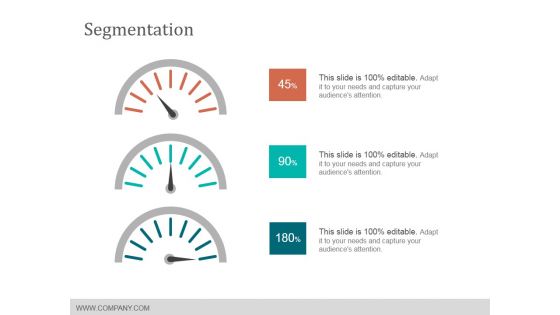
Segmentation Ppt PowerPoint Presentation Pictures Templates
This is a segmentation ppt powerpoint presentation pictures templates. This is a three stage process. The stages in this process are dashboard, business, measurement, finance.
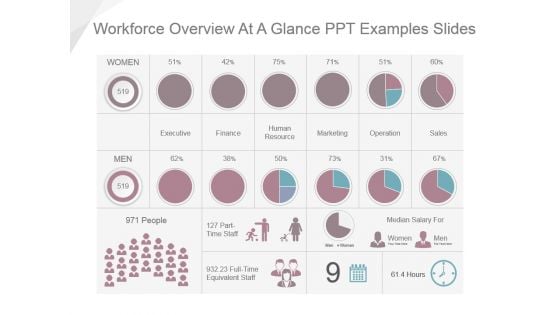
Workforce Overview At A Glance Ppt Examples Slides
This is a workforce overview at a glance ppt examples slides. This is a seven stage process. The stages in this process are executive, finance, human resource, marketing, operation, sales, median salary for.
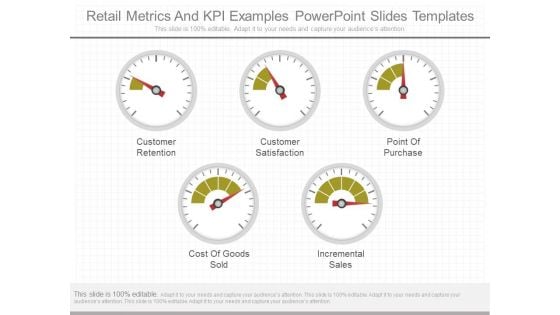
Retail Metrics And Kpi Examples Powerpoint Slides Templates
This is a retail metrics and kpi examples powerpoint slides templates. This is a five stage process. The stages in this process are customer retention, customer satisfaction, point of purchase, cost of goods sold, incremental sales.
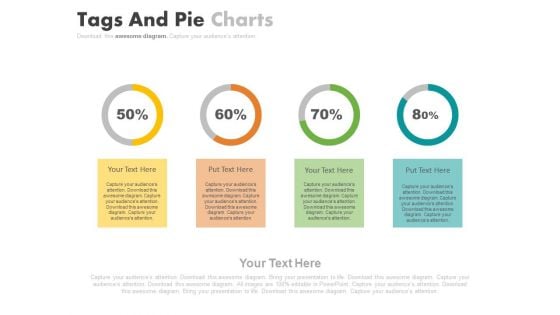
Four Steps For Financial Data Analysis Powerpoint Slides
This PowerPoint contains four circles with percentage values. Download this diagram slide to display financial data analysis. This template is editable, You can edit text, color, shade and style of this diagram as per you need.
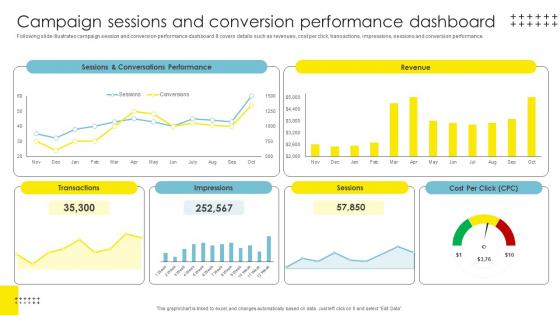
Campaign Sessions And Conversion Strategic Brand Management Template Pdf
Following slide illustrates campaign session and conversion performance dashboard. It covers details such as revenues, cost per click, transactions, impressions, sessions and conversion performance. Get a simple yet stunning designed Campaign Sessions And Conversion Strategic Brand Management Template Pdf. It is the best one to establish the tone in your meetings. It is an excellent way to make your presentations highly effective. So, download this PPT today from Slidegeeks and see the positive impacts. Our easy to edit Campaign Sessions And Conversion Strategic Brand Management Template Pdf can be your go to option for all upcoming conferences and meetings. So, what are you waiting for Grab this template today. Following slide illustrates campaign session and conversion performance dashboard. It covers details such as revenues, cost per click, transactions, impressions, sessions and conversion performance.
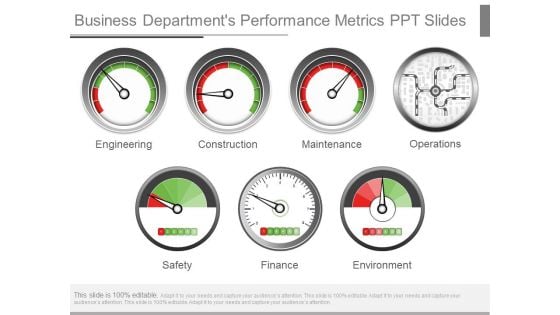
Business Departments Performance Metrics Ppt Slides
This is a business departments performance metrics ppt slides. This is a seven stage process. The stages in this process are engineering, construction, maintenance, operations, safety, finance, environment.
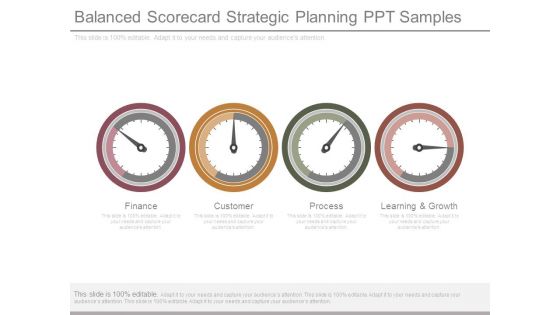
Balanced Scorecard Strategic Planning Ppt Samples
This is a balanced scorecard strategic planning ppt samples. This is a four stage process. The stages in this process are finance, customer, process, learning and growth.
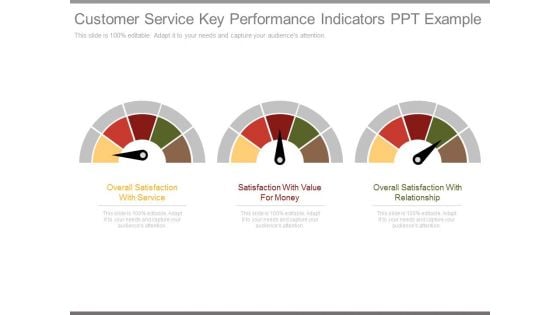
Customer Service Key Performance Indicators Ppt Example
This is a customer service key performance indicators ppt example. This is a three stage process. The stages in this process are overall satisfaction with service, satisfaction with value for money, overall satisfaction with relationship.
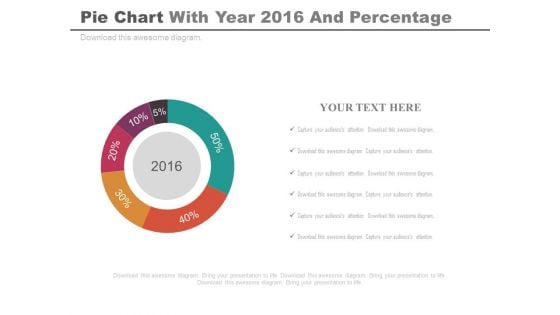
Pie Chart For Projected Profit Of 2016 Powerpoint Slides
Our above PPT slide displays graphics of Pie chart. This PowerPoint template may be used to display projected profit report of 2016. Download this template to leave permanent impression on your audience.
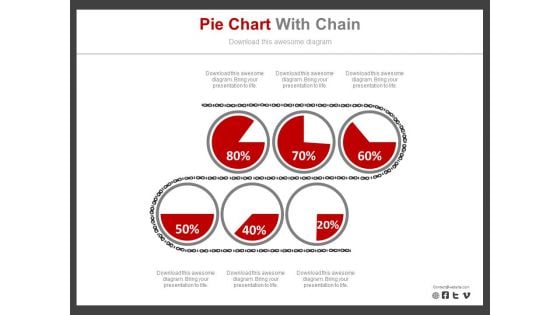
Six Pie Charts For Revenue Analysis Report Powerpoint Slides
Six pie charts have been displayed in this business slide. This business diagram helps to exhibit revenue analysis report. Download this PowerPoint template to build an exclusive presentation.
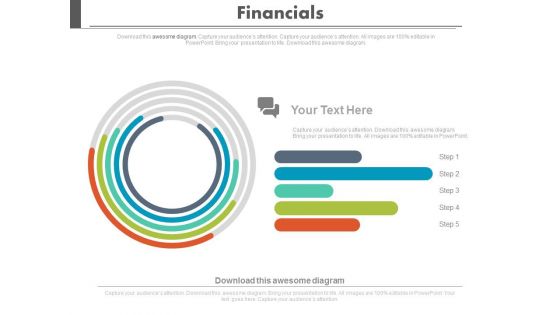
Financial Growth Analysis Circular Chart Powerpoint Slides
Visually support your presentation with our above template containing graphics of circular chart. This diagram slide helps to display financial growth analysis. Etch your views in the brains of your audience with this diagram slide.
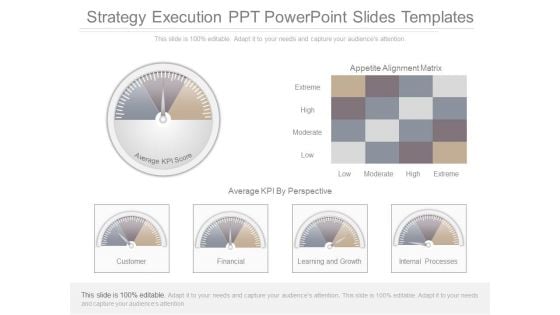
Strategy Execution Ppt Powerpoint Slides Templates
This is a strategy execution ppt powerpoint slides templates. This is a six stage process. The stages in this process are appetite alignment matrix, extreme, high, moderate, low, average kpi by prospective, customer, financial, learning and growth, internal processes, average kpi score.
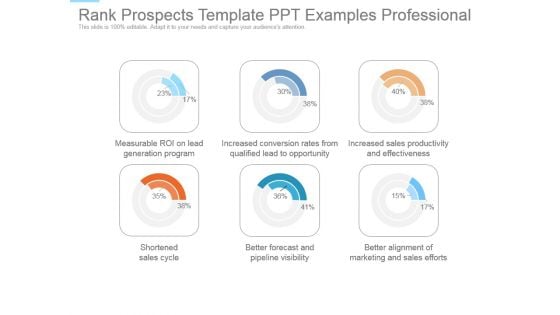
Rank Prospects Template Ppt Examples Professional
This is a rank prospects template ppt examples professional. This is a six stage process. The stages in this process are measurable roi on lead generation program, increased conversion rates from qualified lead to opportunity, increased sales productivity and effectiveness, shortened sales cycle, better forecast and pipeline visibility, better alignment of marketing and sales efforts.
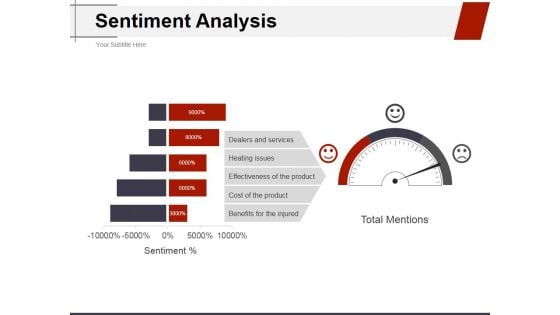
Sentiment Analysis Ppt PowerPoint Presentation Ideas Structure
This is a sentiment analysis ppt powerpoint presentation ideas structure. This is a three stage process. The stages in this process are dealers and services, heating issues, effectiveness of the product, cost of the product, benefits for the injured.
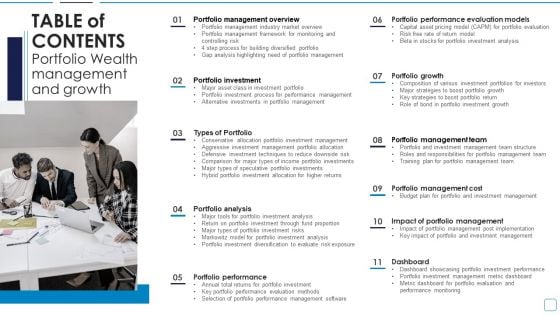
Table Of Contents Portfolio Wealth Management And Growth Structure PDF
Presenting Table Of Contents Portfolio Wealth Management And Growth Structure PDF to provide visual cues and insights. Share and navigate important information on eleven stages that need your due attention. This template can be used to pitch topics like Dashboard, Portfolio Growth, Portfolio Investment, Portfolio Analysis. In addtion, this PPT design contains high resolution images, graphics, etc, that are easily editable and available for immediate download.
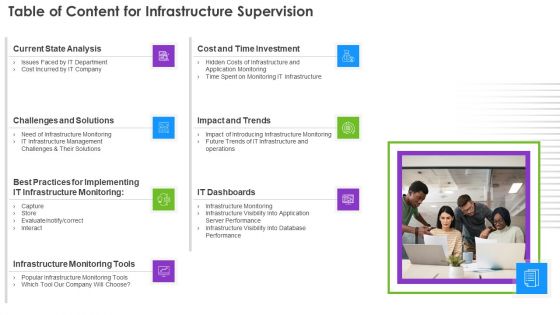
Table Of Content For Infrastructure Supervision Ppt PowerPoint Presentation File Ideas PDF
Presenting Table Of Content For Infrastructure Supervision Ppt PowerPoint Presentation File Ideas PDF to provide visual cues and insights. Share and navigate important information on seven stages that need your due attention. This template can be used to pitch topics like Current State Analysis, Cost And Time Investment, Challenges And Solutions, Infrastructure Monitoring Tools, IT Dashboards, Impact And Trends. In addtion, this PPT design contains high resolution images, graphics, etc, that are easily editable and available for immediate download.
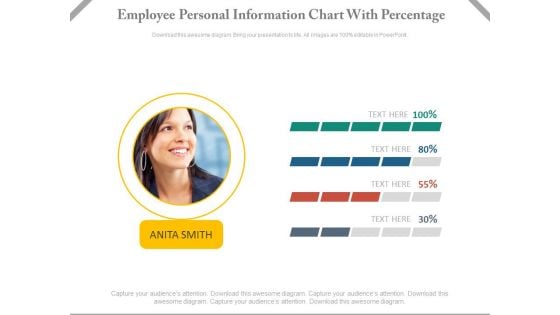
Employee Performance Information Chart Powerpoint Slides
This dashboard template contains employee picture with percentage slides. This dashboard PowerPoint template conveys employees performance in a visual manner. Download this PPT slide for quick decision-making.

Employee Photo With Percentage Bars Powerpoint Slides
This dashboard template contains employee photo with percentage bars. This dashboard PowerPoint template conveys employees performance in a visual manner. Download this PPT slide for quick decision-making.
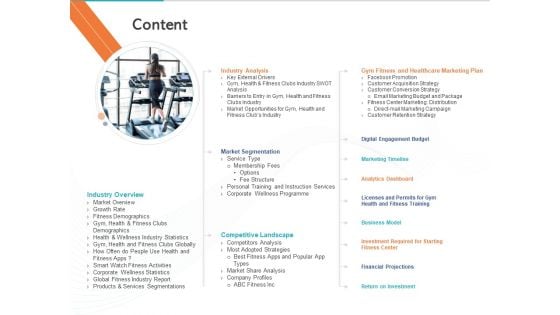
Gym Health And Fitness Market Industry Report Content Elements PDF
Presenting this set of slides with name gym health and fitness market industry report content elements pdf. The topics discussed in these slides are industry overview, competitive landscape, return on investment, market segmentation, industry analysis, digital engagement budget, marketing timeline, analytics dashboard, business model. This is a completely editable PowerPoint presentation and is available for immediate download. Download now and impress your audience.
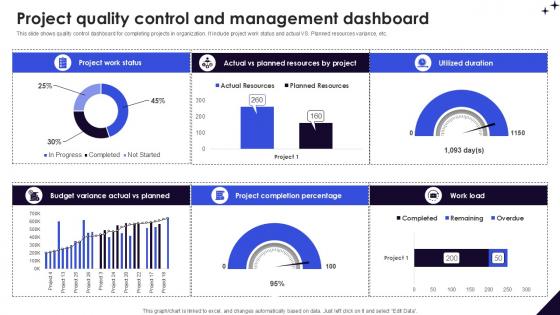
Project Quality Control And Management DMAIC Methodology To Maintain PPT Sample
This slide shows quality control dashboard for completing projects in organization. It include project work status and actual VS. Planned resources variance, etc. The Project Quality Control And Management DMAIC Methodology To Maintain PPT Sample is a compilation of the most recent design trends as a series of slides. It is suitable for any subject or industry presentation, containing attractive visuals and photo spots for businesses to clearly express their messages. This template contains a variety of slides for the user to input data, such as structures to contrast two elements, bullet points, and slides for written information. Slidegeeks is prepared to create an impression. This slide shows quality control dashboard for completing projects in organization. It include project work status and actual VS. Planned resources variance, etc.
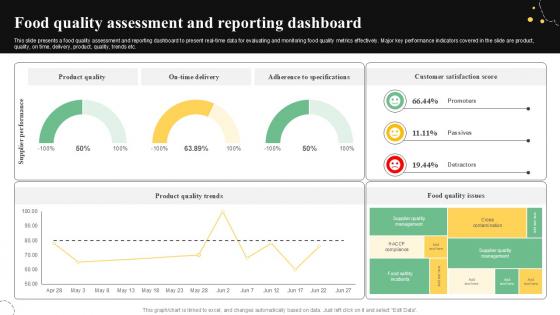
Food Quality Assessment And Reporting Quality Control Guide For Food PPT Sample
This slide presents a food quality assessment and reporting dashboard to present real-time data for evaluating and monitoring food quality metrics effectively. Major key performance indicators covered in the slide are product, quality, on time, delivery, product, quality, trends etc. Crafting an eye-catching presentation has never been more straightforward. Let your presentation shine with this tasteful yet straightforward Food Quality Assessment And Reporting Quality Control Guide For Food PPT Sample template. It offers a minimalistic and classy look that is great for making a statement. The colors have been employed intelligently to add a bit of playfulness while still remaining professional. Construct the ideal Food Quality Assessment And Reporting Quality Control Guide For Food PPT Sample that effortlessly grabs the attention of your audience Begin now and be certain to wow your customers This slide presents a food quality assessment and reporting dashboard to present real-time data for evaluating and monitoring food quality metrics effectively. Major key performance indicators covered in the slide are product, quality, on time, delivery, product, quality, trends etc.
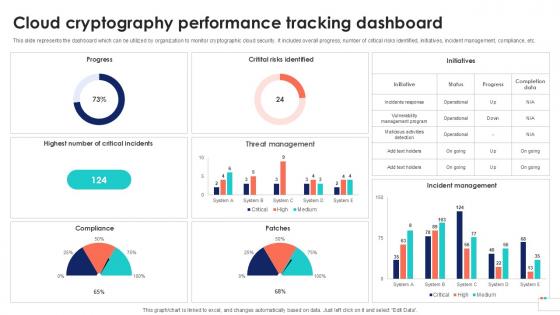
Cloud Cryptography Performance Data Security In Cloud Computing Ppt Presentation
This slide represents the dashboard which can be utilized by organization to monitor cryptographic cloud security. It includes overall progress, number of critical risks identified, initiatives, incident management, compliance, etc. If you are looking for a format to display your unique thoughts, then the professionally designed Cloud Cryptography Performance Data Security In Cloud Computing Ppt Presentation is the one for you. You can use it as a Google Slides template or a PowerPoint template. Incorporate impressive visuals, symbols, images, and other charts. Modify or reorganize the text boxes as you desire. Experiment with shade schemes and font pairings. Alter, share or cooperate with other people on your work. Download Cloud Cryptography Performance Data Security In Cloud Computing Ppt Presentation and find out how to give a successful presentation. Present a perfect display to your team and make your presentation unforgettable. This slide represents the dashboard which can be utilized by organization to monitor cryptographic cloud security. It includes overall progress, number of critical risks identified, initiatives, incident management, compliance, etc.
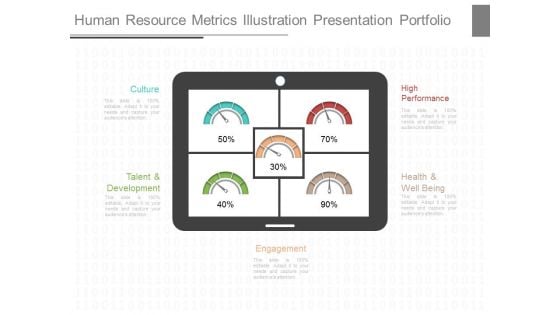
Human Resource Metrics Illustration Presentation Portfolio
This is a human resource metrics illustration presentation portfolio. This is a five stage process. The stages in this process are culture, high performance, talent and development, health and well being, engagement.
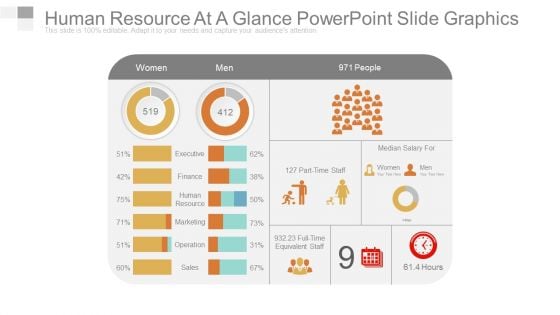
Human Resource At A Glance Powerpoint Slide Graphics
This is a human resource at a glance powerpoint slide graphics. This is a two stage process. The stages in this process are executive, finance, human, human resource, marketing, operation, sales.
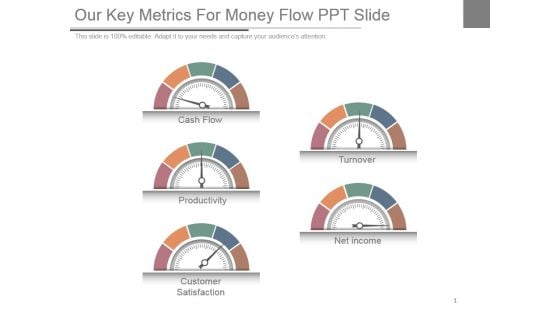
Our Key Metrics For Money Flow Ppt Slide
This is a our key metrics for money flow ppt slide. This is a five stage process. The stages in this process are cash flow, productivity, customer satisfaction, turnover, net income.
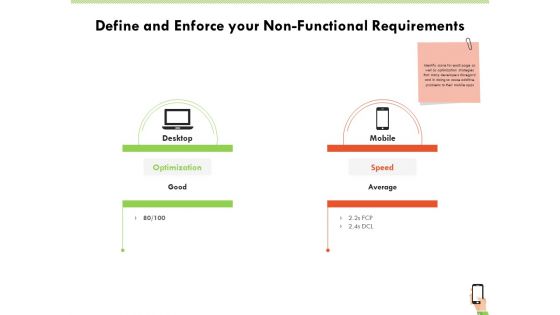
Multi Channel Online Commerce Define And Enforce Your Non Functional Requirements Summary PDF
This is a multi channel online commerce define and enforce your non functional requirements summary pdf template with various stages. Focus and dispense information on two stages using this creative set, that comes with editable features. It contains large content boxes to add your information on topics like mobile, desktop, speed, optimization, average. You can also showcase facts, figures, and other relevant content using this PPT layout. Grab it now.
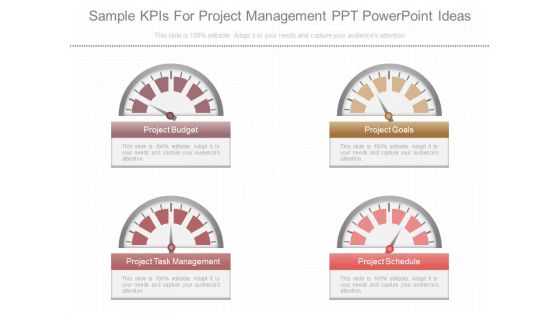
Sample Kpis For Project Management Ppt Powerpoint Ideas
This is a sample kpis for project management ppt powerpoint ideas. This is a four stage process. The stages in this process are project budget, project goals, project task management, project schedule.

Statistics Highlighting Positive Impact Of Glass Packaging Material
The slide showcases properties of glass packaging material that assist in preserving food quality and temperature in containers. The points are mechanical, thermal, optical properties.Find a pre-designed and impeccable Statistics Highlighting Positive Impact Of Glass Packaging Material. The templates can ace your presentation without additional effort. You can download these easy-to-edit presentation templates to make your presentation stand out from others. So, what are you waiting for Download the template from Slidegeeks today and give a unique touch to your presentation. The slide showcases properties of glass packaging material that assist in preserving food quality and temperature in containers. The points are mechanical, thermal, optical properties.

Statistics Highlighting Positive Impact Effective Strategies For Strengthening Food Ppt Presentation
The slide showcases properties of glass packaging material that assist in preserving food quality and temperature in containers. The points are mechanical, thermal, optical properties. Do you know about Slidesgeeks Statistics Highlighting Positive Impact Effective Strategies For Strengthening Food Ppt Presentation These are perfect for delivering any kind od presentation. Using it, create PowerPoint presentations that communicate your ideas and engage audiences. Save time and effort by using our pre-designed presentation templates that are perfect for a wide range of topic. Our vast selection of designs covers a range of styles, from creative to business, and are all highly customizable and easy to edit. Download as a PowerPoint template or use them as Google Slides themes. The slide showcases properties of glass packaging material that assist in preserving food quality and temperature in containers. The points are mechanical, thermal, optical properties.

Revenue Performance Reporting Speedometer Ppt PowerPoint Presentation Visuals
This is a revenue performance reporting speedometer ppt powerpoint presentation visuals. This is a four stage process. The stages in this process are speedometer, measurement, business, marketing, finance.
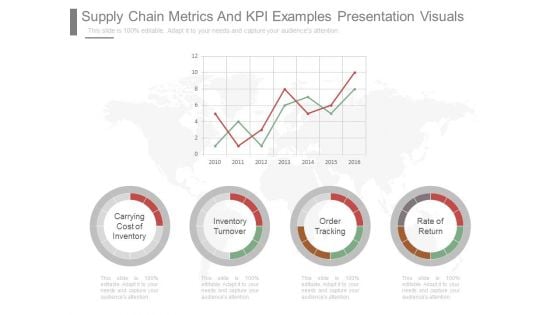
Supply Chain Metrics And Kpi Examples Presentation Visuals
This is a supply chain metrics and kpi examples presentation visuals. This is a four stage process. The stages in this process are carrying cost of inventory, inventory turnover, order tracking, rate of return.
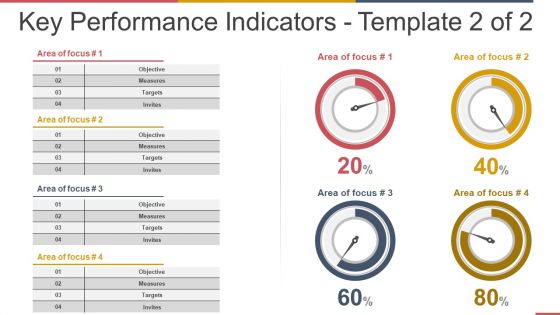
Key Performance Indicators Template 2 Ppt PowerPoint Presentation Ideas Background Images
This is a key performance indicators template 2 ppt powerpoint presentation ideas background images. This is a four stage process. The stages in this process are objective, measures, targets, invites.
Four Circles With Percentage Values And Icons Powerpoint Slides
This PowerPoint template displays info graphic diagram of linear circles. This diagram may be used to exhibit financial growth and analysis. Grab center stage with this slide and capture the attention of your audience.
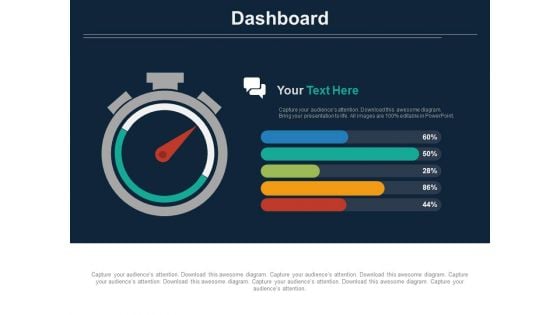
Stopwatch With Percentage Value Analysis Powerpoint Slides
The above template displays a diagram of stopwatch with percentage value. This diagram has been professionally designed to emphasize on time management. Grab center stage with this slide and capture the attention of your audience.
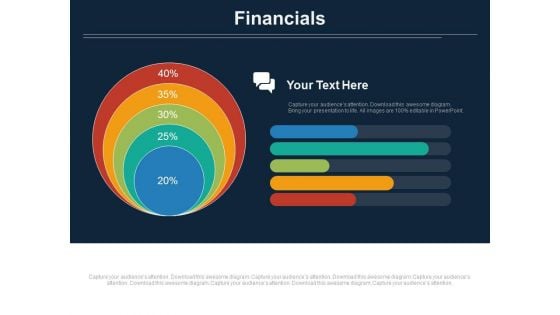
Concentric Chart With Five Financial Steps Powerpoint Slides
This PowerPoint slide contains diagram of concentric chart with five financial steps This professional slide helps to exhibit financial planning for business. Use this PowerPoint template to make impressive presentations.
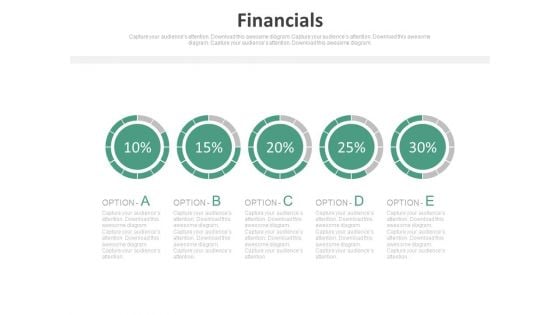
Pie Charts For Percentage Value Analysis Powerpoint Slides
Our above PPT slide displays graphics of Pie charts. This PowerPoint template may be used to display percentage value analysis. Download this template to leave permanent impression on your audience.
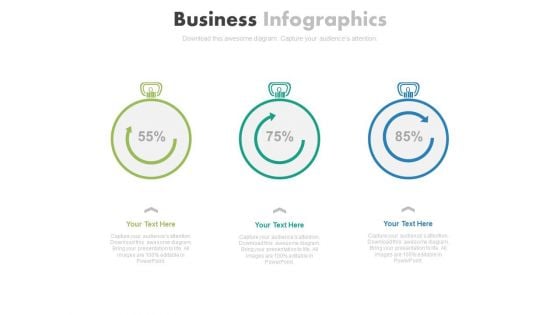
Three Stopwatches For Percentage Growth Powerpoint Slides
Three stopwatches have been displayed in this business slide. This business diagram helps to exhibit parameters of growth and development. Download this PowerPoint template to build an exclusive presentation.
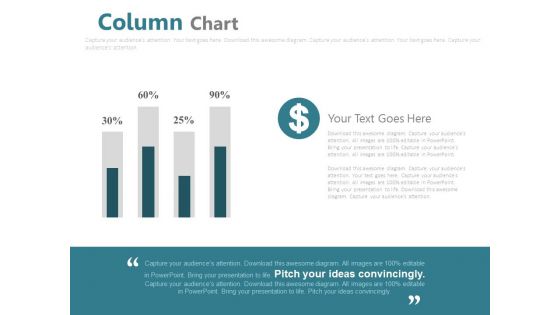
Column Chart For Financial Analysis Powerpoint Slides
This PowerPoint template has been designed with graphics of column chart with percentage values. You may use this business slide design for topics like financial analysis and planning. This PPT slide is powerful tool to describe your ideas.
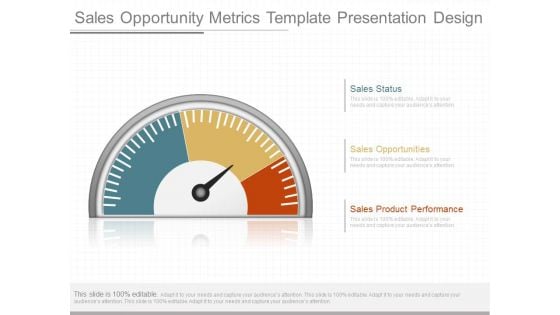
Sales Opportunity Metrics Template Presentation Design
This is a sales opportunity metrics template presentation design. This is a three stage process. The stages in this process are sales status, sales opportunities, sales product performance.
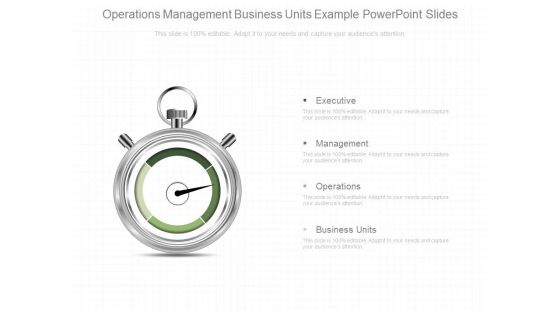
Operations Management Business Units Example Powerpoint Slides
This is a operations management business units example powerpoint slides. This is a four stage process. The stages in this process are executive, management, operations, business units.
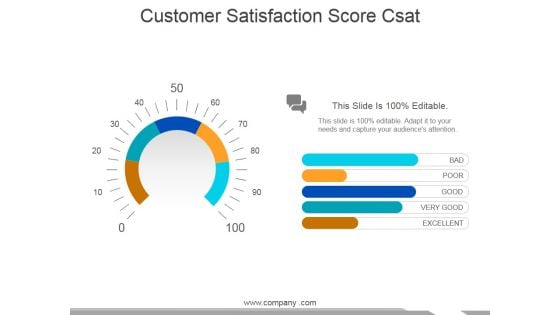
Customer Satisfaction Score Csat Ppt PowerPoint Presentation Inspiration Aids
This is a customer satisfaction score csat ppt powerpoint presentation inspiration aids. This is a five stage process. The stages in this process are bad, poor, good, very good, excellent.
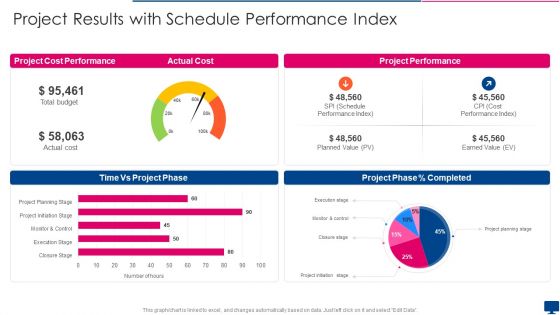
Project Results With Schedule Performance Index Formats PDF
Pitch your topic with ease and precision using this project results with schedule performance index formats pdf. This layout presents information on time, actual cost, project performance. It is also available for immediate download and adjustment. So, changes can be made in the color, design, graphics or any other component to create a unique layout.
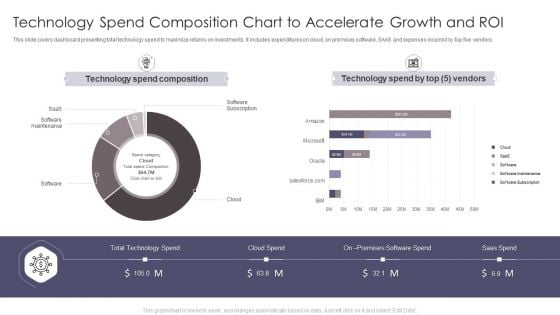
Technology Spend Composition Chart To Accelerate Growth And Roi Summary PDF
This slide covers dashboard presenting total technology spend to maximize returns on investments. It includes expenditures on cloud, on premises software, SAAS and expenses incurred by top five vendors. Pitch your topic with ease and precision using this Technology Spend Composition Chart To Accelerate Growth And Roi Summary PDF. This layout presents information on Technology Spend Composition, Technology Spend. It is also available for immediate download and adjustment. So, changes can be made in the color, design, graphics or any other component to create a unique layout.
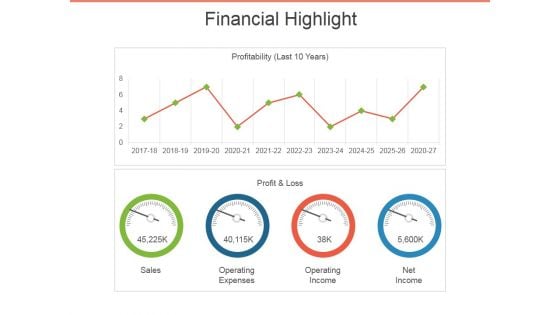
Financial Highlight Template 2 Ppt PowerPoint Presentation Outline Visuals
This is a financial highlight template 2 ppt powerpoint presentation outline visuals. This is a two stage process. The stages in this process are sales, profit and loss, operating expenses, operating income, net income.

Credit Score Meter Ppt PowerPoint Presentation Complete Deck With Slides
If designing a presentation takes a lot of your time and resources and you are looking for a better alternative, then this Credit Score Meter Ppt PowerPoint Presentation Complete Deck With Slides is the right fit for you. This is a prefabricated set that can help you deliver a great presentation on the topic. All the ten slides included in this sample template can be used to present a birds-eye view of the topic. These slides are also fully editable, giving you enough freedom to add specific details to make this layout more suited to your business setting. Apart from the content, all other elements like color, design, theme are also replaceable and editable. This helps in designing a variety of presentations with a single layout. Not only this, you can use this PPT design in formats like PDF, PNG, and JPG once downloaded. Therefore, without any further ado, download and utilize this sample presentation as per your liking.
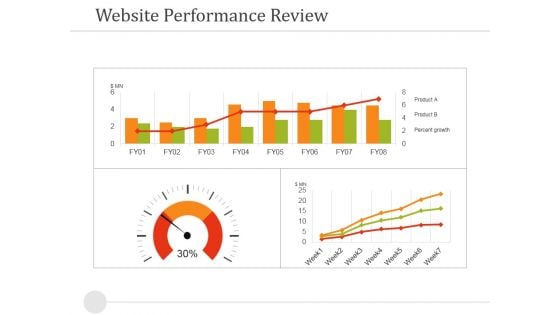
Website Performance Review Template 1 Ppt PowerPoint Presentation Portfolio Guide
This is a website performance review template 1 ppt powerpoint presentation portfolio guide. This is a four stage process. The stages in this process are website performance review, dashboard, business, marketing, finance.
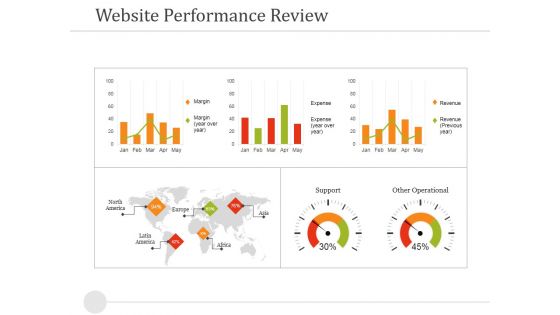
Website Performance Review Template 2 Ppt PowerPoint Presentation Gallery Objects
This is a website performance review template 2 ppt powerpoint presentation gallery objects. This is a three stage process. The stages in this process are margin, revenue, expense, support, other operational.
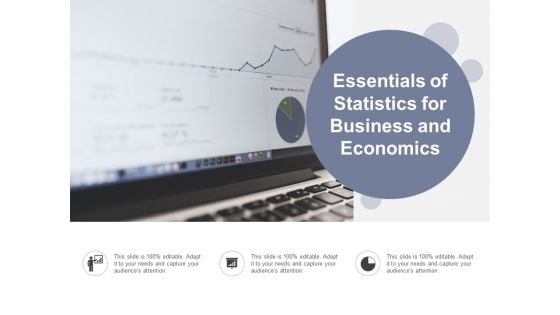
Essentials Of Statistics For Business And Economics Ppt Powerpoint Presentation Pictures Styles
This is a essentials of statistics for business and economics ppt powerpoint presentation pictures styles. This is a three stage process. The stages in this process are business metrics, business kpi, business dashboard.


 Continue with Email

 Home
Home


