Investment Portfolio Dashboard

Internet Security Kpis And Metrics Ppt PowerPoint Presentation Gallery Outline PDF
Showcasing this set of slides titled internet security kpis and metrics ppt powerpoint presentation gallery outline pdf. The topics addressed in these templates are threat detection, risk and compliance, services compliance. All the content presented in this PPT design is completely editable. Download it and make adjustments in color, background, font etc. as per your unique business setting.
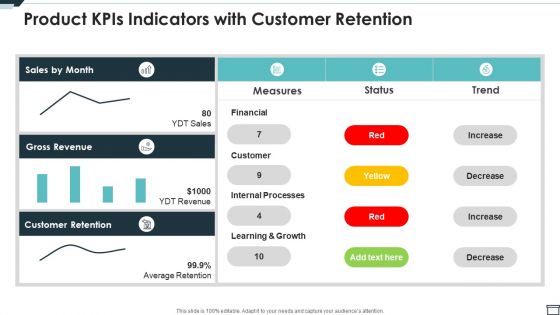
Product Kpis Indicators With Customer Retention Ppt PowerPoint Presentation File Examples PDF
Showcasing this set of slides titled product kpis indicators with customer retention ppt powerpoint presentation file examples pdf. The topics addressed in these templates are customer, financial, measures. All the content presented in this PPT design is completely editable. Download it and make adjustments in color, background, font etc. as per your unique business setting.
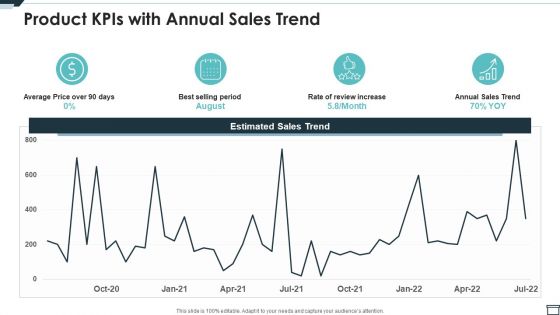
Product Kpis With Annual Sales Trend Ppt PowerPoint Presentation File Example PDF
Showcasing this set of slides titled product kpis with annual sales trend ppt powerpoint presentation file example pdf. The topics addressed in these templates are average price, sales, rate. All the content presented in this PPT design is completely editable. Download it and make adjustments in color, background, font etc. as per your unique business setting.
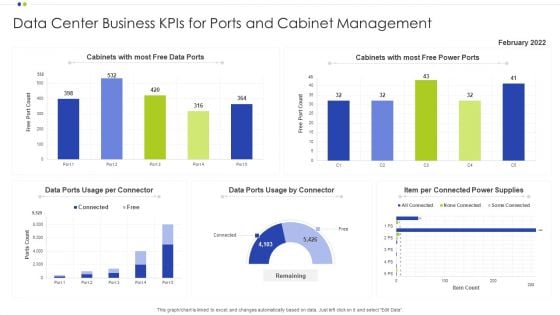
Data Center Business Kpis For Ports And Cabinet Management Ppt Diagram Ppt PDF
Showcasing this set of slides titled Data Center Business Kpis For Ports And Cabinet Management Ppt Diagram Ppt PDF. The topics addressed in these templates are Cabinet Management, Data Center Business, Power Supplies. All the content presented in this PPT design is completely editable. Download it and make adjustments in color, background, font etc. as per your unique business setting.
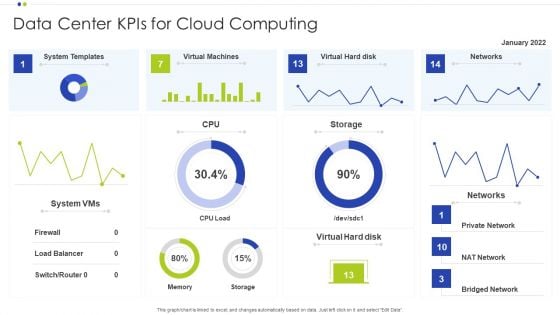
Data Center Kpis For Cloud Computing Ppt Slides Visual Aids PDF
Pitch your topic with ease and precision using this Data Center Kpis For Cloud Computing Ppt Slides Visual Aids PDF. This layout presents information on System Templates, Networks, Data Center. It is also available for immediate download and adjustment. So, changes can be made in the color, design, graphics or any other component to create a unique layout.
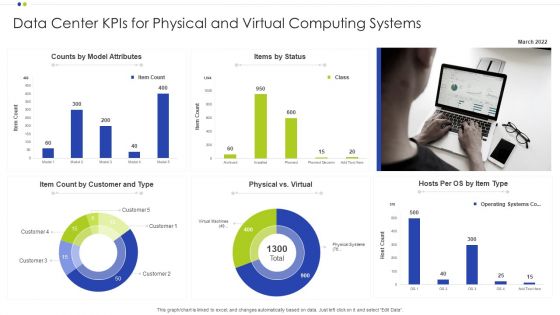
Data Center Kpis For Physical And Virtual Computing Systems Ppt Infographic Template Pictures PDF
Showcasing this set of slides titled Data Center Kpis For Physical And Virtual Computing Systems Ppt Infographic Template Pictures PDF. The topics addressed in these templates are Operating Systems, Computing Systems, Data Center. All the content presented in this PPT design is completely editable. Download it and make adjustments in color, background, font etc. as per your unique business setting.
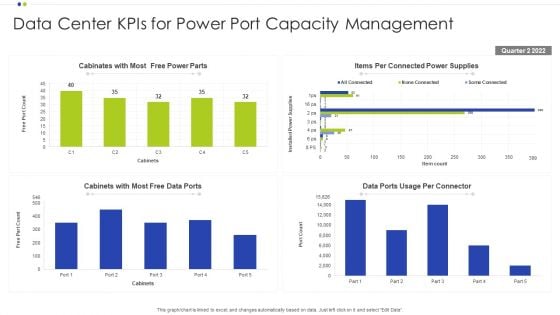
Data Center Kpis For Power Port Capacity Management Ppt File Slide Download PDF
Pitch your topic with ease and precision using this Data Center Kpis For Power Port Capacity Management Ppt File Slide Download PDF. This layout presents information on Capacity Management, Data Center, Connected Power Supplies. It is also available for immediate download and adjustment. So, changes can be made in the color, design, graphics or any other component to create a unique layout.
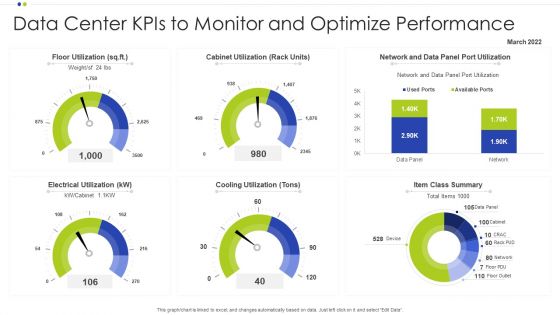
Data Center Kpis To Monitor And Optimize Performance Ppt Inspiration Examples PDF
Pitch your topic with ease and precision using this Data Center Kpis To Monitor And Optimize Performance Ppt Inspiration Examples PDF. This layout presents information on Data Center, Optimize Performance, Network And Data. It is also available for immediate download and adjustment. So, changes can be made in the color, design, graphics or any other component to create a unique layout.
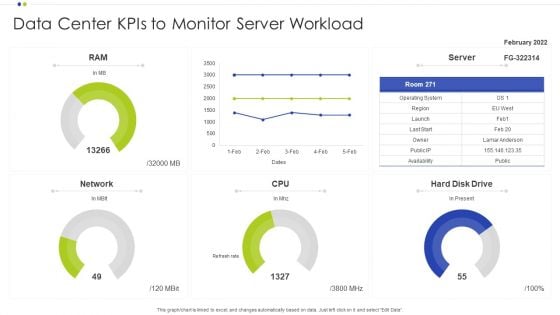
Data Center Kpis To Monitor Server Workload Ppt Gallery Portrait PDF
Showcasing this set of slides titled Data Center Kpis To Monitor Server Workload Ppt Gallery Portrait PDF. The topics addressed in these templates are Operating System, Data Center, Monitor Server Workload. All the content presented in this PPT design is completely editable. Download it and make adjustments in color, background, font etc. as per your unique business setting.
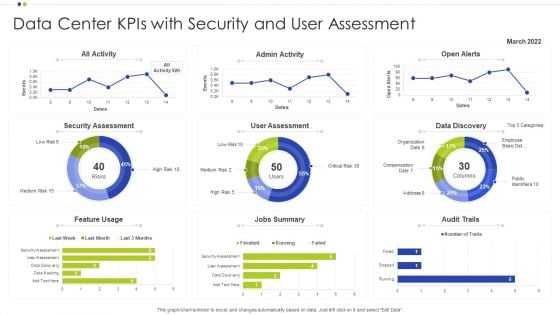
Data Center Kpis With Security And User Assessment Ppt Infographics Deck PDF
Showcasing this set of slides titled Data Center Kpis With Security And User Assessment Ppt Infographics Deck PDF. The topics addressed in these templates are Data Center, Data Discovery, Security Assessment. All the content presented in this PPT design is completely editable. Download it and make adjustments in color, background, font etc. as per your unique business setting.
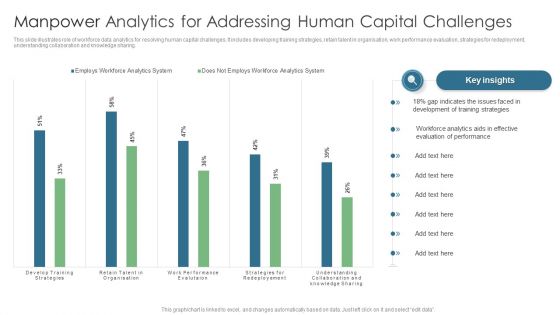
Manpower Analytics For Addressing Human Capital Challenges Diagrams PDF
This slide illustrates role of workforce data analytics for resolving human capital challenges. It includes developing training strategies, retain talent in organisation, work performance evaluation, strategies for redeployment, understanding collaboration and knowledge sharing. Showcasing this set of slides titled Manpower Analytics For Addressing Human Capital Challenges Diagrams PDF. The topics addressed in these templates are Gap Indicates, Training Strategies, Evaluation Performance. All the content presented in this PPT design is completely editable. Download it and make adjustments in color, background, font etc. as per your unique business setting.
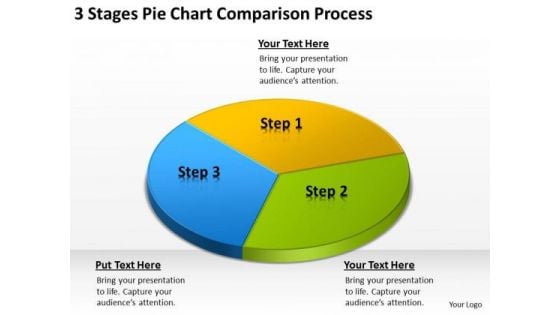
3 Stages Pie Chart Comparison Process Examples Of Business Plan PowerPoint Templates
We present our 3 stages pie chart comparison process examples of business plan PowerPoint templates.Download and present our Circle Charts PowerPoint Templates because It is Aesthetically crafted by artistic young minds. Our PowerPoint Templates and Slides are designed to display your dexterity. Present our Flow Charts PowerPoint Templates because Our PowerPoint Templates and Slides will provide weight to your words. They will bring out the depth of your thought process. Use our Process and Flows PowerPoint Templates because you can Add colour to your speech with our PowerPoint Templates and Slides. Your presentation will leave your audience speechless. Present our Business PowerPoint Templates because our PowerPoint Templates and Slides will give your ideas the shape. Download our Marketing PowerPoint Templates because Our PowerPoint Templates and Slides will let you Hit the right notes. Watch your audience start singing to your tune.Use these PowerPoint slides for presentations relating to Abstract, banking, blank, business, chart, circle, company, concept, control, corporate, data, diagram, display, element, environment,finance, financial, graph, graphic, icon, illustration, information, isolated, isometric, management, market, marketing, modern, motion, movement,organization, perspective, pie, presentation, report, ring, sales, sheet, sign, slice, stock, symbol, three, text. The prominent colors used in the PowerPoint template are Yellow, Blue light, Green lime. Power the people with your thoughts. Give them the force with our 3 Stages Pie Chart Comparison Process Examples Of Business Plan PowerPoint Templates.
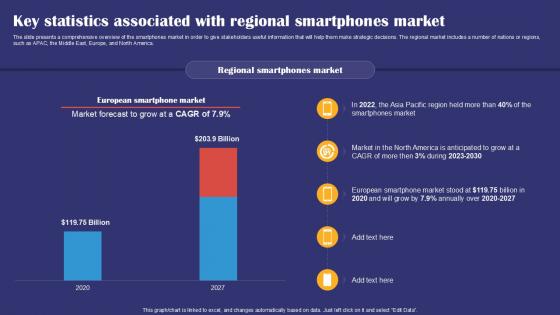
Key Statistics Associated With Regional Smartphones Market Smartphones Industry Report PPT Template IR SS V
The slide presents a comprehensive overview of the smartphones market in order to give stakeholders useful information that will help them make strategic decisions. The regional market includes a number of nations or regions, such as APAC, the Middle East, Europe, and North America. Welcome to our selection of the Key Statistics Associated With Regional Smartphones Market Smartphones Industry Report PPT Template IR SS V. These are designed to help you showcase your creativity and bring your sphere to life. Planning and Innovation are essential for any business that is just starting out. This collection contains the designs that you need for your everyday presentations. All of our PowerPoints are 100Percent editable, so you can customize them to suit your needs. This multi purpose template can be used in various situations. Grab these presentation templates today. The slide presents a comprehensive overview of the smartphones market in order to give stakeholders useful information that will help them make strategic decisions. The regional market includes a number of nations or regions, such as APAC, the Middle East, Europe, and North America.
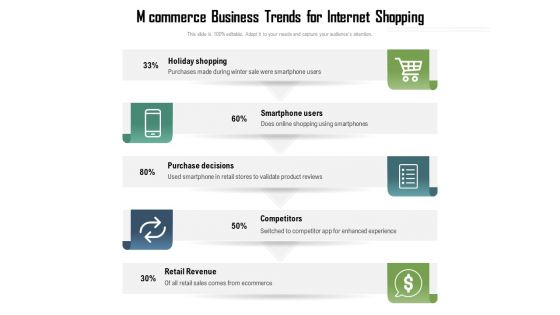
Mcommerce Business Trends For Internet Shopping Ppt PowerPoint Presentation Model Gallery PDF
Presenting this set of slides with name mcommerce business trends for internet shopping ppt powerpoint presentation model gallery pdf. This is a five stage process. The stages in this process are holiday shopping, smartphone users, purchase decisions, competitors, retail revenue. This is a completely editable PowerPoint presentation and is available for immediate download. Download now and impress your audience.
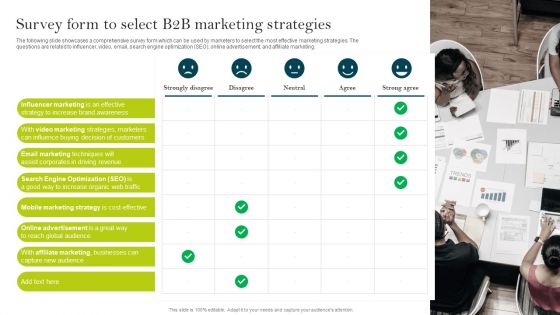
Survey Form To Select B2B Marketing Strategies Ppt PowerPoint Presentation File Example File PDF
The following slide showcases a comprehensive survey form which can be used by marketers to select the most effective marketing strategies. The questions are related to influencer, video, email, search engine optimization SEO, online advertisement, and affiliate marketing. The Survey Form To Select B2B Marketing Strategies Ppt PowerPoint Presentation File Example File PDF is a compilation of the most recent design trends as a series of slides. It is suitable for any subject or industry presentation, containing attractive visuals and photo spots for businesses to clearly express their messages. This template contains a variety of slides for the user to input data, such as structures to contrast two elements, bullet points, and slides for written information. Slidegeeks is prepared to create an impression.
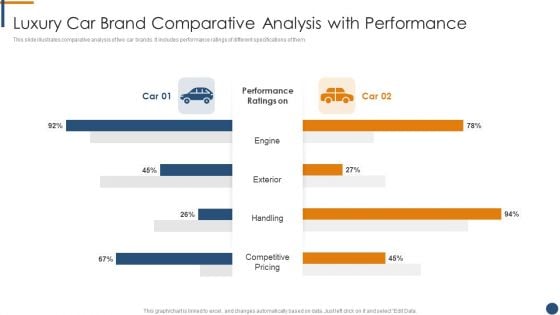
Luxury Car Brand Comparative Analysis With Performance Infographics PDF
This slide illustrates comparative analysis of two car brands. It includes performance ratings of different specifications of them.Showcasing this set of slides titled Luxury Car Brand Comparative Analysis With Performance Infographics PDF. The topics addressed in these templates are Competitive Pricing, Exterior, Engine. All the content presented in this PPT design is completely editable. Download it and make adjustments in color, background, font etc. as per your unique business setting.
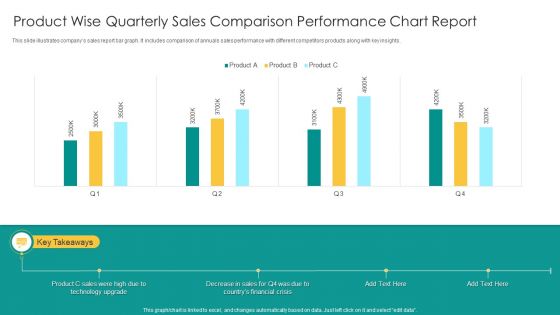
Product Wise Quarterly Sales Comparison Performance Chart Report Infographics PDF
This slide illustrates companys sales report bar graph. It includes comparison of annuals sales performance with different competitors products along with key insights. Showcasing this set of slides titled Product Wise Quarterly Sales Comparison Performance Chart Report Infographics PDF. The topics addressed in these templates are Product C Sales, Technology Upgrade, Financial Crisis. All the content presented in this PPT design is completely editable. Download it and make adjustments in color, background, font etc. as per your unique business setting.
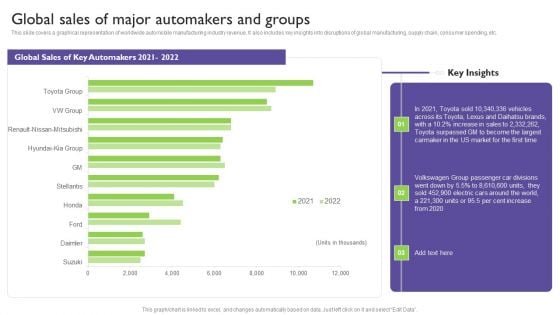
Global Automotive Industry Analysis Global Sales Of Major Automakers And Groups Pictures PDF
This slide covers a graphical representation of worldwide automobile manufacturing industry revenue. It also includes key insights into disruptions of global manufacturing, supply chain, consumer spending, etc. The Global Automotive Industry Analysis Global Sales Of Major Automakers And Groups Pictures PDF is a compilation of the most recent design trends as a series of slides. It is suitable for any subject or industry presentation, containing attractive visuals and photo spots for businesses to clearly express their messages. This template contains a variety of slides for the user to input data, such as structures to contrast two elements, bullet points, and slides for written information. Slidegeeks is prepared to create an impression.
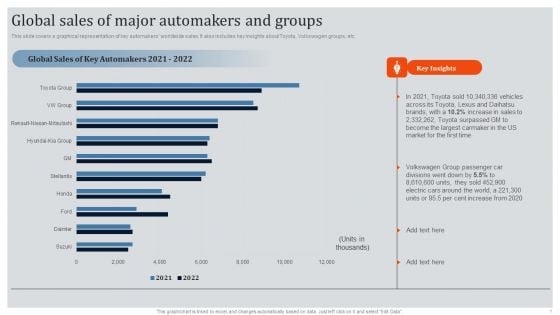
Global Automotive Industry Research And Analysis Global Sales Of Major Automakers And Groups Infographics PDF
This slide covers a graphical representation of key automakers worldwide sales. It also includes key insights about Toyota, Volkswagen groups, etc. The Global Automotive Industry Research And Analysis Global Sales Of Major Automakers And Groups Infographics PDF is a compilation of the most recent design trends as a series of slides. It is suitable for any subject or industry presentation, containing attractive visuals and photo spots for businesses to clearly express their messages. This template contains a variety of slides for the user to input data, such as structures to contrast two elements, bullet points, and slides for written information. Slidegeeks is prepared to create an impression.
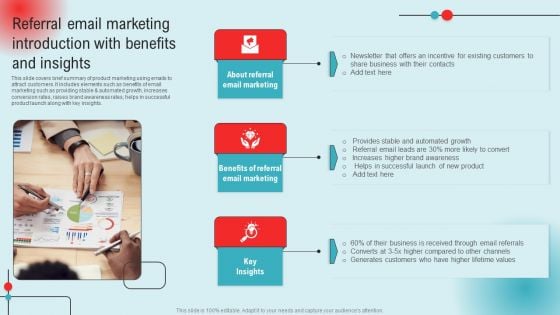
Referral Email Marketing Introduction With Benefits And Insights Ppt PowerPoint Presentation Diagram Images PDF
This slide covers brief summary of product marketing using emails to attract customers. It includes elements such as benefits of email marketing such as providing stable and automated growth, increases conversion rates, raises brand awareness rates, helps in successful product launch along with key insights. The Referral Email Marketing Introduction With Benefits And Insights Ppt PowerPoint Presentation Diagram Images PDF is a compilation of the most recent design trends as a series of slides. It is suitable for any subject or industry presentation, containing attractive visuals and photo spots for businesses to clearly express their messages. This template contains a variety of slides for the user to input data, such as structures to contrast two elements, bullet points, and slides for written information. Slidegeeks is prepared to create an impression.

Solution To Overcome Challenges Of Workplace Diversity Data Collection Portrait PDF
Following slide demonstrates challenges faced while diversity data collection with respective solution which can be used by businesses to increase organization profits. It includes challenges such as data selection, data collection training, data protection and cost allocation. Showcasing this set of slides titled Solution To Overcome Challenges Of Workplace Diversity Data Collection Portrait PDF. The topics addressed in these templates are Collected Data Protection, Cost Allocation, Data Collection Training. All the content presented in this PPT design is completely editable. Download it and make adjustments in color, background, font etc. as per your unique business setting.
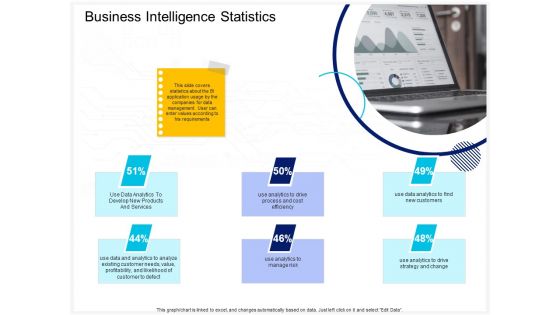
Enterprise Problem Solving And Intellect Business Intelligence Statistics Ppt PowerPoint Presentation Pictures Designs PDF
Presenting this set of slides with name enterprise problem solving and intellect business intelligence statistics ppt powerpoint presentation pictures designs pdf. This is a six stage process. The stages in this process are data analytics, drive process, cost efficiency, product service, new customers, manage risk, drive strategy and change. This is a completely editable PowerPoint presentation and is available for immediate download. Download now and impress your audience.
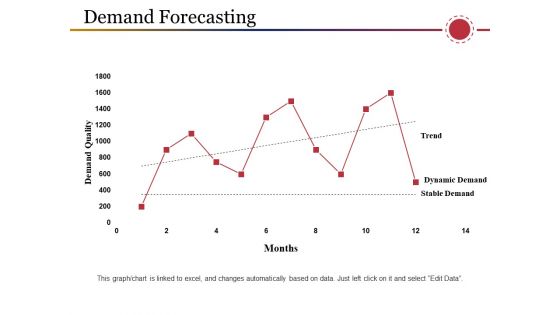
Demand Forecasting Ppt PowerPoint Presentation Outline Model
This is a demand forecasting ppt powerpoint presentation outline model. This is a one stage process. The stages in this process are demand quality, dynamic demand, stable demand, trend, finance.
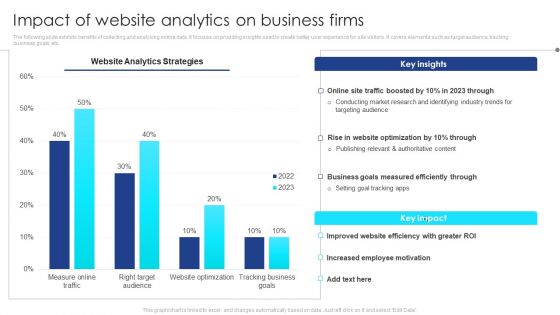
Impact Of Website Analytics On Business Firms Ideas PDF
The following slide exhibits benefits of collecting and analysing online data. It focuses on providing insights used to create better user experience for site visitors. It covers elements such as target audience, tracking business goals, etc. Showcasing this set of slides titled Impact Of Website Analytics On Business Firms Ideas PDF. The topics addressed in these templates are Business Goals, Employee Motivation, Website Efficiency, Website Optimization, Online Site Traffic. All the content presented in this PPT design is completely editable. Download it and make adjustments in color, background, font etc. as per your unique business setting.
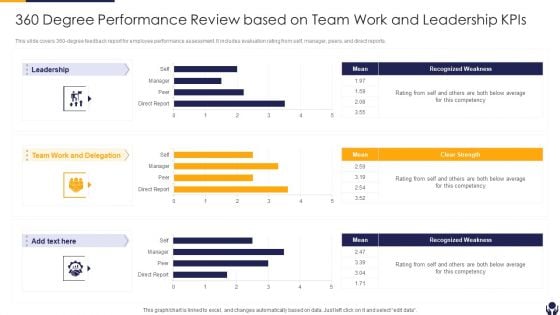
360 Degree Performance Review Based On Team Work And Leadership Kpis Guidelines PDF
This slide covers 360 degree feedback report for employee performance assessment. It includes evaluation rating from self, manager, peers, and direct reports. Pitch your topic with ease and precision using this 360 Degree Performance Review Based On Team Work And Leadership Kpis Guidelines PDF This layout presents information on Leadership, Recognized Weakness, Clear Strength It is also available for immediate download and adjustment. So, changes can be made in the color, design, graphics or any other component to create a unique layout.
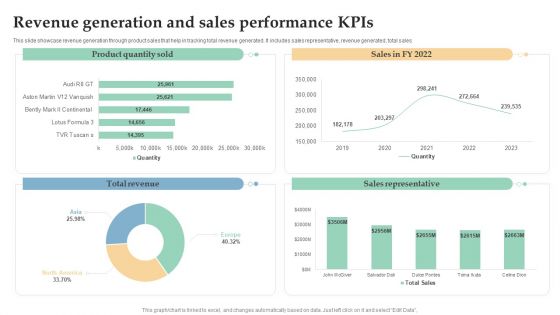
Revenue Generation And Sales Performance Kpis Ppt Inspiration Background Image PDF
This slide showcase revenue generation through product sales that help in tracking total revenue generated. It includes sales representative, revenue generated, total sales. Pitch your topic with ease and precision using this Revenue Generation And Sales Performance Kpis Ppt Inspiration Background Image PDF. This layout presents information on Total Revenue, Sales Representative, Product Quantity Sold. It is also available for immediate download and adjustment. So, changes can be made in the color, design, graphics or any other component to create a unique layout.
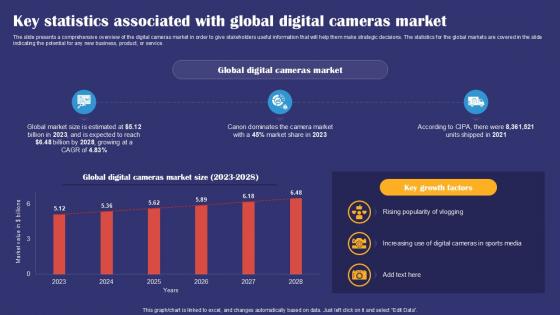
Key Statistics Associated With Global Digital Cameras Market Smartphones Industry Report PPT Template IR SS V
The slide presents a comprehensive overview of the digital cameras market in order to give stakeholders useful information that will help them make strategic decisions. The statistics for the global markets are covered in the slide indicating the potential for any new business, product, or service. If your project calls for a presentation, then Slidegeeks is your go to partner because we have professionally designed, easy to edit templates that are perfect for any presentation. After downloading, you can easily edit Key Statistics Associated With Global Digital Cameras Market Smartphones Industry Report PPT Template IR SS V and make the changes accordingly. You can rearrange slides or fill them with different images. Check out all the handy templates The slide presents a comprehensive overview of the digital cameras market in order to give stakeholders useful information that will help them make strategic decisions. The statistics for the global markets are covered in the slide indicating the potential for any new business, product, or service.
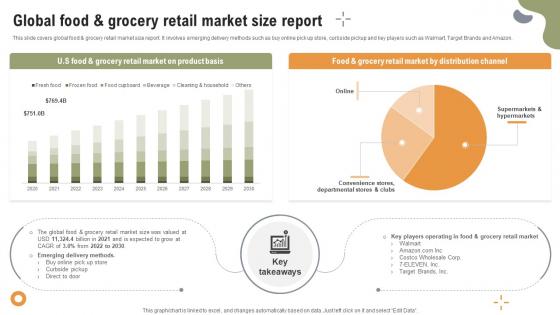
Implementing Strategies To Enhance Global Food And Grocery Retail Market Size Report
This slide covers global food and grocery retail market size report. It involves emerging delivery methods such as buy online pick up store, curbside pickup and key players such as Walmart, Target Brands and Amazon. If your project calls for a presentation, then Slidegeeks is your go-to partner because we have professionally designed, easy-to-edit templates that are perfect for any presentation. After downloading, you can easily edit Implementing Strategies To Enhance Global Food And Grocery Retail Market Size Report and make the changes accordingly. You can rearrange slides or fill them with different images. Check out all the handy templates This slide covers global food and grocery retail market size report. It involves emerging delivery methods such as buy online pick up store, curbside pickup and key players such as Walmart, Target Brands and Amazon.

Web 3 0 Blockchain Based P2E Mobile Game Sector Report Promotional Plan Play To Earn Gaming Industry Market Overview Guidelines PDF
Purpose of the following slide is to provide an overview of the P2E gaming industry. It highlights essential elements such as market size, forecasted market size, CAGR and trends which have shaped the industry. Formulating a presentation can take up a lot of effort and time, so the content and message should always be the primary focus. The visuals of the PowerPoint can enhance the presenters message, so our Web 3 0 Blockchain Based P2E Mobile Game Sector Report Promotional Plan Play To Earn Gaming Industry Market Overview Guidelines PDF was created to help save time. Instead of worrying about the design, the presenter can concentrate on the message while our designers work on creating the ideal templates for whatever situation is needed. Slidegeeks has experts for everything from amazing designs to valuable content, we have put everything into Web 3 0 Blockchain Based P2E Mobile Game Sector Report Promotional Plan Play To Earn Gaming Industry Market Overview Guidelines PDF
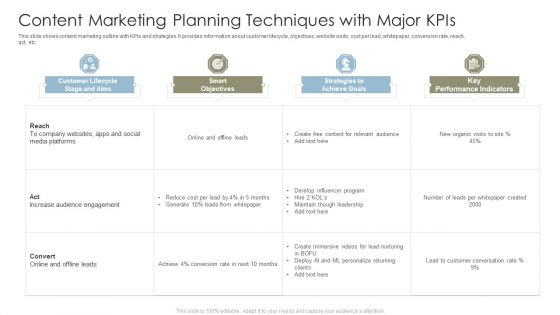
Content Marketing Planning Techniques With Major Kpis Background PDF
This slide shows content marketing outline with KPIs and strategies. It provides information about customer lifecycle, objectives, website visits, cost per lead, whitepaper, conversion rate, reach, act, etc. Showcasing this set of slides titled Content Marketing Planning Techniques With Major Kpis Background PDF. The topics addressed in these templates are Key Performance Indicators, Strategies To Achieve Goals, Smart Objectives. All the content presented in this PPT design is completely editable. Download it and make adjustments in color, background, font etc. as per your unique business setting.
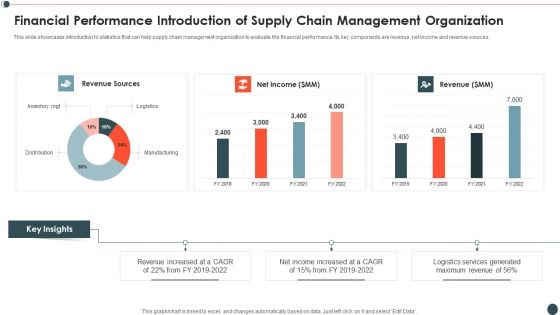
Financial Performance Introduction Of Supply Chain Management Organization Infographics PDF
This slide showcases introduction to statistics that can help supply chain management organization to evaluate the financial performance. Its key components are revenue, net income and revenue sources.Pitch your topic with ease and precision using this Financial Performance Introduction Of Supply Chain Management Organization Infographics PDF This layout presents information on Revenue Sources, Revenue Increased, Income Increased It is also available for immediate download and adjustment. So, changes can be made in the color, design, graphics or any other component to create a unique layout.
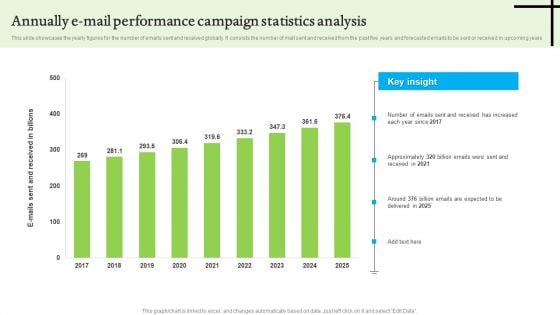
Annually E Mail Performance Campaign Statistics Analysis Infographics PDF
This slide showcases the yearly figures for the number of emails sent and received globally. It consists the number of mail sent and received from the past five years and forecasted emails to be sent or received in upcoming years. Showcasing this set of slides titled Annually E Mail Performance Campaign Statistics Analysis Infographics PDF. The topics addressed in these templates are Annually E Mail Performance, Campaign Statistics Analysis. All the content presented in this PPT design is completely editable. Download it and make adjustments in color, background, font etc. as per your unique business setting.
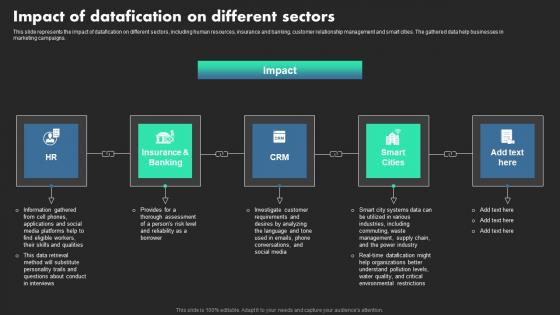
Impact Of Datafication On Different Sectors Ethical Dimensions Of Datafication Guidelines Pdf
This slide represents the impact of datafication on different sectors, including human resources, insurance and banking, customer relationship management and smart cities. The gathered data help businesses in marketing campaigns. The Impact Of Datafication On Different Sectors Ethical Dimensions Of Datafication Guidelines Pdf is a compilation of the most recent design trends as a series of slides. It is suitable for any subject or industry presentation, containing attractive visuals and photo spots for businesses to clearly express their messages. This template contains a variety of slides for the user to input data, such as structures to contrast two elements, bullet points, and slides for written information. Slidegeeks is prepared to create an impression. This slide represents the impact of datafication on different sectors, including human resources, insurance and banking, customer relationship management and smart cities. The gathered data help businesses in marketing campaigns.
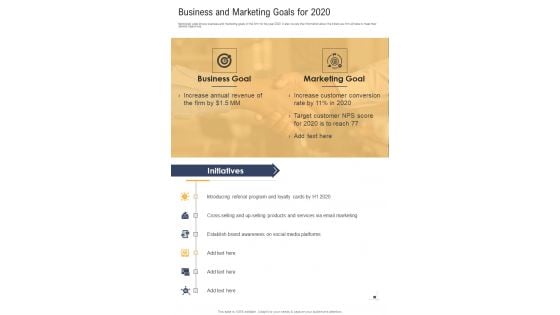
Business And Marketing Goals For 2020 One Pager Documents
Presenting you a fantastic Business And Marketing Goals For 2020 One Pager Documents. This piece is crafted on hours of research and professional design efforts to ensure you have the best resource. It is completely editable and its design allow you to rehash its elements to suit your needs. Get this Business And Marketing Goals For 2020 One Pager Documents A4 One-pager now.
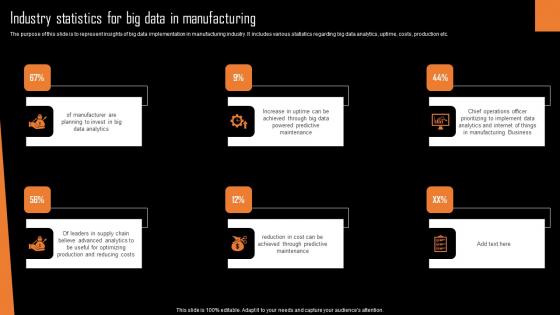
Industry Statistics For Big Data In Manufacturing Formats Pdf
The purpose of this slide is to represent insights of big data implementation in manufacturing industry. It includes various statistics regarding big data analytics, uptime, costs, production etc.Pitch your topic with ease and precision using this Industry Statistics For Big Data In Manufacturing Formats Pdf This layout presents information on Manufacturing Business, Prioritizing Implement Data, Chief Operations It is also available for immediate download and adjustment. So, changes can be made in the color, design, graphics or any other component to create a unique layout. The purpose of this slide is to represent insights of big data implementation in manufacturing industry. It includes various statistics regarding big data analytics, uptime, costs, production etc
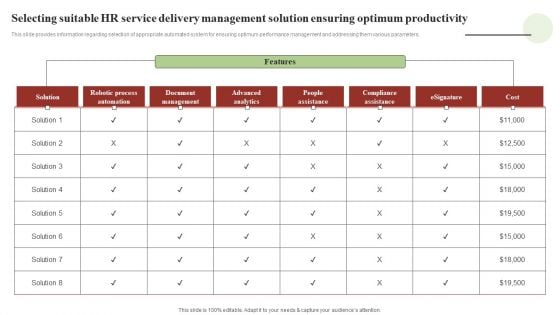
Transforming Human Resource Service Delivery Procedure Selecting Suitable HR Service Delivery Management Infographics PDF
This slide provides information regarding selection of appropriate automated system for ensuring optimum performance management and addressing them various parameters. Slidegeeks is here to make your presentations a breeze with Transforming Human Resource Service Delivery Procedure Selecting Suitable HR Service Delivery Management Infographics PDF With our easy to use and customizable templates, you can focus on delivering your ideas rather than worrying about formatting. With a variety of designs to choose from, you are sure to find one that suits your needs. And with animations and unique photos, illustrations, and fonts, you can make your presentation pop. So whether you are giving a sales pitch or presenting to the board, make sure to check out Slidegeeks first.
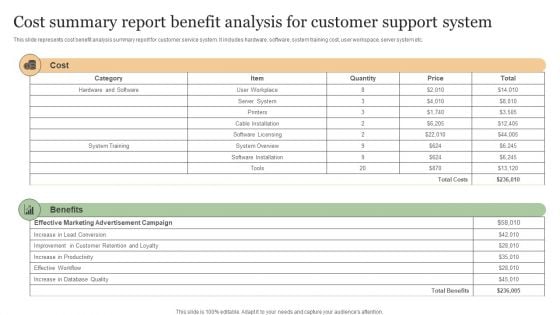
Cost Summary Report Benefit Analysis For Customer Support System Ideas PDF
This slide represents cost benefit analysis summary report for customer service system. It includes hardware, software, system training cost, user workspace, server system etc. Showcasing this set of slides titled Cost Summary Report Benefit Analysis For Customer Support System Ideas PDF. The topics addressed in these templates are Effective Marketing, Advertisement Campaign, Increase In Productivity. All the content presented in this PPT design is completely editable. Download it and make adjustments in color, background, font etc. as per your unique business setting.
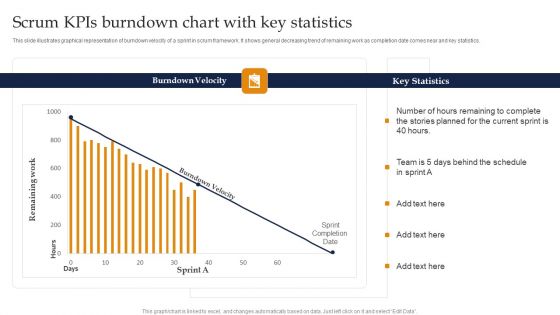
Scrum Kpis Burndown Chart With Key Statistics Ppt Pictures Visual Aids PDF
This slide illustrates graphical representation of burndown velocity of a sprint in scrum framework. It shows general decreasing trend of remaining work as completion date comes near and key statistics. Pitch your topic with ease and precision using this Scrum Kpis Burndown Chart With Key Statistics Ppt Pictures Visual Aids PDF. This layout presents information on Burndown Velocity, Key Statistics, Current Sprint. It is also available for immediate download and adjustment. So, changes can be made in the color, design, graphics or any other component to create a unique layout.
Tracker For Time Based Quality Kpis In Project Management Ideas PDF
This slide displays project wise comparative analysis on the basis of planned and actual time it takes for completion. It includes details such as number of tasks and work completed, average number of hours, start and end dates, etc. Pitch your topic with ease and precision using this Tracker For Time Based Quality Kpis In Project Management Ideas PDF. This layout presents information on Time, Work Completed, Avg Number, Hours Per Task. It is also available for immediate download and adjustment. So, changes can be made in the color, design, graphics or any other component to create a unique layout.
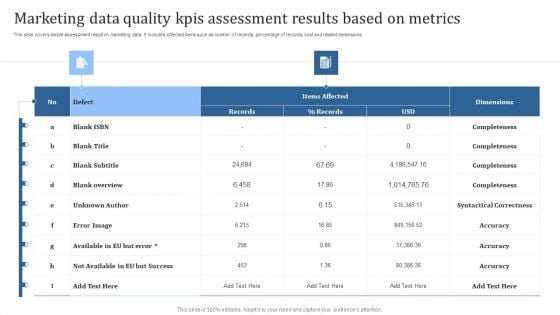
Marketing Data Quality Kpis Assessment Results Based On Metrics Summary PDF
This slide covers simple assessment result on marketing data. It includes affected items such as number of records, percentage of records, cost and related dimensions. Showcasing this set of slides titled Error Image, Unknown Author, Blank Overview. The topics addressed in these templates are Error Image, Unknown Author, Blank Overview. All the content presented in this PPT design is completely editable. Download it and make adjustments in color, background, font etc. as per your unique business setting.
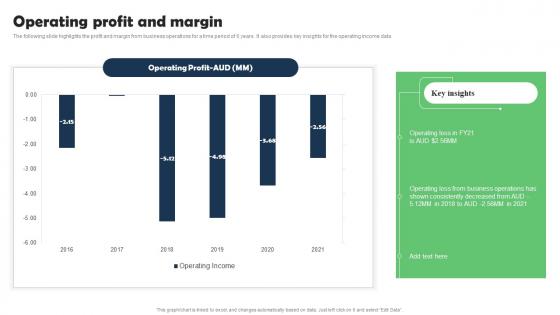
Operating Profit And Margin Marketing Research Services Management Business Pictures Pdf
The following slide highlights the profit and margin from business operations for a time period of 6 years. It also provides key insights for the operating income data. The Operating Profit And Margin Marketing Research Services Management Business Pictures Pdf is a compilation of the most recent design trends as a series of slides. It is suitable for any subject or industry presentation, containing attractive visuals and photo spots for businesses to clearly express their messages. This template contains a variety of slides for the user to input data, such as structures to contrast two elements, bullet points, and slides for written information. Slidegeeks is prepared to create an impression. The following slide highlights the profit and margin from business operations for a time period of 6 years. It also provides key insights for the operating income data.
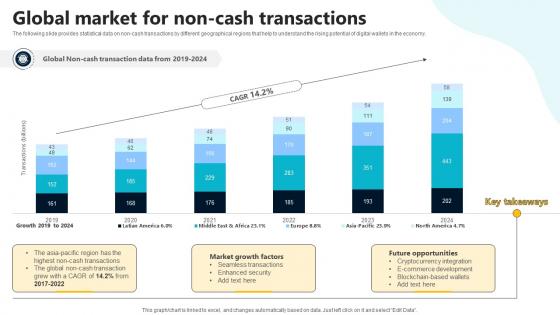
Global Market For Non Cash Transactions In Depth Guide To Digital Wallets Fin SS V
The following slide provides statistical data on non-cash transactions by different geographical regions that help to understand the rising potential of digital wallets in the economy. The Global Market For Non Cash Transactions In Depth Guide To Digital Wallets Fin SS V is a compilation of the most recent design trends as a series of slides. It is suitable for any subject or industry presentation, containing attractive visuals and photo spots for businesses to clearly express their messages. This template contains a variety of slides for the user to input data, such as structures to contrast two elements, bullet points, and slides for written information. Slidegeeks is prepared to create an impression. The following slide provides statistical data on non-cash transactions by different geographical regions that help to understand the rising potential of digital wallets in the economy.
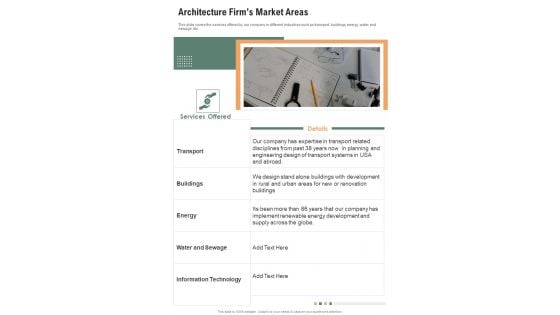
Architecture Firms Market Areas One Pager Documents
This slide covers the services offered by our company in different industries such as transport, buildings, energy, water and sewage, etc. Presenting you a fantastic Architecture Firms Market Areas One Pager Documents. This piece is crafted on hours of research and professional design efforts to ensure you have the best resource. It is completely editable and its design allow you to rehash its elements to suit your needs. Get this Architecture Firms Market Areas One Pager Documents A4 One-pager now.
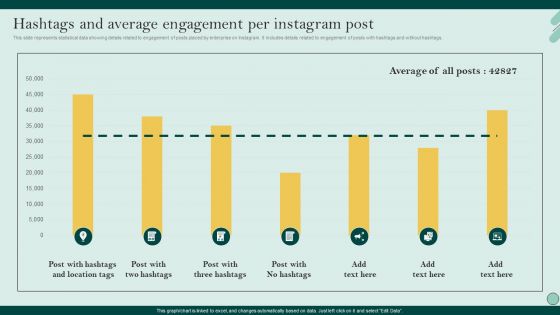
Social Networks Marketing To Improve Hashtags And Average Engagement Per Graphics PDF
This slide represents statistical data showing details related to engagement of posts placed by enterprise on Instagram. It includes details related to engagement of posts with hashtags and without hashtags. The Social Networks Marketing To Improve Hashtags And Average Engagement Per Graphics PDF is a compilation of the most recent design trends as a series of slides. It is suitable for any subject or industry presentation, containing attractive visuals and photo spots for businesses to clearly express their messages. This template contains a variety of slides for the user to input data, such as structures to contrast two elements, bullet points, and slides for written information. Slidegeeks is prepared to create an impression.
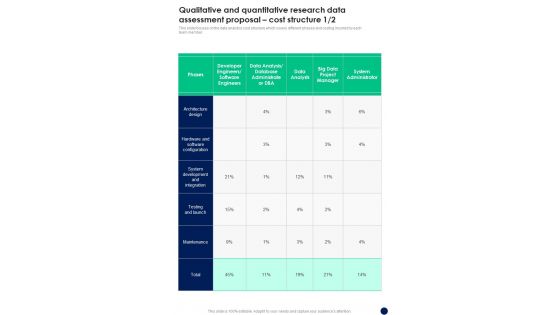
Qualitative And Quantitative Research Data Assessment Proposal Cost Structure One Pager Sample Example Document
This slide focuses on the data analytics cost structure which covers different phases and costing incurred by each team member. Presenting you an exemplary Qualitative And Quantitative Research Data Assessment Proposal Cost Structure One Pager Sample Example Document. Our one pager comprises all the must have essentials of an inclusive document. You can edit it with ease, as its layout is completely editable. With such freedom, you can tweak its design and other elements to your requirements. Download this Qualitative And Quantitative Research Data Assessment Proposal Cost Structure One Pager Sample Example Document brilliant piece now.
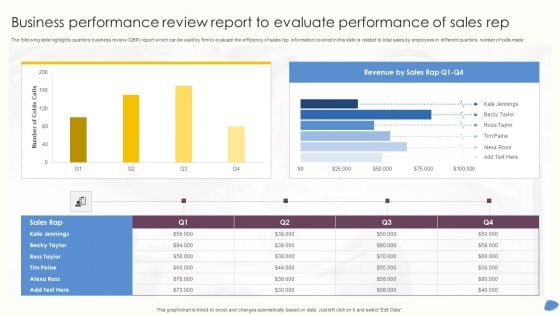
Business Performance Review Report To Evaluate Performance Of Sales Rep Infographics PDF
The following slide highlights quarterly business review QBR report which can be used by firm to evaluate the efficiency of sales rep. information covered in this slide is related to total sales by employees in different quarters, number of calls made. Pitch your topic with ease and precision using this Business Performance Review Report To Evaluate Performance Of Sales Rep Infographics PDF. This layout presents information on Revenue Sales, Tim Paine, Number Colds Calls. It is also available for immediate download and adjustment. So, changes can be made in the color, design, graphics or any other component to create a unique layout.
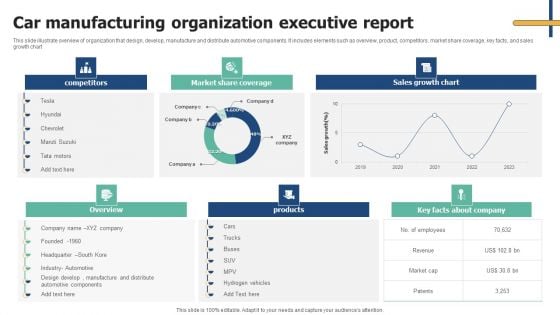
Car Manufacturing Organization Executive Report Background PDF
This slide illustrate overview of organization that design, develop, manufacture and distribute automotive components. It includes elements such as overview, product, competitors, market share coverage, key facts, and sales growth chart. Pitch your topic with ease and precision using this Car Manufacturing Organization Executive Report Background PDF. This layout presents information on Competitors, Market Share Coverage, Sales Growth Chart. It is also available for immediate download and adjustment. So, changes can be made in the color, design, graphics or any other component to create a unique layout.
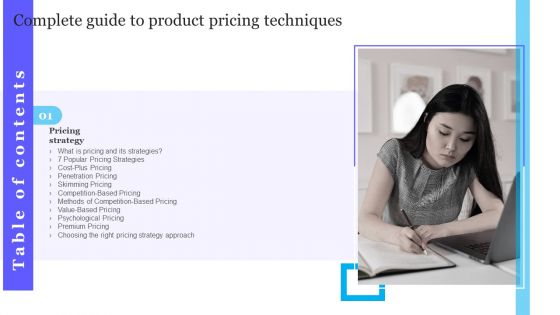
Table Of Contents Complete Guide To Product Pricing Techniques Cost Brochure PDF
The Table Of Contents Complete Guide To Product Pricing Techniques Cost Brochure PDF is a compilation of the most recent design trends as a series of slides. It is suitable for any subject or industry presentation, containing attractive visuals and photo spots for businesses to clearly express their messages. This template contains a variety of slides for the user to input data, such as structures to contrast two elements, bullet points, and slides for written information. Slidegeeks is prepared to create an impression.
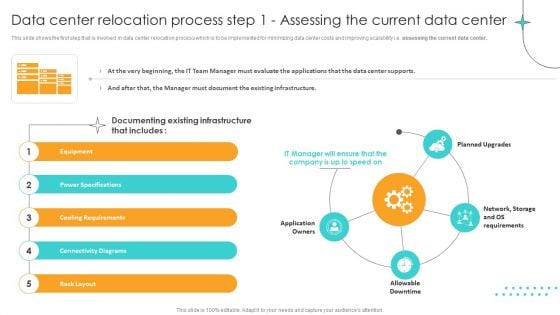
Data Center Relocation Process Step 1 Assessing The Current Data Center Background PDF
This slide shows the first step that is involved in data center relocation process which is to be implemented for minimizing data center costs and improving scalability i.e. assessing the current data center. Welcome to our selection of the Data Center Relocation Process Step 1 Assessing The Current Data Center Background PDF. These are designed to help you showcase your creativity and bring your sphere to life. Planning and Innovation are essential for any business that is just starting out. This collection contains the designs that you need for your everyday presentations. All of our PowerPoints are 100 percent editable, so you can customize them to suit your needs. This multi purpose template can be used in various situations. Grab these presentation templates today.
Three Text Boxes With Percentage Values And Icons Powerpoint Slides
This PowerPoint template has been designed with text boxes and percentage data. You may download this PPT slide to display data comparison and analysis. Add this slide to your presentation and impress your superiors.

Three Text Tags Compare Chart Powerpoint Slides
This PowerPoint template has been designed with text tags and percentage data. You may download this PPT slide to display data comparison and analysis. Add this slide to your presentation and impress your superiors.
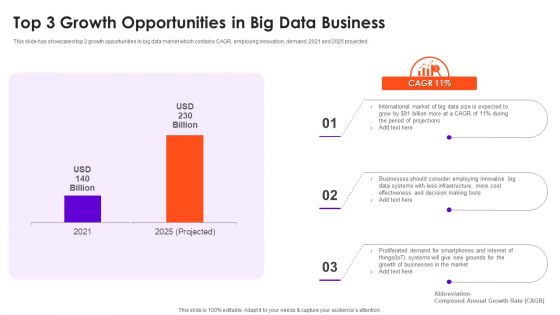
Top 3 Growth Opportunities In Big Data Business Download PDF
This slide has showcased top 3 growth opportunities in big data market which contains CAGR, employing innovation, demand, 2021 and 2025 projected. Pitch your topic with ease and precision using this Top 3 Growth Opportunities In Big Data Business Download PDF. This layout presents information on Cost, Businesses, Data Systems. It is also available for immediate download and adjustment. So, changes can be made in the color, design, graphics or any other component to create a unique layout.
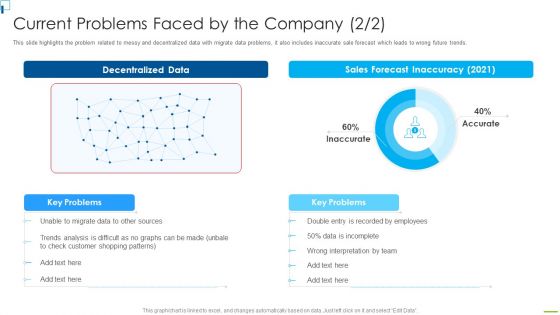
Designing And Deployment Current Problems Faced By The Company Portrait PDF
This slide highlights the problem related to messy and decentralized data with migrate data problems, it also includes inaccurate sale forecast which leads to wrong future trends. Deliver and pitch your topic in the best possible manner with this designing and deployment current problems faced by the company portrait pdf. Use them to share invaluable insights on decentralized data, sales forecast inaccuracy 2021, employees, trends analysis and impress your audience. This template can be altered and modified as per your expectations. So, grab it now.
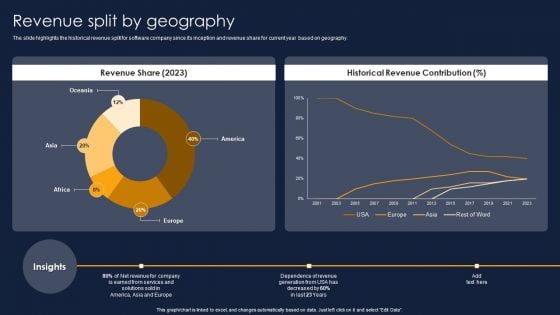
Revenue Split By Geography Financial Performance Report Of Software Firm Background PDF
The slide highlights the historical revenue split for software company since its inception and revenue share for current year based on geography. Do you have an important presentation coming up Are you looking for something that will make your presentation stand out from the rest Look no further than Revenue Split By Geography Financial Performance Report Of Software Firm Background PDF. With our professional designs, you can trust that your presentation will pop and make delivering it a smooth process. And with Slidegeeks, you can trust that your presentation will be unique and memorable. So why wait Grab Revenue Split By Geography Financial Performance Report Of Software Firm Background PDF today and make your presentation stand out from the rest.
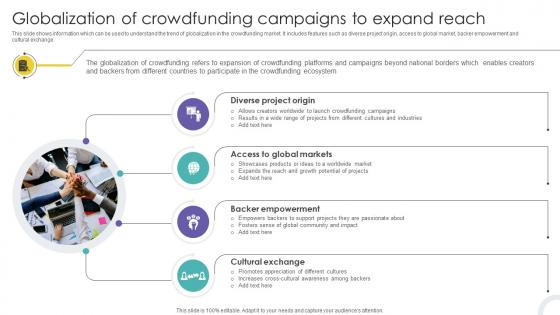
Globalization Of Crowdfunding Campaigns To Crowdfunding Strategies To Raise Funds Fin SS V
This slide shows information which can be used to understand the trend of globalization in the crowdfunding market. It includes features such as diverse project origin, access to global market, backer empowerment and cultural exchange. Coming up with a presentation necessitates that the majority of the effort goes into the content and the message you intend to convey. The visuals of a PowerPoint presentation can only be effective if it supplements and supports the story that is being told. Keeping this in mind our experts created Globalization Of Crowdfunding Campaigns To Crowdfunding Strategies To Raise Funds Fin SS V to reduce the time that goes into designing the presentation. This way, you can concentrate on the message while our designers take care of providing you with the right template for the situation. This slide shows information which can be used to understand the trend of globalization in the crowdfunding market. It includes features such as diverse project origin, access to global market, backer empowerment and cultural exchange.
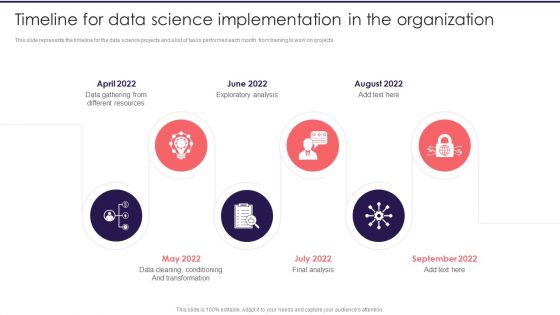
Information Studies Timeline For Data Science Implementation In The Organization Infographics PDF
This slide represents the timeline for the data science projects and a list of tasks performed each month, from training to work on projects. Presenting Information Studies Timeline For Data Science Implementation In The Organization Infographics PDF to provide visual cues and insights. Share and navigate important information on six stages that need your due attention. This template can be used to pitch topics like Different Resources, Exploratory Analysis, Final Analysis. In addtion, this PPT design contains high resolution images, graphics, etc, that are easily editable and available for immediate download.
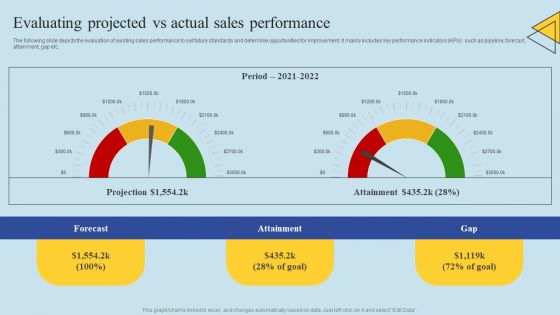
Determining Risks In Sales Administration Procedure Evaluating Projected Vs Actual Sales Performance Pictures PDF
The following slide depicts the evaluation of existing sales performance to set future standards and determine opportunities for improvement. It mainly includes key performance indicators KPIs such as pipeline, forecast, attainment, gap etc. Explore a selection of the finest Determining Risks In Sales Administration Procedure Evaluating Projected Vs Actual Sales Performance Pictures PDF here. With a plethora of professionally designed and pre made slide templates, you can quickly and easily find the right one for your upcoming presentation. You can use our Determining Risks In Sales Administration Procedure Evaluating Projected Vs Actual Sales Performance Pictures PDF to effectively convey your message to a wider audience. Slidegeeks has done a lot of research before preparing these presentation templates. The content can be personalized and the slides are highly editable. Grab templates today from Slidegeeks.

Stock Market Research Report Ppt PowerPoint Presentation Complete Deck With Slides
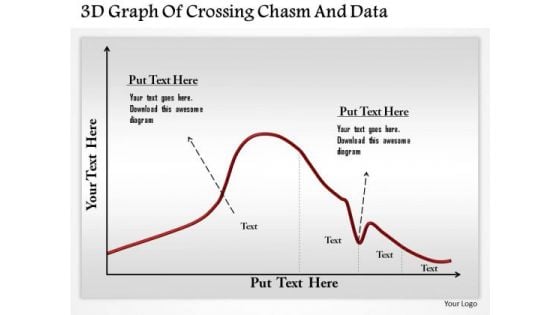
Business Diagram 3d Graph Of Crossing Chasm And Data Presentation Template
This business diagram has been designed with graphic of 3d graph. This slide contains the concept of chasm and data calculation. Use this slide to display chasm crossing condition. This business diagram adds value to your ideas.
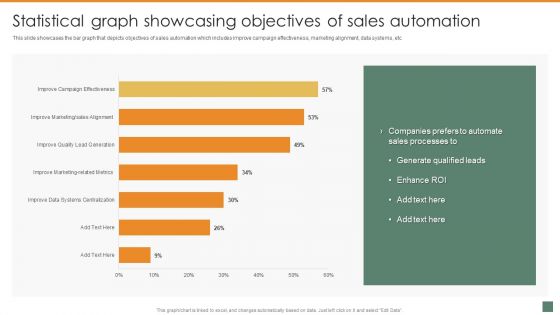
Statistical Graph Showcasing Objectives Of Sales Automation Summary And Significance Of Sales Automation Inspiration PDF
This slide showcases the bar graph that depicts objectives of sales automation which includes improve campaign effectiveness, marketing alignment, data systems, etc. The Statistical Graph Showcasing Objectives Of Sales Automation Summary And Significance Of Sales Automation Inspiration PDF is a compilation of the most recent design trends as a series of slides. It is suitable for any subject or industry presentation, containing attractive visuals and photo spots for businesses to clearly express their messages. This template contains a variety of slides for the user to input data, such as structures to contrast two elements, bullet points, and slides for written information. Slidegeeks is prepared to create an impression.


 Continue with Email

 Home
Home


