Key Themes
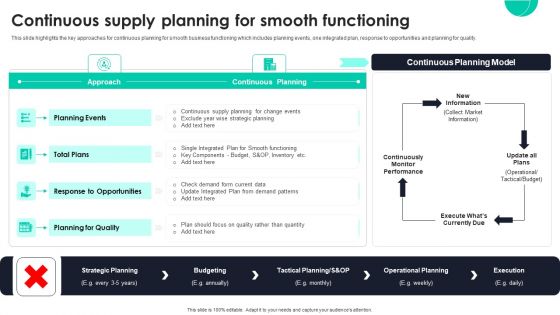
Continuous Supply Planning For Smooth Functioning Ppt PowerPoint Presentation Diagram Graph Charts PDF
This slide highlights the key approaches for continuous planning for smooth business functioning which includes planning events, one integrated plan, response to opportunities and planning for quality. From laying roadmaps to briefing everything in detail, our templates are perfect for you. You can set the stage with your presentation slides. All you have to do is download these easy to edit and customizable templates. Continuous Supply Planning For Smooth Functioning Ppt PowerPoint Presentation Diagram Graph Charts PDF will help you deliver an outstanding performance that everyone would remember and praise you for. Do download this presentation today.
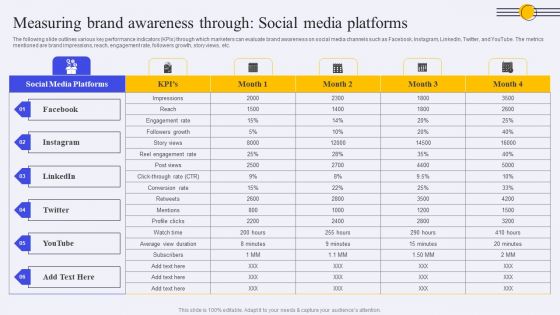
Measuring Brand Awareness Through Social Media Platforms Ppt PowerPoint Presentation Diagram Graph Charts PDF
The following slide outlines various key performance indicators KPIs through which marketers can evaluate brand awareness on social media channels such as Facebook, Instagram, LinkedIn, Twitter, and YouTube. The metrics mentioned are brand impressions, reach, engagement rate, followers growth, story views, etc. The best PPT templates are a great way to save time, energy, and resources. Slidegeeks have 100 percent editable powerpoint slides making them incredibly versatile. With these quality presentation templates, you can create a captivating and memorable presentation by combining visually appealing slides and effectively communicating your message. Download Measuring Brand Awareness Through Social Media Platforms Ppt PowerPoint Presentation Diagram Graph Charts PDF from Slidegeeks and deliver a wonderful presentation.
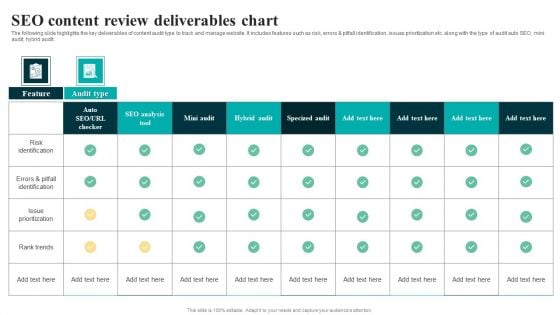
SEO Content Review Deliverables Chart Professional PDF
The following slide highlights the key deliverables of content audit type to track and manage website. It includes features such as risk, errors and pitfall identification, issues prioritization etc. along with the type of audit auto SEO, mini audit, hybrid audit. Showcasing this set of slides titled SEO Content Review Deliverables Chart Professional PDF. The topics addressed in these templates are Risk Identification, Issue Prioritization. All the content presented in this PPT design is completely editable. Download it and make adjustments in color, background, font etc. as per your unique business setting.
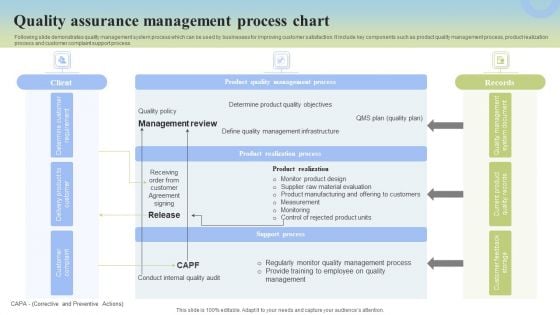
Quality Assurance Management Process Chart Inspiration PDF
Following slide demonstrates quality management system process which can be used by businesses for improving customer satisfaction. It include key components such as product quality management process, product realization process and customer complaint support process. Showcasing this set of slides titled Quality Assurance Management Process Chart Inspiration PDF. The topics addressed in these templates are Management Review, Product Realization, Monitor Product Design. All the content presented in this PPT design is completely editable. Download it and make adjustments in color, background, font etc. as per your unique business setting.
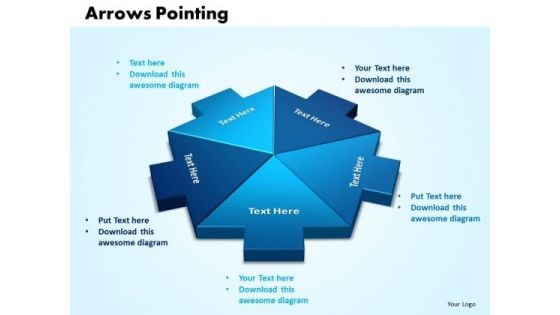
Business Company PowerPoint Templates Arrows Pointing Inwards Chart Ppt Slides
Business Company PowerPoint Templates arrows pointing inwards chart PPT Slides-Use this arrow pointing inward chart to determine your targets and sequence them as per your priorities. Unravel each one for your audience while setting key timelines as you go along-Business Company PowerPoint Templates arrows pointing inwards chart PPT Slides-This ppt can be used for concepts relating to-3d, Accounting, Arrow, Chart, Corporate, Data, Design, Diagram, Element, Graphic, Icon, Illustration etc. Our Business Company PowerPoint Templates Arrows Pointing Inwards Chart Ppt Slides are not a figment of imagination. They actually help in day to day aspects.
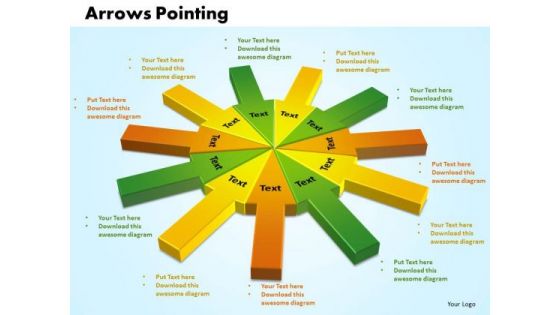
Business PowerPoint Templates Business Arrows Pointing Inwards Chart Ppt Slides
Business PowerPoint Templates Business Arrows pointing inwards chart PPT Slides-Use this arrow pointing inward chart to determine your targets and sequence them as per your priorities. Unravel each one for your audience while setting key timelines as you go along. -Business PowerPoint Templates Business Arrows pointing inwards chart PPT Slides-This ppt can be used for concepts relating to-3d, Accounting, Arrow, Blue, Button, Chart, Corporate, Crystal, Data, Design, Diagram, Element, Glass, Glowing, Graphic, Green, Icon, Illustration, Internet, Investment Etc Our Business PowerPoint Templates Business Arrows Pointing Inwards Chart Ppt Slides maintain equilibrium. Give your thoughts that balanced look.
Digital Sales Metrics Showing Enhancement Icons PDF
The following slide represents statistics of online sales key performance indicators KPIs which can assist marketing manager to review their performance and take necessary steps. It include different metrics such as add to cart rate, conversion rate, and revenue per session. Showcasing this set of slides titled Digital Sales Metrics Showing Enhancement Icons PDF. The topics addressed in these templates are Quarterly Online Sales Metrics, Targeted Right Customers, Offered Product Recommendations. All the content presented in this PPT design is completely editable. Download it and make adjustments in color, background, font etc. as per your unique business setting.
Monthly Financial Performance Outcome Reporting Icons PDF
This slide showcases a report showing monthly results financial performance to ensure constant revenue growth. It includes key components such as gross profit margin, operating expenses ratio, operating profit margin, net profit margin, earning before interest and taxes, etc. Showcasing this set of slides titled Monthly Financial Performance Outcome Reporting Icons PDF. The topics addressed in these templates are Operating Expenses, Income Statement, Operating Expenses Ratio. All the content presented in this PPT design is completely editable. Download it and make adjustments in color, background, font etc. as per your unique business setting.
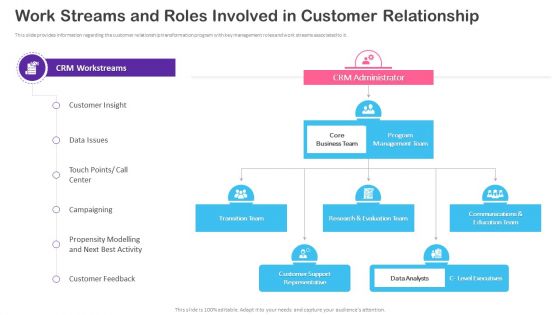
CRM Transformation Toolkit Work Streams And Roles Involved In Customer Relationship Mockup PDF
This slide provides information regarding the customer relationship transformation program with key management roles and work streams associated to it. Presenting CRM Transformation Toolkit Work Streams And Roles Involved In Customer Relationship Mockup PDF to provide visual cues and insights. Share and navigate important information on four stages that need your due attention. This template can be used to pitch topics like Core Business Team, Transition Team, Customer Support Representative. In addtion, this PPT design contains high resolution images, graphics, etc, that are easily editable and available for immediate download.
Comparative Assessment Of Data Integration Deployment Tools Icons PDF Graphics PDF
This slide covers comparative assessment of data integration and implementation tools. It involves key features such as real time data replication, enterprise grade security, graph interface and automatic schema detection. Showcasing this set of slides titled Comparative Assessment Of Data Integration Deployment Tools Icons PDF Graphics PDF. The topics addressed in these templates are Tools, Features, Cost Involved. All the content presented in this PPT design is completely editable. Download it and make adjustments in color, background, font etc. as per your unique business setting.
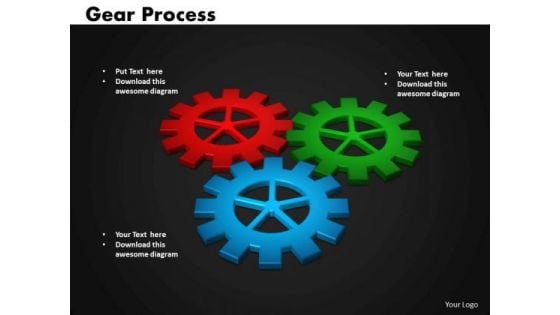
Business Circle Charts PowerPoint Templates Success Gears Process Ppt Slides
Business Circle Charts PowerPoint Templates Success Gears Process PPT Slides-This Gears Process diagram is used to show interlocking ideas. Use this diagram to lay out your strategic plans, key growth areas.-Business Circle Charts PowerPoint Templates Success Gears Process PPT Slides-This template can be used for presentations relating to 3d, Business, Circle, Circular, Clockwork, Cogs, Cogwheel, Colorful, Colors, Community, Component, Concept, Cooperate, Cooperation, Cycle, Cyclical, Different, Diverse, Diversity, Gear, Geometric, Hi-Tech, Idea, Industrial, Industry, Machine, Machinery, Mechanical, Mechanics, Round, Process,Progress Facilitate your career with our Business Circle Charts PowerPoint Templates Success Gears Process Ppt Slides. Convey your ideas with confidence.
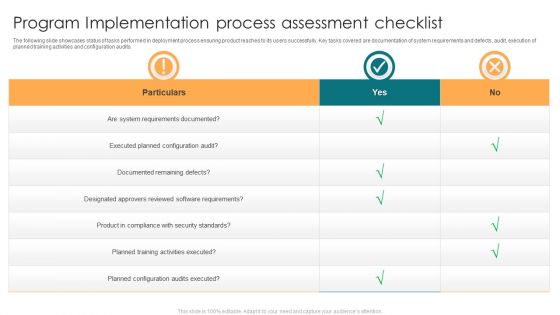
Program Implementation Process Assessment Checklist Ppt Pictures Clipart Images PDF
The following slide showcases status of tasks performed in deployment process ensuring product reaches to its users successfully. Key tasks covered are documentation of system requirements and defects, audit, execution of planned training activities and configuration audits. Showcasing this set of slides titled Program Implementation Process Assessment Checklist Ppt Pictures Clipart Images PDF. The topics addressed in these templates are Executed Planned, Configuration Audit, Documented Remaining Defects, Planned Training, Activities Executed. All the content presented in this PPT design is completely editable. Download it and make adjustments in color, background, font etc. as per your unique business setting.
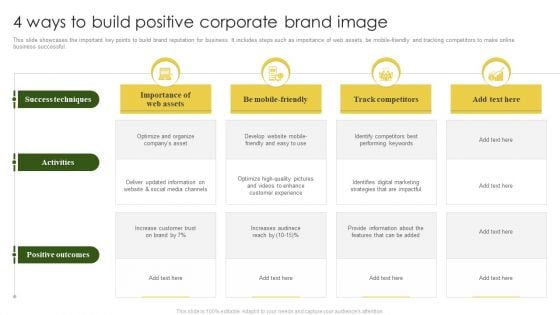
4 Ways To Build Positive Corporate Brand Image Elements PDF
This slide showcases the important key points to build brand reputation for business. It includes steps such as importance of web assets, be mobile friendly and tracking competitors to make online business successful. Showcasing this set of slides titled 4 Ways To Build Positive Corporate Brand Image Elements PDF. The topics addressed in these templates are Importance Of Web Assets, Track Competitors, Success Techniques. All the content presented in this PPT design is completely editable. Download it and make adjustments in color, background, font etc. as per your unique business setting.
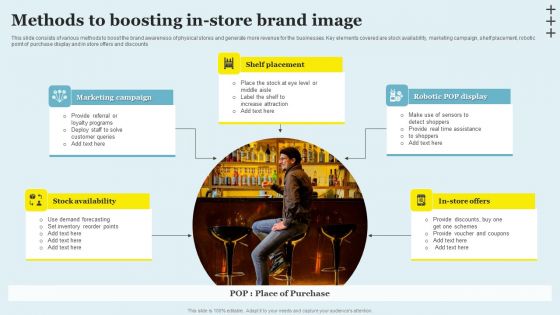
Methods To Boosting In Store Brand Image Inspiration PDF
This slide consists of various methods to boost the brand awareness of physical stores and generate more revenue for the businesses. Key elements covered are stock availability, marketing campaign, shelf placement, robotic point of purchase display and in store offers and discounts. Showcasing this set of slides titled Methods To Boosting In Store Brand Image Inspiration PDF. The topics addressed in these templates are Marketing Campaign, Shelf Placement, Robotic POP Display. All the content presented in this PPT design is completely editable. Download it and make adjustments in color, background, font etc. as per your unique business setting.
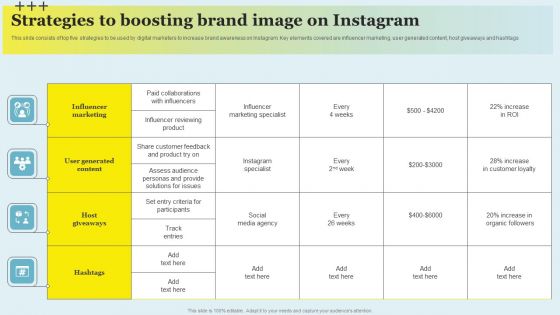
Strategies To Boosting Brand Image On Instagram Professional PDF
This slide consists of top five strategies to be used by digital marketers to increase brand awareness on Instagram. Key elements covered are influencer marketing, user generated content, host giveaways and hashtags. Showcasing this set of slides titled Strategies To Boosting Brand Image On Instagram Professional PDF. The topics addressed in these templates are Influencer Marketing, User Generated Content, Host Giveaways. All the content presented in this PPT design is completely editable. Download it and make adjustments in color, background, font etc. as per your unique business setting.
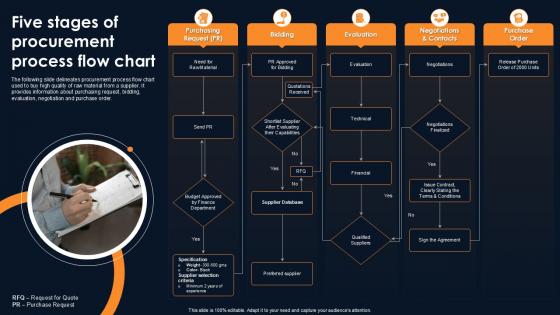
Five Stages Of Procurement Process Flow Chart
If your project calls for a presentation, then Slidegeeks is your go-to partner because we have professionally designed, easy-to-edit templates that are perfect for any presentation. After downloading, you can easily edit Five Stages Of Procurement Process Flow Chart and make the changes accordingly. You can rearrange slides or fill them with different images. Check out all the handy templates This slide showcases procurement flowchart for purchasing high-quality raw materials from suppliers. It covers key steps like creating purchase requests, bidding, evaluating options, negotiating terms, and issuing purchase orders to ensure smooth and effective procurement process.
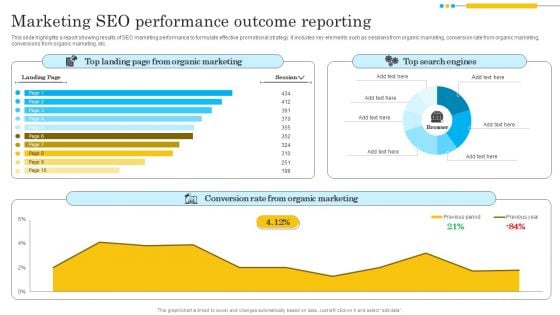
Marketing SEO Performance Outcome Reporting Background PDF
This slide highlights a report showing results of SEO marketing performance to formulate effective promotional strategy. It includes key elements such as sessions from organic marketing, conversion rate from organic marketing, conversions from organic marketing, etc. Showcasing this set of slides titled Marketing SEO Performance Outcome Reporting Background PDF. The topics addressed in these templates are Organic Marketing, Top Search Engines, Organic Marketing. All the content presented in this PPT design is completely editable. Download it and make adjustments in color, background, font etc. as per your unique business setting.
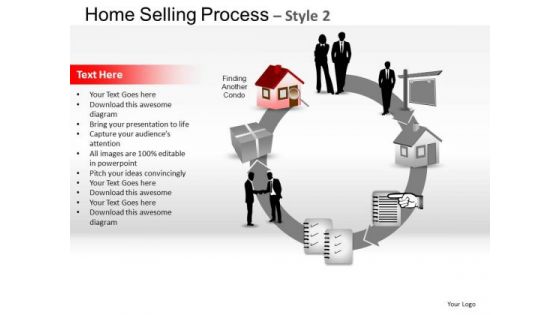
PowerPoint Slide Chart Home Selling Ppt Template
PowerPoint Slide Chart Home Selling PPT template-These high quality powerpoint pre-designed slides and powerpoint templates have been carefully created by our professional team to help you impress your audience. All slides have been created and are 100% editable in powerpoint. Each and every property of any graphic - color, size, orientation, shading, outline etc. can be modified to help you build an effective powerpoint presentation. Any text can be entered at any point in the powerpoint template or slide. Simply DOWNLOAD, TYPE and PRESENT! Extract the essence with our PowerPoint Slide Chart Home Selling Ppt Template. Your thoughts will highlight the key conditions.
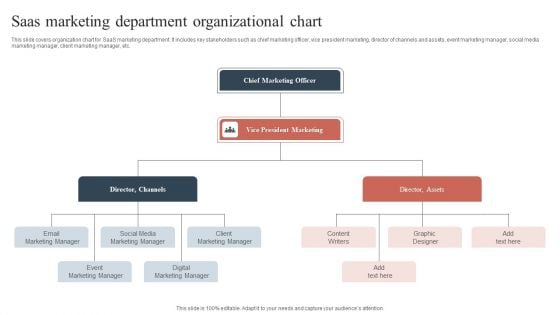
Saas Marketing Department Organizational Chart Guidelines PDF
This slide covers organization chart for SaaS marketing department. It includes key stakeholders such as chief marketing officer, vice president marketing, director of channels and assets, event marketing manager, social media marketing manager, client marketing manager, etc. Persuade your audience using this Saas Marketing Department Organizational Chart Guidelines PDF. This PPT design covers four stages, thus making it a great tool to use. It also caters to a variety of topics including Chief Marketing Officer, Social Media Marketing Manager, Event Marketing Manager. Download this PPT design now to present a convincing pitch that not only emphasizes the topic but also showcases your presentation skills.
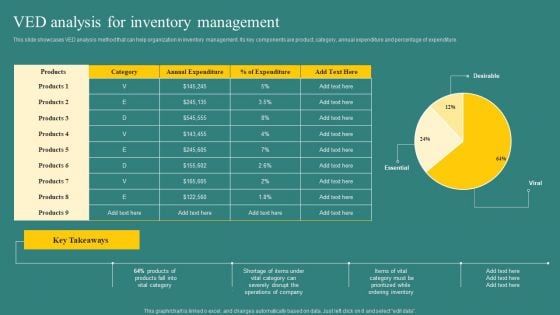
VED Analysis For Inventory Management Background PDF
This slide showcases VED analysis method that can help organization in inventory management. Its key components are product, category, annual expenditure and percentage of expenditure. From laying roadmaps to briefing everything in detail, our templates are perfect for you. You can set the stage with your presentation slides. All you have to do is download these easy to edit and customizable templates. VED Analysis For Inventory Management Background PDF will help you deliver an outstanding performance that everyone would remember and praise you for. Do download this presentation today.

Vision 2013 Business Concept PowerPoint Templates Ppt Backgrounds For Slides 0113
We present our Vision 2013 Business Concept PowerPoint Templates PPT Backgrounds For Slides 0113.Use our Technology PowerPoint Templates because Watching this your Audience will Grab their eyeballs, they wont even blink. Use our New year PowerPoint Templates because Our PowerPoint Templates and Slides will definately Enhance the stature of your presentation. Adorn the beauty of your thoughts with their colourful backgrounds. Present our Signs PowerPoint Templates because Our PowerPoint Templates and Slides offer you the widest possible range of options. Download and present our Computer PowerPoint Templates because Our PowerPoint Templates and Slides will let you Hit the target. Go the full distance with ease and elan. Download our Business PowerPoint Templates because You can Channelise the thoughts of your team with our PowerPoint Templates and Slides. Urge them to focus on the goals you have set.Use these PowerPoint slides for presentations relating to Computer keyboard with vision 2013 key, technology, business, computer, new year, signs. The prominent colors used in the PowerPoint template are Red, White, Black. PowerPoint presentation experts tell us our Vision 2013 Business Concept PowerPoint Templates PPT Backgrounds For Slides 0113 provide great value for your money. Be assured of finding the best projection to highlight your words. PowerPoint presentation experts tell us our key PowerPoint templates and PPT Slides will generate and maintain the level of interest you desire. They will create the impression you want to imprint on your audience. You can be sure our Vision 2013 Business Concept PowerPoint Templates PPT Backgrounds For Slides 0113 are designed by professionals PowerPoint presentation experts tell us our key PowerPoint templates and PPT Slides are designed by professionals Presenters tell us our Vision 2013 Business Concept PowerPoint Templates PPT Backgrounds For Slides 0113 are topically designed to provide an attractive backdrop to any subject. PowerPoint presentation experts tell us our key PowerPoint templates and PPT Slides have awesome images to get your point across. Get in contention with our Vision 2013 Business Concept PowerPoint Templates Ppt Backgrounds For Slides 0113. The audience will add your name to the list.
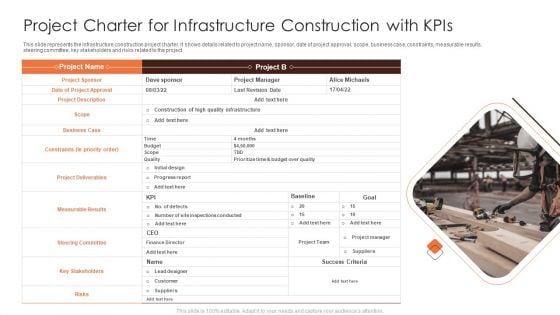
Project Charter For Infrastructure Construction With Kpis Background PDF
This slide represents the infrastructure construction project charter. It shows details related to project name, sponsor, date of project approval, scope, business case, constraints, measurable results, steering committee, key stakeholders and risks related to the project. Pitch your topic with ease and precision using this Project Charter For Infrastructure Construction With Kpis Background PDF. This layout presents information on Project Deliverables, Business Case, Quality Infrastructure. It is also available for immediate download and adjustment. So, changes can be made in the color, design, graphics or any other component to create a unique layout.
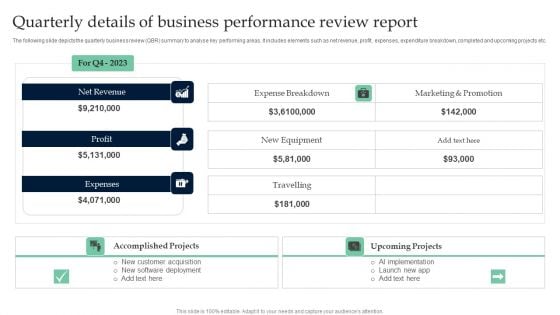
Quarterly Details Of Business Performance Review Report Background PDF
The following slide depicts the quarterly business review QBR summary to analyse key performing areas. It includes elements such as net revenue, profit, expenses, expenditure breakdown, completed and upcoming projects etc. Pitch your topic with ease and precision using this Quarterly Details Of Business Performance Review Report Background PDF. This layout presents information on Accomplished Projects, Upcoming Projects. It is also available for immediate download and adjustment. So, changes can be made in the color, design, graphics or any other component to create a unique layout.
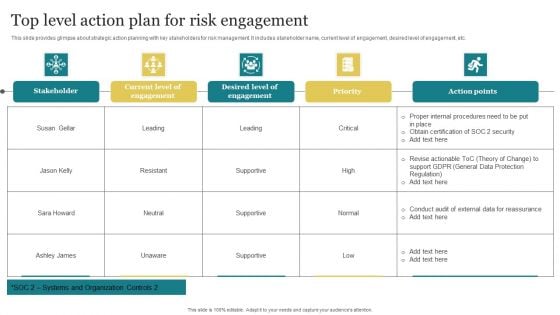
Top Level Action Plan For Risk Engagement Background PDF
This slide provides glimpse about strategic action planning with key stakeholders for risk management. It includes stakeholder name, current level of engagement, desired level of engagement, etc. Pitch your topic with ease and precision using this Top Level Action Plan For Risk Engagement Background PDF. This layout presents information on Stakeholder, Desired Level Of Engagement, Action Points. It is also available for immediate download and adjustment. So, changes can be made in the color, design, graphics or any other component to create a unique layout.
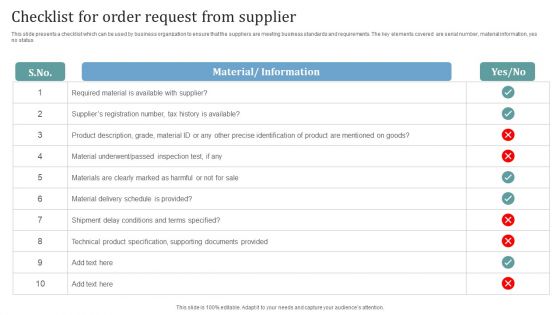
Checklist For Order Request From Supplier Background PDF
This slide presents a checklist which can be used by business organization to ensure that the suppliers are meeting business standards and requirements. The key elements covered are serial number, material information, yes no status Pitch your topic with ease and precision using this Checklist For Order Request From Supplier Background PDF. This layout presents information on Material, Information, Supplier. It is also available for immediate download and adjustment. So, changes can be made in the color, design, graphics or any other component to create a unique layout.
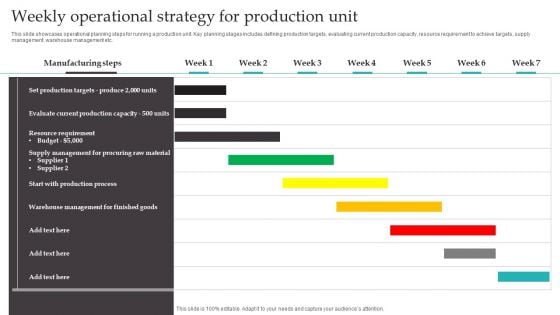
Weekly Operational Strategy For Production Unit Background PDF
This slide showcases operational planning steps for running a production unit. Key planning stages includes defining production targets, evaluating current production capacity, resource requirement to achieve targets, supply management, warehouse management etc. Pitch your topic with ease and precision using this Weekly Operational Strategy For Production Unit Background PDF. This layout presents information on Manufacturing Steps, Set Production Targets, Evaluate Current Production. It is also available for immediate download and adjustment. So, changes can be made in the color, design, graphics or any other component to create a unique layout.
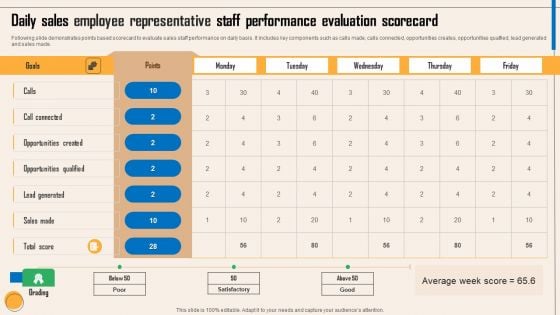
Daily Sales Employee Representative Staff Performance Evaluation Scorecard Background PDF
Following slide demonstrates points based scorecard to evaluate sales staff performance on daily basis. It includes key components such as calls made, calls connected, opportunities creates, opportunities qualfied, lead generated and sales made. Pitch your topic with ease and precision using this Daily Sales Employee Representative Staff Performance Evaluation Scorecard Background PDF. This layout presents information on Calls, Call Connected, Opportunities Created, Opportunities Qualified, Lead Generated, Sales Made, Total Score. It is also available for immediate download and adjustment. So, changes can be made in the color, design, graphics or any other component to create a unique layout.
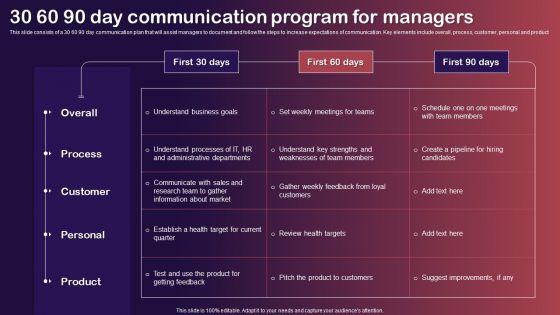
30 60 90 Day Communication Program For Managers Background PDF
This slide consists of a 30 60 90 day communication plan that will assist managers to document and follow the steps to increase expectations of communication. Key elements include overall, process, customer, personal and product Pitch your topic with ease and precision using this 30 60 90 Day Communication Program For Managers Background PDF. This layout presents information on Overall, Process, Customer. It is also available for immediate download and adjustment. So, changes can be made in the color, design, graphics or any other component to create a unique layout.
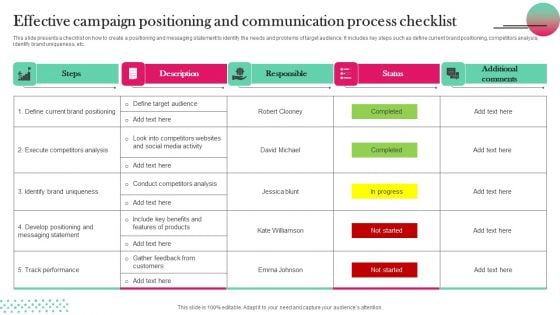
Effective Campaign Positioning And Communication Process Checklist Background PDF
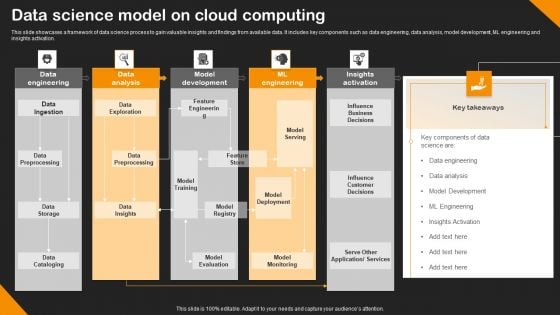
Data Science Model On Cloud Computing Background PDF
This slide showcases a framework of data science process to gain valuable insights and findings from available data. It includes key components such as data engineering, data analysis, model development, ML engineering and insights activation. Pitch your topic with ease and precision using this Data Science Model On Cloud Computing Background PDF. This layout presents information on Data Preprocessing, Data Ingestion, Data Engineering. It is also available for immediate download and adjustment. So, changes can be made in the color, design, graphics or any other component to create a unique layout.
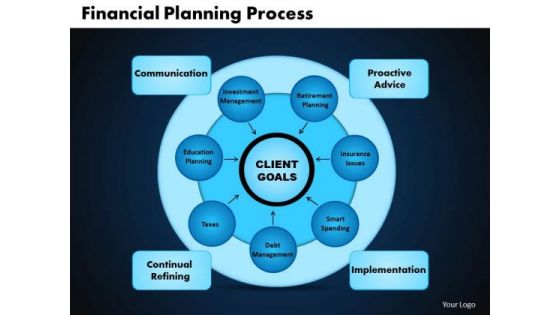
Business Circle Charts PowerPoint Templates Leadership Financial Planning Process Ppt Slides
Business Circle Charts PowerPoint Templates Leadership Financial Planning Process PPT Slides-This PowerPoint diagram shows transformations from one stage to others stage of Financial Planning Process-Business Circle Charts PowerPoint Templates Leadership Financial Planning Process PPT Slides-This template can be used for presentations relating to Abstract, Action, Business, Chart, Commerce, Competitor, Components, Concept, Conceptual, Design, Diagram, Executive, Financial, Goals, Guide, Guidelines, Hierarchy, Icon, Idea, Illustration, Manage, Management, Marketing, Mind, Mission, Model, Operations, Organization, Performance, Plan, Planning, Process The colour contrasts of our Business Circle Charts PowerPoint Templates Leadership Financial Planning Process Ppt Slides are aesthetically designed. They put the focus on key factors.
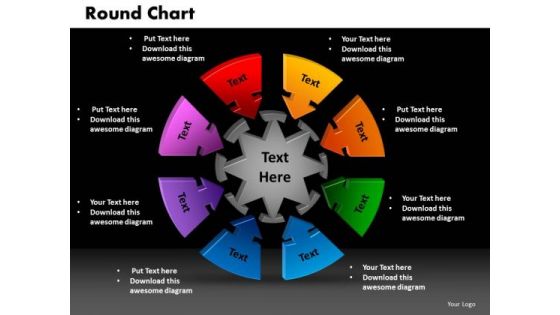
PowerPoint Designs Round Chart Business Ppt Presentation Designs
PowerPoint Designs Round Chart Business PPT Presentation Designs-Determine your targets and sequence them as per your priorities. Unravel each one for your audience while setting key timelines as you go along. Educate your listeners on the relevance and importance of each one as per your plan and how they all contribute as you strive to hit the Bullseye-PowerPoint Designs Round Chart Business PPT Presentation Designs-This ppt can be used for presentations relating to-3d, Angle, Arrow, Business, Chart, Circle, Complex, Concept, Data, Depth, Diagram, Dimensional, Financial, Graph, Graphic, Process Get your ideas buzzing with our PowerPoint Designs Round Chart Business Ppt Presentation Designs. They will be flying all around.
PowerPoint Slide Designs Round Chart Business Ppt Slide Designs
PowerPoint Slide Designs Round Chart Business PPT Slide Designs-Determine your targets and sequence them as per your priorities. Unravel each one for your audience while setting key timelines as you go along. Educate your listeners on the relevance and importance of each one as per your plan and how they all contribute as you strive to hit the Bullseye-PowerPoint Slide Designs Round Chart Business PPT Slide Designs-This ppt can be used for presentations relating to-3d, Angle, Arrow, Business, Chart, Circle, Complex, Concept, Data, Depth, Diagram, Dimensional, Financial, Graph, Graphic, Process Supervise your team with our PowerPoint Slide Designs Round Chart Business Ppt Slide Designs. Download without worries with our money back guaranteee.
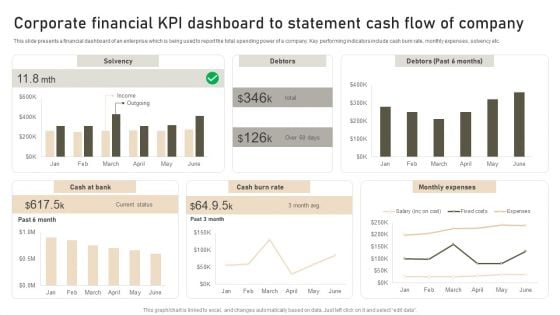
Corporate Financial KPI Dashboard To Statement Cash Flow Of Company Diagrams PDF
This slide presents a financial dashboard of an enterprise which is being used to report the total spending power of a company. Key performing indicators include cash burn rate, monthly expenses, solvency etc. Showcasing this set of slides titled Corporate Financial KPI Dashboard To Statement Cash Flow Of Company Diagrams PDF. The topics addressed in these templates are Solvency, Debtors, Monthly Expenses. All the content presented in this PPT design is completely editable. Download it and make adjustments in color, background, font etc. as per your unique business setting.
Hoshin Kanri Strategic Planning System Chart With Measurable Output Ppt PowerPoint Presentation File Icon PDF
This slide describes the strategic planning document. It includes information about the company goals, objectives, key tactics, owners, measurable output and respective recommendations of the same. Pitch your topic with ease and precision using this hoshin kanri strategic planning system chart with measurable output ppt powerpoint presentation file icon pdf. This layout presents information on management level, annual objective, measurable output. It is also available for immediate download and adjustment. So, changes can be made in the color, design, graphics or any other component to create a unique layout.
Hoshin Kanri Strategy Chart With Major Goal S Ppt PowerPoint Presentation Icon Example File PDF
The slide shows the strategic planning X Matrix structure that includes long term goals, annual objectives, and top-level priorities and key metrics to improve the same. Pitch your topic with ease and precision using this hoshin kanri strategy chart with major goal s ppt powerpoint presentation icon example file pdf. This layout presents information on digital, improvement, targets. It is also available for immediate download and adjustment. So, changes can be made in the color, design, graphics or any other component to create a unique layout.
Ppt Complex Flow Process Social Network PowerPoint Presentation Templates
PPT complex flow process social network powerpoint presentation Templates-Clarity of thought has been the key to your growth. Use our template to illustrate your ability. This awesome image makes your presentations simpler and professional. This PPT image is an effective tool to make your clients understand the concept.-PPT complex flow process social network powerpoint presentation Templates-Advice, Analyze, Arrow, Background, Business, Chart, Concept, Creativity, Decision, Design, Determination, Diagram, Draw, Education, Flowchart, Graphic, Idea, Means, Method, Office, Plan, Pointing, Presentation, Process, Sign, Strategy, Technology Cross the chasm with our Ppt Complex Flow Process Social Network PowerPoint Presentation Templates. You will come out on top.
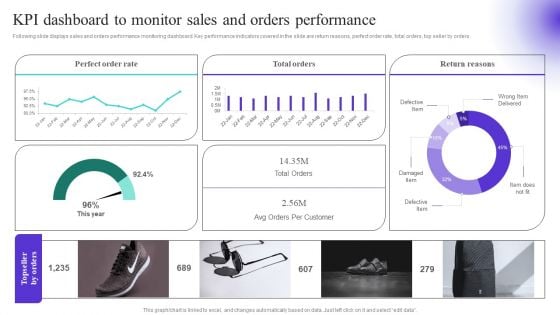
KPI Dashboard To Monitor Sales And Orders Performance Diagrams PDF
Following slide displays sales and orders performance monitoring dashboard. Key performance indicators covered in the slide are return reasons, perfect order rate, total orders, top seller by orders. Create an editable KPI Dashboard To Monitor Sales And Orders Performance Diagrams PDF that communicates your idea and engages your audience. Whether you are presenting a business or an educational presentation, pre designed presentation templates help save time. KPI Dashboard To Monitor Sales And Orders Performance Diagrams PDF is highly customizable and very easy to edit, covering many different styles from creative to business presentations. Slidegeeks has creative team members who have crafted amazing templates. So, go and get them without any delay.
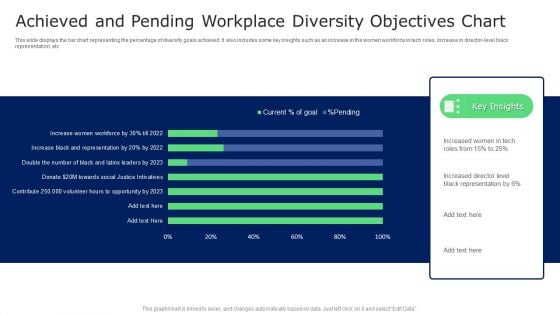
Achieved And Pending Workplace Diversity Objectives Chart Guidelines PDF
This slide displays the bar chart representing the percentage of diversity goals achieved. It also includes some key insights such as an increase in the women workforce in tech roles, increase in director level black representation, etc. Showcasing this set of slides titled Achieved And Pending Workplace Diversity Objectives Chart Guidelines PDF. The topics addressed in these templates are Achieved And Pending Workplace, Diversity Objectives Chart. All the content presented in this PPT design is completely editable. Download it and make adjustments in color, background, font etc. as per your unique business setting.
Group Halloween Icons PowerPoint Slides And Ppt Diagram Templates
Group Halloween Icons PowerPoint Slides And PPT Diagram Templates-These high quality powerpoint pre-designed slides and powerpoint templates have been carefully created by our professional team to help you impress your audience. All slides have been created and are 100% editable in powerpoint. Each and every property of any graphic - color, size, orientation, shading, outline etc. can be modified to help you build an effective powerpoint presentation. Any text can be entered at any point in the powerpoint template or slide. Simply DOWNLOAD, TYPE and PRESENT! Logically arrive at the essential aspects. Discern the key factors with our Group Halloween Icons PowerPoint Slides And Ppt Diagram Templates.
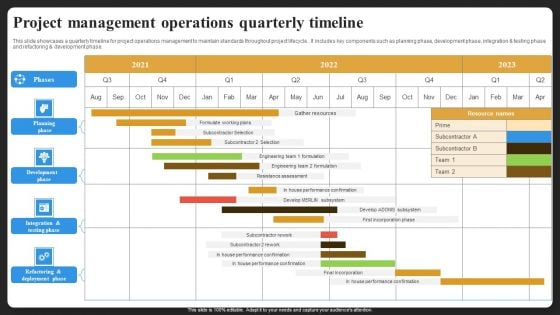
Project Management Operations Quarterly Timeline Mockup PDF
This slide showcases a quarterly timeline for project operations management to maintain standards throughout project lifecycle. It includes key components such as planning phase, development phase, integration and testing phase and refactoring and development phase. Showcasing this set of slides titled Project Management Operations Quarterly Timeline Mockup PDF. The topics addressed in these templates are Planning Phase, Development Phase, Integration Testing Phase. All the content presented in this PPT design is completely editable. Download it and make adjustments in color, background, font etc. as per your unique business setting.
Customer Service Metrics Dashboard With Customer Retention Rate Icons PDF
This slide showcases KPIs dashboard for customer service that can help organization to track the consumer satisfaction score and improve product or service by improving customer loyalty. Its key components are net promoter score, customer retention and support costs. Showcasing this set of slides titled Customer Service Metrics Dashboard With Customer Retention Rate Icons PDF. The topics addressed in these templates are Customer Retention, Net Promoter Score, Service Level. All the content presented in this PPT design is completely editable. Download it and make adjustments in color, background, font etc. as per your unique business setting.
Building Quality Inspection Dashboard With Customer Satisfaction Ratio Icons PDF
The following slide showcases dashboard of construction company exhibiting quality KPIs regarding safety, workmanship and customer satisfaction. Key indicators covered are site inspection success level, CSR, defect count, net promoter score, promotors, passives, defectors, total rework cost, safety meetings and average time taken to fix defects. Showcasing this set of slides titled Building Quality Inspection Dashboard With Customer Satisfaction Ratio Icons PDF. The topics addressed in these templates are Construction Project, Customer Satisfaction Ratio, Promoters. All the content presented in this PPT design is completely editable. Download it and make adjustments in color, background, font etc. as per your unique business setting.
Business Project Management Program Hazards Assessment Icons PDF
The following slide provide a risk management dashboard which helps business and organisation to identify the error levels and take necessary actions accordingly. Key elements are risk heat map, vulnerabilities, action plan breakdown, risk rating etc.Showcasing this set of slides titled Business Project Management Program Hazards Assessment Icons PDF. The topics addressed in these templates are Average Risk Threshold, Risk Threshold. All the content presented in this PPT design is completely editable. Download it and make adjustments in color, background, font etc. as per your unique business setting.
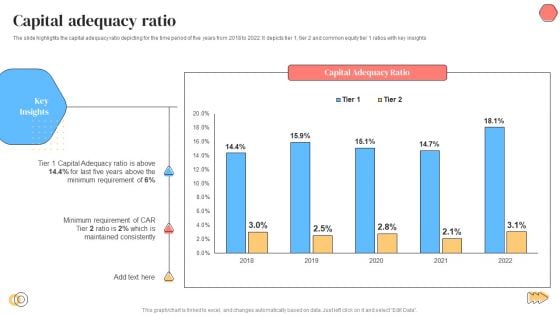
Banking Solutions Company Overview Capital Adequacy Ratio Diagrams PDF
The slide highlights the capital adequacy ratio depicting for the time period of five years from 2018 to 2022. It depicts tier 1, tier 2 and common equity tier 1 ratios with key insights. Deliver an awe inspiring pitch with this creative Banking Solutions Company Overview Capital Adequacy Ratio Diagrams PDF bundle. Topics like Capital Adequacy Ratio, Minimum Requirement, Capital Adequacy Ratio can be discussed with this completely editable template. It is available for immediate download depending on the needs and requirements of the user.
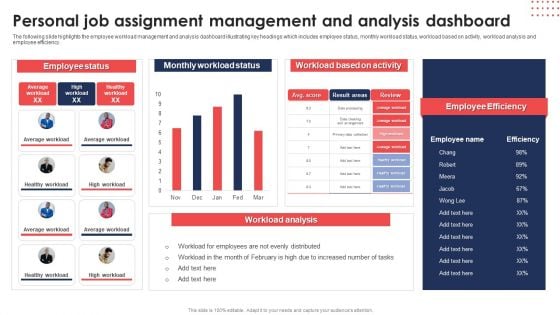
Personal Job Assignment Management And Analysis Dashboard Diagrams PDF
The following slide highlights the employee workload management and analysis dashboard illustrating key headings which includes employee status, monthly workload status, workload based on activity, workload analysis and employee efficiency. Pitch your topic with ease and precision using thisPersonal Job Assignment Management And Analysis Dashboard Diagrams PDF. This layout presents information on Employee Status, Monthly Workload Status, Workload Based Activity. It is also available for immediate download and adjustment. So, changes can be made in the color, design, graphics or any other component to create a unique layout.
Executive Dashboards For Tracking Financial Health Of Enterprise Diagrams PDF
This slide represents the CEO dashboard to track the financial health of an organization. It includes key performance indicators such as revenue, expenses, activity ratio, gross profit margin, EBIT etc. Pitch your topic with ease and precision using this Executive Dashboards For Tracking Financial Health Of Enterprise Diagrams PDF. This layout presents information on Revenue, Expense, Activity Ratio. It is also available for immediate download and adjustment. So, changes can be made in the color, design, graphics or any other component to create a unique layout.
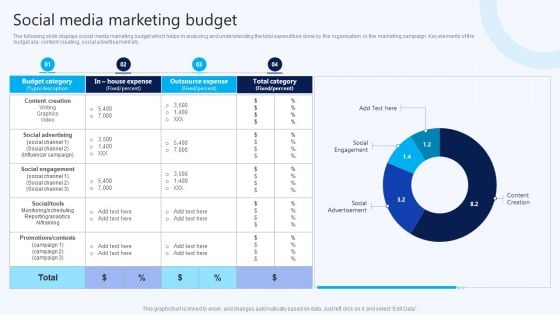
Social Media Marketing Budget B2B Electronic Commerce Startup Diagrams PDF
The following slide displays social media marketing budget which helps in analyzing and understanding the total expenditure done by the organization in the marketing campaign. Key elements of the budget are content creating, social advertisement etc. From laying roadmaps to briefing everything in detail, our templates are perfect for you. You can set the stage with your presentation slides. All you have to do is download these easy-to-edit and customizable templates. Social Media Marketing Budget B2B Electronic Commerce Startup Diagrams PDF will help you deliver an outstanding performance that everyone would remember and praise you for. Do download this presentation today.
Multi Cloud Infrastructure Management Cloud Performance Tracking Dashboard Diagrams PDF
This slide covers the Key performance indicators for tracking performance of the cloud such as violations break down, sources, rules and severity. From laying roadmaps to briefing everything in detail, our templates are perfect for you. You can set the stage with your presentation slides. All you have to do is download these easy-to-edit and customizable templates. Multi Cloud Infrastructure Management Cloud Performance Tracking Dashboard Diagrams PDF will help you deliver an outstanding performance that everyone would remember and praise you for. Do download this presentation today.
Plan Dashboard For Tracking Location Wise Revenue Diagrams PDF
This slide presents a dashboard which will assist managers to track the revenue of each branch having geographical presence in different corners of the world. The key performance indicators are total revenue, location wise rent, branch performance among many others.Pitch your topic with ease and precision using this Plan Dashboard For Tracking Location Wise Revenue Diagrams PDF. This layout presents information on Taxes Paid, Current Month, Branch Performance, Previous Quarter. It is also available for immediate download and adjustment. So, changes can be made in the color, design, graphics or any other component to create a unique layout.
Monthly Sales Performance Tracking And Monitoring Dashboard Diagrams PDF
This slide showcases a dashboard presenting various metrics to measure and analyze sales performance for revenue growth. It includes key components such as number of sales, revenue, profit, cost, sales revenue, sales increment, cost analysis and cross sell. Make sure to capture your audiences attention in your business displays with our gratis customizable Monthly Sales Performance Tracking And Monitoring Dashboard Diagrams PDF. These are great for business strategies, office conferences, capital raising or task suggestions. If you desire to acquire more customers for your tech business and ensure they stay satisfied, create your own sales presentation with these plain slides.
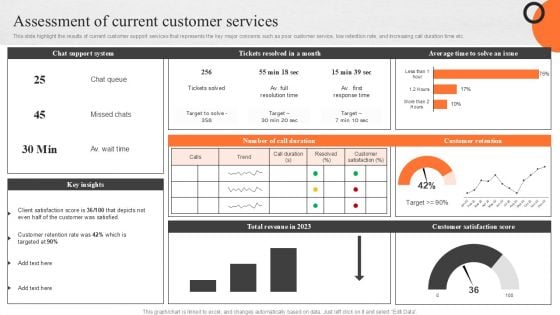
Enhancing Buyer Journey Assessment Of Current Customer Services Diagrams PDF
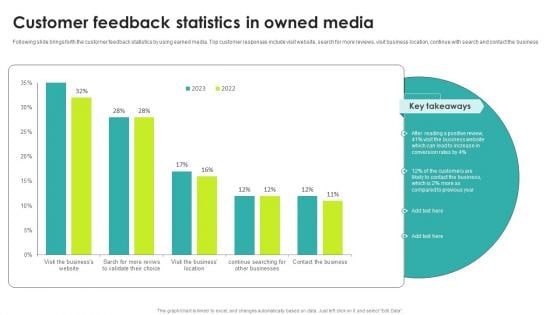
Customer Feedback Statistics In Owned Media Diagrams PDF
Following slide brings forth the customer feedback statistics by using earned media. Top customer responses include visit website, search for more reviews, visit business location, continue with search and contact the business Pitch your topic with ease and precision using this Customer Feedback Statistics In Owned Media Diagrams PDF. This layout presents information on Key Takeaways, Media, Customer. It is also available for immediate download and adjustment. So, changes can be made in the color, design, graphics or any other component to create a unique layout.
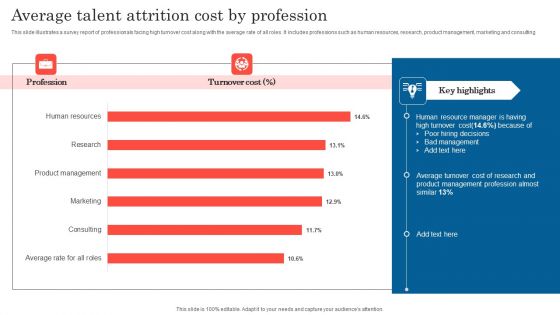
Average Talent Attrition Cost By Profession Diagrams PDF
This slide illustrates a survey report of professionals facing high turnover cost along with the average rate of all roles. It includes professions such as human resources, research, product management, marketing and consulting. Pitch your topic with ease and precision using this Average Talent Attrition Cost By Profession Diagrams PDF. This layout presents information on Human Resource Manager, Key Highlights, Bad Management. It is also available for immediate download and adjustment. So, changes can be made in the color, design, graphics or any other component to create a unique layout.
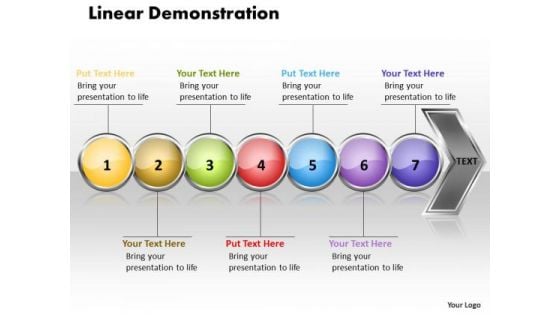
Ppt Linear Demonstration Of 7 Concepts PowerPoint Templates
PPT linear demonstration of 7 concepts PowerPoint Templates-The above diagram displays a Picture of a a Seven colorful stages represented by circles combined to form an arrow pointing in east direction. This image Portrays the concept of Process completion with great heights and Success. You can apply other 3D Styles and shapes to the slide to enhance your presentations.-PPT linear demonstration of 7 concepts PowerPoint Templates-Linear, Flow, Arrow, Background, Process, Business, Chart, Diagram, Financial, Graphic, Gray, Icon, Illustration, Management, Orange, Perspective, Process, Reflection, Stage, Spheres, Text, Extract the essence with our Ppt Linear Demonstration Of 7 Concepts PowerPoint Templates. Your thoughts will highlight the key conditions.
Human Resource Organizational Management Approaches For Workforce Icon Diagrams PDF
This slide shows the effective workforce management approaches to attract, hire and retain the top talent in the organization. It includes the strategic approach, management approach, proactive approach, reactive approach, commodity approach and human resource approach etc. Persuade your audience using this Human Resource Organizational Management Approaches For Workforce Icon Diagrams PDF. This PPT design covers three stages, thus making it a great tool to use. It also caters to a variety of topics including Key Practices, Focus Areas, Approaches. Download this PPT design now to present a convincing pitch that not only emphasizes the topic but also showcases your presentation skills.
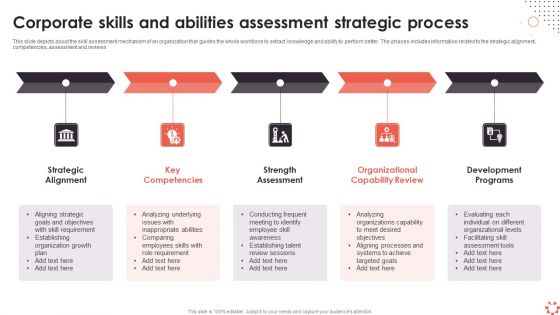
Corporate Skills And Abilities Assessment Strategic Process Ppt Professional Designs PDF
This slide depicts about the skill assessment mechanism of an organization that guides the whole workforce to extract knowledge and ability to perform better. The phases includes information related to the strategic alignment, competencies, assessment and reviews. Persuade your audience using this Corporate Skills And Abilities Assessment Strategic Process Ppt Professional Designs PDF. This PPT design covers five stages, thus making it a great tool to use. It also caters to a variety of topics including Strategic Alignment, Key Competencies, Strength Assessment. Download this PPT design now to present a convincing pitch that not only emphasizes the topic but also showcases your presentation skills.
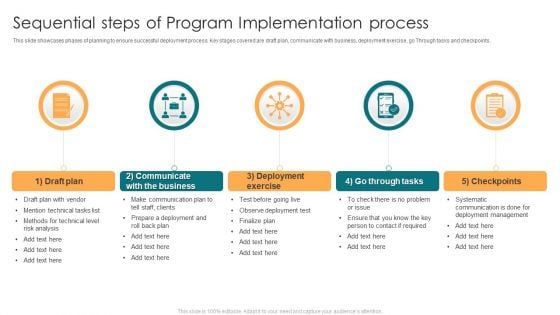
Sequential Steps Of Program Implementation Process Ppt Guide PDF
This slide showcases phases of planning to ensure successful deployment process. Key stages covered are draft plan, communicate with business, deployment exercise, go Through tasks and checkpoints. Persuade your audience using this Sequential Steps Of Program Implementation Process Ppt Guide PDF. This PPT design covers five stages, thus making it a great tool to use. It also caters to a variety of topics including Draft Plan, Deployment Exercise, Go Through Tasks, Checkpoints. Download this PPT design now to present a convincing pitch that not only emphasizes the topic but also showcases your presentation skills.
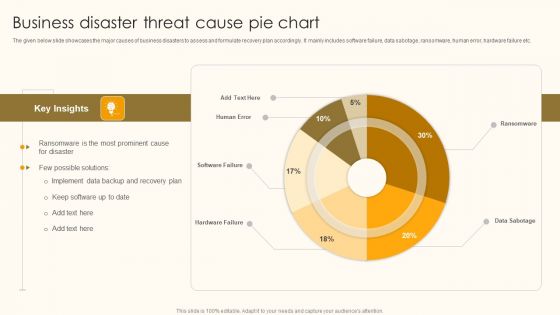
Business Disaster Threat Cause Pie Chart Ppt Pictures Gallery PDF
The given below slide showcases the major causes of business disasters to assess and formulate recovery plan accordingly. It mainly includes software failure, data sabotage, ransomware, human error, hardware failure etc. Showcasing this set of slides titled Business Disaster Threat Cause Pie Chart Ppt Pictures Gallery PDF. The topics addressed in these templates are Key Insights, Few Possible Solutions, Implement Data Backup. All the content presented in this PPT design is completely editable. Download it and make adjustments in color, background, font etc. as per your unique business setting.
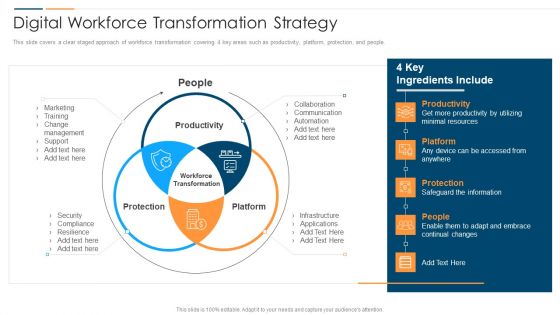
Revolution In Online Business Digital Workforce Transformation Strategy Diagrams PDF
This slide covers a clear staged approach of workforce transformation covering 4 key areas such as productivity, platform, protection, and people. This is a Revolution In Online Business Digital Workforce Transformation Strategy Diagrams PDF template with various stages. Focus and dispense information on three stages using this creative set, that comes with editable features. It contains large content boxes to add your information on topics like People Productivity Protection, Platform Infrastructure Applications. You can also showcase facts, figures, and other relevant content using this PPT layout. Grab it now.


 Continue with Email

 Home
Home


