Kpi Dashboard
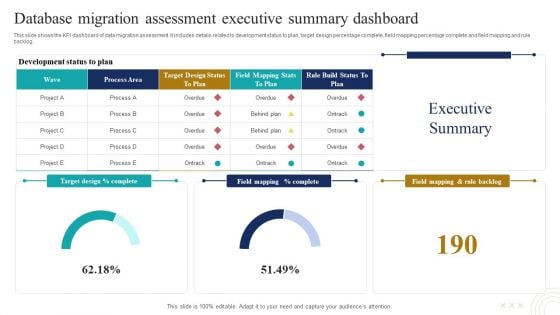
Database Migration Assessment Executive Summary Dashboard Mockup PDF
This slide shows the KPI dashboard of data migration assessment. It includes details related to development status to plan, target design percentage complete, field mapping percentage complete and field mapping and rule backlog. Pitch your topic with ease and precision using this Database Migration Assessment Executive Summary Dashboard Mockup PDF. This layout presents information on Wave, Process Area, Rule Build Status Plan. It is also available for immediate download and adjustment. So, changes can be made in the color, design, graphics or any other component to create a unique layout
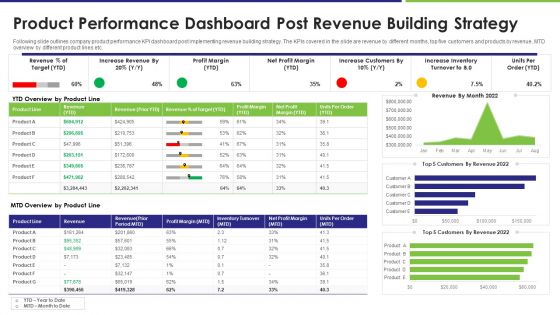
Product Performance Dashboard Post Revenue Building Strategy Brochure PDF
Following slide outlines company product performance KPI dashboard post implementing revenue building strategy. The KPIs covered in the slide are revenue by different months, top five customers and products by revenue, MTD overview by different product lines etc. Showcasing this set of slides titled product performance dashboard post revenue building strategy brochure pdf. The topics addressed in these templates are revenue, target, profit margin. All the content presented in this PPT design is completely editable. Download it and make adjustments in color, background, font etc. as per your unique business setting.
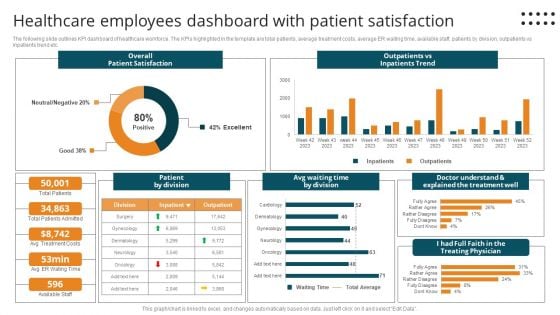
Healthcare Employees Dashboard With Patient Satisfaction Mockup PDF
The following slide outlines KPI dashboard of healthcare workforce. The KPIs highlighted in the template are total patients, average treatment costs, average ER waiting time, available staff, patients by division, outpatients vs inpatients trend etc.Pitch your topic with ease and precision using this Healthcare Employees Dashboard With Patient Satisfaction Mockup PDF. This layout presents information on Patient Satisfaction, Outpatients Inpatients Trend, Doctor Understand. It is also available for immediate download and adjustment. So, changes can be made in the color, design, graphics or any other component to create a unique layout.
Facebook Ad Campaign Performance Tracking Dashboard Microsoft PDF
This slide represents the KPI dashboard to effectively measure and monitor performance of Facebook marketing campaign conducted by the organization to enhance customer engagement. It includes details related to KPIs such as ad impressions, ad reach etc. From laying roadmaps to briefing everything in detail, our templates are perfect for you. You can set the stage with your presentation slides. All you have to do is download these easy-to-edit and customizable templates. Facebook Ad Campaign Performance Tracking Dashboard Microsoft PDF will help you deliver an outstanding performance that everyone would remember and praise you for. Do download this presentation today.
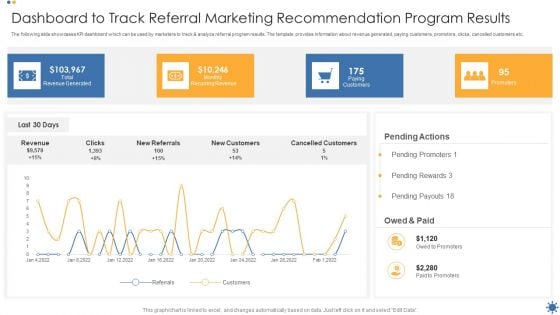
Dashboard To Track Referral Marketing Recommendation Program Results Structure PDF
The following slide showcases KPI dashboard which can be used by marketers to track and analyze referral program results. The template provides information about revenue generated, paying customers, promotors, clicks, cancelled customers etc. Showcasing this set of slides titled Dashboard To Track Referral Marketing Recommendation Program Results Structure PDF. The topics addressed in these templates are Revenue Generated, Recurring Revenue, Paying Customers. All the content presented in this PPT design is completely editable. Download it and make adjustments in color, background, font etc. as per your unique business setting.
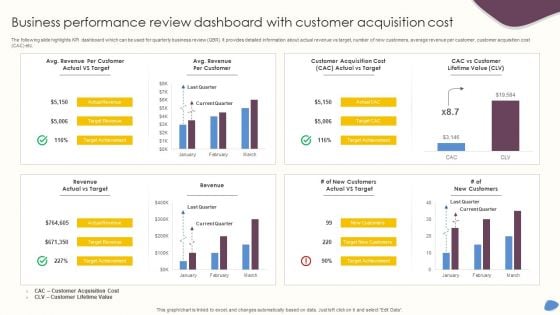
Business Performance Review Dashboard With Customer Acquisition Cost Diagrams PDF
The following slide highlights KPI dashboard which can be used for quarterly business review QBR. It provides detailed information about actual revenue vs target, number of new customers, average revenue per customer, customer acquisition cost CAC etc. Pitch your topic with ease and precision using this Business Performance Review Dashboard With Customer Acquisition Cost Diagrams PDF. This layout presents information on Revenue, Customer Acquisition Cost, Current Quarter. It is also available for immediate download and adjustment. So, changes can be made in the color, design, graphics or any other component to create a unique layout.
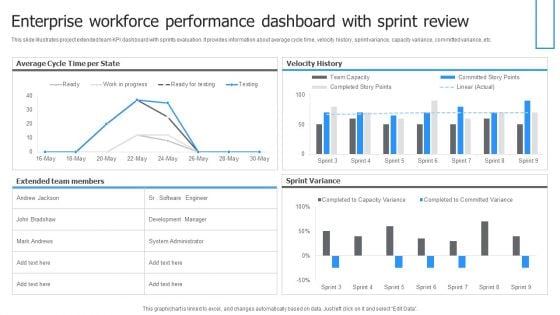
Enterprise Workforce Performance Dashboard With Sprint Review Themes PDF
This slide illustrates project extended team KPI dashboard with sprints evaluation. It provides information about average cycle time, velocity history, sprint variance, capacity variance, committed variance, etc. Showcasing this set of slides titled Enterprise Workforce Performance Dashboard With Sprint Review Themes PDF. The topics addressed in these templates are Velocity History, Sprint Variance, Average Cycle, Time Per State. All the content presented in this PPT design is completely editable. Download it and make adjustments in color, background, font etc. as per your unique business setting.

Media Of Mass Communication Marketing Campaign Assessment Dashboard Summary PDF
This slide covers mass media marketing campaign assessment KPI dashboard. It involves details such as total campaign cost, total impressions, click through rate, conversion rate and cost per click. Showcasing this set of slides titled Media Of Mass Communication Marketing Campaign Assessment Dashboard Summary PDF. The topics addressed in these templates are Total Impression, Click Through Rate, Ad Impressions, Conversions. All the content presented in this PPT design is completely editable. Download it and make adjustments in color, background, font etc. as per your unique business setting.
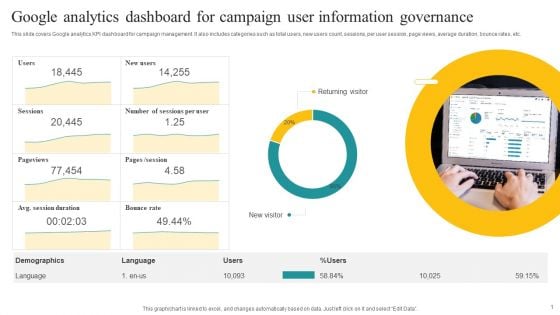
Google Analytics Dashboard For Campaign User Information Governance Demonstration PDF
This slide covers Google analytics KPI dashboard for campaign management. It also includes categories such as total users, new users count, sessions, per user session, page views, average duration, bounce rates, etc. Showcasing this set of slides titled Google Analytics Dashboard For Campaign User Information Governance Demonstration PDF. The topics addressed in these templates are Returning Visitor, New Visitor, Demographics. All the content presented in this PPT design is completely editable. Download it and make adjustments in color, background, font etc. as per your unique business setting.
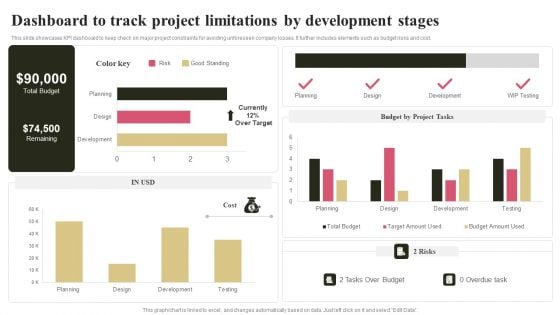
Dashboard To Track Project Limitations By Development Stages Ideas PDF
This slide showcases KPI dashboard to keep check on major project constraints for avoiding unforeseen company losses. It further includes elements such as budget risks and cost. Pitch your topic with ease and precision using this Dashboard To Track Project Limitations By Development Stages Ideas PDF. This layout presents information on Budget By Project Tasks, Risks. It is also available for immediate download and adjustment. So, changes can be made in the color, design, graphics or any other component to create a unique layout.
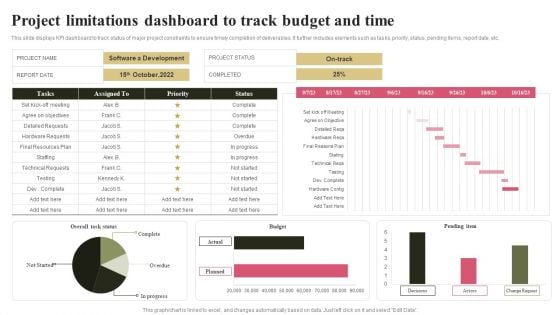
Project Limitations Dashboard To Track Budget And Time Mockup PDF
This slide displays KPI dashboard to track status of major project constraints to ensure timely completion of deliverables. It further includes elements such as tasks, priority, status, pending items, report date, etc. Showcasing this set of slides titled Project Limitations Dashboard To Track Budget And Time Mockup PDF. The topics addressed in these templates are Overall Task Status, Budget Pending, Item. All the content presented in this PPT design is completely editable. Download it and make adjustments in color, background, font etc. as per your unique business setting.
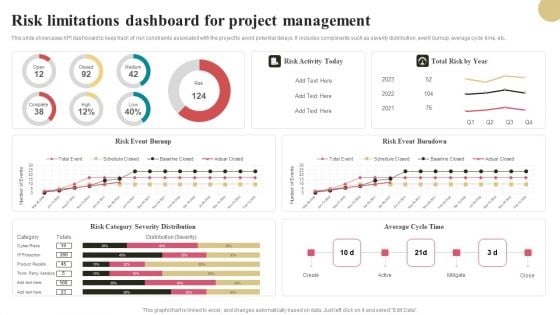
Risk Limitations Dashboard For Project Management Elements PDF
This slide showcases KPI dashboard to keep track of risk constraints associated with the project to avoid potential delays. It includes components such as severity distribution, event burnup, average cycle time, etc. Showcasing this set of slides titled Risk Limitations Dashboard For Project Management Elements PDF. The topics addressed in these templates are Risk Activity Today, Risk Event Burndown, Average Cycle Time. All the content presented in this PPT design is completely editable. Download it and make adjustments in color, background, font etc. as per your unique business setting.

Dashboard For Transaction Overview By Purchase Currency Template PDF
The following slide displays KPI dashboard to track transaction summary for buying and selling of foreign currency. It includes elements such as net settlement, total fees, reverse activity, refunds, sales, count, etc. Pitch your topic with ease and precision using this Dashboard For Transaction Overview By Purchase Currency Template PDF. This layout presents information on Purchase Currency, Reconciliation Activity, Returned Payment. It is also available for immediate download and adjustment. So, changes can be made in the color, design, graphics or any other component to create a unique layout.
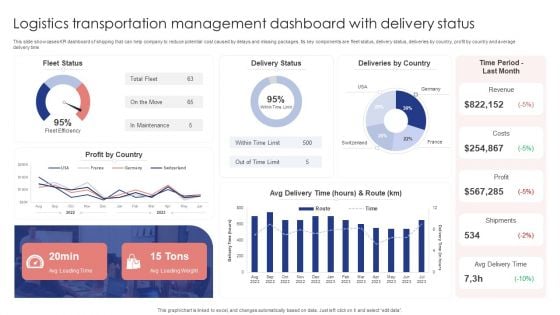
Logistics Transportation Management Dashboard With Delivery Status Portrait PDF
This slide showcases KPI dashboard of shipping that can help company to reduce potential cost caused by delays and missing packages. Its key components are fleet status, delivery status, deliveries by country, profit by country and average delivery time. Showcasing this set of slides titled Logistics Transportation Management Dashboard With Delivery Status Portrait PDF. The topics addressed in these templates are Fleet Status, Delivery Status, Deliveries By Country. All the content presented in this PPT design is completely editable. Download it and make adjustments in color, background, font etc. as per your unique business setting.
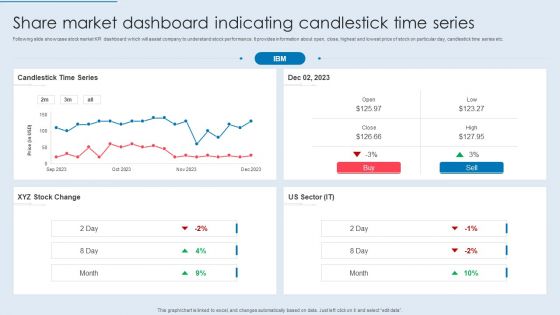
Share Market Dashboard Indicating Candlestick Time Series Formats PDF
Following slide showcase stock market KPI dashboard which will assist company to understand stock performance. It provides information about open, close, highest and lowest price of stock on particular day, candlestick time series etc. Pitch your topic with ease and precision using this Share Market Dashboard Indicating Candlestick Time Series Formats PDF. This layout presents information on Candlestick Time Series, Stock Change, US Sector. It is also available for immediate download and adjustment. So, changes can be made in the color, design, graphics or any other component to create a unique layout.
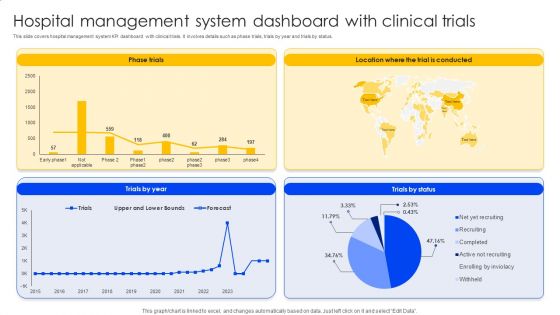
Hospital Management System Dashboard With Clinical Trials Background PDF
This slide covers hospital management system KPI dashboard with clinical trials. It involves details such as phase trials, trials by year and trials by status. Take your projects to the next level with our ultimate collection of Hospital Management System Dashboard With Clinical Trials Background PDF. Slidegeeks has designed a range of layouts that are perfect for representing task or activity duration, keeping track of all your deadlines at a glance. Tailor these designs to your exact needs and give them a truly corporate look with your own brand colors they will make your projects stand out from the rest.

Enterprise Recruitment Dashboard With Cost Per Hire Graphics PDF
The following slide showcases KPI dashboard to get real- time insights about efficiency of corporate staffing process in the organization. It includes elements such as hired, days to fill, sources contribution, etc. Pitch your topic with ease and precision using this Enterprise Recruitment Dashboard With Cost Per Hire Graphics PDF. This layout presents information on Enterprise, Contribution, Cost. It is also available for immediate download and adjustment. So, changes can be made in the color, design, graphics or any other component to create a unique layout.
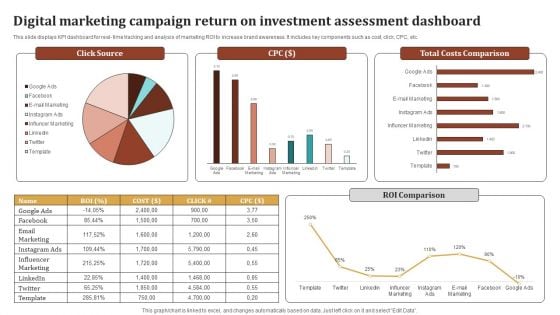
Digital Marketing Campaign Return On Investment Assessment Dashboard Ideas PDF
This slide displays KPI dashboard for real- time tracking and analysis of marketing ROI to increase brand awareness. It includes key components such as cost, click, CPC, etc. Showcasing this set of slides titled Digital Marketing Campaign Return On Investment Assessment Dashboard Ideas PDF. The topics addressed in these templates are Influencer Marketing, Email Marketing, Total Costs Comparison, Roi Comparison. All the content presented in this PPT design is completely editable. Download it and make adjustments in color, background, font etc. as per your unique business setting.
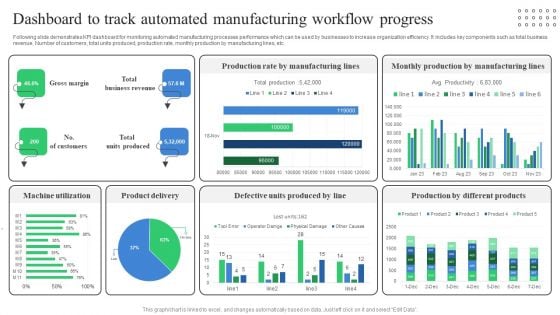
Dashboard To Track Automated Manufacturing Workflow Progress Professional PDF
Following slide demonstrates KPI dashboard for monitoring automated manufacturing processes performance which can be used by businesses to increase organization efficiency. It includes key components such as total business revenue, Number of customers, total units produced, production rate, monthly production by manufacturing lines, etc. Showcasing this set of slides titled Dashboard To Track Automated Manufacturing Workflow Progress Professional PDF. The topics addressed in these templates are Machine Utilization, Product Delivery, Defective Units Produced. All the content presented in this PPT design is completely editable. Download it and make adjustments in color, background, font etc. as per your unique business setting.
Dashboard For Tracking Digital Media Outreach Strategy Formats PDF
This slide highlights the KPI dashboard to track progress for digital media and PR relations. The purpose of this slide is to help the manager track the success of digital media and PR strategies employed for increasing brand awareness. Showcasing this set of slides titled Dashboard For Tracking Digital Media Outreach Strategy Formats PDF. The topics addressed in these templates are Social Media Posts, Press Releases Issued, Blogs Published . All the content presented in this PPT design is completely editable. Download it and make adjustments in color, background, font etc. as per your unique business setting.
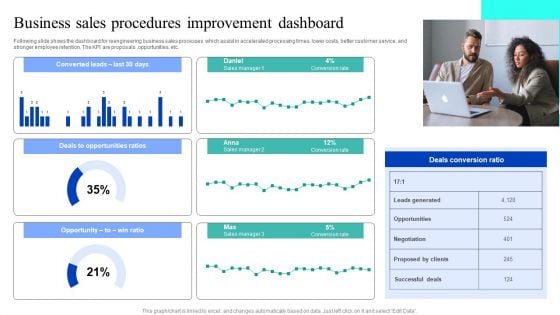
Business Sales Procedures Improvement Dashboard Designs PDF
Following slide shows the dashboard for reengineering business sales processes which assist in accelerated processing times, lower costs, better customer service, and stronger employee retention. The KPI are proposals ,opportunities, etc. Pitch your topic with ease and precision using this Business Sales Procedures Improvement Dashboard Designs PDF. This layout presents information on Deals Opportunities Ratios, Opportunity, Deals Conversion Ratio. It is also available for immediate download and adjustment. So, changes can be made in the color, design, graphics or any other component to create a unique layout.
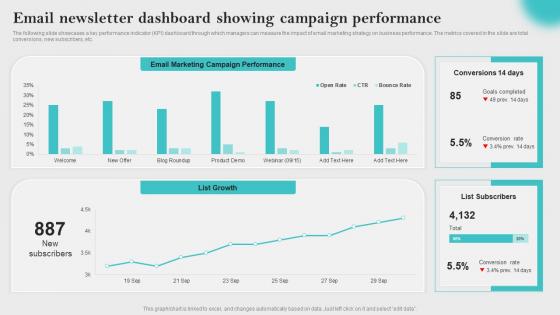
Email Newsletter Dashboard Innovative Business Promotion Ideas Sample Pdf
The following slide showcases a key performance indicator KPI dashboard through which managers can measure the impact of email marketing strategy on business performance. The metrics covered in the slide are total conversions, new subscribers, etc. Formulating a presentation can take up a lot of effort and time, so the content and message should always be the primary focus. The visuals of the PowerPoint can enhance the presenters message, so our Email Newsletter Dashboard Innovative Business Promotion Ideas Sample Pdf was created to help save time. Instead of worrying about the design, the presenter can concentrate on the message while our designers work on creating the ideal templates for whatever situation is needed. Slidegeeks has experts for everything from amazing designs to valuable content, we have put everything into Email Newsletter Dashboard Innovative Business Promotion Ideas Sample Pdf The following slide showcases a key performance indicator KPI dashboard through which managers can measure the impact of email marketing strategy on business performance. The metrics covered in the slide are total conversions, new subscribers, etc.
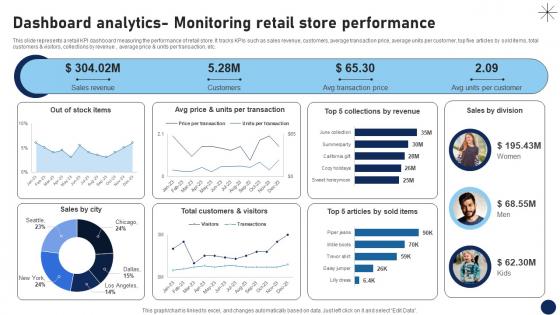
Dashboard Analytics Monitoring Retail Store Performance DT SS V
This slide represents a retail KPI dashboard measuring the performance of retail store. It tracks KPIs such as sales revenue, customers, average transaction price, average units per customer, top five articles by sold items, total customers and visitors, collections by revenue , average price and units per transaction, etc.Are you in need of a template that can accommodate all of your creative concepts This one is crafted professionally and can be altered to fit any style. Use it with Google Slides or PowerPoint. Include striking photographs, symbols, depictions, and other visuals. Fill, move around, or remove text boxes as desired. Test out color palettes and font mixtures. Edit and save your work, or work with colleagues. Download Dashboard Analytics Monitoring Retail Store Performance DT SS V and observe how to make your presentation outstanding. Give an impeccable presentation to your group and make your presentation unforgettable. This slide represents a retail KPI dashboard measuring the performance of retail store. It tracks KPIs such as sales revenue, customers, average transaction price, average units per customer, top five articles by sold items, total customers and visitors, collections by revenue , average price and units per transaction, etc.
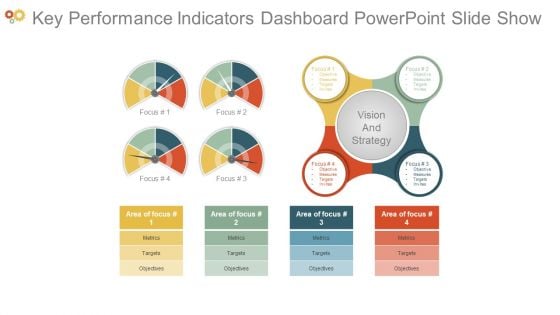
Key Performance Indicators Dashboard Powerpoint Slide Show
This is a key performance indicators dashboard powerpoint slide show. This is a four stage process. The stages in this process are focus, objective, measures, targets, invites, vision and strategy, area of focus, metrics, objectives.
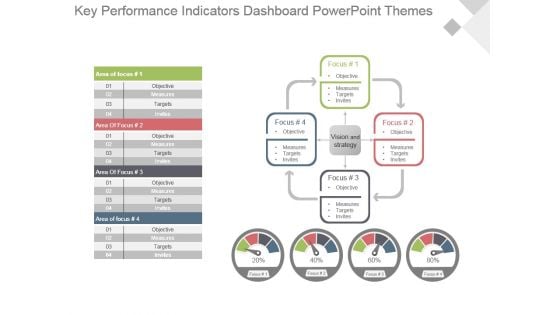
Key Performance Indicators Dashboard Powerpoint Themes
This is a key performance indicators dashboard powerpoint themes. This is a four stage process. The stages in this process are focus, objective, measures, targets, invites, vision and strategy, area of focus.
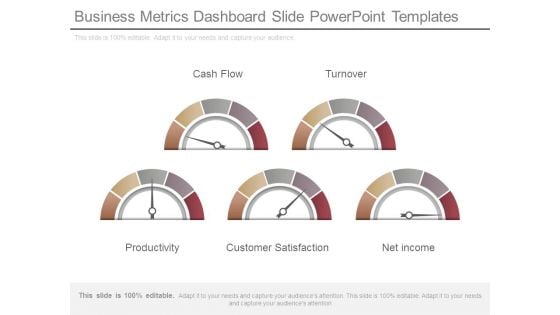
Business Metrics Dashboard Slide Powerpoint Templates
This is a business metrics dashboard slide powerpoint templates. This is a five stage process. The stages in this process are cash flow, turnover, productivity, customer satisfaction, net income.
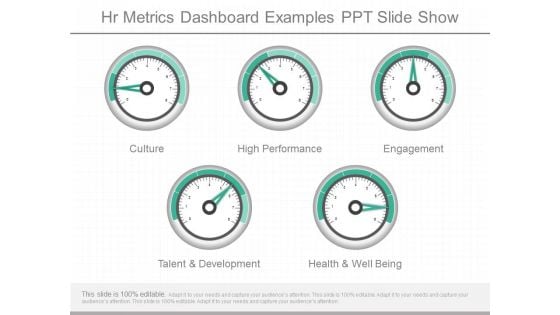
Hr Metrics Dashboard Examples Ppt Slide Show
This is a hr metrics dashboard examples ppt slide show. This is a five stage process. The stages in this process are culture, high performance, engagement, talent and development, health and well being.
Business Operations Metrics Dashboard Icon Graphics PDF
Showcasing this set of slides titled Business Operations Metrics Dashboard Icon Graphics PDF. The topics addressed in these templates are Business Operations, Metrics Dashboard Icon. All the content presented in this PPT design is completely editable. Download it and make adjustments in color, background, font etc. as per your unique business setting.
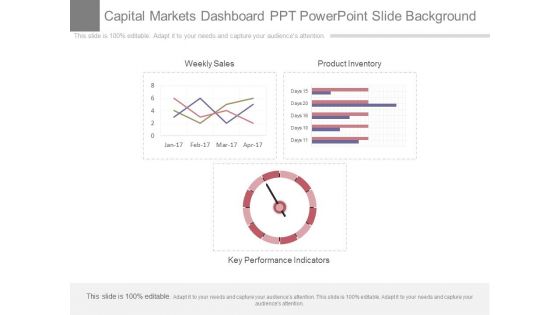
Capital Markets Dashboard Ppt Powerpoint Slide Background
This is a capital markets dashboard ppt powerpoint slide background. This is a three stage process. The stages in this process are weekly sales, product inventory, key performance indicators.
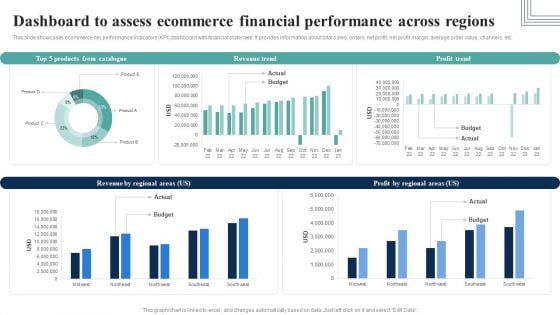
Dashboard To Assess Ecommerce Financial Performance Across Regions Infographics PDF
This slide showcases ecommerce key performance indicators KPI dashboard with financial statement. It provides information about total sales, orders, net profit, net profit margin, average order value, channels, etc.Here you can discover an assortment of the finest PowerPoint and Google Slides templates. With these templates, you can create presentations for a variety of purposes while simultaneously providing your audience with an eye-catching visual experience. Download Dashboard To Assess Ecommerce Financial Performance Across Regions Infographics PDF to deliver an impeccable presentation. These templates will make your job of preparing presentations much quicker, yet still, maintain a high level of quality. Slidegeeks has experienced researchers who prepare these templates and write high-quality content for you. Later on, you can personalize the content by editing the Dashboard To Assess Ecommerce Financial Performance Across Regions Infographics PDF.
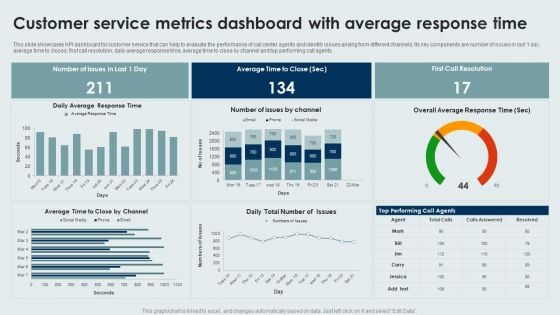
Customer Service Metrics Dashboard With Average Response Time Formats PDF
This slide showcases KPI dashboard for customer service that can help to evaluate the performance of call center agents and identify issues arising from different channels. Its key components are number of issues in last 1 day, average time to closes, first call resolution, daily average response time, average time to close by channel and top performing call agents. Pitch your topic with ease and precision using this Customer Service Metrics Dashboard With Average Response Time Formats PDF. This layout presents information on Customer Service, Metrics Dashboard, Average Response Time. It is also available for immediate download and adjustment. So, changes can be made in the color, design, graphics or any other component to create a unique layout.
Work From Home Performance Management Dashboard Icons PDF
The following slide outlines a comprehensive key performance indicator KPI dashboard that can be used to showcase employees performance during work from home WFH. Information covered in this slide is related to average result area scores etc. Do you have to make sure that everyone on your team knows about any specific topic. I yes, then you should give Work From Home Performance Management Dashboard Icons PDF a try. Our experts have put a lot of knowledge and effort into creating this impeccable Work From Home Performance Management Dashboard Icons PDF. You can use this template for your upcoming presentations, as the slides are perfect to represent even the tiniest detail. You can download these templates from the Slidegeeks website and these are easy to edit. So grab these today.
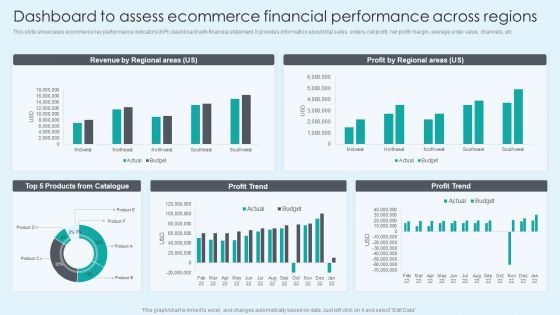
Dashboard To Assess Ecommerce Financial Performance Across Regions Themes PDF
This slide showcases ecommerce key performance indicators KPI dashboard with financial statement. It provides information about total sales, orders, net profit, net profit margin, average order value, channels, etc. Here you can discover an assortment of the finest PowerPoint and Google Slides templates. With these templates, you can create presentations for a variety of purposes while simultaneously providing your audience with an eye catching visual experience. Download Dashboard To Assess Ecommerce Financial Performance Across Regions Themes PDF to deliver an impeccable presentation. These templates will make your job of preparing presentations much quicker, yet still, maintain a high level of quality. Slidegeeks has experienced researchers who prepare these templates and write high quality content for you. Later on, you can personalize the content by editing the Dashboard To Assess Ecommerce Financial Performance Across Regions Themes PDF.
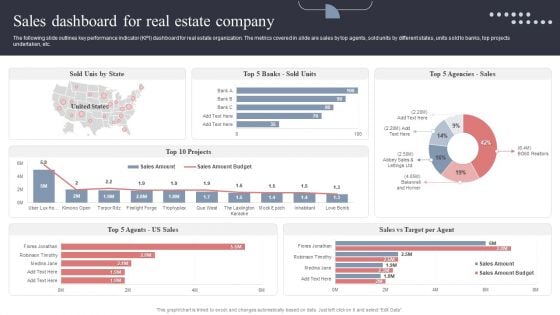
Sales Dashboard For Real Estate Company Topics PDF
The following slide outlines key performance indicator KPI dashboard for real estate organization. The metrics covered in slide are sales by top agents, sold units by different states, units sold to banks, top projects undertaken, etc. This Sales Dashboard For Real Estate Company Topics PDF is perfect for any presentation, be it in front of clients or colleagues. It is a versatile and stylish solution for organizing your meetings. The Sales Dashboard For Real Estate Company Topics PDF features a modern design for your presentation meetings. The adjustable and customizable slides provide unlimited possibilities for acing up your presentation. Slidegeeks has done all the homework before launching the product for you. So, do not wait, grab the presentation templates today
CRM Dashboard For Tracking Sales Pipeline Brochure PDF
This slide covers the CRM KPI dashboard for monitoring lead status in the sales funnel. It includes metrics such as open pipeline value, open pipeline by product package, pipeline value forecast, etc. Crafting an eye catching presentation has never been more straightforward. Let your presentation shine with this tasteful yet straightforward CRM Dashboard For Tracking Sales Pipeline Brochure PDF template. It offers a minimalistic and classy look that is great for making a statement. The colors have been employed intelligently to add a bit of playfulness while still remaining professional. Construct the ideal CRM Dashboard For Tracking Sales Pipeline Brochure PDF that effortlessly grabs the attention of your audience Begin now and be certain to wow your customers.
Dashboard For Tracking Aftersales Customer Services Team Performance Pictures PDF
This slide covers the KPI dashboard for ticket tracking. It includes metrics such as tickets by month, service level, and details of customer service department agents. Here you can discover an assortment of the finest PowerPoint and Google Slides templates. With these templates, you can create presentations for a variety of purposes while simultaneously providing your audience with an eye catching visual experience. Download Dashboard For Tracking Aftersales Customer Services Team Performance Pictures PDF to deliver an impeccable presentation. These templates will make your job of preparing presentations much quicker, yet still, maintain a high level of quality. Slidegeeks has experienced researchers who prepare these templates and write high quality content for you. Later on, you can personalize the content by editing the Dashboard For Tracking Aftersales Customer Services Team Performance Pictures PDF.
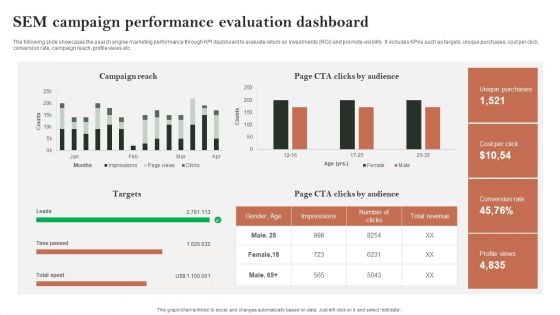
Search Engine Marketing Sem Campaign Performance Evaluation Dashboard Mockup PDF
The following slide showcases the search engine marketing performance through KPI dashboard to evaluate return on investments ROI and promote visibility. It includes KPAs such as targets, unique purchases, cost per click, conversion rate, campaign reach, profile views etc. Crafting an eye-catching presentation has never been more straightforward. Let your presentation shine with this tasteful yet straightforward Search Engine Marketing Sem Campaign Performance Evaluation Dashboard Mockup PDF template. It offers a minimalistic and classy look that is great for making a statement. The colors have been employed intelligently to add a bit of playfulness while still remaining professional. Construct the ideal Search Engine Marketing Sem Campaign Performance Evaluation Dashboard Mockup PDF that effortlessly grabs the attention of your audience Begin now and be certain to wow your customers.
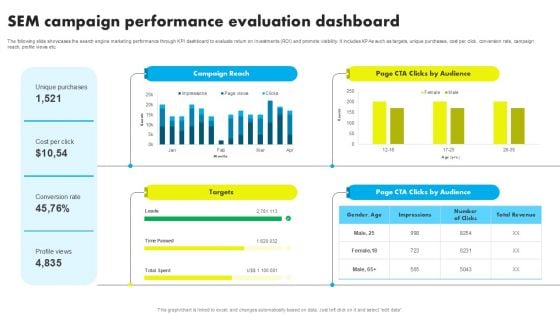
SEM Campaign Performance Evaluation Dashboard Ppt Icon Graphics Tutorials PDF
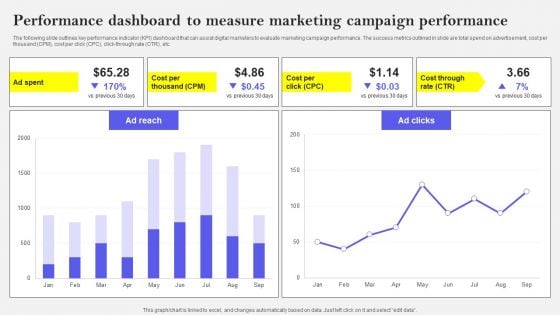
Performance Dashboard To Measure Marketing Campaign Performance Brochure PDF
The following slide outlines key performance indicator KPI dashboard that can assist digital marketers to evaluate marketing campaign performance. The success metrics outlined in slide are total spend on advertisement, cost per thousand CPM, cost per click CPC, click-through rate CTR, etc. Want to ace your presentation in front of a live audience Our Performance Dashboard To Measure Marketing Campaign Performance Brochure PDF can help you do that by engaging all the users towards you.. Slidegeeks experts have put their efforts and expertise into creating these impeccable powerpoint presentations so that you can communicate your ideas clearly. Moreover, all the templates are customizable, and easy-to-edit and downloadable. Use these for both personal and commercial use.
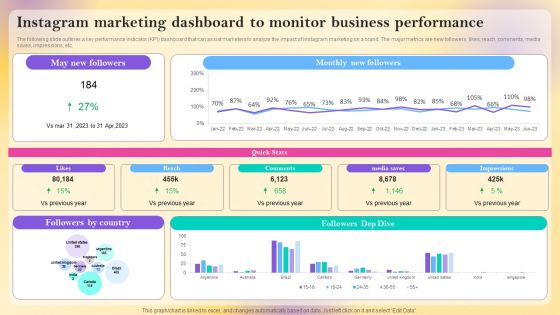
Instagram Marketing Dashboard To Monitor Business Performance Information PDF
The following slide outlines a key performance indicator KPI dashboard that can assist marketers to analyze the impact of Instagram marketing on a brand. The major metrics are new followers, likes, reach, comments, media saves, impressions, etc. This Instagram Marketing Dashboard To Monitor Business Performance Information PDF is perfect for any presentation, be it in front of clients or colleagues. It is a versatile and stylish solution for organizing your meetings. The product features a modern design for your presentation meetings. The adjustable and customizable slides provide unlimited possibilities for acing up your presentation. Slidegeeks has done all the homework before launching the product for you. So, do not wait, grab the presentation templates today
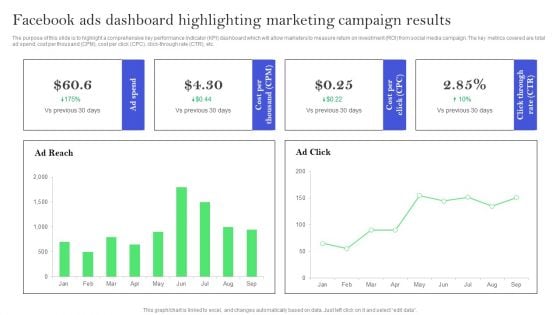
Facebook Ads Dashboard Highlighting Marketing Campaign Results Slides PDF
The purpose of this slide is to highlight a comprehensive key performance indicator KPI dashboard which will allow marketers to measure return on investment ROI from social media campaign. The key metrics covered are total ad spend, cost per thousand CPM, cost per click CPC, click through rate CTR, etc. From laying roadmaps to briefing everything in detail, our templates are perfect for you. You can set the stage with your presentation slides. All you have to do is download these easy to edit and customizable templates. Facebook Ads Dashboard Highlighting Marketing Campaign Results Slides PDF will help you deliver an outstanding performance that everyone would remember and praise you for. Do download this presentation today.
Email Marketing Campaign Kpis Tracking Dashboard Template PDF
This slide shows key performance indicators KPI dashboard for measuring the effectiveness of email campaigns. It provides information about sent, delivered, opens, clicks, unsubscribed, bounces, complaints, etc. Are you in need of a template that can accommodate all of your creative concepts This one is crafted professionally and can be altered to fit any style. Use it with Google Slides or PowerPoint. Include striking photographs, symbols, depictions, and other visuals. Fill, move around, or remove text boxes as desired. Test out color palettes and font mixtures. Edit and save your work, or work with colleagues. Download Email Marketing Campaign Kpis Tracking Dashboard Template PDF and observe how to make your presentation outstanding. Give an impeccable presentation to your group and make your presentation unforgettable.
Dashboard For Tracking Aftersales Customer Services Team Performance Portrait PDF
This slide covers the KPI dashboard for ticket tracking. It includes metrics such as tickets by month, service level, and details of customer service department agents. Retrieve professionally designed Dashboard For Tracking Aftersales Customer Services Team Performance Portrait PDF to effectively convey your message and captivate your listeners. Save time by selecting pre-made slideshows that are appropriate for various topics, from business to educational purposes. These themes come in many different styles, from creative to corporate, and all of them are easily adjustable and can be edited quickly. Access them as PowerPoint templates or as Google Slides themes. You do not have to go on a hunt for the perfect presentation because Slidegeeks got you covered from everywhere.
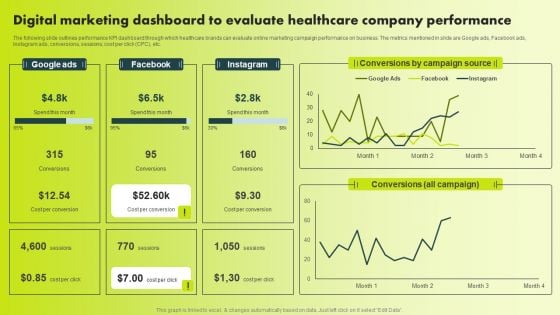
Digital Marketing Dashboard To Evaluate Healthcare Company Performance Template PDF
The following slide outlines performance KPI dashboard through which healthcare brands can evaluate online marketing campaign performance on business. The metrics mentioned in slide are Google ads, Facebook ads, Instagram ads, conversions, sessions, cost per click CPC, etc. Slidegeeks has constructed Digital Marketing Dashboard To Evaluate Healthcare Company Performance Template PDF after conducting extensive research and examination. These presentation templates are constantly being generated and modified based on user preferences and critiques from editors. Here, you will find the most attractive templates for a range of purposes while taking into account ratings and remarks from users regarding the content. This is an excellent jumping-off point to explore our content and will give new users an insight into our top-notch PowerPoint Templates.
Social Media Marketing Performance Tracking Dashboard Inspiration PDF
Following slide displays KPI dashboard that can be used to monitor the performance of social media marketing campaign. Metrics covered are related to fans number, engagement rate and page impressions.This Social Media Marketing Performance Tracking Dashboard Inspiration PDF from Slidegeeks makes it easy to present information on your topic with precision. It provides customization options, so you can make changes to the colors, design, graphics, or any other component to create a unique layout. It is also available for immediate download, so you can begin using it right away. Slidegeeks has done good research to ensure that you have everything you need to make your presentation stand out. Make a name out there for a brilliant performance.
Tiktok Marketing Campaign Performance Tracking Dashboard Background PDF
This slide represents the KPI dashboard to effective track and monitor TikTok marketing campaign conducted by the organization. It includes KPIs such as total cost, impressions, reach, clicks etc. Coming up with a presentation necessitates that the majority of the effort goes into the content and the message you intend to convey. The visuals of a PowerPoint presentation can only be effective if it supplements and supports the story that is being told. Keeping this in mind our experts created Tiktok Marketing Campaign Performance Tracking Dashboard Background PDF to reduce the time that goes into designing the presentation. This way, you can concentrate on the message while our designers take care of providing you with the right template for the situation.
Facebook Ad Campaign Performance Tracking Dashboard Ppt Show Picture PDF
This slide represents the KPI dashboard to effectively measure and monitor performance of Facebook marketing campaign conducted by the organization to enhance customer engagement. It includes details related to KPIs such as ad impressions, ad reach etc. Are you in need of a template that can accommodate all of your creative concepts This one is crafted professionally and can be altered to fit any style. Use it with Google Slides or PowerPoint. Include striking photographs, symbols, depictions, and other visuals. Fill, move around, or remove text boxes as desired. Test out color palettes and font mixtures. Edit and save your work, or work with colleagues. Download Facebook Ad Campaign Performance Tracking Dashboard Ppt Show Picture PDF and observe how to make your presentation outstanding. Give an impeccable presentation to your group and make your presentation unforgettable.
Facebook Ad Campaign Performance Tracking Dashboard Ppt Ideas Objects PDF
This slide represents the KPI dashboard to effectively measure and monitor performance of Facebook marketing campaign conducted by the organization to enhance customer engagement. It includes details related to KPIs such as ad impressions, ad reach etc. Are you in need of a template that can accommodate all of your creative concepts This one is crafted professionally and can be altered to fit any style. Use it with Google Slides or PowerPoint. Include striking photographs, symbols, depictions, and other visuals. Fill, move around, or remove text boxes as desired. Test out color palettes and font mixtures. Edit and save your work, or work with colleagues. Download Facebook Ad Campaign Performance Tracking Dashboard Ppt Ideas Objects PDF and observe how to make your presentation outstanding. Give an impeccable presentation to your group and make your presentation unforgettable.
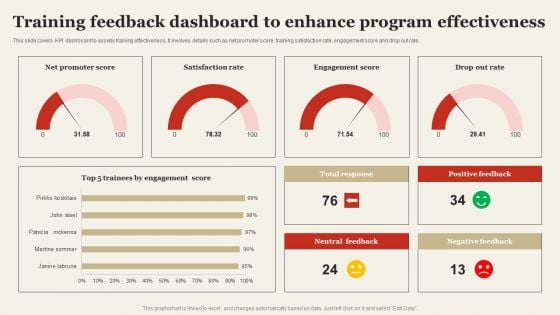
Training Feedback Dashboard To Enhance Program Effectiveness Themes PDF
This slide covers KPI dashboard to assess training effectiveness. It involves details such as net promoter score, training satisfaction rate, engagement score and drop out rate. Coming up with a presentation necessitates that the majority of the effort goes into the content and the message you intend to convey. The visuals of a PowerPoint presentation can only be effective if it supplements and supports the story that is being told. Keeping this in mind our experts created Training Feedback Dashboard To Enhance Program Effectiveness Themes PDF to reduce the time that goes into designing the presentation. This way, you can concentrate on the message while our designers take care of providing you with the right template for the situation.
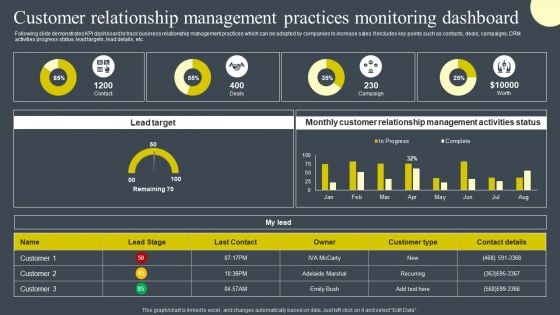
Customer Relationship Management Practices Monitoring Dashboard Designs PDF
Following slide demonstrates KPI dashboard to track business relationship management practices which can be adopted by companies to increase sales. It includes key points such as contacts, deals, campaigns, CRM activities progress status, lead targets, lead details, etc. Are you in need of a template that can accommodate all of your creative concepts This one is crafted professionally and can be altered to fit any style. Use it with Google Slides or PowerPoint. Include striking photographs, symbols, depictions, and other visuals. Fill, move around, or remove text boxes as desired. Test out color palettes and font mixtures. Edit and save your work, or work with colleagues. Download Customer Relationship Management Practices Monitoring Dashboard Designs PDF and observe how to make your presentation outstanding. Give an impeccable presentation to your group and make your presentation unforgettable.
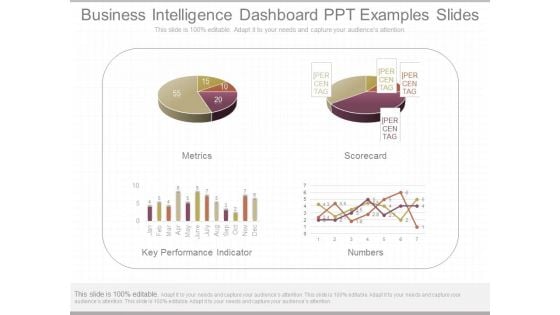
Business Intelligence Dashboard Ppt Examples Slides
This is a business intelligence dashboard ppt examples slides. This is a four stage process. The stages in this process are metrics, scorecard, key performance indicator, numbers.
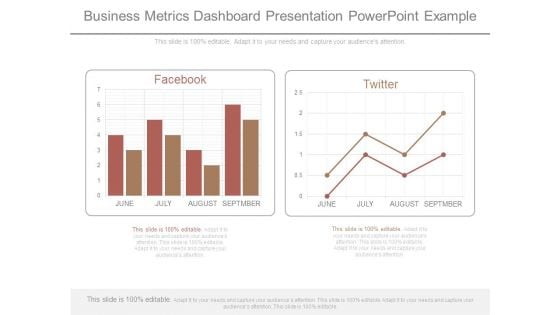
Business Metrics Dashboard Presentation Powerpoint Example
This is a business metrics dashboard presentation powerpoint example. This is a two stage process. The stages in this process are facebook, twitter.
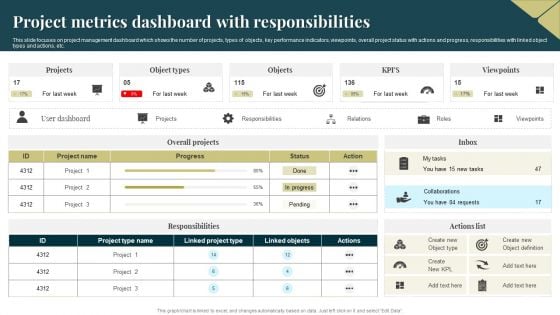
Project Metrics Dashboard With Responsibilities Graphics PDF
This slide focuses on project management dashboard which shows the number of projects, types of objects, key performance indicators, viewpoints, overall project status with actions and progress, responsibilities with linked object types and actions, etc. Pitch your topic with ease and precision using this Project Metrics Dashboard With Responsibilities Graphics PDF. This layout presents information on Project Metrics, Dashboard With Responsibilities. It is also available for immediate download and adjustment. So, changes can be made in the color, design, graphics or any other component to create a unique layout.
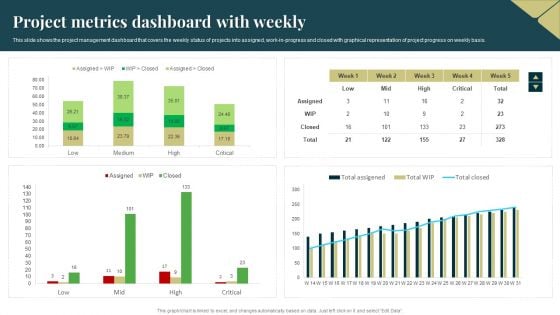
Project Metrics Dashboard With Weekly Formats PDF
This slide shows the project management dashboard that covers the weekly status of projects into assigned, work in progress and closed with graphical representation of project progress on weekly basis. Showcasing this set of slides titled Project Metrics Dashboard With Weekly Formats PDF. The topics addressed in these templates are Project Metrics, Dashboard With Weekly. All the content presented in this PPT design is completely editable. Download it and make adjustments in color, background, font etc. as per your unique business setting.
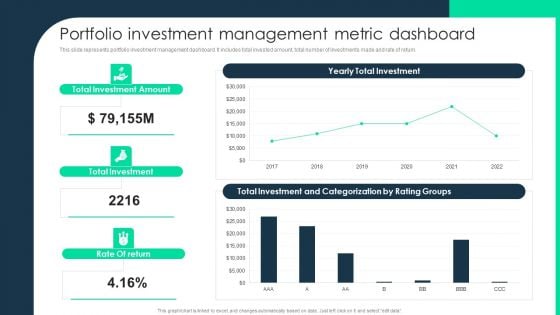
Portfolio Investment Management Metric Dashboard Brochure PDF
This slide represents portfolio investment management dashboard. It includes total invested amount, total number of investments made and rate of return. Deliver an awe inspiring pitch with this creative Portfolio Investment Management Metric Dashboard Brochure PDF bundle. Topics like Portfolio Investment Management, Metric Dashboard can be discussed with this completely editable template. It is available for immediate download depending on the needs and requirements of the user.
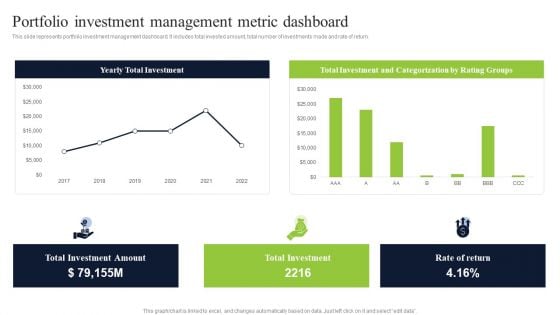
Portfolio Investment Management Metric Dashboard Slides PDF
This slide represents portfolio investment management dashboard. It includes total invested amount, total number of investments made and rate of return. Deliver an awe inspiring pitch with this creative Portfolio Investment Management Metric Dashboard Slides PDF bundle. Topics like Portfolio Investment Management, Metric Dashboard can be discussed with this completely editable template. It is available for immediate download depending on the needs and requirements of the user.
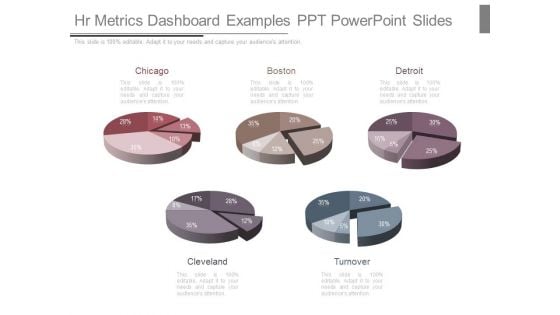
Hr Metrics Dashboard Examples Ppt Powerpoint Slides
This is a hr metrics dashboard examples ppt powerpoint slides. This is a five stage process. The stages in this process are chicago, boston, detroit, cleveland, turnover.
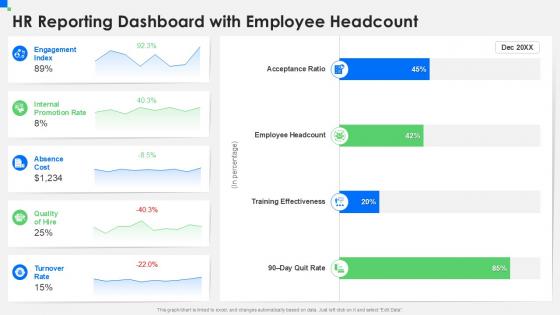
HR Reporting Dashboard With Employee Headcount
Do you have to make sure that everyone on your team knows about any specific topic I yes, then you should give HR Reporting Dashboard With Employee Headcount a try. Our experts have put a lot of knowledge and effort into creating this impeccable HR Reporting Dashboard With Employee Headcount. You can use this template for your upcoming presentations, as the slides are perfect to represent even the tiniest detail. You can download these templates from the Slidegeeks website and these are easy to edit. So grab these today Our HR Reporting Dashboard with Employee Headcount template is expertly designed to provide a visually appealing and organized layout for tracking and presenting key HR data. It offers a clear overview of employee metrics, helping you communicate important insights regarding workforce demographics and staffing levels.
Operational Risk Metrics Dashboard Icon Mockup PDF
Presenting Operational Risk Metrics Dashboard Icon Mockup PDF to dispense important information. This template comprises four stages. It also presents valuable insights into the topics including Operational Risk Metrics Dashboard Icon. This is a completely customizable PowerPoint theme that can be put to use immediately. So, download it and address the topic impactfully.
Maintenance Performance Metrics Dashboard Icon Inspiration PDF
Presenting Maintenance Performance Metrics Dashboard Icon Inspiration PDF to dispense important information. This template comprises three stages. It also presents valuable insights into the topics including Maintenance Performance, Metrics Dashboard Icon. This is a completely customizable PowerPoint theme that can be put to use immediately. So, download it and address the topic impactfully.


 Continue with Email

 Home
Home


