Kpi Dashboard

Monthly Financial Metrics Dashboard With Revenue And Expenditure Rules PDF
This slide showcases KPI dashboard for monitoring financial health of business to ensure smooth flow of business operations. It includes details such as COGS, net profit, cost breakdown, etc. Showcasing this set of slides titled Monthly Financial Metrics Dashboard With Revenue And Expenditure Rules PDF. The topics addressed in these templates are Net Profit, Costs, Expenditure. All the content presented in this PPT design is completely editable. Download it and make adjustments in color, background, font etc. as per your unique business setting.
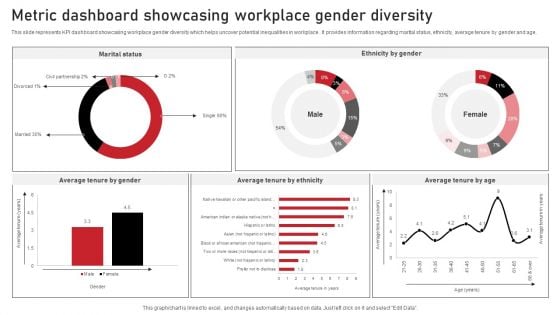
Metric Dashboard Showcasing Workplace Gender Diversity Microsoft PDF
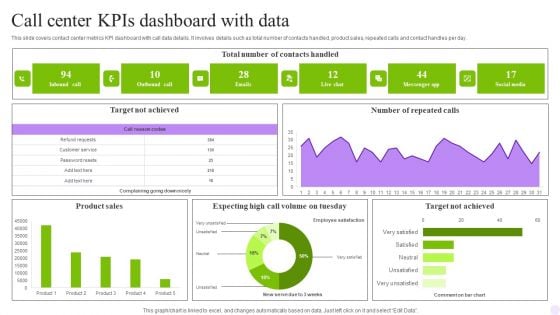
Call Center Kpis Dashboard With Data Graphics PDF
This slide covers contact center team performance metrics KPI dashboard. It involves details such as resolutions, response time, call data management and daily response time. Showcasing this set of slides titled Call Center Kpis Dashboard With Data Graphics PDF. The topics addressed in these templates are Response Time, Data Management, Resolution Rate. All the content presented in this PPT design is completely editable. Download it and make adjustments in color, background, font etc. as per your unique business setting.
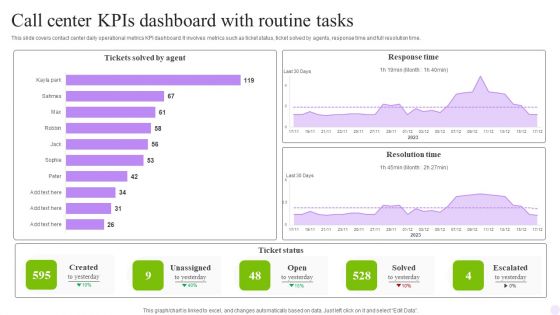
Call Center Kpis Dashboard With Routine Tasks Structure PDF
This slide covers contact center daily operational metrics KPI dashboard. It involves metrics such as ticket status, ticket solved by agents, response time and full resolution time. Pitch your topic with ease and precision using this Call Center Kpis Dashboard With Routine Tasks Structure PDF. This layout presents information on Agent, Response Time, Routine Tasks. It is also available for immediate download and adjustment. So, changes can be made in the color, design, graphics or any other component to create a unique layout.
Dashboard For Tracking Social Media Platforms Background PDF
This slide covers the KPI dashboard for analyzing social media channels. It includes metrics such as social media followers, Facebook daily reach, Facebook engaged users and page impressions, etc. Deliver an awe inspiring pitch with this creative Dashboard For Tracking Social Media Platforms Background PDF bundle. Topics like Linkedin Key Metrics, Social Media Followers, Awareness can be discussed with this completely editable template. It is available for immediate download depending on the needs and requirements of the user.
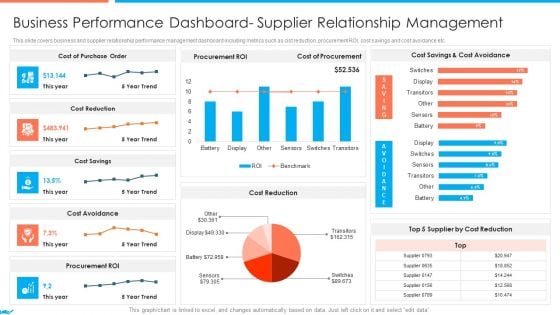
Supplier Association Management Techniques Business Performance Dashboard Portrait PDF
This slide covers business and supplier relationship performance management dashboard including metrics such as cist reduction, procurement ROI, cost savings and cost avoidance etc. Deliver an awe inspiring pitch with this creative icons slide for supplier association management techniques introduction pdf bundle. Topics like supplier association management techniques supplier performance management kpi dashboards guidelines pdf can be discussed with this completely editable template. It is available for immediate download depending on the needs and requirements of the user.
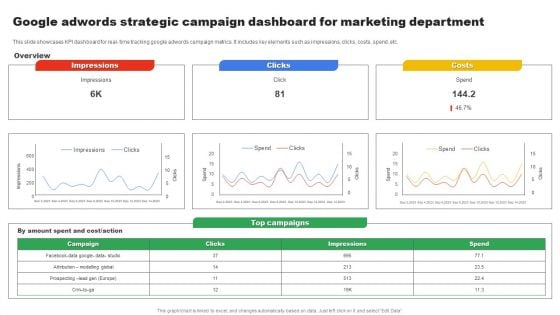
Google Adwords Strategic Campaign Dashboard For Marketing Department Download PDF
This slide showcases KPI dashboard for real time tracking google adwords campaign metrics. It includes key elements such as impressions, clicks, costs, spend, etc. Pitch your topic with ease and precision using this Google Adwords Strategic Campaign Dashboard For Marketing Department Download PDF. This layout presents information on Impressions, Clicks, Costs. It is also available for immediate download and adjustment. So, changes can be made in the color, design, graphics or any other component to create a unique layout.
Dashboard For Tracking Social Media Platforms Icons PDF
This slide covers the KPI dashboard for analyzing social media channels. It includes metrics such as social media followers, Facebook daily reach, Facebook engaged users and page impressions, etc. Deliver an awe inspiring pitch with this creative Dashboard For Tracking Social Media Platforms Icons PDF bundle. Topics like Social Media Followers, Metrics, Awareness can be discussed with this completely editable template. It is available for immediate download depending on the needs and requirements of the user.
E Commerce Transactions Performance Tracking Dashboard Topics PDF
This slide displays KPI dashboard to help company in tracking and monitoring total online purchases made. It includes metrics such as revenue, customers, average price, top articles sold, etc. Showcasing this set of slides titled E Commerce Transactions Performance Tracking Dashboard Topics PDF. The topics addressed in these templates are Total Customers, Division, Revenue. All the content presented in this PPT design is completely editable. Download it and make adjustments in color, background, font etc. as per your unique business setting.
Online Customer Interaction Dashboard For Tracking Website Performance Diagrams PDF
This slide covers the KPI dashboard for analyzing the company website. It includes metrics such as conversions, conversion rate, sessions, stickiness, bounce rate, engagement, etc. Deliver an awe inspiring pitch with this creative Online Customer Interaction Dashboard For Tracking Website Performance Diagrams PDF bundle. Topics like Conversions Rate, Conversions, Engagement can be discussed with this completely editable template. It is available for immediate download depending on the needs and requirements of the user.
Online Customer Interaction Loyalty Program Performance Tracking Dashboard Rules PDF
This slide covers the KPI dashboard for analyzing customer loyalty campaign results. It includes metrics such as revenue, liability, NQP accrued, transaction count, members, redemption ratio, etc.Deliver an awe inspiring pitch with this creative Online Customer Interaction Loyalty Program Performance Tracking Dashboard Rules PDF bundle. Topics like Revenue Liability, Transaction Count, Redemption Ratio can be discussed with this completely editable template. It is available for immediate download depending on the needs and requirements of the user.
Online Customer Interaction Referral Program Performance Tracking Dashboard Sample PDF
This slide covers the KPI dashboard for analyzing referral campaign results. It includes metrics such as total revenue generated, monthly recurring revenue, new customers, clicks, cancelled customers, paying customers, etc. Deliver an awe inspiring pitch with this creative Online Customer Interaction Referral Program Performance Tracking Dashboard Sample PDF bundle. Topics like Revenue Generated, Recurring Revenue, Paying Customers can be discussed with this completely editable template. It is available for immediate download depending on the needs and requirements of the user.
Dashboard For Tracking Digital Content Performance Background PDF
This slide covers the KPI dashboard for analyzing online content. It includes metrics such as blog visitors, pageviews, newsletter conversion rate, new signups, new customers, etc. Deliver and pitch your topic in the best possible manner with this Dashboard For Tracking Digital Content Performance Background PDF. Use them to share invaluable insights on Customers, Purchase, Rate and impress your audience. This template can be altered and modified as per your expectations. So, grab it now.
Online Ad Campaign Performance Tracking Dashboard Formats PDF
This slide covers the KPI dashboard for measuring digital campaign results. It includes metrics such as Ad cost, clicks, impressions, CTR, cost per click, conversions, conversion rate, cost per click, cost per thousand impressions, etc. Deliver an awe inspiring pitch with this creative Online Ad Campaign Performance Tracking Dashboard Formats PDF bundle. Topics like Conversation Rate, Cost Per Conversion can be discussed with this completely editable template. It is available for immediate download depending on the needs and requirements of the user.
Portfolio Tracking Dashboard For Management Procedure Structure PDF
This slide covers portfolio performance tracking KPI dashboard for increasing effectiveness in investment management process. It involves details such as investment, total earning, net profit and monthly portfolio performance.Pitch your topic with ease and precision using this Portfolio Tracking Dashboard For Management Procedure Structure PDF This layout presents information on Investment, Total Earning, Portfolio Performance It is also available for immediate download and adjustment. So, changes can be made in the color, design, graphics or any other component to create a unique layout.
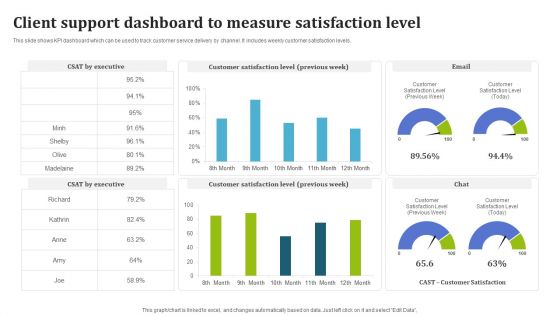
Client Support Dashboard To Measure Satisfaction Level Structure PDF
This slide shows KPI dashboard which can be used to track customer service delivery by channel. It includes weekly customer satisfaction levels. Showcasing this set of slides titled Client Support Dashboard To Measure Satisfaction Level Structure PDF. The topics addressed in these templates are Executive, Customer Satisfaction Level, Email. All the content presented in this PPT design is completely editable. Download it and make adjustments in color, background, font etc. as per your unique business setting.
Sustainability Calculation With KPI Effective Rate Metrics By Customer And Offering Ppt PowerPoint Presentation Icon Files PDF
This slide covers effective rate metrics. It shows over year over comparison of effective rate per customer as well as effective rate per offering. Deliver an awe inspiring pitch with this creative sustainability calculation with kpi effective rate metrics by customer and offering ppt powerpoint presentation icon files pdf bundle. Topics like effective rate metrics by customer and offering can be discussed with this completely editable template. It is available for immediate download depending on the needs and requirements of the user.
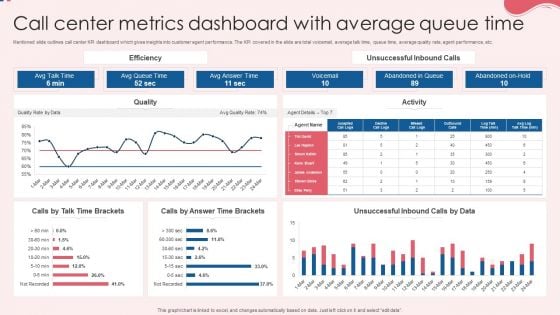
Call Center Metrics Dashboard With Average Queue Time Topics PDF
Mentioned slide outlines call center KPI dashboard which gives insights into customer agent performance. The KPI covered in the slide are total voicemail, average talk time, queue time, average quality rate, agent performance, etc. Pitch your topic with ease and precision using this Call Center Metrics Dashboard With Average Queue Time Topics PDF. This layout presents information on Efficiency, Quality, Activity. It is also available for immediate download and adjustment. So, changes can be made in the color, design, graphics or any other component to create a unique layout.
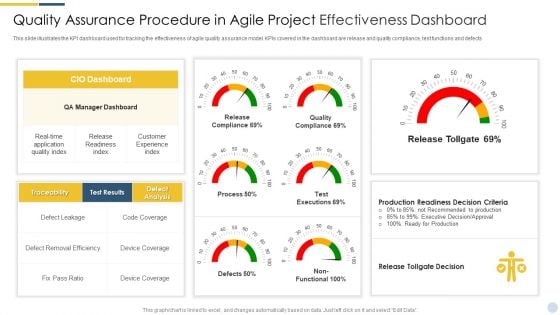
Quality Assurance Procedure In Agile Project Effectiveness Dashboard Formats PDF
This slide illustrates the KPI dashboard used for tracking the effectiveness of agile quality assurance model. KPIs covered in the dashboard are release and quality compliance, test functions and defects. Deliver and pitch your topic in the best possible manner with this quality assurance procedure in agile project effectiveness dashboard formats pdf. Use them to share invaluable insights on release tollgate decision, recommended to production, executive decision and impress your audience. This template can be altered and modified as per your expectations. So, grab it now.
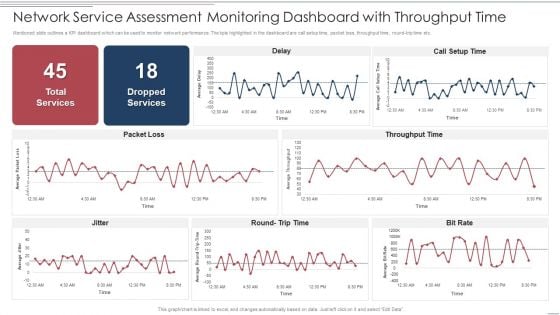
Network Service Assessment Monitoring Dashboard With Throughput Time Structure PDF
Mentioned slide outlines a KPI dashboard which can be used to monitor network performance. The kpis highlighted in the dashboard are call setup time, packet loss, throughput time, round trip time etc. Showcasing this set of slides titled Network Service Assessment Monitoring Dashboard With Throughput Time Structure PDF. The topics addressed in these templates are Network Service Assessment Monitoring Dashboard With Throughput Time. All the content presented in this PPT design is completely editable. Download it and make adjustments in color, background, font etc. as per your unique business setting.
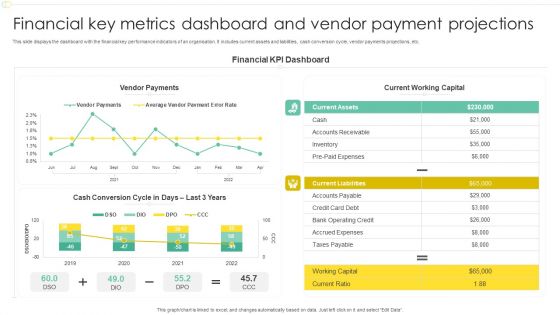
Financial Key Metrics Dashboard And Vendor Payment Projections Professional PDF
This slide displays the dashboard with the financial key performance indicators of an organisation. It includes current assets and liabilities, cash conversion cycle, vendor payments projections, etc. Pitch your topic with ease and precision using this Financial Key Metrics Dashboard And Vendor Payment Projections Professional PDF. This layout presents information on Financial KPI Dashboard, Current Working Capital, Vendor Payments. It is also available for immediate download and adjustment. So, changes can be made in the color, design, graphics or any other component to create a unique layout.
Employee Training And Development Plan Performance Tracking Dashboard Portrait PDF
Mentioned slide outlines key performance indicator KPI dashboard which can be used by organization to monitor training and development strategies. The major metrics covered in the template are cost per participant, per hour, number of trainees , etc. Showcasing this set of slides titled Employee Training And Development Plan Performance Tracking Dashboard Portrait PDF. The topics addressed in these templates are Employee Training, Development Plan Performance, Tracking Dashboard. All the content presented in this PPT design is completely editable. Download it and make adjustments in color, background, font etc. as per your unique business setting.
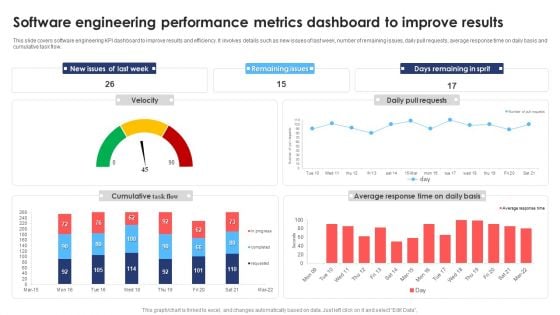
Software Engineering Performance Metrics Dashboard To Improve Results Infographics PDF
This slide covers software engineering KPI dashboard to improve results and efficiency. It involves details such as new issues of last week, number of remaining issues, daily pull requests, average response time on daily basis and cumulative task flow. Pitch your topic with ease and precision using this Software Engineering Performance Metrics Dashboard To Improve Results Infographics PDF. This layout presents information on Software Engineering Performance, Metrics Dashboard Improve Results. It is also available for immediate download and adjustment. So, changes can be made in the color, design, graphics or any other component to create a unique layout.
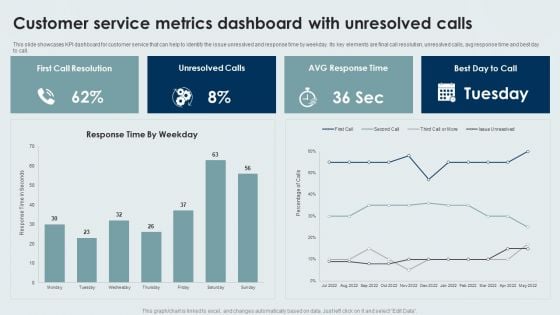
Customer Service Metrics Dashboard With Unresolved Calls Designs PDF
This slide showcases KPI dashboard for customer service that can help to identify the issue unresolved and response time by weekday. Its key elements are final call resolution, unresolved calls, avg response time and best day to call. Showcasing this set of slides titled Customer Service Metrics Dashboard With Unresolved Calls Designs PDF. The topics addressed in these templates are Customer Service, Metrics Dashboard, Unresolved Calls. All the content presented in this PPT design is completely editable. Download it and make adjustments in color, background, font etc. as per your unique business setting.
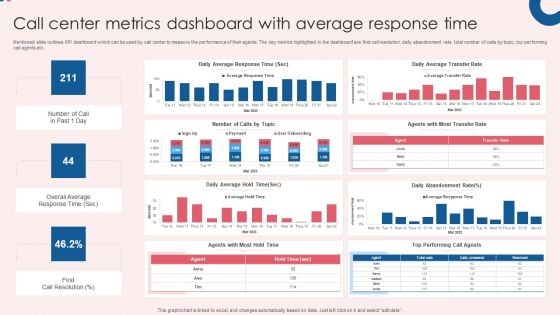
Call Center Metrics Dashboard With Average Response Time Inspiration PDF
Mentioned slide outlines KPI dashboard which can be used by call center to measure the performance of their agents. The key metrics highlighted in the dashboard are first call resolution, daily abandonment rate, total number of calls by topic, top performing call agents etc. Showcasing this set of slides titled Call Center Metrics Dashboard With Average Response Time Inspiration PDF. The topics addressed in these templates are Efficiency, Quality, Activity, Daily Average Response, Daily Average Transfer. All the content presented in this PPT design is completely editable. Download it and make adjustments in color, background, font etc. as per your unique business setting.
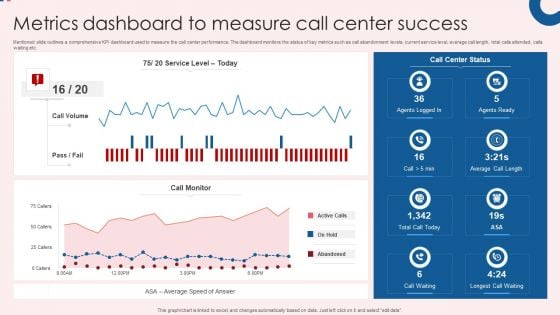
Metrics Dashboard To Measure Call Center Success Themes PDF
Mentioned slide outlines a comprehensive KPI dashboard used to measure the call center performance. The dashboard monitors the status of key metrics such as call abandonment levels, current service level, average call length, total calls attended, calls waiting etc. Showcasing this set of slides titled Metrics Dashboard To Measure Call Center Success Themes PDF. The topics addressed in these templates are Center Success, Call Center Status, Call Monitor. All the content presented in this PPT design is completely editable. Download it and make adjustments in color, background, font etc. as per your unique business setting.

Engineering Performance Metrics Dashboard To Track Pull Requests Background PDF
This slide covers engineering KPI dashboard to track pull request. It involves KPIs such as open time of average pull requests, average comment received, revision rounds, frequency of posting pull requests. Pitch your topic with ease and precision using this Engineering Performance Metrics Dashboard To Track Pull Requests Background PDF. This layout presents information on Dashboard Track Pull Requests, Engineering Performance Metrics. It is also available for immediate download and adjustment. So, changes can be made in the color, design, graphics or any other component to create a unique layout.
Dashboard For Tracking Customer Service Team Performance Clipart PDF
This slide covers the KPI dashboard for analyzing the performance of client support department. It includes metrics such as first call resolution, unresolved calls, average response rate, the best day to call, average time to solve issues, etc. Deliver an awe inspiring pitch with this creative Dashboard For Tracking Customer Service Team Performance Clipart PDF bundle. Topics like Dashboard For Tracking Customer, Service Team Performance can be discussed with this completely editable template. It is available for immediate download depending on the needs and requirements of the user.
Dashboard For Tracking Customer Service Team Performance Information PDF
This slide covers the KPI dashboard for analyzing the performance of client support department. It includes metrics such as first call resolution, unresolved calls, average response rate, the best day to call, average time to solve issues, etc. Deliver an awe inspiring pitch with this creative Dashboard For Tracking Customer Service Team Performance Information PDF bundle. Topics like Dashboard For Tracking Customer, Service Team Performance can be discussed with this completely editable template. It is available for immediate download depending on the needs and requirements of the user.
Online Ad Campaign Performance Tracking Dashboard Demonstration PDF
This slide covers the KPI dashboard for measuring digital campaign results. It includes metrics such as Ad cost, clicks, impressions, CTR, cost per click, conversions, conversion rate, cost per click, cost per thousand impressions, etc. Deliver and pitch your topic in the best possible manner with this Online Ad Campaign Performance Tracking Dashboard Demonstration PDF. Use them to share invaluable insights on Online Ad Campaign Performance, Tracking Dashboard and impress your audience. This template can be altered and modified as per your expectations. So, grab it now.
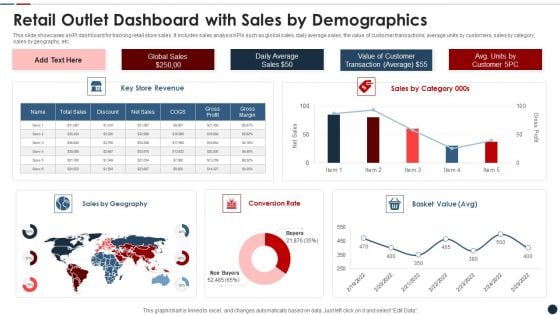
Retail Outlet Dashboard With Sales By Demographics Slides PDF
This slide showcases a KPI dashboard for tracking retail store sales. It includes sales analysis KPIs such as global sales, daily average sales, the value of customer transactions, average units by customers, sales by category, sales by geography, etc. Showcasing this set of slides titled retail outlet dashboard with sales by demographics slides pdf The topics addressed in these templates are Retail outlet dashboard with sales by demographics All the content presented in this PPT design is completely editable. Download it and make adjustments in color, background, font etc. as per your unique business setting.
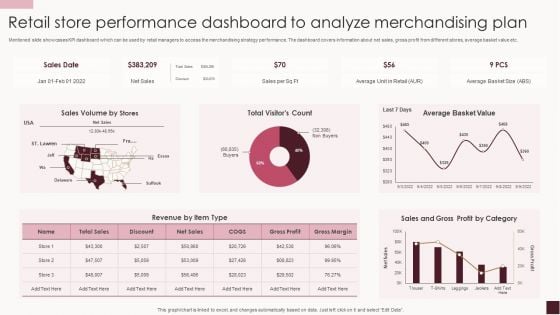
Retail Store Performance Dashboard To Analyze Merchandising Plan Structure PDF
Mentioned slide showcases KPI dashboard which can be used by retail managers to access the merchandising strategy performance. The dashboard covers information about net sales, gross profit from different stores, average basket value etc.Showcasing this set of slides titled Retail Store Performance Dashboard To Analyze Merchandising Plan Structure PDF. The topics addressed in these templates are Sales Volume, Average Basket, Gross Profit. All the content presented in this PPT design is completely editable. Download it and make adjustments in color, background, font etc. as per your unique business setting.
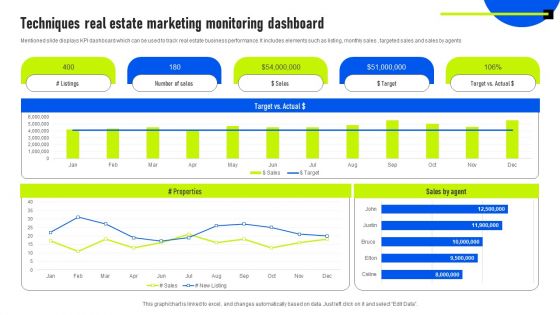
Techniques Real Estate Marketing Monitoring Dashboard Guidelines PDF
Mentioned slide displays KPI dashboard which can be used to track real estate business performance. It includes elements such as listing, monthly sales , targeted sales and sales by agents. Pitch your topic with ease and precision using this Techniques Real Estate Marketing Monitoring Dashboard Guidelines PDF. This layout presents information on Sales By Agent, Target, Marketing Monitoring Dashboard. It is also available for immediate download and adjustment. So, changes can be made in the color, design, graphics or any other component to create a unique layout.
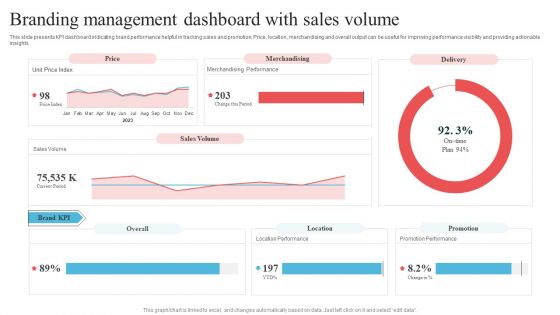
Branding Management Dashboard With Sales Volume Mockup PDF
This slide presents KPI dashboard indicating brand performance helpful in tracking sales and promotion. Price, location, merchandising and overall output can be useful for improving performance visibility and providing actionable insights. Showcasing this set of slides titled Branding Management Dashboard With Sales Volume Mockup PDF. The topics addressed in these templates are Branding Management Dashboard, Sales Volume. All the content presented in this PPT design is completely editable. Download it and make adjustments in color, background, font etc. as per your unique business setting.
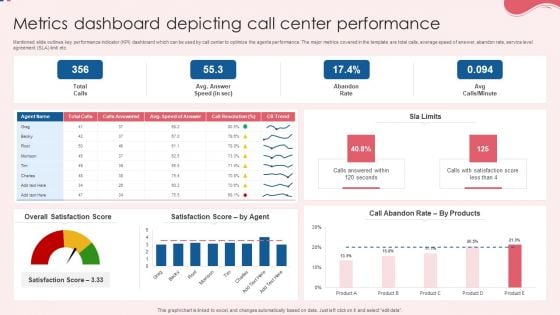
Metrics Dashboard Depicting Call Center Performance Pictures PDF
Mentioned slide outlines key performance indicator KPI dashboard which can be used by call center to optimize the agents performance. The major metrics covered in the template are total calls, average speed of answer, abandon rate, service level agreement SLA limit etc. Pitch your topic with ease and precision using this Metrics Dashboard Depicting Call Center Performance Pictures PDF. This layout presents information on Overall Satisfaction Score, Satisfaction Score, Performance. It is also available for immediate download and adjustment. So, changes can be made in the color, design, graphics or any other component to create a unique layout.

Business Referral Marketing Program Performance Metrics Dashboard Introduction PDF
This slide shows KPI dashboard to effectively track performance of business referral program in order to attract more leads and potential customers to the busines. It includes details related to key metrics such as referral participation rate, referred customers, referral conversion rate and total revenue generated. Showcasing this set of slides titled Business Referral Marketing Program Performance Metrics Dashboard Introduction PDF. The topics addressed in these templates are Referral Participation Rate, Referred Customers, Referral Conversion Rate, Total Revenue Generated. All the content presented in this PPT design is completely editable. Download it and make adjustments in color, background, font etc. as per your unique business setting.
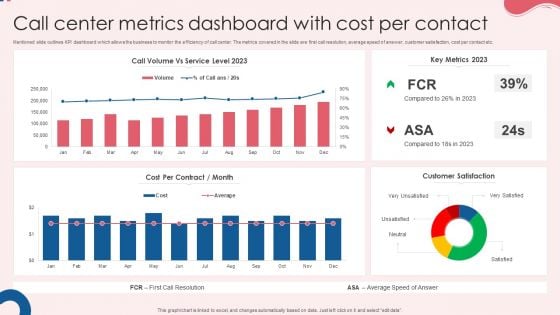
Call Center Metrics Dashboard With Cost Per Contact Rules PDF
Mentioned slide outlines KPI dashboard which allows the business to monitor the efficiency of call center. The metrics covered in the slide are first call resolution, average speed of answer, customer satisfaction, cost per contact etc. Pitch your topic with ease and precision using this Call Center Metrics Dashboard With Cost Per Contact Rules PDF. This layout presents information on Cost Per Contract, Key Metrics, Customer Satisfaction. It is also available for immediate download and adjustment. So, changes can be made in the color, design, graphics or any other component to create a unique layout.
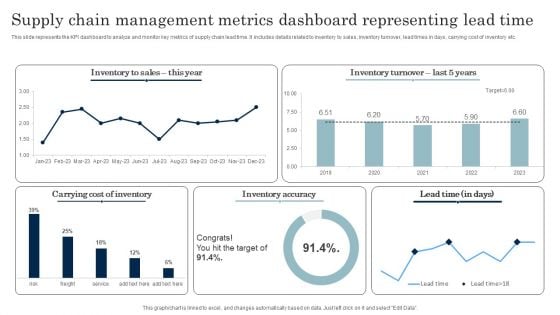
Supply Chain Management Metrics Dashboard Representing Lead Time Download PDF
This slide represents the KPI dashboard to analyze and monitor key metrics of supply chain lead time. It includes details related to inventory to sales, inventory turnover, lead times in days, carrying cost of inventory etc. Pitch your topic with ease and precision using this Supply Chain Management Metrics Dashboard Representing Lead Time Download PDF. This layout presents information on Inventory Accuracy, Carrying Cost Of Inventory. It is also available for immediate download and adjustment. So, changes can be made in the color, design, graphics or any other component to create a unique layout.
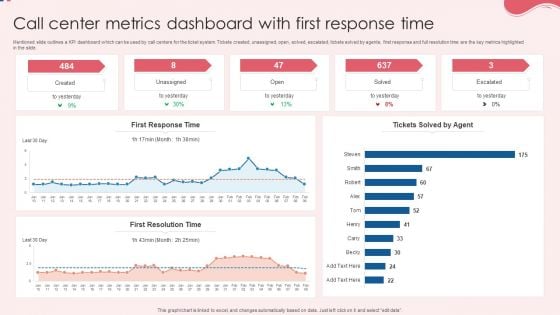
Call Center Metrics Dashboard With First Response Time Background PDF
Mentioned slide outlines a KPI dashboard which can be used by call centers for the ticket system. Tickets created, unassigned, open, solved, escalated, tickets solved by agents, first response and full resolution time are the key metrics highlighted in the slide. Pitch your topic with ease and precision using this Call Center Metrics Dashboard With First Response Time Background PDF. This layout presents information on First Response Time, First Resolution Time, Response Time. It is also available for immediate download and adjustment. So, changes can be made in the color, design, graphics or any other component to create a unique layout.
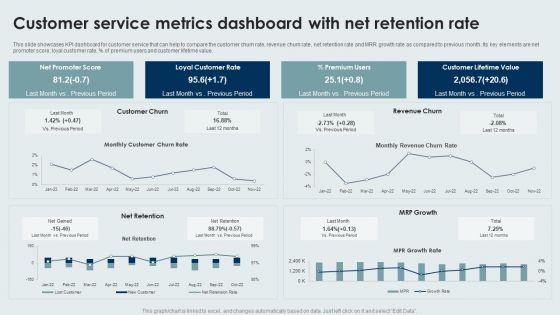
Customer Service Metrics Dashboard With Net Retention Rate Sample PDF
This slide showcases KPI dashboard for customer service that can help to compare the customer churn rate, revenue churn rate, net retention rate and MRR growth rate as compared to previous month. Its key elements are net promoter score, loyal customer rate, percentage of premium users and customer lifetime value. Pitch your topic with ease and precision using this Customer Service Metrics Dashboard With Net Retention Rate Sample PDF. This layout presents information on Loyal Customer Rate, Premium Users, Customer Lifetime Value. It is also available for immediate download and adjustment. So, changes can be made in the color, design, graphics or any other component to create a unique layout.
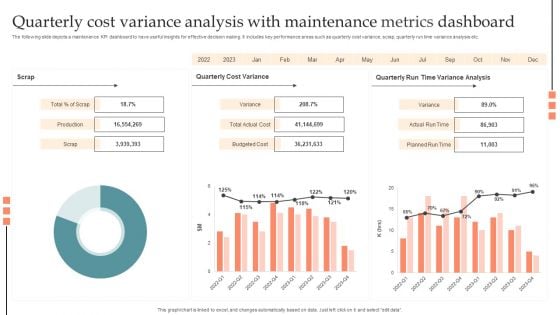
Quarterly Cost Variance Analysis With Maintenance Metrics Dashboard Information PDF
The following slide depicts a maintenance KPI dashboard to have useful insights for effective decision making. It includes key performance areas such as quarterly cost variance, scrap, quarterly run time variance analysis etc. Pitch your topic with ease and precision using this Quarterly Cost Variance Analysis With Maintenance Metrics Dashboard Information PDF. This layout presents information on Production, Budgeted Cost, Planned Run Time, Actual Run Time. It is also available for immediate download and adjustment. So, changes can be made in the color, design, graphics or any other component to create a unique layout.
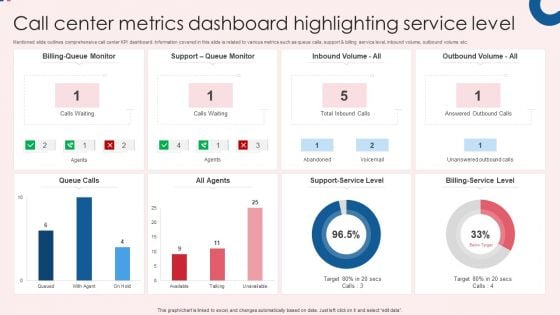
Call Center Metrics Dashboard Highlighting Service Level Infographics PDF
Mentioned slide outlines comprehensive call center KPI dashboard. Information covered in this slide is related to various metrics such as queue calls, support and billing service level, inbound volume, outbound volume etc. Pitch your topic with ease and precision using this Call Center Metrics Dashboard Highlighting Service Level Infographics PDF. This layout presents information on All Agents, Queue Calls, Billing Service Level. It is also available for immediate download and adjustment. So, changes can be made in the color, design, graphics or any other component to create a unique layout.
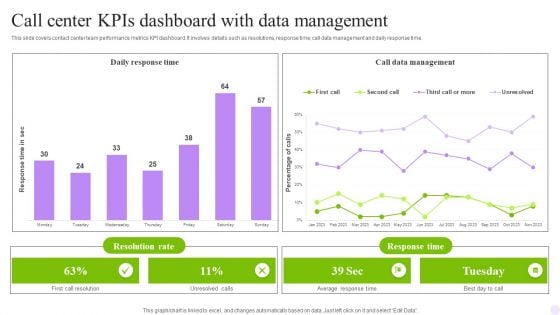
Call Center Kpis Dashboard With Data Management Infographics PDF
This slide covers contact center metrics KPI dashboard with call data details. It involves details such as total number of contacts handled, product sales, repeated calls and contact handles per day. Pitch your topic with ease and precision using this Call Center Kpis Dashboard With Data Management Infographics PDF. This layout presents information on Achieved, Contacts Handled, Repeated Calls. It is also available for immediate download and adjustment. So, changes can be made in the color, design, graphics or any other component to create a unique layout.
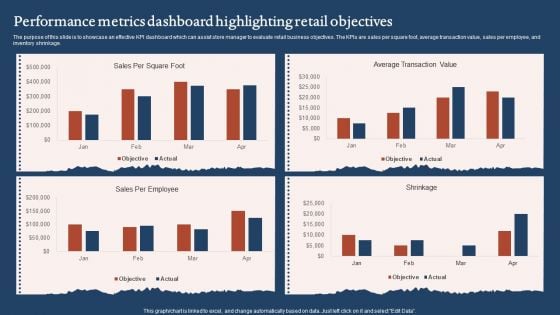
Performance Metrics Dashboard Highlighting Retail Objectives Sample PDF
The purpose of this slide is to showcase an effective KPI dashboard which can assist store manager to evaluate retail business objectives. The KPIs are sales per square foot, average transaction value, sales per employee, and inventory shrinkage. Pitch your topic with ease and precision using this Performance Metrics Dashboard Highlighting Retail Objectives Sample PDF. This layout presents information on Average Transaction Value, Sales Per Employee. It is also available for immediate download and adjustment. So, changes can be made in the color, design, graphics or any other component to create a unique layout.
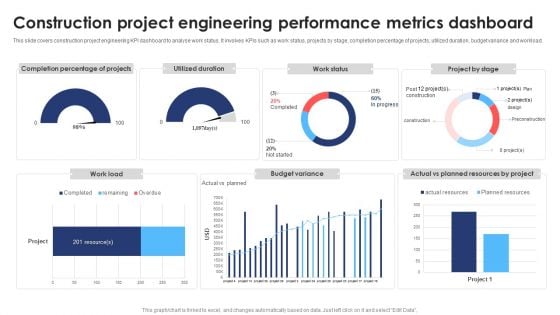
Construction Project Engineering Performance Metrics Dashboard Ideas PDF
This slide covers construction project engineering KPI dashboard to analyse work status. It involves KPIs such as work status, projects by stage, completion percentage of projects, utilized duration, budget variance and workload. Showcasing this set of slides titled Construction Project Engineering Performance Metrics Dashboard Ideas PDF. The topics addressed in these templates are Budget Variance, Resource, Project. All the content presented in this PPT design is completely editable. Download it and make adjustments in color, background, font etc. as per your unique business setting.
Shipping Delivery Tracking Metrics Analysis Dashboard Structure PDF
This template illustrates the KPI dashboard for tracking shipment orders. It also includes shipment analysis based on different KPIs such as ongoing delivery, completed delivery, on-time delivery, actual delivery duration, and variance between expected and actual delivery time. Pitch your topic with ease and precision using this Shipping Delivery Tracking Metrics Analysis Dashboard Structure PDF. This layout presents information on Recipient Country, Completed Deliveries, Delivery Duration. It is also available for immediate download and adjustment. So, changes can be made in the color, design, graphics or any other component to create a unique layout.
Dashboard For Tracking Sales Target Metrics Introduction PDF
This slide presents KPI dashboard for tracking Sales Target Metrics achievement monthly and region wise helpful in adjusting activities as per ongoing performance. It includes average weekly sales revenue, average sales target, annual sales growth, regional sales performance and average revenue per unit that should be regularly tracked. Showcasing this set of slides titled Dashboard For Tracking Sales Target Metrics Introduction PDF. The topics addressed in these templates are Average Revenue, Per Unit, Average Weekly, Sales Revenue. All the content presented in this PPT design is completely editable. Download it and make adjustments in color, background, font etc. as per your unique business setting.
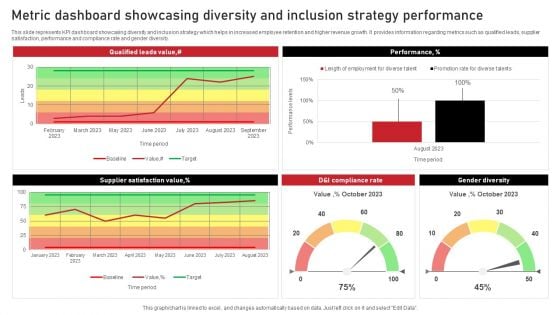
Metric Dashboard Showcasing Diversity And Inclusion Strategy Performance Background PDF
This slide represents KPI dashboard showcasing diversity and inclusion strategy which helps in increased employee retention and higher revenue growth. It provides information regarding metrics such as qualified leads, supplier satisfaction, performance and compliance rate and gender diversity. Showcasing this set of slides titled Metric Dashboard Showcasing Diversity And Inclusion Strategy Performance Background PDF. The topics addressed in these templates are Performance, Gender Diversity, Performance. All the content presented in this PPT design is completely editable. Download it and make adjustments in color, background, font etc. as per your unique business setting.
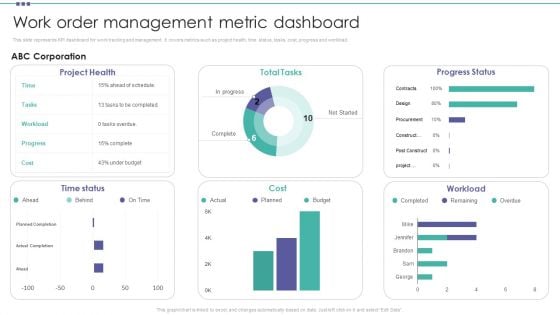
Work Order Management Metric Dashboard Organization Physical Assets Template PDF
This slide represents KPI dashboard for work tracking and management. It covers metrics such as project health, time status, tasks, cost, progress and workload. Boost your pitch with our creative Work Order Management Metric Dashboard Organization Physical Assets Template PDF. Deliver an awe-inspiring pitch that will mesmerize everyone. Using these presentation templates you will surely catch everyones attention. You can browse the ppts collection on our website. We have researchers who are experts at creating the right content for the templates. So you do not have to invest time in any additional work. Just grab the template now and use them.
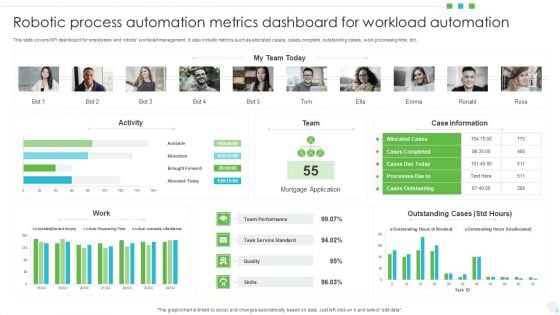
Robotic Process Automation Metrics Dashboard For Workload Automation Mockup PDF
This slide covers KPI dashboard for employees and robots workload management. It also include metrics such as allocated cases, cases complete, outstanding cases, work processing time, etc. Pitch your topic with ease and precision using this Robotic Process Automation Metrics Dashboard For Workload Automation Mockup PDF. This layout presents information on Mortgage Application, Team Performance, Case Information. It is also available for immediate download and adjustment. So, changes can be made in the color, design, graphics or any other component to create a unique layout.
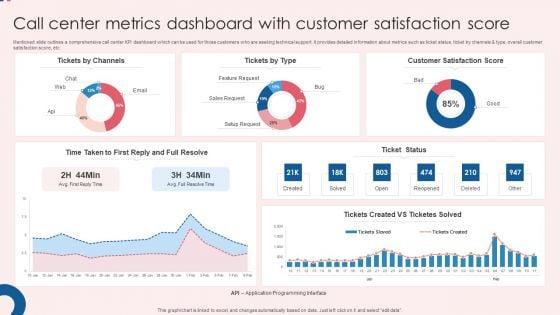
Call Center Metrics Dashboard With Customer Satisfaction Score Ideas PDF
Mentioned slide outlines a comprehensive call center KPI dashboard which can be used for those customers who are seeking technical support. It provides detailed information about metrics such as ticket status, ticket by channels and type, overall customer satisfaction score, etc. Showcasing this set of slides titled Call Center Metrics Dashboard With Customer Satisfaction Score Ideas PDF. The topics addressed in these templates are Customer Satisfaction, Score Ticket Status, Satisfaction Score. All the content presented in this PPT design is completely editable. Download it and make adjustments in color, background, font etc. as per your unique business setting.

Metric Dashboard To Track Supplier Diversity And Performance Designs PDF
This slide represents KPI dashboard for tracking supplier diversity in organization and measure performance. It provides information regarding organization spending cost, supplier count, diversity type, status etc. Pitch your topic with ease and precision using this Metric Dashboard To Track Supplier Diversity And Performance Designs PDF. This layout presents information on Diversity Type, Diversity Status, Diverse Supplier. It is also available for immediate download and adjustment. So, changes can be made in the color, design, graphics or any other component to create a unique layout.

Call Center Kpis Agent Performance Dashboard Clipart PDF
This slide covers contact center agent performance metrics KPI dashboard. It involves metrics such as number of calls, average response time, average hold time, daily average transfer rate and agents with most hold time and transfer rate. Showcasing this set of slides titled Call Center Kpis Agent Performance Dashboard Clipart PDF. The topics addressed in these templates are Transfer Rate, Call Center, Hold Time. All the content presented in this PPT design is completely editable. Download it and make adjustments in color, background, font etc. as per your unique business setting.
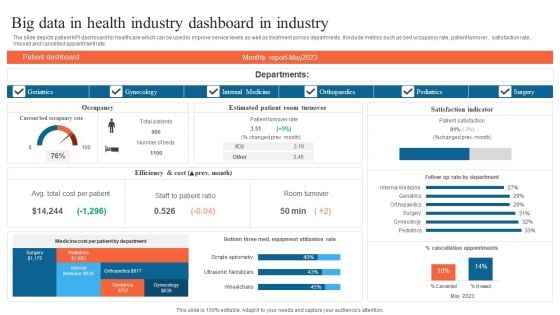
Big Data In Health Industry Dashboard In Industry Summary PDF
The slide depicts patient KPI dashboard for healthcare which can be used to improve service levels as well as treatment across departments. It include metrics such as bed occupancy rate, patient turnover, satisfaction rate, missed and cancelled appointment rate. Showcasing this set of slides titled Big Data In Health Industry Dashboard In Industry Summary PDF. The topics addressed in these templates are Geriatrics, Gynecology, Internal Medicine. All the content presented in this PPT design is completely editable. Download it and make adjustments in color, background, font etc. as per your unique business setting.
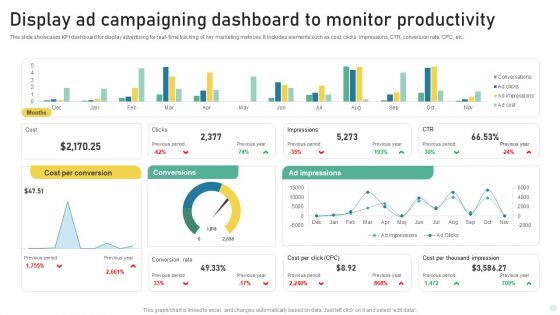
Display Ad Campaigning Dashboard To Monitor Productivity Infographics PDF
This slide showcases KPI dashboard for display advertising for real- time tracking of key marketing metrices, It includes elements such as cost, clicks, impressions, CTR, conversion rate, CPC, etc. Showcasing this set of slides titled Display Ad Campaigning Dashboard To Monitor Productivity Infographics PDF. The topics addressed in these templates are Cost Per Conversion, Conversions, Ad Impressions. All the content presented in this PPT design is completely editable. Download it and make adjustments in color, background, font etc. as per your unique business setting.
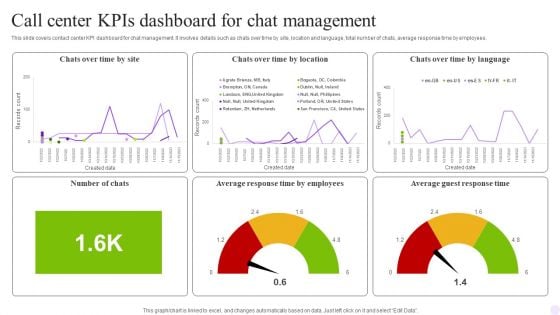
Call Center Kpis Dashboard For Chat Management Graphics PDF
This slide covers contact center KPI dashboard for chat management. It involves details such as chats over time by site, location and language, total number of chats, average response time by employees. Showcasing this set of slides titled Call Center Kpis Dashboard For Chat Management Graphics PDF. The topics addressed in these templates are Management, Employees, Chats. All the content presented in this PPT design is completely editable. Download it and make adjustments in color, background, font etc. as per your unique business setting.
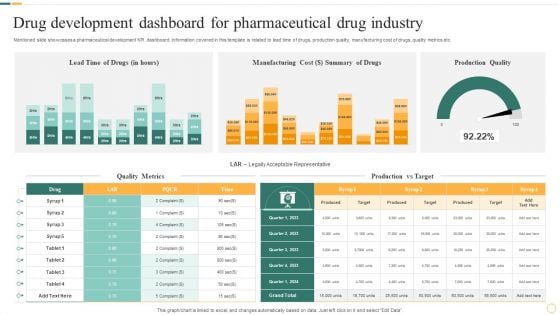
Drug Development Dashboard For Pharmaceutical Drug Industry Portrait PDF
Mentioned slide showcases a pharmaceutical development KPI dashboard. Information covered in this template is related to lead time of drugs, production quality, manufacturing cost of drugs, quality metrics etc. Showcasing this set of slides titled Drug Development Dashboard For Pharmaceutical Drug Industry Portrait PDF. The topics addressed in these templates are Manufacturing Cost, Summary Of Drugs, Production Quality. All the content presented in this PPT design is completely editable. Download it and make adjustments in color, background, font etc. as per your unique business setting.
Google Adwords Strategic Campaign Performance Tracking Dashboard Icons PDF
This slide showcases KPI dashboard for real time tracking of performance metrics for google adwords campaign. It includes elements such as cost interactions, impressions, device, etc. Showcasing this set of slides titled Google Adwords Strategic Campaign Performance Tracking Dashboard Icons PDF. The topics addressed in these templates are Campaign Performance Device, Interaction Rate Cost Device, Daily Cost Device. All the content presented in this PPT design is completely editable. Download it and make adjustments in color, background, font etc. as per your unique business setting.
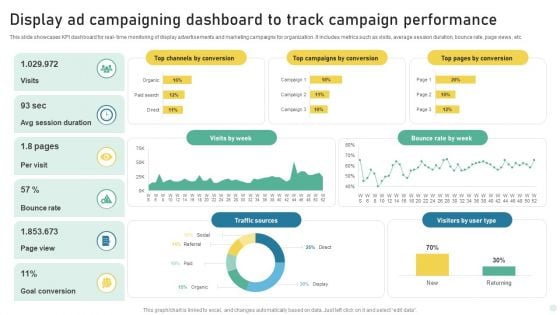
Display Ad Campaigning Dashboard To Track Campaign Performance Background PDF
This slide showcases KPI dashboard for real- time monitoring of display advertisements and marketing campaigns for organization. It includes metrics such as visits, average session duration, bounce rate, page views, etc. Showcasing this set of slides titled Display Ad Campaigning Dashboard To Track Campaign Performance Background PDF. The topics addressed in these templates are Traffic Sources, Bounce Rate, Goal Conversion. All the content presented in this PPT design is completely editable. Download it and make adjustments in color, background, font etc. as per your unique business setting.
Dashboard For Tracking Aftersales Customer Services Team Performance Designs PDF
This slide covers the KPI dashboard for ticket tracking. It includes metrics such as tickets by month, service level, and details of customer service department agents. Boost your pitch with our creative Dashboard For Tracking Aftersales Customer Services Team Performance Designs PDF. Deliver an awe inspiring pitch that will mesmerize everyone. Using these presentation templates you will surely catch everyones attention. You can browse the ppts collection on our website. We have researchers who are experts at creating the right content for the templates. So you do not have to invest time in any additional work. Just grab the template now and use them.


 Continue with Email

 Home
Home


