Kpi Summary
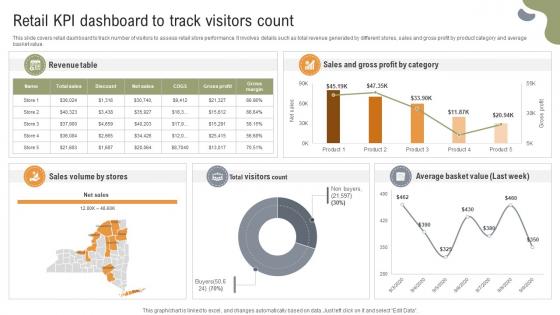
Implementing Strategies To Enhance Retail KPI Dashboard To Track Visitors Count
This slide covers retail dashboard to track number of visitors to assess retail store performance. It involves details such as total revenue generated by different stores, sales and gross profit by product category and average basket value. Want to ace your presentation in front of a live audience Our Implementing Strategies To Enhance Retail KPI Dashboard To Track Visitors Count can help you do that by engaging all the users towards you. Slidegeeks experts have put their efforts and expertise into creating these impeccable powerpoint presentations so that you can communicate your ideas clearly. Moreover, all the templates are customizable, and easy-to-edit and downloadable. Use these for both personal and commercial use. This slide covers retail dashboard to track number of visitors to assess retail store performance. It involves details such as total revenue generated by different stores, sales and gross profit by product category and average basket value.
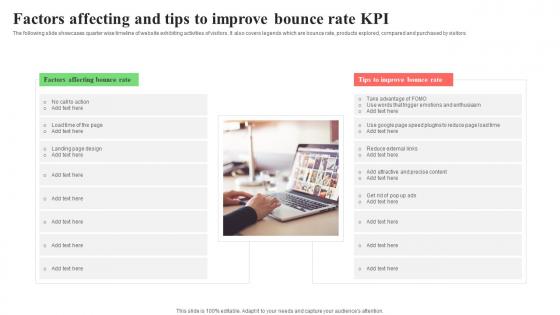
Factors Affecting And Tips To Improve Bounce Rate KPI Information Pdf
The following slide showcases quarter wise timeline of website exhibiting activities of visitors. It also covers legends which are bounce rate, products explored, compared and purchased by visitors. Showcasing this set of slides titled Factors Affecting And Tips To Improve Bounce Rate KPI Information Pdf. The topics addressed in these templates are Bounce Rate, Products Explored, Compared And Purchased. All the content presented in this PPT design is completely editable. Download it and make adjustments in color, background, font etc. as per your unique business setting. The following slide showcases quarter wise timeline of website exhibiting activities of visitors. It also covers legends which are bounce rate, products explored, compared and purchased by visitors.
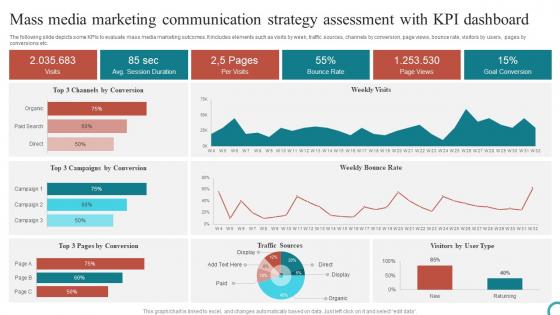
Mass Media Marketing Communication Strategy Assessment With KPI Dashboard Elements Pdf
The following slide depicts some KPIs to evaluate mass media marketing outcomes. It includes elements such as visits by week, traffic sources, channels by conversion, page views, bounce rate, visitors by users, pages by conversions etc. Showcasing this set of slides titled Mass Media Marketing Communication Strategy Assessment With KPI Dashboard Elements Pdf. The topics addressed in these templates are Dashboard, Goal Conversion, Bounce Rate. All the content presented in this PPT design is completely editable. Download it and make adjustments in color, background, font etc. as per your unique business setting. The following slide depicts some KPIs to evaluate mass media marketing outcomes. It includes elements such as visits by week, traffic sources, channels by conversion, page views, bounce rate, visitors by users, pages by conversions etc.
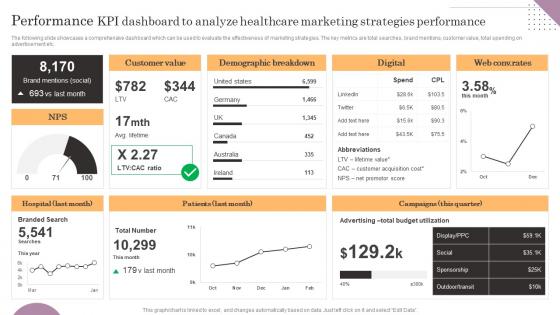
Performance KPI Dashboard To Analyze Healthcare Marketing General Management Brochure Pdf
The following slide showcases a comprehensive dashboard which can be used to evaluate the effectiveness of marketing strategies. The key metrics are total searches, brand mentions, customer value, total spending on advertisement etc. Find a pre-designed and impeccable Performance KPI Dashboard To Analyze Healthcare Marketing General Management Brochure Pdf. The templates can ace your presentation without additional effort. You can download these easy-to-edit presentation templates to make your presentation stand out from others. So, what are you waiting for Download the template from Slidegeeks today and give a unique touch to your presentation. The following slide showcases a comprehensive dashboard which can be used to evaluate the effectiveness of marketing strategies. The key metrics are total searches, brand mentions, customer value, total spending on advertisement etc.
Waste Collection And Recycling Monitoring Kpi Dashboard Implementation Of E Waste Guidelines
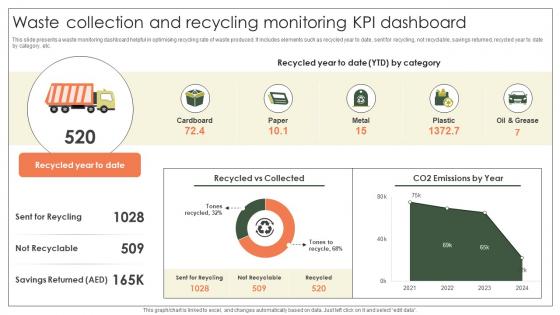
This slide presents a waste monitoring dashboard helpful in optimising recycling rate of waste produced. It includes elements such as recycled year to date, sent for recycling, not recyclable, savings returned, recycled year to date by category, etc. From laying roadmaps to briefing everything in detail, our templates are perfect for you. You can set the stage with your presentation slides. All you have to do is download these easy-to-edit and customizable templates. Waste Collection And Recycling Monitoring Kpi Dashboard Implementation Of E Waste Guidelines will help you deliver an outstanding performance that everyone would remember and praise you for. Do download this presentation today. This slide presents a waste monitoring dashboard helpful in optimising recycling rate of waste produced. It includes elements such as recycled year to date, sent for recycling, not recyclable, savings returned, recycled year to date by category, etc.
Mobile Ad Campaign Cost Evaluation KPI Evaluating Strengths And Weaknesses Introduction Pdf
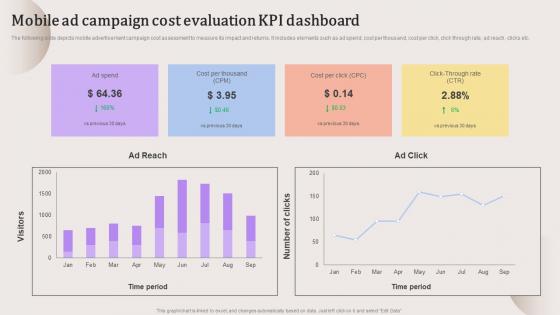
The following slide depicts mobile advertisement campaign cost assessment to measure its impact and returns. It includes elements such as ad spend, cost per thousand, cost per click, click through rate, ad reach, clicks etc.Present like a pro with Mobile Ad Campaign Cost Evaluation KPI Evaluating Strengths And Weaknesses Introduction Pdf Create beautiful presentations together with your team, using our easy-to-use presentation slides. Share your ideas in real-time and make changes on the fly by downloading our templates. So whether you are in the office, on the go, or in a remote location, you can stay in sync with your team and present your ideas with confidence. With Slidegeeks presentation got a whole lot easier. Grab these presentations today. The following slide depicts mobile advertisement campaign cost assessment to measure its impact and returns. It includes elements such as ad spend, cost per thousand, cost per click, click through rate, ad reach, clicks etc.
Online Venue Advertising Plan Venue Event Marketing Kpi Dashboard Strategy SS V
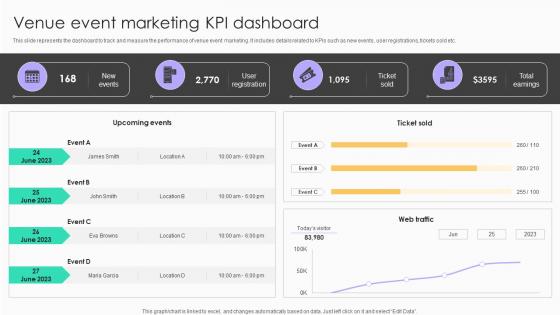
This slide represents the dashboard to track and measure the performance of venue event marketing. It includes details related to KPIs such as new events, user registrations, tickets sold etc. Present like a pro with Online Venue Advertising Plan Venue Event Marketing Kpi Dashboard Strategy SS V. Create beautiful presentations together with your team, using our easy-to-use presentation slides. Share your ideas in real-time and make changes on the fly by downloading our templates. So whether you are in the office, on the go, or in a remote location, you can stay in sync with your team and present your ideas with confidence. With Slidegeeks presentation got a whole lot easier. Grab these presentations today. This slide represents the dashboard to track and measure the performance of venue event marketing. It includes details related to KPIs such as new events, user registrations, tickets sold etc.
KPI Dashboard To Analyze Financial Improvements Tactical Financial Governance Brochure Pdf
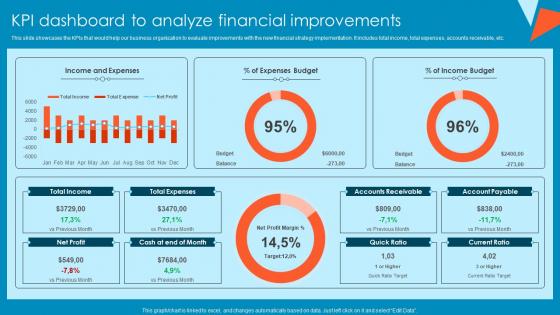
This slide showcases the KPIs that would help our business organization to evaluate improvements with the new financial strategy implementation. It includes total income, total expenses, accounts receivable, etc.Boost your pitch with our creative KPI Dashboard To Analyze Financial Improvements Tactical Financial Governance Brochure Pdf. Deliver an awe-inspiring pitch that will mesmerize everyone. Using these presentation templates you will surely catch everyones attention. You can browse the ppts collection on our website. We have researchers who are experts at creating the right content for the templates. So you do not have to invest time in any additional work. Just grab the template now and use them. This slide showcases the KPIs that would help our business organization to evaluate improvements with the new financial strategy implementation. It includes total income, total expenses, accounts receivable, etc.
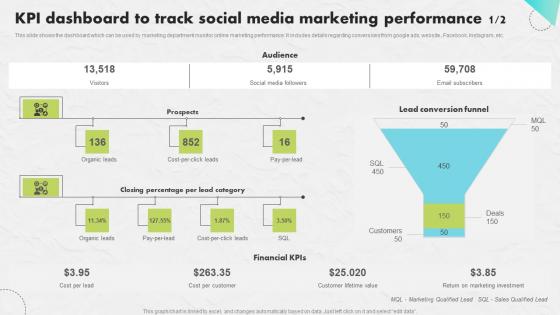
KPI Dashboard Track Social Developing An Impactful SEO Marketing Plan Graphics Pdf
This slide shows the dashboard which can be used by marketing department monitor online marketing performance. It includes details regarding conversions from google ads, website , Facebook, Instagram, etc. If your project calls for a presentation, then Slidegeeks is your go to partner because we have professionally designed, easy to edit templates that are perfect for any presentation. After downloading, you can easily edit KPI Dashboard Track Social Developing An Impactful SEO Marketing Plan Graphics Pdf and make the changes accordingly. You can rearrange slides or fill them with different images. Check out all the handy templates This slide shows the dashboard which can be used by marketing department monitor online marketing performance. It includes details regarding conversions from google ads, website , Facebook, Instagram, etc.
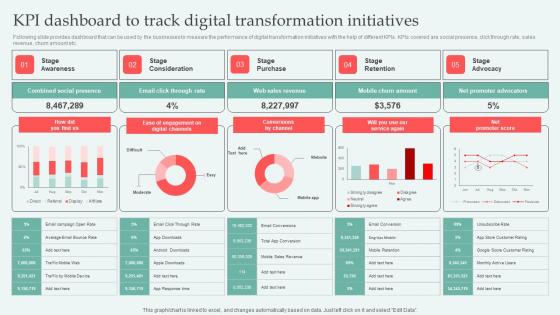
KPI Dashboard To Track Digital Approaches To Increase Business Growth Professional Pdf
Following slide provides dashboard that can be used by the businesses to measure the performance of digital transformation initiatives with the help of different KPIs. KPIs covered are social presence, click through rate, sales revenue, churn amount etc. If your project calls for a presentation, then Slidegeeks is your go to partner because we have professionally designed, easy to edit templates that are perfect for any presentation. After downloading, you can easily edit KPI Dashboard To Track Digital Approaches To Increase Business Growth Professional Pdf and make the changes accordingly. You can rearrange slides or fill them with different images. Check out all the handy templates Following slide provides dashboard that can be used by the businesses to measure the performance of digital transformation initiatives with the help of different KPIs. KPIs covered are social presence, click through rate, sales revenue, churn amount etc.
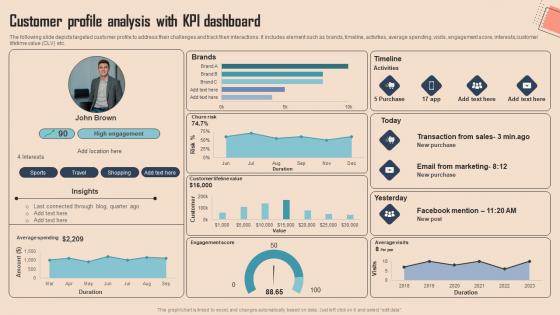
Customer Profile Analysis With KPI Comprehensive CDP Guide For Promoters Themes Pdf
The following slide depicts targeted customer profile to address their challenges and track their interactions. It includes element such as brands, timeline, activities, average spending, visits, engagement score, interests,customer lifetime value CLV etc. Slidegeeks is here to make your presentations a breeze with Customer Profile Analysis With KPI Comprehensive CDP Guide For Promoters Themes Pdf With our easy-to-use and customizable templates, you can focus on delivering your ideas rather than worrying about formatting. With a variety of designs to choose from, you are sure to find one that suits your needs. And with animations and unique photos, illustrations, and fonts, you can make your presentation pop. So whether you are giving a sales pitch or presenting to the board, make sure to check out Slidegeeks first. The following slide depicts targeted customer profile to address their challenges and track their interactions. It includes element such as brands, timeline, activities, average spending, visits, engagement score, interests,customer lifetime value CLV etc.
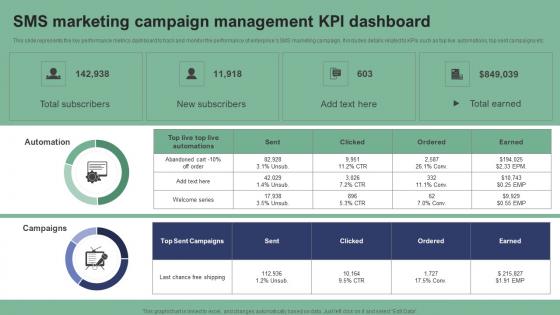
SMS Marketing Campaign Management KPI Text Message Marketing Strategies Pictures Pdf
This slide represents the key performance metrics dashboard to track and monitor the performance of enterprises SMS marketing campaign. It includes details related to KPIs such as top live automations, top sent campaigns etc. There are so many reasons you need a SMS Marketing Campaign Management KPI Text Message Marketing Strategies Pictures Pdf. The first reason is you can not spend time making everything from scratch, Thus, Slidegeeks has made presentation templates for you too. You can easily download these templates from our website easily. This slide represents the key performance metrics dashboard to track and monitor the performance of enterprises SMS marketing campaign. It includes details related to KPIs such as top live automations, top sent campaigns etc.
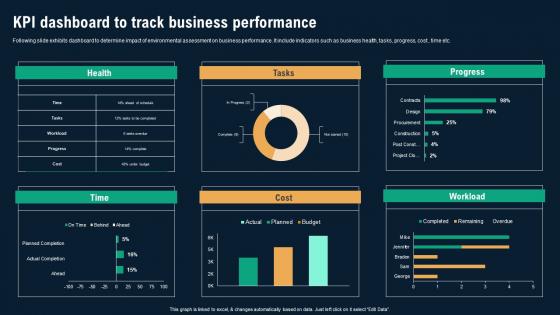
KPI Dashboard To Track Business Performance Business Environmental Analysis Formats Pdf
Following slide exhibits dashboard to determine impact of environmental assessment on business performance. It include indicators such as business health, tasks, progress, cost , time etc. The KPI Dashboard To Track Business Performance Business Environmental Analysis Formats Pdf is a compilation of the most recent design trends as a series of slides. It is suitable for any subject or industry presentation, containing attractive visuals and photo spots for businesses to clearly express their messages. This template contains a variety of slides for the user to input data, such as structures to contrast two elements, bullet points, and slides for written information. Slidegeeks is prepared to create an impression. Following slide exhibits dashboard to determine impact of environmental assessment on business performance. It include indicators such as business health, tasks, progress, cost , time etc.
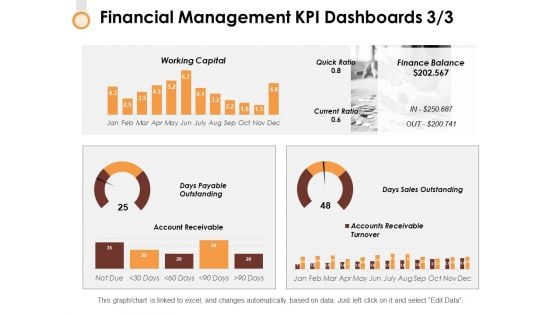
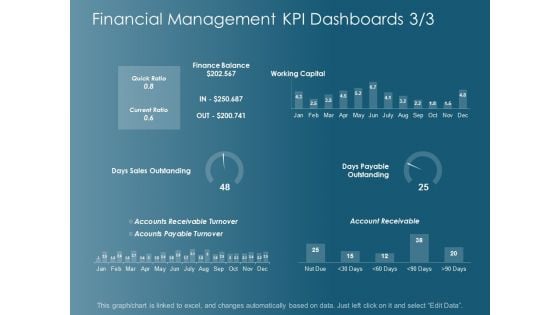
Financial Management Kpi Dashboards 3 3 Ppt PowerPoint Presentation Layouts Graphics Template
This is a financial management kpi dashboards 3 3 ppt powerpoint presentation layouts graphics template. This is a two stage process. The stages in this process are finance, strategy, marketing, compare, business.

KPI Measuring After Implementing Restaurant Marketing Strategies Create An Effective Restaurant
The following slide showcases various key performance indicators KPIs through which marketers can evaluate the success of traditional marketing performance. The metrics mentioned in slide are customer acquisition cost CAC, cross-sells, referrals, sales per square foot, repeat purchase rate, foot traffic, average order value, etc. Formulating a presentation can take up a lot of effort and time, so the content and message should always be the primary focus. The visuals of the PowerPoint can enhance the presenters message, so our KPI Measuring After Implementing Restaurant Marketing Strategies Create An Effective Restaurant was created to help save time. Instead of worrying about the design, the presenter can concentrate on the message while our designers work on creating the ideal templates for whatever situation is needed. Slidegeeks has experts for everything from amazing designs to valuable content, we have put everything into KPI Measuring After Implementing Restaurant Marketing Strategies Create An Effective Restaurant. The following slide showcases various key performance indicators KPIs through which marketers can evaluate the success of traditional marketing performance. The metrics mentioned in slide are customer acquisition cost CAC, cross-sells, referrals, sales per square foot, repeat purchase rate, foot traffic, average order value, etc.
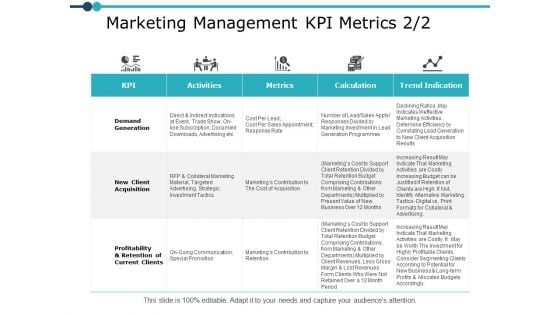
Marketing Management Kpi Metrics Strategy Ppt PowerPoint Presentation Ideas Design Templates
This is a marketing management kpi metrics strategy ppt powerpoint presentation ideas design templates. This is a five stage process. The stages in this process are compare, marketing, business, management, planning.
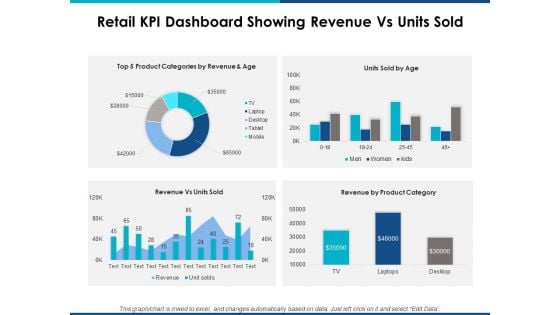
Retail Kpi Dashboard Showing Revenue Vs Units Sold Ppt Powerpoint Presentation Layouts Show
This is a retail kpi dashboard showing revenue vs units sold ppt powerpoint presentation layouts show. This is a four stage process. The stages in this process are finance, marketing, management, investment, analysis.

KPI Analytics Dashboard With Sourcing Raw Material Cycle Time Inspiration PDF
Following slide shows the key performance indicator KPI dashboard which will assist corporates to effectively monitor procurement process. The metrics are number of suppliers, contract compliance, average procurement cycle time, etc. Showcasing this set of slides titled KPI Analytics Dashboard With Sourcing Raw Material Cycle Time Inspiration PDF. The topics addressed in these templates are Kpi Analytics Dashboard, Sourcing Raw Material, Cycle Time. All the content presented in this PPT design is completely editable. Download it and make adjustments in color, background, font etc. as per your unique business setting.
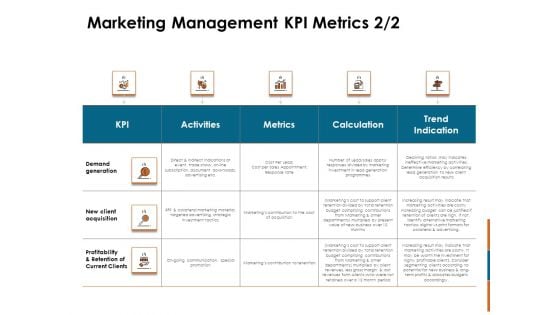
Key Statistics Of Marketing Management KPI Metrics Trend Ppt PowerPoint Presentation Pictures Examples PDF
Deliver and pitch your topic in the best possible manner with this key statistics of marketing management kpi metrics trend ppt powerpoint presentation pictures examples pdf. Use them to share invaluable insights on activities, kpi, metrics, calculation, trend indication, demand generation, new client acquisition, profitability and retention current clients and impress your audience. This template can be altered and modified as per your expectations. So, grab it now.
Energy Tracking Device KPI Metrics And Dashboard Ppt PowerPoint Presentation Visual Aids Show PDF
This is a energy tracking device kpi metrics and dashboard ppt powerpoint presentation visual aids show pdf template with various stages. Focus and dispense information on two stages using this creative set, that comes with editable features. It contains large content boxes to add your information on topics like kpi metrics, dashboard. You can also showcase facts, figures, and other relevant content using this PPT layout. Grab it now.
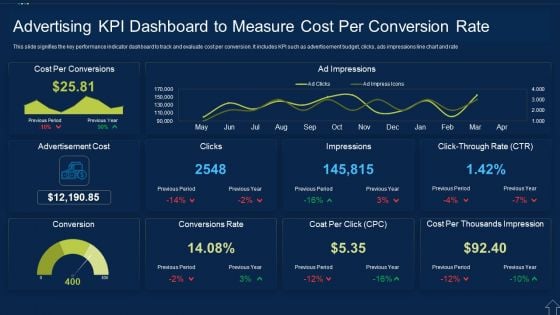
Advertising KPI Dashboard To Measure Cost Per Conversion Rate Themes PDF
This slide signifies the key performance indicator dashboard to track and evaluate cost per conversion. It includes KPI such as advertisement budget, clicks, ads impressions line chart and rate Showcasing this set of slides titled Advertising KPI Dashboard To Measure Cost Per Conversion Rate Themes PDF The topics addressed in these templates are Advertising Kpi Dashboard To Measure Cost Per Conversion Rate All the content presented in this PPT design is completely editable. Download it and make adjustments in color, background, font etc. as per your unique business setting.
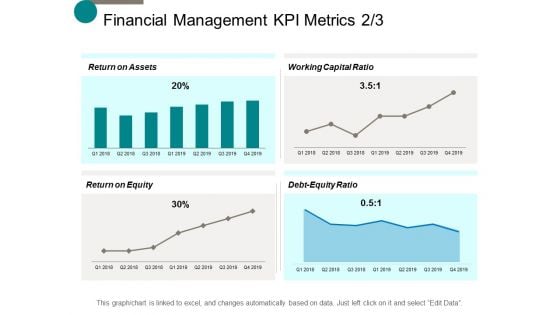
Financial Management Kpi Metrics Business Ppt Powerpoint Presentation Gallery File Formats
This is a financial management kpi metrics business ppt powerpoint presentation gallery file formats. This is a four stage process. The stages in this process are finance, marketing, management, investment, analysis.
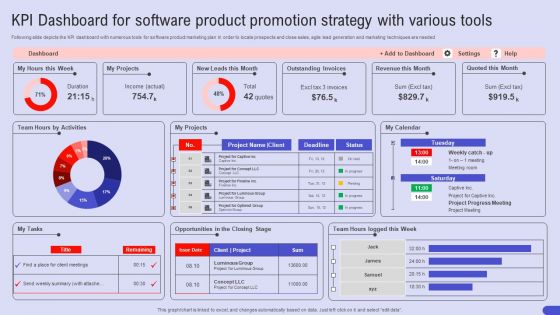
KPI Dashboard For Software Product Promotion Strategy With Various Tools Portrait PDF
Following slide depicts the KPI dashboard with numerous tools for software product marketing plan In order to locate prospects and close sales, agile lead generation and marketing techniques are needed. Pitch your topic with ease and precision using this KPI Dashboard For Software Product Promotion Strategy With Various Tools Portrait PDF. This layout presents information on KPI Dashboard, Software Product Promotion, Strategy With Various Tools. It is also available for immediate download and adjustment. So, changes can be made in the color, design, graphics or any other component to create a unique layout.
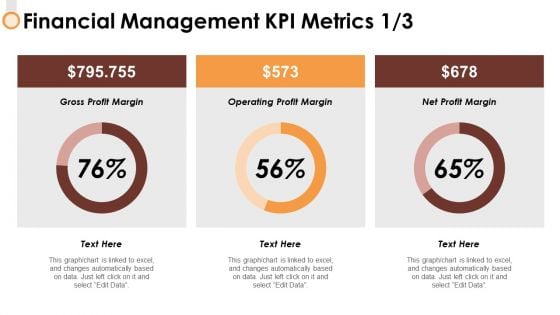
Financial Management Kpi Metrics 1 3 Ppt PowerPoint Presentation Ideas Mockup
This is a financial management kpi metrics 1 3 ppt powerpoint presentation ideas mockup. This is a three stage process. The stages in this process are finance, strategy, marketing, compare, business.
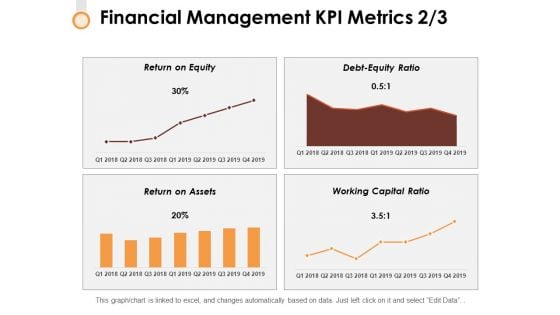
Financial Management Kpi Metrics 2 3 Ppt PowerPoint Presentation Professional Objects
This is a financial management kpi metrics 2 3 ppt powerpoint presentation professional objects. This is a four stage process. The stages in this process are finance, strategy, marketing, management, business.
Retail KPI Metrics Showing Average Sales Ppt PowerPoint Presentation Show Icon
This is a retail kpi metrics showing average sales ppt powerpoint presentation show icon. This is a four stage process. The stages in this process are customer retention, retail, planning, strategy, business.

Retail Kpi Metrics Showing Average Purchase Value And Online Sales Ppt PowerPoint Presentation Styles Background Image
This is a retail kpi metrics showing average purchase value and online sales ppt powerpoint presentation styles background image. This is a four stage process. The stages in this process are marketing, business, management, planning, strategy.

Retail Kpi Metrics Showing Average Sales And Sell Through Rates Ppt PowerPoint Presentation Ideas Influencers
This is a retail kpi metrics showing average sales and sell through rates ppt powerpoint presentation ideas influencers. This is a four stage process. The stages in this process are marketing, business, management, planning, strategy.
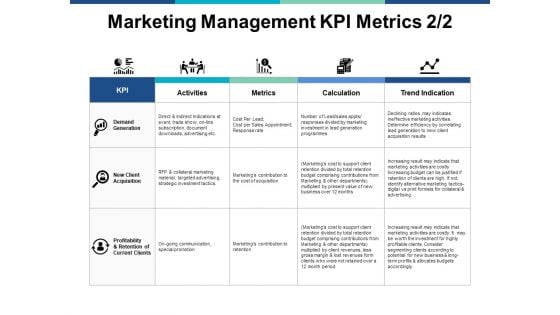
Marketing Management Kpi Metrics Planning Ppt PowerPoint Presentation Slides File Formats
This is a marketing management kpi metrics planning ppt powerpoint presentation slides file formats. This is a four stage process. The stages in this process are compare, marketing, business, management, planning.
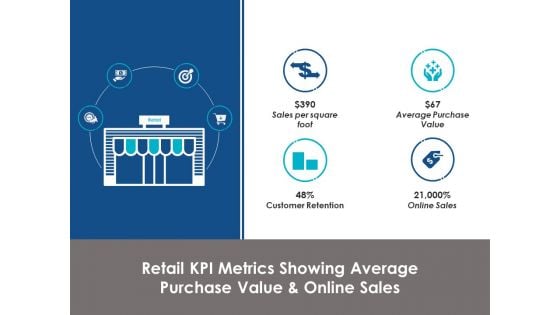
Retail Kpi Metrics Showing Average Purchase Value And Online Sales Ppt Powerpoint Presentation File Master Slide
This is a retail kpi metrics showing average purchase value and online sales ppt powerpoint presentation file master slide. This is a four stage process. The stages in this process are marketing, business, management, planning, strategy.
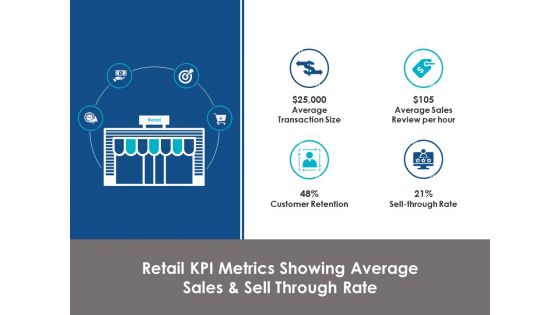
Retail Kpi Metrics Showing Average Sales And Sell Through Rate Ppt Powerpoint Presentation Styles Designs
This is a retail kpi metrics showing average sales and sell through rate ppt powerpoint presentation styles designs. This is a four stage process. The stages in this process are marketing, business, management, planning, strategy.
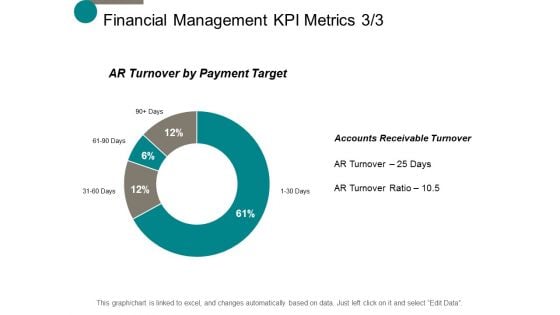
Financial Management Kpi Metrics Process Ppt Powerpoint Presentation Slides Graphics Download
This is a financial management kpi metrics process ppt powerpoint presentation slides graphics download. This is a four stage process. The stages in this process are finance, marketing, management, investment, analysis.
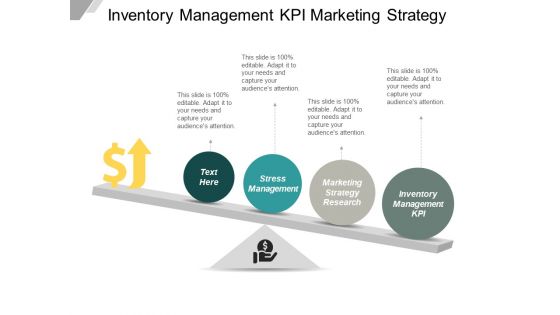
Inventory Management Kpi Marketing Strategy Research Stress Management Ppt PowerPoint Presentation Infographic Template Infographics
This is a inventory management kpi marketing strategy research stress management ppt powerpoint presentation infographic template infographics. This is a four stage process. The stages in this process are inventory management, human development class, risk assessment survey.
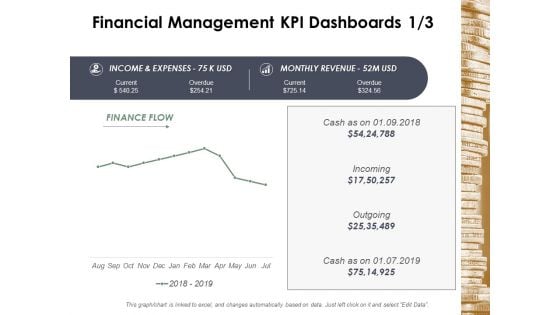
Financial Management Kpi Dashboards Business Ppt Powerpoint Presentation Infographic Template Deck
This is a financial management kpi dashboards business ppt powerpoint presentation infographic template deck. This is a four stage process. The stages in this process are finance, marketing, management, investment, analysis.
Financial Management Kpi Dashboards Strategy Ppt Powerpoint Presentation Gallery Graphics Template
This is a financial management kpi dashboards strategy ppt powerpoint presentation gallery graphics template. This is a six stage process. The stages in this process are finance, marketing, management, investment, analysis.

Financial Management Kpi Metrics Management Ppt Powerpoint Presentation Infographic Template Graphic Images
This is a financial management kpi metrics management ppt powerpoint presentation infographic template graphic images. This is a four stage process. The stages in this process are finance, marketing, management, investment, analysis.
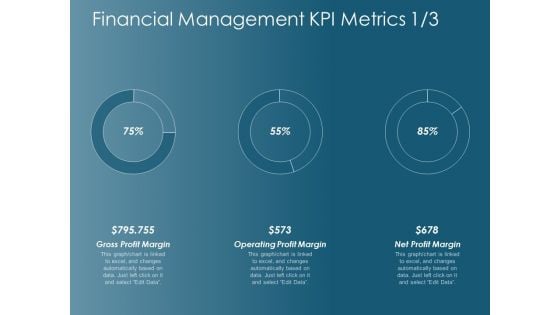
Financial Management Kpi Metrics Operating Profit Margin Ppt Powerpoint Presentation Infographic Template Images
This is a financial management kpi metrics operating profit margin ppt powerpoint presentation infographic template images. This is a three stage process. The stages in this process are finance, marketing, management, investment, analysis.
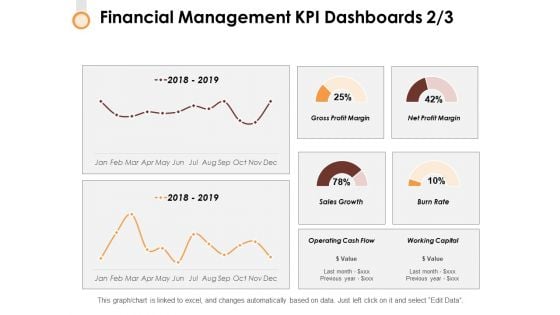
Financial Management Kpi Dashboards 2 3 Ppt PowerPoint Presentation Infographic Template Format Ideas
This is a financial management kpi dashboards 2 3 ppt powerpoint presentation infographic template format ideas. This is a two stage process. The stages in this process are finance, strategy, marketing, compare, business.
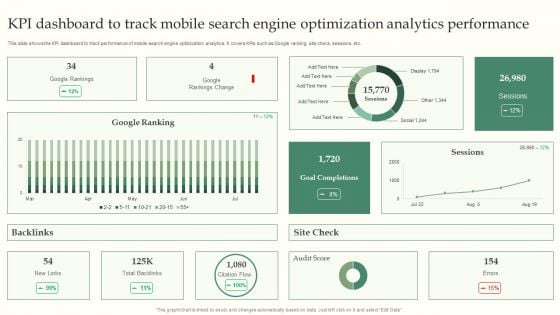
KPI Dashboard To Track Mobile Search Engine Optimization Analytics Performance Introduction PDF
This slide shows the KPI dashboard to track performance of mobile search engine optimization analytics. It covers KPIs such as Google ranking, site check, sessions, etc. Showcasing this set of slides titled KPI Dashboard To Track Mobile Search Engine Optimization Analytics Performance Introduction PDF. The topics addressed in these templates are KPI Dashboard, Search Engine Optimization, Analytics Performance. All the content presented in this PPT design is completely editable. Download it and make adjustments in color, background, font etc. as per your unique business setting.
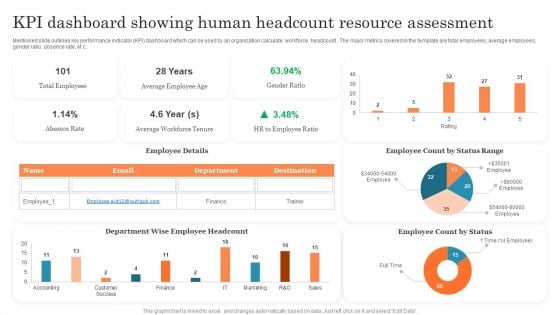
KPI Dashboard Showing Human Headcount Resource Assessment Ppt PowerPoint Presentation Outline PDF
Mentioned slide outlines key performance indicator KPI dashboard which can be used by an organization calculate workforce headcount . The major metrics covered in the template are total employees, average employees, gender ratio, absence rate, etc. Pitch your topic with ease and precision using this KPI Dashboard Showing Human Headcount Resource Assessment Ppt PowerPoint Presentation Outline PDF. This layout presents information on Total Employees, Average Employee, Employee Count. It is also available for immediate download and adjustment. So, changes can be made in the color, design, graphics or any other component to create a unique layout.
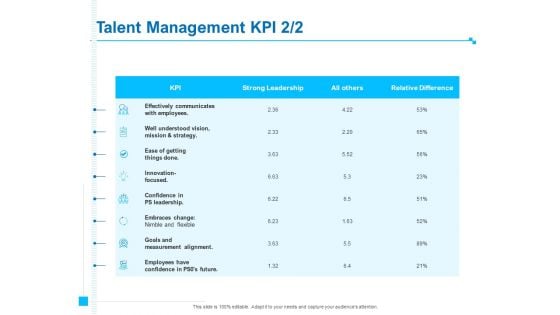
Strategic Talent Management Talent Management KPI Employees Ppt PowerPoint Presentation Ideas Portrait PDF
Deliver and pitch your topic in the best possible manner with this strategic talent management talent management kpi employees ppt powerpoint presentation ideas portrait pdf. Use them to share invaluable insights on kpi, strong leadership, relative difference, effectively communicates employees, vision, mission and strategy, innovation focused and impress your audience. This template can be altered and modified as per your expectations. So, grab it now.
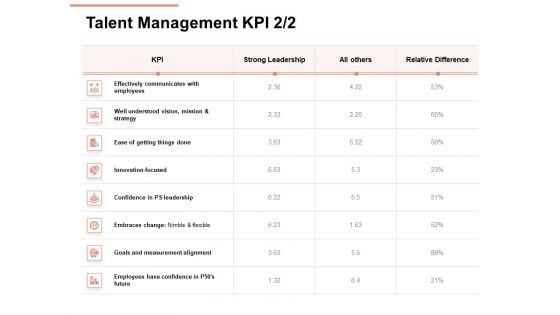
Workforce Planning System Talent Management KPI Leadership Ppt PowerPoint Presentation Professional Visual Aids PDF
Deliver and pitch your topic in the best possible manner with this workforce planning system talent management kpi leadership ppt powerpoint presentation professional visual aids pdf. Use them to share invaluable insights on kpi, strong leadership, relative difference, effectively communicates employees, vision, mission and strategy, innovation focused and impress your audience. This template can be altered and modified as per your expectations. So, grab it now.
Vector Showing Data Quality Measurement With KPI Metrics Ppt PowerPoint Presentation Model Gridlines PDF
Persuade your audience using this vector showing data quality measurement with kpi metrics ppt powerpoint presentation model gridlines pdf. This PPT design covers four stages, thus making it a great tool to use. It also caters to a variety of topics including vector showing data quality measurement with kpi metrics. Download this PPT design now to present a convincing pitch that not only emphasizes the topic but also showcases your presentation skills.
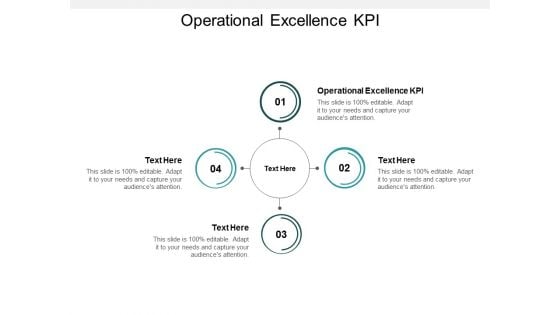
Operational Excellence KPI Ppt PowerPoint Presentation Infographic Template Graphics Tutorials Cpb
Presenting this set of slides with name operational excellence kpi ppt powerpoint presentation infographic template graphics tutorials cpb. This is an editable Powerpoint four stages graphic that deals with topics like operational excellence kpi to help convey your message better graphically. This product is a premium product available for immediate download and is 100 percent editable in Powerpoint. Download this now and use it in your presentations to impress your audience.
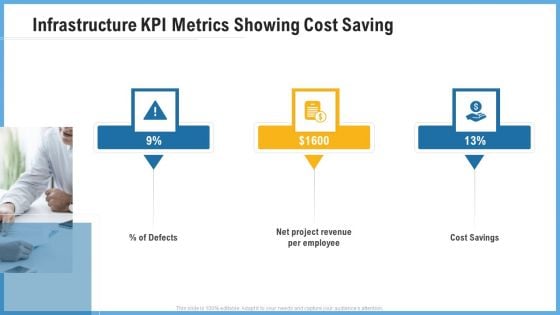
Improving Operational Activities Enterprise Infrastructure Kpi Metrics Showing Cost Saving Portrait PDF
Presenting improving operational activities enterprise infrastructure kpi metrics showing cost saving portrait pdf to provide visual cues and insights. Share and navigate important information on three stages that need your due attention. This template can be used to pitch topics like infrastructure kpi metrics showing cost saving. In addtion, this PPT design contains high resolution images, graphics, etc, that are easily editable and available for immediate download.
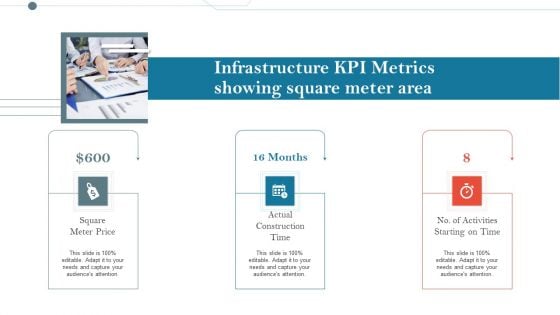
Construction Management Services And Action Plan Infrastructure KPI Metrics Showing Square Meter Area Information PDF
Presenting construction management services and action plan infrastructure kpi metrics showing square meter area information pdf to provide visual cues and insights. Share and navigate important information on three stages that need your due attention. This template can be used to pitch topics like infrastructure kpi metrics showing square meter area. In addtion, this PPT design contains high resolution images, graphics, etc, that are easily editable and available for immediate download.
Construction Management Services And Action Plan KPI Metrics And Dashboard Download PDF
Presenting construction management services and action plan kpi metrics and dashboard download pdf to provide visual cues and insights. Share and navigate important information on two stages that need your due attention. This template can be used to pitch topics like kpi metrics and dashboard. In addtion, this PPT design contains high resolution images, graphics, etc, that are easily editable and available for immediate download.
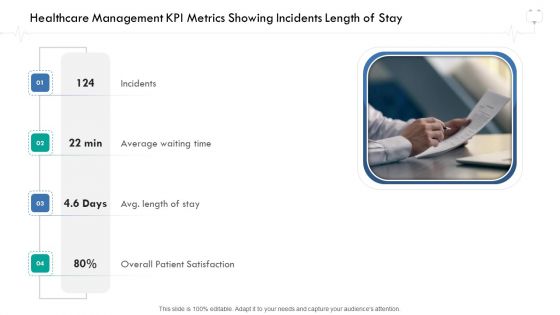
Wellness Management Healthcare Management KPI Metrics Showing Incidents Length Of Stay Graphics PDF
Presenting wellness management healthcare management kpi metrics showing incidents length of stay graphics pdf to provide visual cues and insights. Share and navigate important information on four stages that need your due attention. This template can be used to pitch topics like healthcare management kpi metrics showing incidents length of stay. In addition, this PPT design contains high-resolution images, graphics, etc, that are easily editable and available for immediate download.
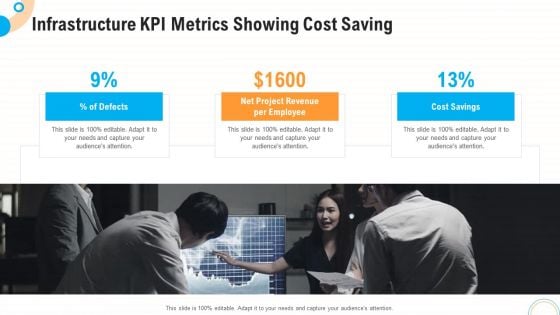
Fiscal And Operational Assessment Infrastructure KPI Metrics Showing Cost Saving Microsoft PDF
Presenting fiscal and operational assessment infrastructure kpi metrics showing cost saving microsoft pdf to provide visual cues and insights. Share and navigate important information on three stages that need your due attention. This template can be used to pitch topics like infrastructure kpi metrics showing cost saving. In addtion, this PPT design contains high resolution images, graphics, etc, that are easily editable and available for immediate download.
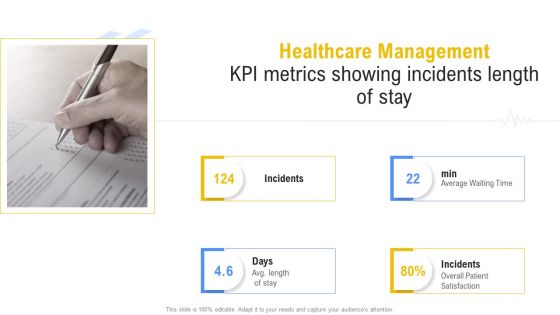
Healthcare Management KPI Metrics Showing Incidents Length Of Stay Microsoft PDF
Presenting healthcare management kpi metrics showing incidents length of stay microsoft pdf to provide visual cues and insights. Share and navigate important information on four stages that need your due attention. This template can be used to pitch topics like healthcare management kpi metrics showing incidents length of stay. In addtion, this PPT design contains high resolution images, graphics, etc, that are easily editable and available for immediate download.
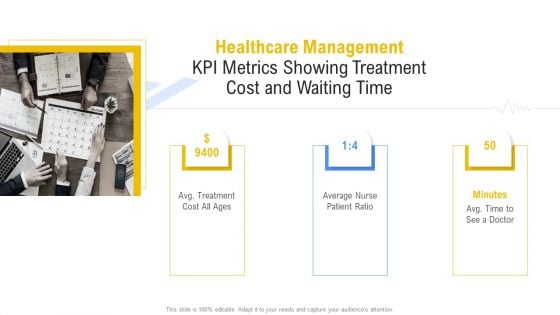
Healthcare Management KPI Metrics Showing Treatment Cost And Waiting Time Background PDF
Presenting healthcare management kpi metrics showing treatment cost and waiting time background pdf to provide visual cues and insights. Share and navigate important information on three stages that need your due attention. This template can be used to pitch topics like healthcare management kpi metrics showing treatment cost and waiting time. In addtion, this PPT design contains high resolution images, graphics, etc, that are easily editable and available for immediate download.

Prevention Of Information KPI Dashboard To Monitor Cyber Security Performance Information PDF
The purpose of this slide is to highlight key performance indicator KPI dashboard which can be used to track the performance of organization cyber security. The KPI metrics covered in the slide are asset type control, control issues by standard AND regulation etc. This Prevention Of Information KPI Dashboard To Monitor Cyber Security Performance Information PDF is perfect for any presentation, be it in front of clients or colleagues. It is a versatile and stylish solution for organizing your meetings. The Prevention Of Information KPI Dashboard To Monitor Cyber Security Performance Information PDF features a modern design for your presentation meetings. The adjustable and customizable slides provide unlimited possibilities for acing up your presentation. Slidegeeks has done all the homework before launching the product for you. So, dont wait, grab the presentation templates today
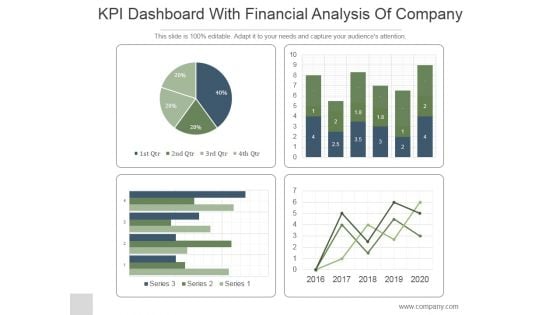
KPI Dashboard With Financial Analysis Of Company Ppt PowerPoint Presentation Backgrounds
This is a kpi dashboard with financial analysis of company ppt powerpoint presentation backgrounds. This is a four stage process. The stages in this process are business, strategy, marketing, line graph, finance.
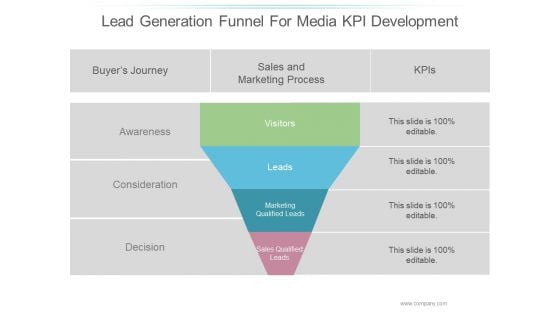
Lead Generation Funnel For Media Kpi Development Ppt PowerPoint Presentation Slide Download
This is a lead generation funnel for media kpi development ppt powerpoint presentation slide download. This is a four stage process. The stages in this process are business, marketing, lego, intelligence, game.
Supply Chain Kpi Dashboard Ppt PowerPoint Presentation Complete Deck With Slides
This is a supply chain kpi dashboard ppt powerpoint presentation complete deck with slides. This is a one stage process. The stages in this process are business, strategy, marketing, analysis, business model.
Business Kpi And Benchmarking Competence Results Success Ppt Powerpoint Presentation Icon Graphic Images
This is a business kpi and benchmarking competence results success ppt powerpoint presentation icon graphic images. This is a four stage process. The stages in this process are best practice, best technique, best procedure.

Retail KPI Dashboard Showing Revenue Vs Units Sold Ppt PowerPoint Presentation Professional Smartart
This is a retail kpi dashboard showing revenue vs units sold ppt powerpoint presentation professional smartart. This is a four stage process. The stages in this process are finance, analysis, business, investment, marketing.
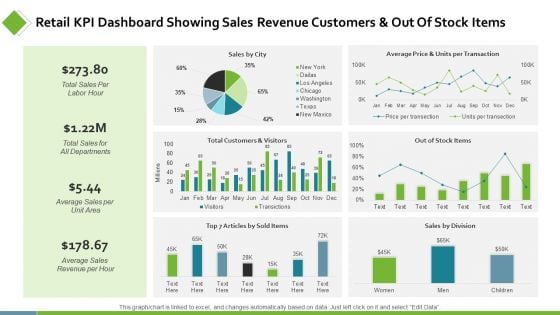
Retail KPI Dashboard Showing Sales Revenue Customers Ppt PowerPoint Presentation Show Background Designs
This is a retail kpi dashboard showing sales revenue customers ppt powerpoint presentation show background designs. This is a six stage process. The stages in this process are finance, analysis, business, investment, marketing.
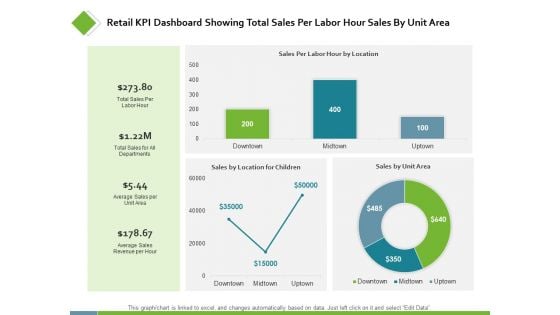
Retail KPI Dashboard Showing Total Sales Per Labor Ppt PowerPoint Presentation Styles Examples
This is a retail kpi dashboard showing total sales per labor ppt powerpoint presentation styles examples. This is a three stage process. The stages in this process are finance, analysis, business, investment, marketing.
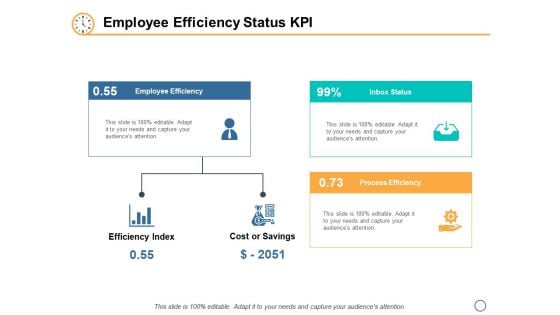
Employee Efficiency Status KPI Planning Ppt PowerPoint Presentation Show Visual Aids
This is a employee efficiency status kpi planning ppt powerpoint presentation show visual aids. This is a three stage process. The stages in this process are employee efficiency, inbox status, process efficiency, efficiency index, cost or savings.


 Continue with Email

 Home
Home


