Kpi Summary
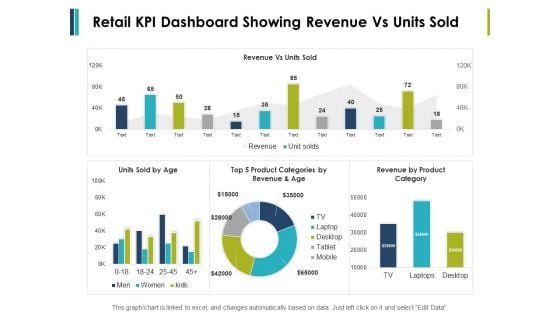
Retail Kpi Dashboard Showing Revenue Vs Units Sold Ppt PowerPoint Presentation File Formats
This is a retail kpi dashboard showing revenue vs units sold ppt powerpoint presentation file formats. This is a three stage process. The stages in this process are finance, marketing, management, investment, analysis.
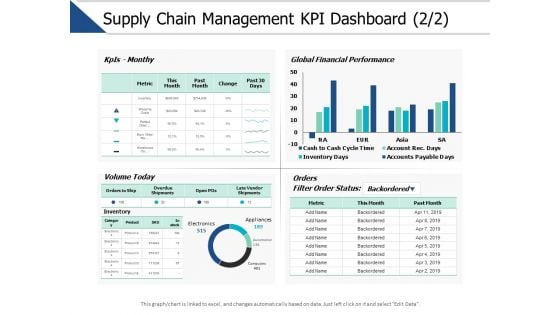
Supply Chain Management Kpi Dashboard Marketing Ppt PowerPoint Presentation File Tips
This is a supply chain management kpi dashboard marketing ppt powerpoint presentation file tips. This is a three stage process. The stages in this process are finance, marketing, management, investment, analysis.
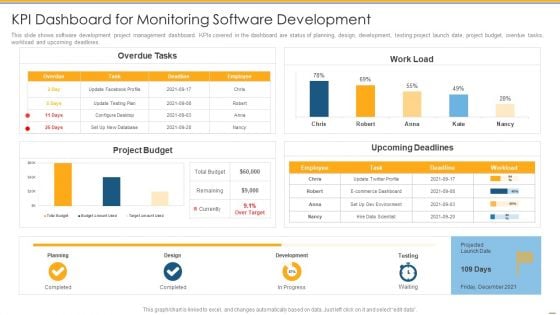
KPI Dashboard For Monitoring Software Development Ppt PowerPoint Presentation Show Deck PDF
This slide shows software development project management dashboard. KPIs covered in the dashboard are status of planning, design, development, testing project launch date, project budget, overdue tasks, workload and upcoming deadlines.Deliver an awe inspiring pitch with this creative kpi dashboard for monitoring software development ppt powerpoint presentation show deck pdf bundle. Topics like kpi dashboard for monitoring software development can be discussed with this completely editable template. It is available for immediate download depending on the needs and requirements of the user.
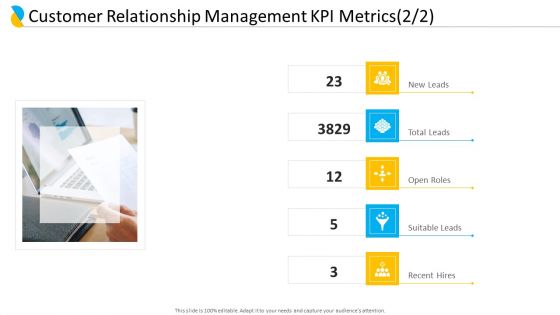
Customer Relationship Management KPI Metrics Total Leads Ppt Slides Themes PDF
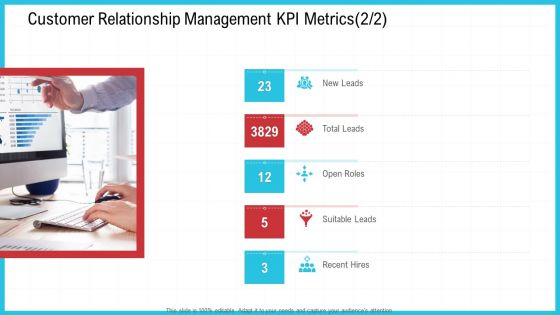
Presenting customer relationship management KPI metrics total leads ppt slides themes pdf to provide visual cues and insights. Share and navigate important information on five stages that need your due attention. This template can be used to pitch topics like customer relationship management KPI metrics, suitable leads, recent hires. In addtion, this PPT design contains high resolution images, graphics, etc, that are easily editable and available for immediate download.
CRM Customer Relationship Management KPI Metrics Leads Ppt File Topics PDF
Presenting crm customer relationship management kpi metrics leads ppt file topics pdf to provide visual cues and insights. Share and navigate important information on five stages that need your due attention. This template can be used to pitch topics like customer relationship management kpi metrics. In addtion, this PPT design contains high resolution images, graphics, etc, that are easily editable and available for immediate download.
Implementing Cybersecurity Awareness Program To Prevent Attacks KPI Dashboard To Monitor Cyber Security Introduction PDF
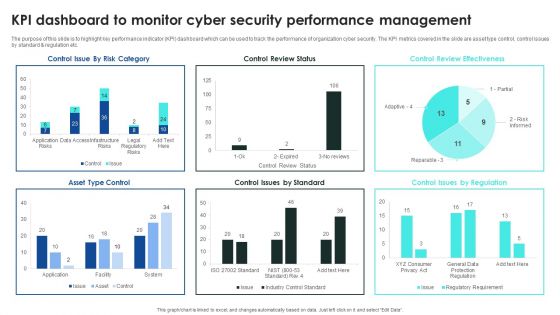
The purpose of this slide is to highlight key performance indicator KPI dashboard which can be used to track the performance of organization cyber security. The KPI metrics covered in the slide are asset type control, control issues by standard and regulation etc. This Implementing Cybersecurity Awareness Program To Prevent Attacks KPI Dashboard To Monitor Cyber Security Introduction PDF is perfect for any presentation, be it in front of clients or colleagues. It is a versatile and stylish solution for organizing your meetings. The Implementing Cybersecurity Awareness Program To Prevent Attacks KPI Dashboard To Monitor Cyber Security Introduction PDF features a modern design for your presentation meetings. The adjustable and customizable slides provide unlimited possibilities for acing up your presentation. Slidegeeks has done all the homework before launching the product for you. So, do not wait, grab the presentation templates today
Data Loss Prevention KPI Ppt PowerPoint Presentation Styles Portfolio Cpb Pdf
Presenting this set of slides with name data loss prevention kpi ppt powerpoint presentation styles portfolio cpb pdf. This is an editable Powerpoint six stages graphic that deals with topics like data loss prevention kpi to help convey your message better graphically. This product is a premium product available for immediate download and is 100 percent editable in Powerpoint. Download this now and use it in your presentations to impress your audience.
KPI Dashboard With Pen Vector Icon Ppt PowerPoint Presentation Professional Infographics PDF
Persuade your audience using this kpi dashboard with pen vector icon ppt powerpoint presentation professional infographics pdf. This PPT design covers three stages, thus making it a great tool to use. It also caters to a variety of topics including kpi dashboard with pen vector icon. Download this PPT design now to present a convincing pitch that not only emphasizes the topic but also showcases your presentation skills.
Civil Infrastructure Designing Services Management Infrastructure Kpi Metrics Showing Square Meter Area Slides PDF
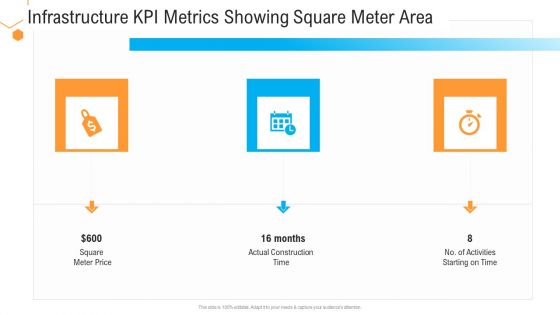
Presenting civil infrastructure designing services management infrastructure kpi metrics showing square meter area slides pdf to provide visual cues and insights. Share and navigate important information on three stages that need your due attention. This template can be used to pitch topics like infrastructure kpi metrics showing square meter area. In addtion, this PPT design contains high resolution images, graphics, etc, that are easily editable and available for immediate download.
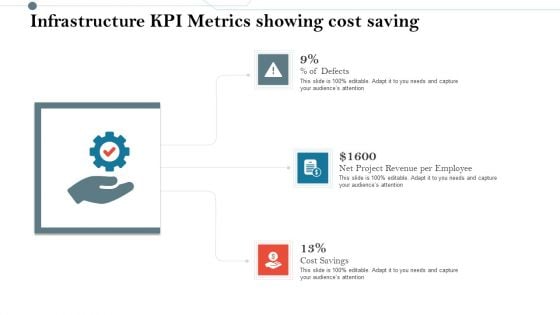
Construction Management Services And Action Plan Infrastructure KPI Metrics Showing Cost Saving Pictures PDF
Presenting construction management services and action plan infrastructure kpi metrics showing cost saving pictures pdf to provide visual cues and insights. Share and navigate important information on three stages that need your due attention. This template can be used to pitch topics like infrastructure kpi metrics showing cost saving. In addtion, this PPT design contains high resolution images, graphics, etc, that are easily editable and available for immediate download.
Construction Engineering And Industrial Facility Management KPI Metrics And Dashboard Portrait PDF
Presenting construction engineering and industrial facility management kpi metrics and dashboard portrait pdf to provide visual cues and insights. Share and navigate important information on two stages that need your due attention. This template can be used to pitch topics like kpi metrics and dashboard. In addtion, this PPT design contains high resolution images, graphics, etc, that are easily editable and available for immediate download.
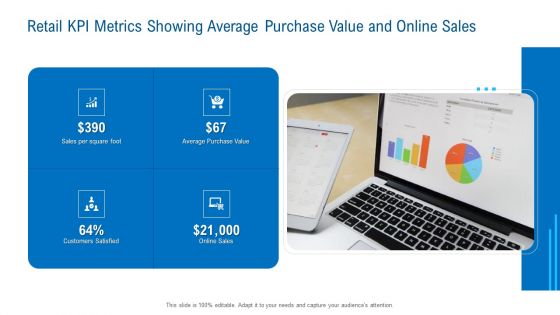
Merchandising Industry Analysis Retail KPI Metrics Showing Average Purchase Value And Online Sales Guidelines PDF
Presenting merchandising industry analysis retail kpi metrics showing average purchase value and online sales guidelines pdf to provide visual cues and insights. Share and navigate important information on four stages that need your due attention. This template can be used to pitch topics like retail kpi metrics showing average purchase value and online sales. In addtion, this PPT design contains high resolution images, graphics, etc, that are easily editable and available for immediate download.
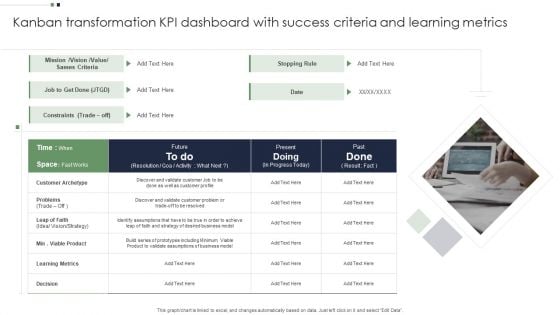
Kanban Transformation KPI Dashboard With Success Criteria And Learning Metrics Microsoft PDF
Persuade your audience using this Kanban Transformation KPI Dashboard With Success Criteria And Learning Metrics Microsoft PDF. This PPT design covers one stages, thus making it a great tool to use. It also caters to a variety of topics including Kanban Transformation KPI Dashboard, Success Criteria Learning Metrics. Download this PPT design now to present a convincing pitch that not only emphasizes the topic but also showcases your presentation skills.
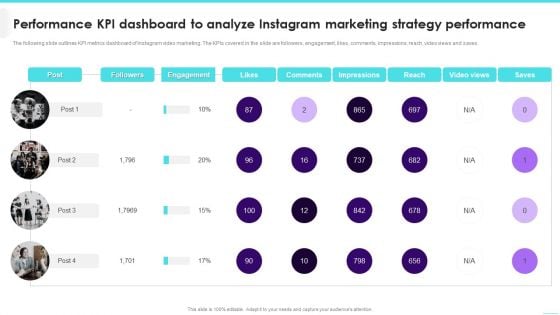
Performance KPI Dashboard To Analyze Instagram Marketing Strategy Performance Infographics PDF
The following slide outlines KPI metrics dashboard of Instagram video marketing. The KPIs covered in the slide are followers, engagement, likes, comments, impressions, reach, video views and saves.Deliver an awe inspiring pitch with this creative Performance KPI Dashboard To Analyze Instagram Marketing Strategy Performance Infographics PDF bundle. Topics like Engagement, Impressions, Comments can be discussed with this completely editable template. It is available for immediate download depending on the needs and requirements of the user.
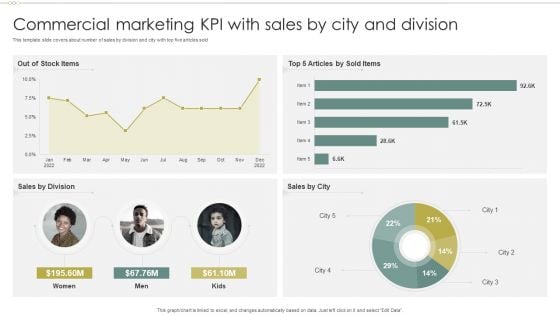
Commercial Marketing KPI With Sales By City And Division Template PDF
This template slide covers about number of sales by division and city with top five articles sold.Showcasing this set of slides titled Commercial Marketing KPI With Sales By City And Division Template PDF. The topics addressed in these templates are Commercial Marketing KPI With Sales By City And Division Template PDF. All the content presented in this PPT design is completely editable. Download it and make adjustments in color, background, font etc. as per your unique business setting.
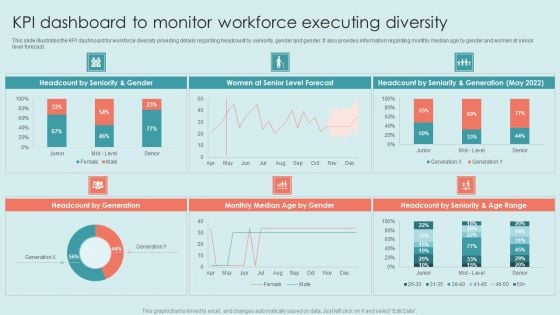
Executing Diversity KPI Dashboard To Monitor Workforce Executing Diversity Structure PDF
This slide illustrates the KPI dashboard for workforce diversity providing details regarding headcount by seniority, gender and gender. It also provides information regarding monthly median age by gender and women at senior level forecast. Presenting this PowerPoint presentation, titled Executing Diversity KPI Dashboard To Monitor Workforce Executing Diversity Structure PDF, with topics curated by our researchers after extensive research. This editable presentation is available for immediate download and provides attractive features when used. Download now and captivate your audience. Presenting this Executing Diversity KPI Dashboard To Monitor Workforce Executing Diversity Structure PDF. Our researchers have carefully researched and created these slides with all aspects taken into consideration. This is a completely customizable Executing Diversity KPI Dashboard To Monitor Workforce Executing Diversity Structure PDF that is available for immediate downloading. Download now and make an impact on your audience. Highlight the attractive features available with our PPTs.
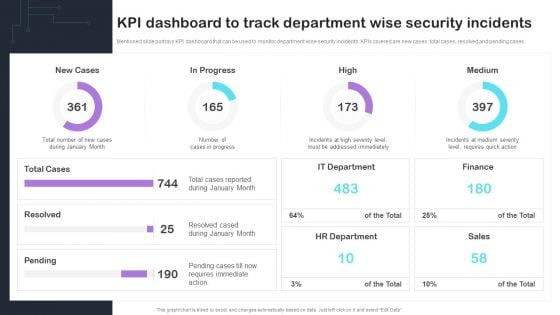
Cyber Risks And Incident Response Playbook KPI Dashboard To Track Department Wise Security Incidents Mockup PDF
Mentioned slide portrays KPI dashboard that can be used to monitor department wise security incidents. KPIs covered are new cases, total cases, resolved and pending cases. Presenting this PowerPoint presentation, titled Cyber Risks And Incident Response Playbook KPI Dashboard To Track Department Wise Security Incidents Mockup PDF, with topics curated by our researchers after extensive research. This editable presentation is available for immediate download and provides attractive features when used. Download now and captivate your audience. Presenting this Cyber Risks And Incident Response Playbook KPI Dashboard To Track Department Wise Security Incidents Mockup PDF. Our researchers have carefully researched and created these slides with all aspects taken into consideration. This is a completely customizable Cyber Risks And Incident Response Playbook KPI Dashboard To Track Department Wise Security Incidents Mockup PDF that is available for immediate downloading. Download now and make an impact on your audience. Highlight the attractive features available with our PPTs.
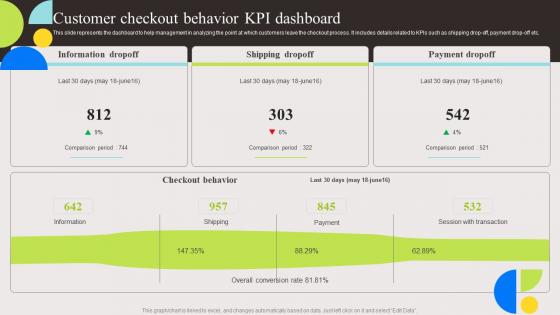
Customer Checkout Behavior KPI Evaluation And Deployment Of Enhanced Slides Pdf
This slide represents the dashboard to help management in analyzing the point at which customers leave the checkout process. It includes details related to KPIs such as shipping drop off, payment drop off etc. Present like a pro with Customer Checkout Behavior KPI Evaluation And Deployment Of Enhanced Slides Pdf Create beautiful presentations together with your team, using our easy to use presentation slides. Share your ideas in real time and make changes on the fly by downloading our templates. So whether you are in the office, on the go, or in a remote location, you can stay in sync with your team and present your ideas with confidence. With Slidegeeks presentation got a whole lot easier. Grab these presentations today. This slide represents the dashboard to help management in analyzing the point at which customers leave the checkout process. It includes details related to KPIs such as shipping drop off, payment drop off etc.
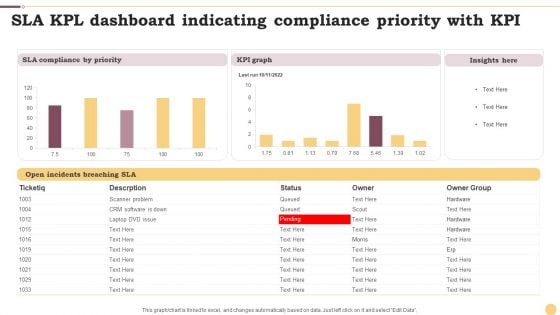
SLA KPL Dashboard Indicating Compliance Priority With KPI Ppt File Format PDF
This graph or chart is linked to excel, and changes automatically based on data. Just left click on it and select Edit Data. Showcasing this set of slides titled SLA KPL Dashboard Indicating Compliance Priority With KPI Ppt File Format PDF. The topics addressed in these templates are KPI Graph, Insights Here, SLA Compliance Priority. All the content presented in this PPT design is completely editable. Download it and make adjustments in color, background, font etc. as per your unique business setting.
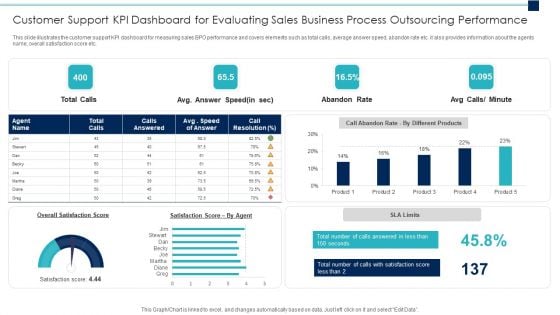
Customer Support Kpi Dashboard For Evaluating Sales Business Process Outsourcing Performance Slides PDF
Pitch your topic with ease and precision using this customer support kpi dashboard for evaluating sales business process outsourcing performance slides pdf. This layout presents information on customer support kpi dashboard for evaluating sales business process outsourcing performance. It is also available for immediate download and adjustment. So, changes can be made in the color, design, graphics or any other component to create a unique layout.
KPI Dashboard For Tracking Hospitality And Tourism Management Plan Performance Infographics PDF
This slide shows the KPI dashboard for monitoring the performance of strategy implemented. It covers KPIs such as bookings, location, housekeeping, etc. Pitch your topic with ease and precision using this KPI Dashboard For Tracking Hospitality And Tourism Management Plan Performance Infographics PDF. This layout presents information on Booking Type, Housekeeping, Check In Guest. It is also available for immediate download and adjustment. So, changes can be made in the color, design, graphics or any other component to create a unique layout.
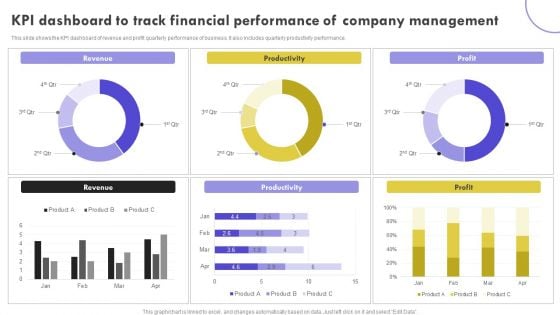
KPI Dashboard To Track Financial Performance Of Company Management Clipart PDF
This slide shows the KPI dashboard of revenue and profit quarterly performance of business. It also includes quarterly productivity performance. Pitch your topic with ease and precision using this KPI Dashboard To Track Financial Performance Of Company Management Clipart PDF. This layout presents information on Revenue, Productivity, Profit. It is also available for immediate download and adjustment. So, changes can be made in the color, design, graphics or any other component to create a unique layout.

KPI Dashboard Of Customer And Product Sales Performance Comparison Information PDF
This slide shows the KPI dashboard of client and product sales comparison. It also includes sales by location and total sales. Pitch your topic with ease and precision using this KPI Dashboard Of Customer And Product Sales Performance Comparison Information PDF. This layout presents information on Product Sales, Client Sales, Tim Santana. It is also available for immediate download and adjustment. So, changes can be made in the color, design, graphics or any other component to create a unique layout.
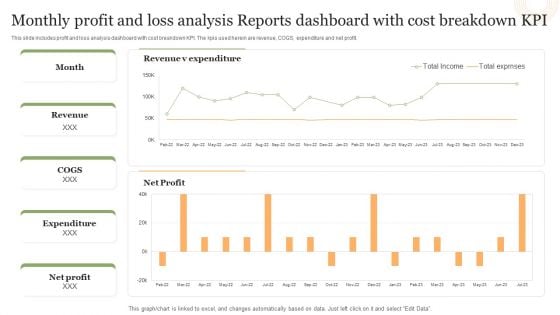
Monthly Profit And Loss Analysis Reports Dashboard With Cost Breakdown Kpi Structure PDF
This slide includes profit and loss analysis dashboard with cost breakdown KPI. The kpis used herein are revenue, COGS, expenditure and net profit.Pitch your topic with ease and precision using this Monthly Profit And Loss Analysis Reports Dashboard With Cost Breakdown Kpi Structure PDF. This layout presents information on Revenue Expenditure, Net Profit, Total Exprnses. It is also available for immediate download and adjustment. So, changes can be made in the color, design, graphics or any other component to create a unique layout.
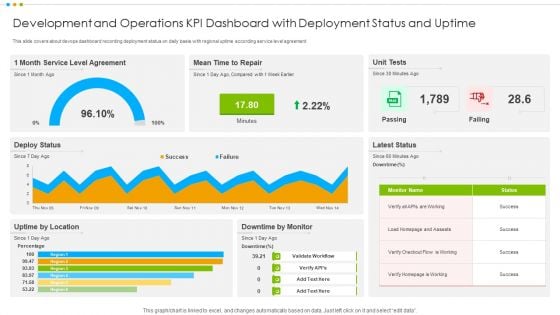
Development And Operations KPI Dashboard With Deployment Status And Uptime Structure PDF
This slide covers about devops dashboard recording deployment status on daily basis with regional uptime according service level agreement.Showcasing this set of slides titled Development And Operations KPI Dashboard With Deployment Status And Uptime Structure PDF The topics addressed in these templates are Development Operations, Kpi Dashboard, Deployment Uptime All the content presented in this PPT design is completely editable. Download it and make adjustments in color, background, font etc. as per your unique business setting.
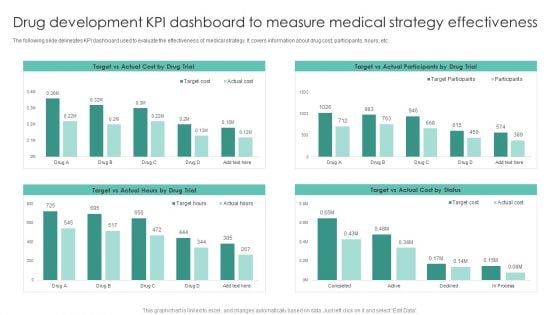
Drug Development KPI Dashboard To Measure Medical Strategy Effectiveness Demonstration PDF
The following slide delineates KPI dashboard used to evaluate the effectiveness of medical strategy. It covers information about drug cost, participants, hours, etc.Showcasing this set of slides titled Drug Development KPI Dashboard To Measure Medical Strategy Effectiveness Demonstration PDF. The topics addressed in these templates are Target Actual, Actual Hours Actual Participants. All the content presented in this PPT design is completely editable. Download it and make adjustments in color, background, font etc. as per your unique business setting.
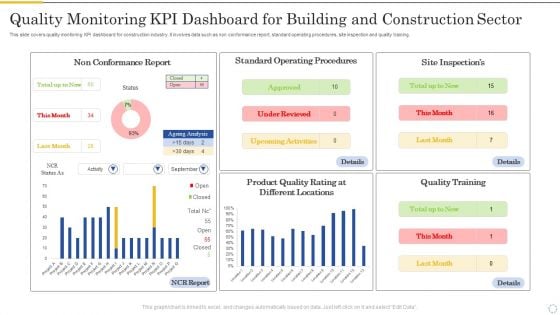
Quality Monitoring Kpi Dashboard For Building And Construction Sector Portrait PDF
This slide covers quality monitoring KPI dashboard for construction industry. It involves data such as non conformance report, standard operating procedures, site inspection and quality training. Showcasing this set of slides titled Quality Monitoring Kpi Dashboard For Building And Construction Sector Portrait PDF. The topics addressed in these templates are Non Conformance Report, Standard Operating, Procedures. All the content presented in this PPT design is completely editable. Download it and make adjustments in color, background, font etc. as per your unique business setting.
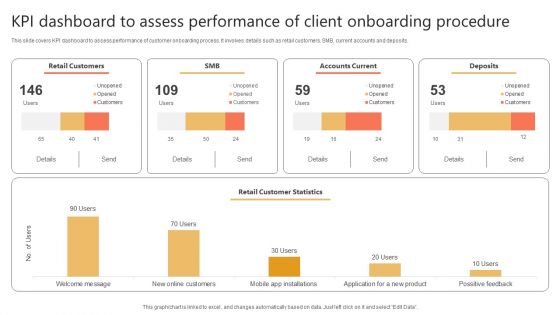
Kpi Dashboard To Assess Performance Of Client Onboarding Procedure Designs PDF
This slide covers KPI dashboard to assess performance of customer onboarding process. It involves details such as retail customers, SMB, current accounts and deposits. Showcasing this set of slides titled Kpi Dashboard To Assess Performance Of Client Onboarding Procedure Designs PDF. The topics addressed in these templates are Retail Customers, Accounts Current, Deposits. All the content presented in this PPT design is completely editable. Download it and make adjustments in color, background, font etc. as per your unique business setting.
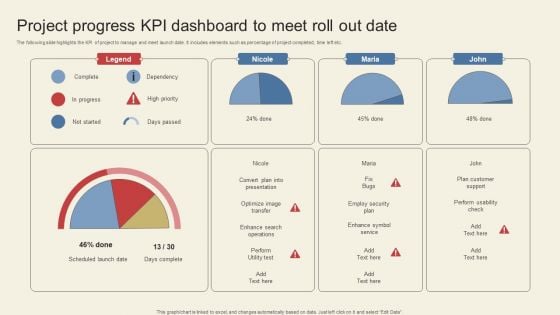
Project Progress Kpi Dashboard To Meet Roll Out Date Themes PDF
The following slide highlights the KPI of project to manage and meet launch date. It includes elements such as percentage of project completed, time left etc. Showcasing this set of slides titled Project Progress Kpi Dashboard To Meet Roll Out Date Themes PDF. The topics addressed in these templates are Legend, Nicole, Maria. All the content presented in this PPT design is completely editable. Download it and make adjustments in color, background, font etc. as per your unique business setting.
Catering Business Advertisement Plan KPI Dashboard With Revenue Comparison Icons PDF
This slide shows the KPI dashboard of the catering industry to evaluate the actual and potential targets. It includes KPIs such as expenditure, sales revenue, beverage, etc. Showcasing this set of slides titled Catering Business Advertisement Plan KPI Dashboard With Revenue Comparison Icons PDF. The topics addressed in these templates are Expenditure, Revenue Comparison, Department. All the content presented in this PPT design is completely editable. Download it and make adjustments in color, background, font etc. as per your unique business setting.
Service Level Agreement KPI Dashboard With Graph And Analytics Icon Inspiration PDF
Persuade your audience using this Service Level Agreement KPI Dashboard With Graph And Analytics Icon Inspiration PDF. This PPT design covers three stages, thus making it a great tool to use. It also caters to a variety of topics including Service Level, Agreement KPI Dashboard, Graph And Analytics, Icon. Download this PPT design now to present a convincing pitch that not only emphasizes the topic but also showcases your presentation skills.
Vendor Performance KPI Analytical Dashboard Icon For Data Management Background PDF
Persuade your audience using this Vendor Performance KPI Analytical Dashboard Icon For Data Management Background PDF. This PPT design covers three stages, thus making it a great tool to use. It also caters to a variety of topics including Vendor Performance, KPI Analytical Dashboard, Icon Data Management. Download this PPT design now to present a convincing pitch that not only emphasizes the topic but also showcases your presentation skills.
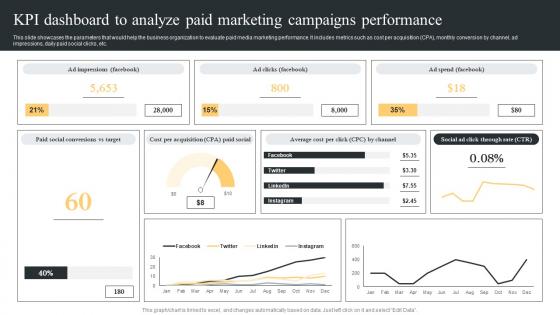
KPI Dashboard To Analyze Paid Comprehensive Guide For Paid Media Marketing Strategies Sample Pdf
This slide showcases the parameters that would help the business organization to evaluate paid media marketing performance. It includes metrics such as cost per acquisition CPA, monthly conversion by channel, ad impressions, daily paid social clicks, etc. Coming up with a presentation necessitates that the majority of the effort goes into the content and the message you intend to convey. The visuals of a PowerPoint presentation can only be effective if it supplements and supports the story that is being told. Keeping this in mind our experts created KPI Dashboard To Analyze Paid Comprehensive Guide For Paid Media Marketing Strategies Sample Pdf to reduce the time that goes into designing the presentation. This way, you can concentrate on the message while our designers take care of providing you with the right template for the situation. This slide showcases the parameters that would help the business organization to evaluate paid media marketing performance. It includes metrics such as cost per acquisition CPA, monthly conversion by channel, ad impressions, daily paid social clicks, etc.
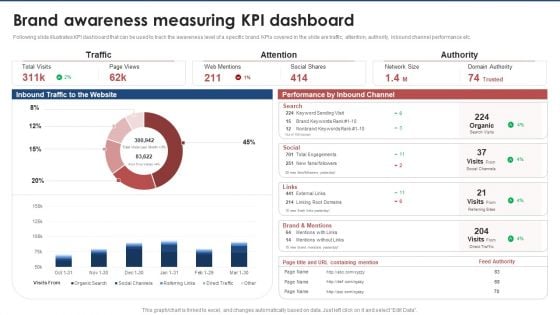
Brand Awareness Measuring Kpi Dashboard Brand Value Estimation Guide Formats PDF
Following slide illustrates KPI dashboard that can be used to track the awareness level of a specific brand. KPIs covered in the slide are traffic, attention, authority, inbound channel performance etc.There are so many reasons you need a Brand Awareness Measuring Kpi Dashboard Brand Value Estimation Guide Formats PDF. The first reason is you can not spend time making everything from scratch, Thus, Slidegeeks has made presentation templates for you too. You can easily download these templates from our website easily.
Personalized Email Marketing Campaign Kpi Dashboard Guide For Data Driven Advertising Icons Pdf
This slide represents the key performance metrics to dashboard to monitor and analyze progress of personalized email marketing campaign conducted by the enterprise. It includes details related to KPIs such as wen conversions, subscribers, list growth rate etc.Coming up with a presentation necessitates that the majority of the effort goes into the content and the message you intend to convey. The visuals of a PowerPoint presentation can only be effective if it supplements and supports the story that is being told. Keeping this in mind our experts created Personalized Email Marketing Campaign Kpi Dashboard Guide For Data Driven Advertising Icons Pdf to reduce the time that goes into designing the presentation. This way, you can concentrate on the message while our designers take care of providing you with the right template for the situation. This slide represents the key performance metrics to dashboard to monitor and analyze progress of personalized email marketing campaign conducted by the enterprise. It includes details related to KPIs such as wen conversions, subscribers, list growth rate etc.
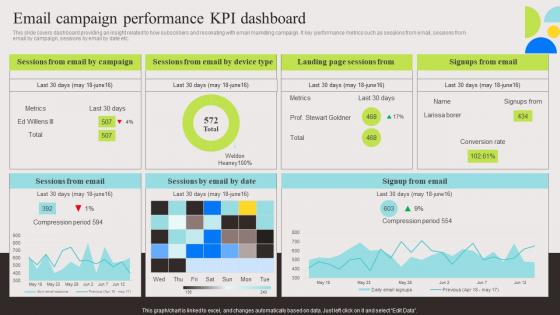
Email Campaign Performance KPI Evaluation And Deployment Of Enhanced Graphics Pdf
This slide covers dashboard providing an insight related to how subscribers and resonating with email marketing campaign. It key performance metrics such as sessions from email, sessions from email by campaign, sessions by email by date etc. Are you in need of a template that can accommodate all of your creative concepts This one is crafted professionally and can be altered to fit any style. Use it with Google Slides or PowerPoint. Include striking photographs, symbols, depictions, and other visuals. Fill, move around, or remove text boxes as desired. Test out color palettes and font mixtures. Edit and save your work, or work with colleagues. Download Email Campaign Performance KPI Evaluation And Deployment Of Enhanced Graphics Pdf and observe how to make your presentation outstanding. Give an impeccable presentation to your group and make your presentation unforgettable. This slide covers dashboard providing an insight related to how subscribers and resonating with email marketing campaign. It key performance metrics such as sessions from email, sessions from email by campaign, sessions by email by date etc.
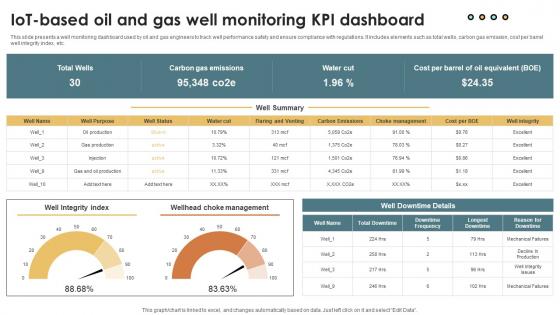
IoT Solutions For Oil IoT Based Oil And Gas Well Monitoring KPI Dashboard IoT SS V
This slide presents a well monitoring dashboard used by oil and gas engineers to track well performance safety and ensure compliance with regulations. It includes elements such as total wells, carbon gas emission, cost per barrel well integrity index, etc. This modern and well-arranged IoT Solutions For Oil IoT Based Oil And Gas Well Monitoring KPI Dashboard IoT SS V provides lots of creative possibilities. It is very simple to customize and edit with the Powerpoint Software. Just drag and drop your pictures into the shapes. All facets of this template can be edited with Powerpoint, no extra software is necessary. Add your own material, put your images in the places assigned for them, adjust the colors, and then you can show your slides to the world, with an animated slide included. This slide presents a well monitoring dashboard used by oil and gas engineers to track well performance safety and ensure compliance with regulations. It includes elements such as total wells, carbon gas emission, cost per barrel well integrity index, etc.
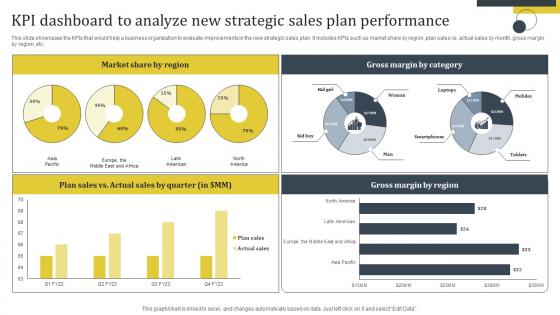
Enhance Customer Retention Kpi Dashboard To Analyze New Strategic Sales Plan Elements Pdf
This slide showcases the KPIs that would help a business organization to evaluate improvements in the new strategic sales plan. It includes KPIs such as market share by region, plan sales vs. actual sales by month, gross margin by region, etc. Welcome to our selection of the Enhance Customer Retention Kpi Dashboard To Analyze New Strategic Sales Plan Elements Pdf. These are designed to help you showcase your creativity and bring your sphere to life. Planning and Innovation are essential for any business that is just starting out. This collection contains the designs that you need for your everyday presentations. All of our PowerPoints are 100 percent editable, so you can customize them to suit your needs. This multi-purpose template can be used in various situations. Grab these presentation templates today. This slide showcases the KPIs that would help a business organization to evaluate improvements in the new strategic sales plan. It includes KPIs such as market share by region, plan sales vs. actual sales by month, gross margin by region, etc.
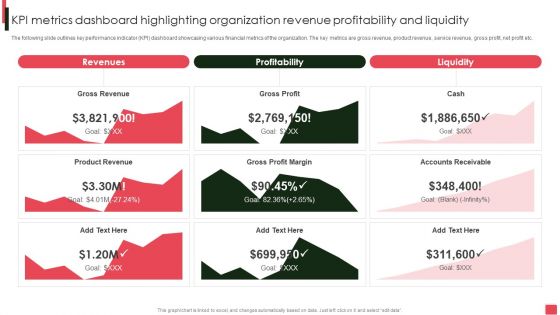
Overview Of Organizational Kpi Metrics Dashboard Highlighting Organization Revenue Brochure PDF
The following slide outlines key performance indicator KPI dashboard showcasing various financial metrics of the organization. The key metrics are gross revenue, product revenue, service revenue, gross profit, net profit etc. If your project calls for a presentation, then Slidegeeks is your go-to partner because we have professionally designed, easy-to-edit templates that are perfect for any presentation. After downloading, you can easily edit Overview Of Organizational Kpi Metrics Dashboard Highlighting Organization Revenue Brochure PDF and make the changes accordingly. You can rearrange slides or fill them with different images. Check out all the handy templates.
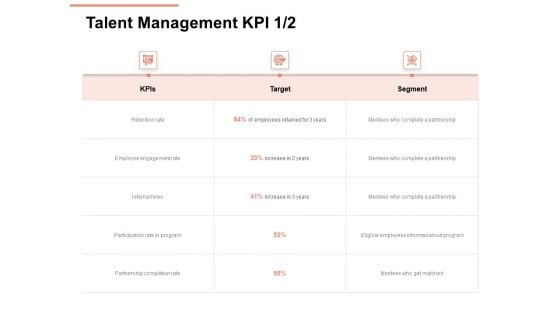
Workforce Planning System Talent Management KPI Ppt PowerPoint Presentation Outline Vector PDF
Deliver an awe-inspiring pitch with this creative workforce planning system talent management kpi ppt powerpoint presentation outline vector pdf bundle. Topics like target, kpis, segment, retention rate, employee engagement rate, internal hires, participation rate in program, partnership completion rate can be discussed with this completely editable template. It is available for immediate download depending on the needs and requirements of the user.
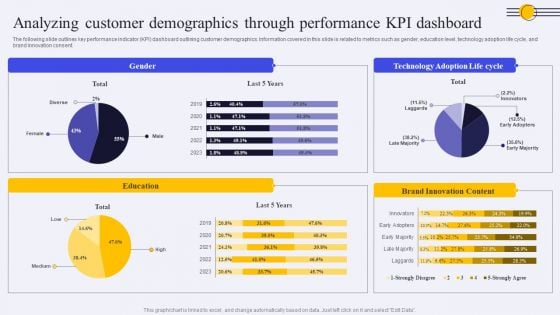
Analyzing Customer Demographics Through Performance KPI Dashboard Ppt PowerPoint Presentation File Model PDF
The following slide outlines key performance indicator KPI dashboard outlining customer demographics. Information covered in this slide is related to metrics such as gender, education level, technology adoption life cycle, and brand innovation consent. Are you searching for a Analyzing Customer Demographics Through Performance KPI Dashboard Ppt PowerPoint Presentation File Model PDF that is uncluttered, straightforward, and original Its easy to edit, and you can change the colors to suit your personal or business branding. For a presentation that expresses how much effort you have put in, this template is ideal. With all of its features, including tables, diagrams, statistics, and lists, its perfect for a business plan presentation. Make your ideas more appealing with these professional slides. Download Analyzing Customer Demographics Through Performance KPI Dashboard Ppt PowerPoint Presentation File Model PDF from Slidegeeks today.
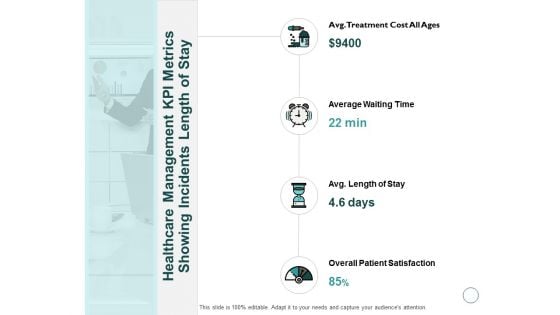
Healthcare Management KPI Metrics Showing Incidents Length Of Stay Ppt PowerPoint Presentation Outline Maker
Presenting this set of slides with name healthcare management kpi metrics showing incidents length of stay ppt powerpoint presentation outline maker. This is a four stage process. The stages in this process are business, management, planning, strategy, marketing. This is a completely editable PowerPoint presentation and is available for immediate download. Download now and impress your audience.
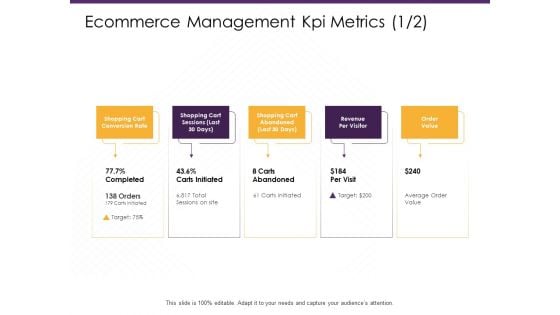
Ecommerce Management Kpi Metrics Value Ppt PowerPoint Presentation Outline Infographics PDF
Presenting this set of slides with name ecommerce management kpi metrics value ppt powerpoint presentation outline infographics pdf. This is a five stage process. The stages in this process are shopping cart conversion rate, shopping cart sessions, shopping cart abandoned, revenue per visitor, order value. This is a completely editable PowerPoint presentation and is available for immediate download. Download now and impress your audience.
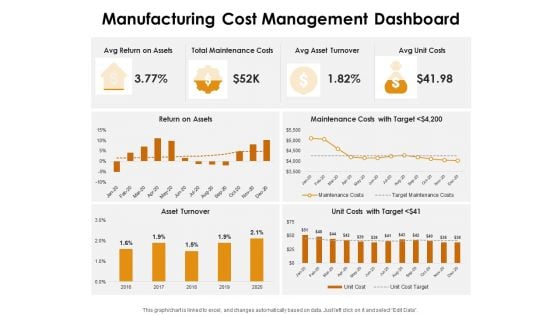
KPI Dashboards Per Industry Manufacturing Cost Management Dashboard Ppt PowerPoint Presentation Outline Design Templates PDF
Deliver an awe-inspiring pitch with this creative kpi dashboards per industry manufacturing cost management dashboard ppt powerpoint presentation outline design templates pdf bundle. Topics like avg return assets, avg asset turnover, avg unit costs can be discussed with this completely editable template. It is available for immediate download depending on the needs and requirements of the user.
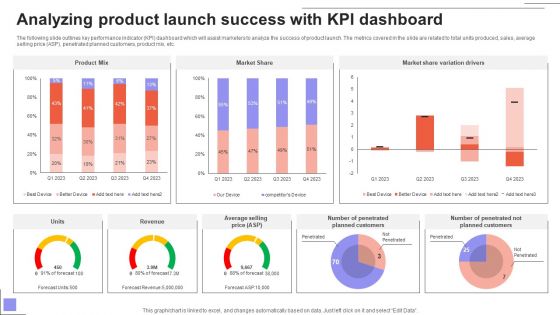
Overview Of The Food Analyzing Product Launch Success With KPI Dashboard Mockup PDF
The following slide outlines key performance indicator KPI dashboard which will assist marketers to analyze the success of product launch. The metrics covered in the slide are related to total units produced, sales, average selling price ASP, penetrated planned customers, product mix, etc. Find a pre-designed and impeccable Overview Of The Food Analyzing Product Launch Success With KPI Dashboard Mockup PDF. The templates can ace your presentation without additional effort. You can download these easy-to-edit presentation templates to make your presentation stand out from others. So, what are you waiting for Download the template from Slidegeeks today and give a unique touch to your presentation.
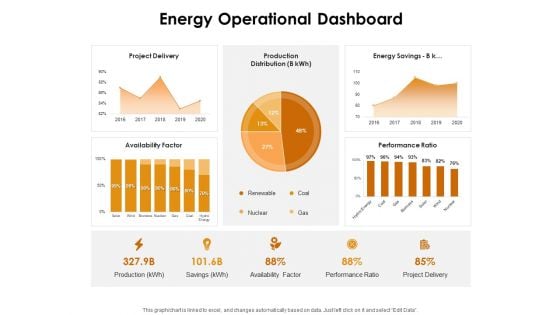
KPI Dashboards Per Industry Energy Operational Dashboard Ppt PowerPoint Presentation Outline Shapes PDF
Deliver and pitch your topic in the best possible manner with this kpi dashboards per industry energy operational dashboard ppt powerpoint presentation outline shapes pdf. Use them to share invaluable insights on project delivery, production distribution, energy savings, availability factor, coal, gas and impress your audience. This template can be altered and modified as per your expectations. So, grab it now.
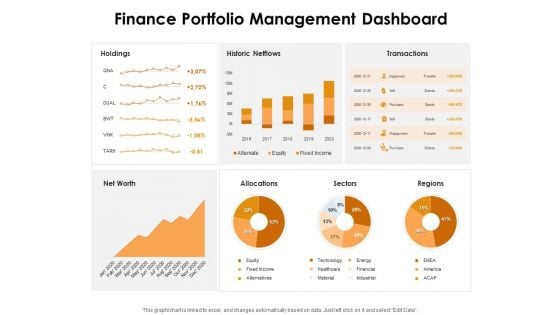
KPI Dashboards Per Industry Finance Portfolio Management Dashboard Ppt PowerPoint Presentation Outline Ideas PDF
Deliver an awe-inspiring pitch with this creative kpi dashboards per industry finance portfolio management dashboard ppt powerpoint presentation outline ideas pdf bundle. Topics like holdings, historic netflows, transactions, net worth, allocations, sectors, regions can be discussed with this completely editable template. It is available for immediate download depending on the needs and requirements of the user.
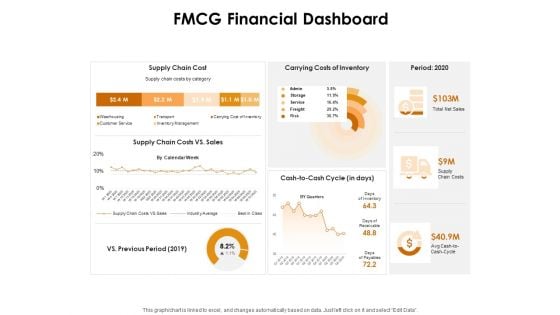
KPI Dashboards Per Industry FMCG Financial Dashboard Ppt PowerPoint Presentation Outline Information PDF
Deliver an awe-inspiring pitch with this creative kpi dashboards per industry fmcg financial dashboard ppt powerpoint presentation outline information pdf bundle. Topics like supply chain cost, carrying costs of inventory, period 2020, supply chain costs vs sales can be discussed with this completely editable template. It is available for immediate download depending on the needs and requirements of the user.
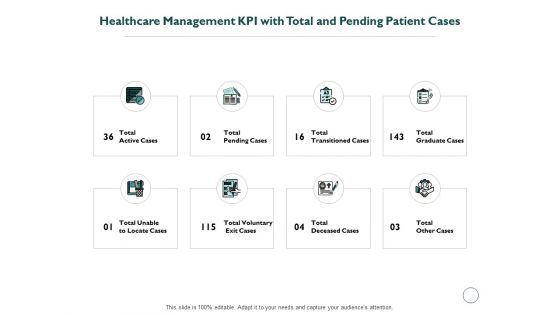
Healthcare Management KPI With Total And Pending Patient Cases Ppt PowerPoint Presentation Outline Background Image
Presenting this set of slides with name healthcare management kpi with total and pending patient cases ppt powerpoint presentation outline background image. This is a eight stage process. The stages in this process are business, management, planning, strategy, marketing. This is a completely editable PowerPoint presentation and is available for immediate download. Download now and impress your audience.
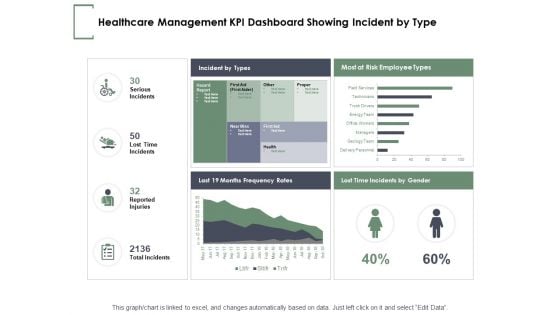
Healthcare Management KPI Dashboard Showing Incident By Type Ppt PowerPoint Presentation Pictures Outline
Presenting this set of slides with name healthcare management kpi dashboard showing incident by type ppt powerpoint presentation pictures outline. The topics discussed in these slides are serious incidents, lost time incidents, reported injuries, total incidents, management. This is a completely editable PowerPoint presentation and is available for immediate download. Download now and impress your audience.
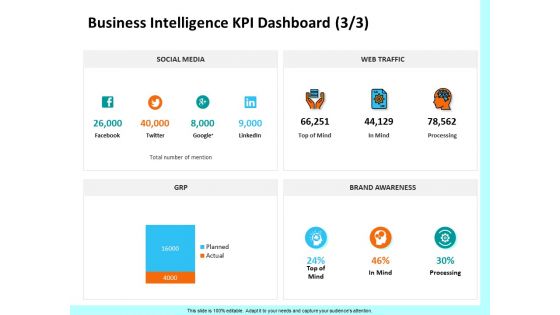
Firm Productivity Administration Business Intelligence KPI Dashboard Mind Ppt PowerPoint Presentation Outline Graphics PDF
Presenting this set of slides with name firm productivity administration business intelligence kpi dashboard mind ppt powerpoint presentation outline graphics pdf. This is a four stage process. The stages in this process are social media, web traffic, grp, brand awareness, mind, processing. This is a completely editable PowerPoint presentation and is available for immediate download. Download now and impress your audience.
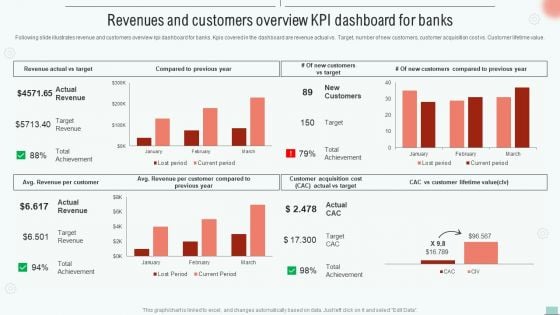
Implementing BPM Tool To Enhance Operational Efficiency Revenues And Customers Overview Kpi Dashboard Rules PDF
Following slide illustrates revenue and customers overview kpi dashboard for banks. Kpis covered in the dashboard are revenue actual vs. Target, number of new customers, customer acquisition cost vs. Customer lifetime value.This Implementing BPM Tool To Enhance Operational Efficiency Revenues And Customers Overview Kpi Dashboard Rules PDF is perfect for any presentation, be it in front of clients or colleagues. It is a versatile and stylish solution for organizing your meetings. The Implementing BPM Tool To Enhance Operational Efficiency Revenues And Customers Overview Kpi Dashboard Rules PDF features a modern design for your presentation meetings. The adjustable and customizable slides provide unlimited possibilities for acing up your presentation. Slidegeeks has done all the homework before launching the product for you. So, do not wait, grab the presentation templates today.
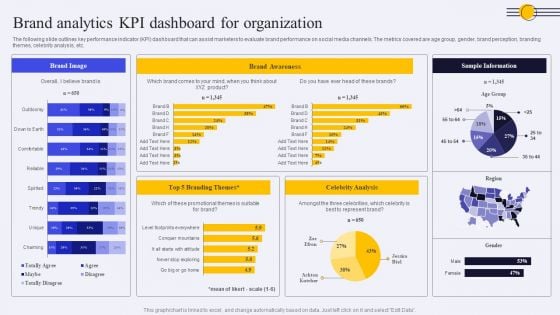
Brand Analytics KPI Dashboard For Organization Ppt PowerPoint Presentation Diagram PDF
The following slide outlines key performance indicator KPI dashboard that can assist marketers to evaluate brand performance on social media channels. The metrics covered are age group, gender, brand perception, branding themes, celebrity analysis, etc. Take your projects to the next level with our ultimate collection of Brand Analytics KPI Dashboard For Organization Ppt PowerPoint Presentation Diagram PDF. Slidegeeks has designed a range of layouts that are perfect for representing task or activity duration, keeping track of all your deadlines at a glance. Tailor these designs to your exact needs and give them a truly corporate look with your own brand colors they will make your projects stand out from the rest.
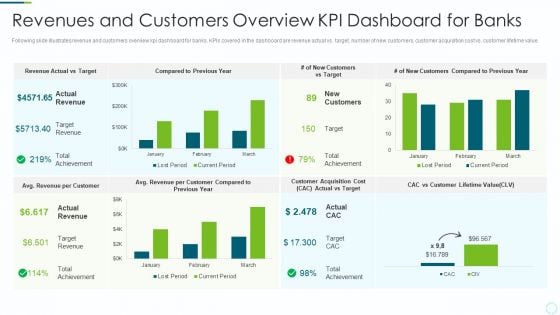
Implementing BPM Techniques Revenues And Customers Overview KPI Dashboard For Banks Microsoft PDF
Following slide illustrates revenue and customers overview kpi dashboard for banks. KPIs covered in the dashboard are revenue actual vs. target, number of new customers, customer acquisition cost vs. customer lifetime value. Deliver an awe inspiring pitch with this creative Implementing BPM Techniques Revenues And Customers Overview KPI Dashboard For Banks Microsoft PDF bundle. Topics like Target Revenue, Customers Compared, Customer Lifetime can be discussed with this completely editable template. It is available for immediate download depending on the needs and requirements of the user.

Estimating Business Overall Kpi Metrics Dashboard Highlighting Organization Revenue Clipart PDF
The following slide outlines key performance indicator KPI dashboard showcasing various financial metrics of the organization. The key metrics are gross revenue, product revenue, service revenue, gross profit, net profit etc. Formulating a presentation can take up a lot of effort and time, so the content and message should always be the primary focus. The visuals of the PowerPoint can enhance the presenters message, so our Estimating Business Overall Kpi Metrics Dashboard Highlighting Organization Revenue Clipart PDF was created to help save time. Instead of worrying about the design, the presenter can concentrate on the message while our designers work on creating the ideal templates for whatever situation is needed. Slidegeeks has experts for everything from amazing designs to valuable content, we have put everything into Estimating Business Overall Kpi Metrics Dashboard Highlighting Organization Revenue Clipart PDF.
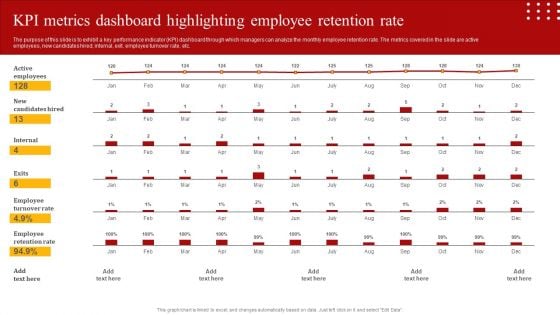
Staff Retention Techniques To Minimize Hiring Expenses KPI Metrics Dashboard Highlighting Employee Retention Template PDF
The purpose of this slide is to exhibit a key performance indicator KPI dashboard through which managers can analyze the monthly employee retention rate. The metrics covered in the slide are active employees, new candidates hired, internal, exit, employee turnover rate, etc. Do you have to make sure that everyone on your team knows about any specific topic I yes, then you should give Staff Retention Techniques To Minimize Hiring Expenses KPI Metrics Dashboard Highlighting Employee Retention Template PDF a try. Our experts have put a lot of knowledge and effort into creating this impeccable Staff Retention Techniques To Minimize Hiring Expenses KPI Metrics Dashboard Highlighting Employee Retention Template PDF. You can use this template for your upcoming presentations, as the slides are perfect to represent even the tiniest detail. You can download these templates from the Slidegeeks website and these are easy to edit. So grab these today.
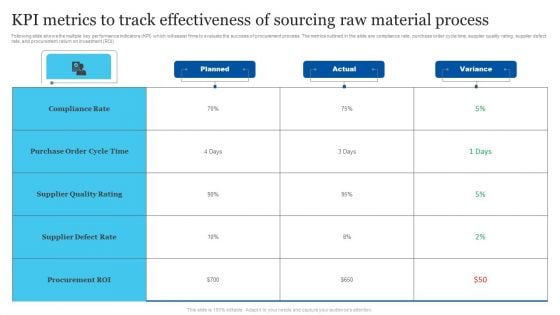
KPI Metrics To Track Effectiveness Of Sourcing Raw Material Process Portrait PDF
Following slide shows the multiple key performance indicators KPI which will assist firms to evaluate the success of procurement process. The metrics outlined in the slide are compliance rate, purchase order cycle time, supplier quality rating, supplier defect rate, and procurement return on investment ROI. Pitch your topic with ease and precision using this KPI Metrics To Track Effectiveness Of Sourcing Raw Material Process Portrait PDF. This layout presents information on Purchase Order Cycle Time, Supplier Defect Rate, Procurement Roi. It is also available for immediate download and adjustment. So, changes can be made in the color, design, graphics or any other component to create a unique layout.
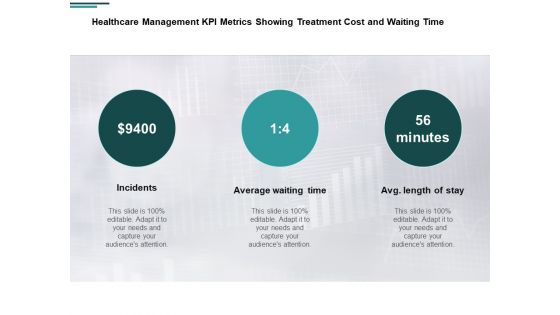
Healthcare Management KPI Metrics Showing Treatment Cost And Waiting Time Ppt PowerPoint Presentation Styles Slideshow
Presenting this set of slides with name healthcare management kpi metrics showing treatment cost and waiting time ppt powerpoint presentation styles slideshow. This is a three stage process. The stages in this process are incidents, average waiting time, business, management, marketing. This is a completely editable PowerPoint presentation and is available for immediate download. Download now and impress your audience.
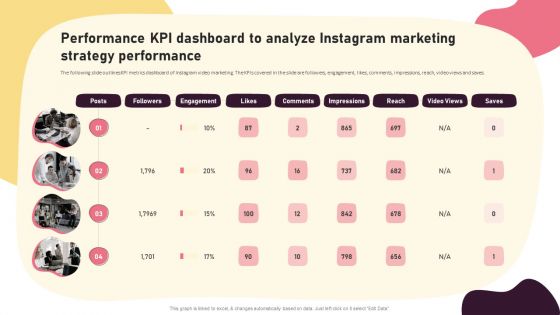
Video Promotion Techniques Performance KPI Dashboard To Analyze Instagram Marketing Portrait PDF
The following slide outlines KPI metrics dashboard of Instagram video marketing. The KPIs covered in the slide are followers, engagement, likes, comments, impressions, reach, video views and saves. Here you can discover an assortment of the finest PowerPoint and Google Slides templates. With these templates, you can create presentations for a variety of purposes while simultaneously providing your audience with an eye-catching visual experience. Download Video Promotion Techniques Performance KPI Dashboard To Analyze Instagram Marketing Portrait PDF to deliver an impeccable presentation. These templates will make your job of preparing presentations much quicker, yet still, maintain a high level of quality. Slidegeeks has experienced researchers who prepare these templates and write high-quality content for you. Later on, you can personalize the content by editing the Video Promotion Techniques Performance KPI Dashboard To Analyze Instagram Marketing Portrait PDF.
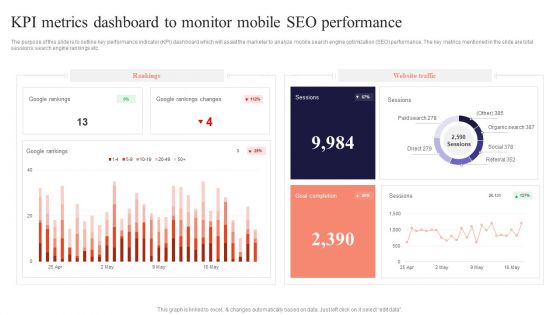
KPI Metrics Dashboard To Monitor Mobile Performing Mobile SEO Audit To Analyze Web Traffic Graphics PDF
The purpose of this slide is to outline key performance indicator KPI dashboard which will assist the marketer to analyze mobile search engine optimization SEO performance. The key metrics mentioned in the slide are total sessions, search engine rankings etc.Find highly impressive KPI Metrics Dashboard To Monitor Mobile Performing Mobile SEO Audit To Analyze Web Traffic Graphics PDF on Slidegeeks to deliver a meaningful presentation. You can save an ample amount of time using these presentation templates. No need to worry to prepare everything from scratch because Slidegeeks experts have already done a huge research and work for you. You need to download KPI Metrics Dashboard To Monitor Mobile Performing Mobile SEO Audit To Analyze Web Traffic Graphics PDF for your upcoming presentation. All the presentation templates are 100 precent editable and you can change the color and personalize the content accordingly. Download now.


 Continue with Email

 Home
Home


