Kpi
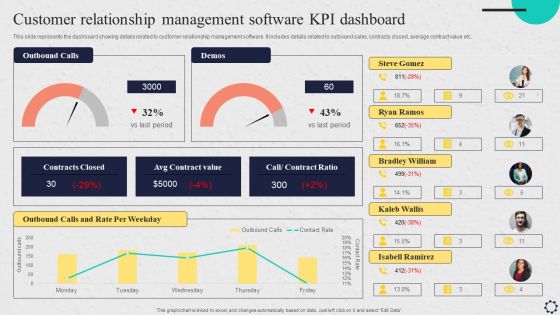
Software Implementation Strategy Customer Relationship Management Software Kpi Dashboard Clipart PDF
This slide represents the dashboard showing details related to customer relationship management software. It includes details related to outbound sales, contracts closed, average contract value etc. Are you in need of a template that can accommodate all of your creative concepts This one is crafted professionally and can be altered to fit any style. Use it with Google Slides or PowerPoint. Include striking photographs, symbols, depictions, and other visuals. Fill, move around, or remove text boxes as desired. Test out color palettes and font mixtures. Edit and save your work, or work with colleagues. Download Software Implementation Strategy Customer Relationship Management Software Kpi Dashboard Clipart PDF and observe how to make your presentation outstanding. Give an impeccable presentation to your group and make your presentation unforgettable.
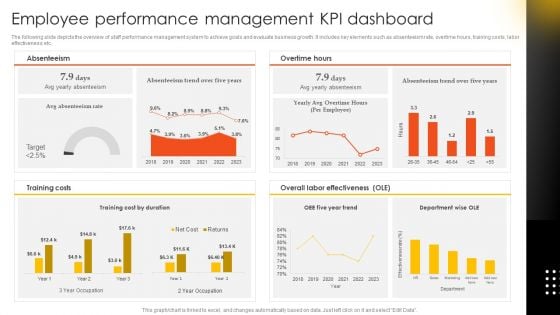
Effective Staff Performance Optimization Techniques Employee Performance Management Kpi Dashboard Professional PDF
The following slide depicts the overview of staff performance management system to achieve goals and evaluate business growth. It includes key elements such as absenteeism rate, overtime hours, training costs, labor effectiveness etc. Slidegeeks is one of the best resources for PowerPoint templates. You can download easily and regulate Effective Staff Performance Optimization Techniques Employee Performance Management Kpi Dashboard Professional PDF for your personal presentations from our wonderful collection. A few clicks is all it takes to discover and get the most relevant and appropriate templates. Use our Templates to add a unique zing and appeal to your presentation and meetings. All the slides are easy to edit and you can use them even for advertisement purposes.

Techniques To Optimize Kpi Dashboard To Assess Employee Training Performance Designs PDF
This slide covers dashboard to analyze performance of training program. It involves details such as total number of classes, compensation cost, training hours and employee satisfaction rate. Slidegeeks is here to make your presentations a breeze with Techniques To Optimize Kpi Dashboard To Assess Employee Training Performance Designs PDF With our easy-to-use and customizable templates, you can focus on delivering your ideas rather than worrying about formatting. With a variety of designs to choose from, youre sure to find one that suits your needs. And with animations and unique photos, illustrations, and fonts, you can make your presentation pop. So whether youre giving a sales pitch or presenting to the board, make sure to check out Slidegeeks first.
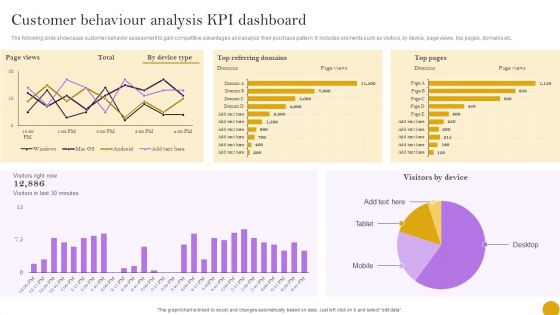
Comprehensive Customer Data Platform Guide Optimizing Promotional Initiatives Customer Behaviour Analysis KPI Brochure PDF
The following slide showcases customer behavior assessment to gain competitive advantages and analyze their purchase pattern. It includes elements such as visitors, by device, page views, top pages, domains etc. Coming up with a presentation necessitates that the majority of the effort goes into the content and the message you intend to convey. The visuals of a PowerPoint presentation can only be effective if it supplements and supports the story that is being told. Keeping this in mind our experts created Comprehensive Customer Data Platform Guide Optimizing Promotional Initiatives Customer Behaviour Analysis KPI Brochure PDF to reduce the time that goes into designing the presentation. This way, you can concentrate on the message while our designers take care of providing you with the right template for the situation.

Strategic Talent Development HR KPI Dashboard To Track Employee Turnover Rate Summary PDF
This slide dashboard that can help organization to track employee turnover rate after implementing succession plan. Other KPIs are absenteeism rate, employees hired and left, employment status etc. This modern and well-arranged Strategic Talent Development HR KPI Dashboard To Track Employee Turnover Rate Summary PDF provides lots of creative possibilities. It is very simple to customize and edit with the Powerpoint Software. Just drag and drop your pictures into the shapes. All facets of this template can be edited with Powerpoint, no extra software is necessary. Add your own material, put your images in the places assigned for them, adjust the colors, and then you can show your slides to the world, with an animated slide included.
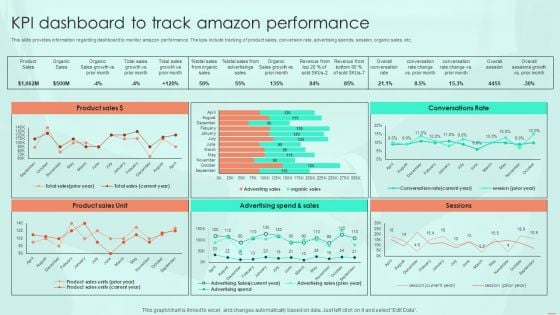
KPI Dashboard To Track Amazon Performance Ppt PowerPoint Presentation File Background Images PDF
This slide provides information regarding dashboard to monitor amazon performance. The kpis include tracking of product sales, conversion rate, advertising spends, session, organic sales, etc. Are you in need of a template that can accommodate all of your creative concepts This one is crafted professionally and can be altered to fit any style. Use it with Google Slides or PowerPoint. Include striking photographs, symbols, depictions, and other visuals. Fill, move around, or remove text boxes as desired. Test out color palettes and font mixtures. Edit and save your work, or work with colleagues. Download KPI Dashboard To Track Amazon Performance Ppt PowerPoint Presentation File Background Images PDF and observe how to make your presentation outstanding. Give an impeccable presentation to your group and make your presentation unforgettable.
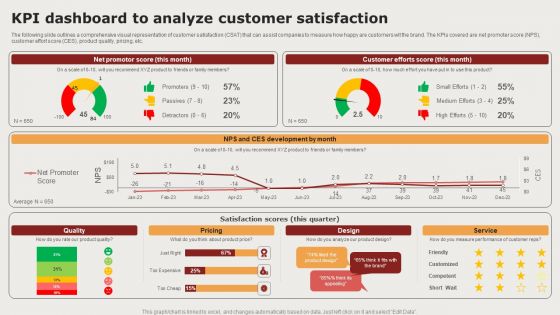
Creating Positioning Techniques For Market Research Kpi Dashboard To Analyze Customer Satisfaction Mockup PDF
The following slide outlines a comprehensive visual representation of customer satisfaction CSAT that can assist companies to measure how happy are customers wit the brand. The KPIs covered are net promoter score NPS, customer effort score CES, product quality, pricing, etc. Want to ace your presentation in front of a live audience Our Creating Positioning Techniques For Market Research Kpi Dashboard To Analyze Customer Satisfaction Mockup PDF can help you do that by engaging all the users towards you. Slidegeeks experts have put their efforts and expertise into creating these impeccable powerpoint presentations so that you can communicate your ideas clearly. Moreover, all the templates are customizable, and easy to edit and downloadable. Use these for both personal and commercial use.
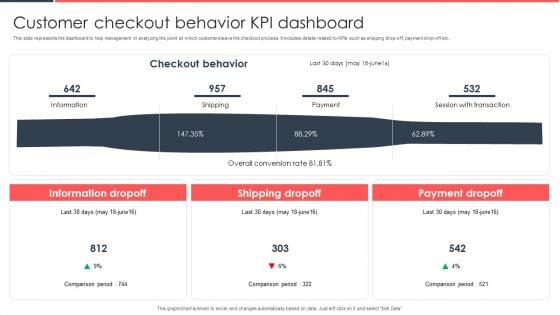
Implementing Management System To Enhance Ecommerce Processes Customer Checkout Behavior KPI Dashboard Clipart PDF
This slide represents the dashboard to help management in analyzing the point at which customers leave the checkout process. It includes details related to KPIs such as shipping drop-off, payment drop-off etc. This modern and well arranged Implementing Management System To Enhance Ecommerce Processes Customer Checkout Behavior KPI Dashboard Clipart PDF provides lots of creative possibilities. It is very simple to customize and edit with the Powerpoint Software. Just drag and drop your pictures into the shapes. All facets of this template can be edited with Powerpoint no extra software is necessary. Add your own material, put your images in the places assigned for them, adjust the colors, and then you can show your slides to the world, with an animated slide included.

Business Intelligence KPI Dashboard Ppt PowerPoint Presentation Complete Deck With Slides
Improve your presentation delivery using this Business Intelligence KPI Dashboard Ppt PowerPoint Presentation Complete Deck With Slides. Support your business vision and objectives using this well-structured PPT deck. This template offers a great starting point for delivering beautifully designed presentations on the topic of your choice. Comprising sixteen this professionally designed template is all you need to host discussion and meetings with collaborators. Each slide is self-explanatory and equipped with high-quality graphics that can be adjusted to your needs. Therefore, you will face no difficulty in portraying your desired content using this PPT slideshow. This PowerPoint slideshow contains every important element that you need for a great pitch. It is not only editable but also available for immediate download and utilization. The color, font size, background, shapes everything can be modified to create your unique presentation layout. Therefore, download it now.
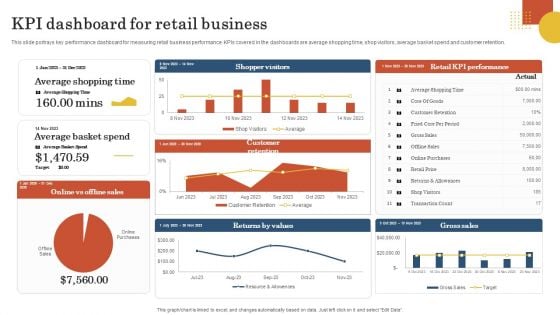
Retail Business Operation Management To Optimize Customer Experience KPI Dashboard For Retail Business Download PDF
This slide portrays key performance dashboard for measuring retail business performance. KPIs covered in the dashboards are average shopping time, shop visitors, average basket spend and customer retention. Are you in need of a template that can accommodate all of your creative concepts This one is crafted professionally and can be altered to fit any style. Use it with Google Slides or PowerPoint. Include striking photographs, symbols, depictions, and other visuals. Fill, move around, or remove text boxes as desired. Test out color palettes and font mixtures. Edit and save your work, or work with colleagues. Download Retail Business Operation Management To Optimize Customer Experience KPI Dashboard For Retail Business Download PDF and observe how to make your presentation outstanding. Give an impeccable presentation to your group and make your presentation unforgettable.
Tracking The Improvements In HR Recruitment Process With KPI Dashboard Introduction PDF
This slide showcases the KPIs that would help a business organization to track the improvements in the new recruitment process. It includes technical hiring, non-technical hiring, current hiring pipeline, etc. This Tracking The Improvements In HR Recruitment Process With KPI Dashboard Introduction PDF from Slidegeeks makes it easy to present information on your topic with precision. It provides customization options, so you can make changes to the colors, design, graphics, or any other component to create a unique layout. It is also available for immediate download, so you can begin using it right away. Slidegeeks has done good research to ensure that you have everything you need to make your presentation stand out. Make a name out there for a brilliant performance.
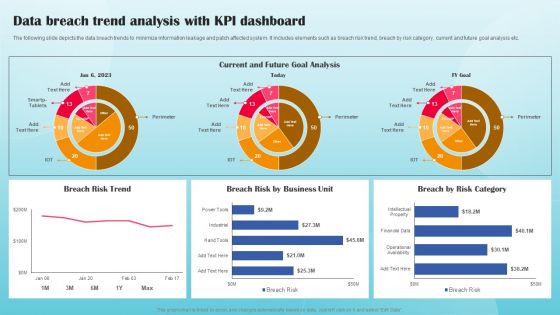
Data Breach Trend Analysis With KPI Dashboard Ppt PowerPoint Presentation File Portfolio PDF
The following slide depicts the data breach trends to minimize information leakage and patch affected system. It includes elements such as breach risk trend, breach by risk category, current and future goal analysis etc. This modern and well arranged Data Breach Trend Analysis With KPI Dashboard Ppt PowerPoint Presentation File Portfolio PDF provides lots of creative possibilities. It is very simple to customize and edit with the Powerpoint Software. Just drag and drop your pictures into the shapes. All facets of this template can be edited with Powerpoint no extra software is necessary. Add your own material, put your images in the places assigned for them, adjust the colors, and then you can show your slides to the world, with an animated slide included.
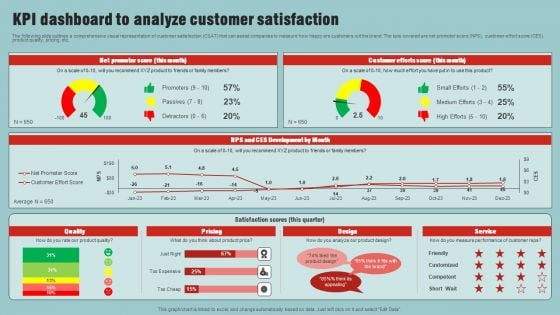
Market Analysis Overview And Different Categories KPI Dashboard To Analyze Customer Satisfaction Elements PDF
The following slide outlines a comprehensive visual representation of customer satisfaction CSAT that can assist companies to measure how happy are customers wit the brand. The kpis covered are net promoter score NPS, customer effort score CES, product quality, pricing, etc. Retrieve professionally designed Market Analysis Overview And Different Categories KPI Dashboard To Analyze Customer Satisfaction Elements PDF to effectively convey your message and captivate your listeners. Save time by selecting pre made slideshows that are appropriate for various topics, from business to educational purposes. These themes come in many different styles, from creative to corporate, and all of them are easily adjustable and can be edited quickly. Access them as PowerPoint templates or as Google Slides themes. You do not have to go on a hunt for the perfect presentation because Slidegeeks got you covered from everywhere.
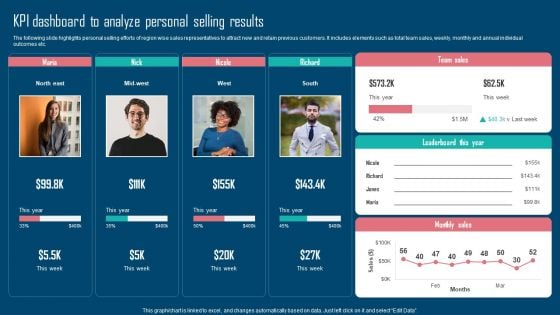
Adopting IMC Technique To Boost Brand Recognition Kpi Dashboard To Analyze Personal Selling Results Formats PDF
The following slide highlights personal selling efforts of region wise sales representatives to attract new and retain previous customers. It includes elements such as total team sales, weekly, monthly and annual individual outcomes etc. Coming up with a presentation necessitates that the majority of the effort goes into the content and the message you intend to convey. The visuals of a PowerPoint presentation can only be effective if it supplements and supports the story that is being told. Keeping this in mind our experts created Adopting IMC Technique To Boost Brand Recognition Kpi Dashboard To Analyze Personal Selling Results Formats PDF to reduce the time that goes into designing the presentation. This way, you can concentrate on the message while our designers take care of providing you with the right template for the situation.
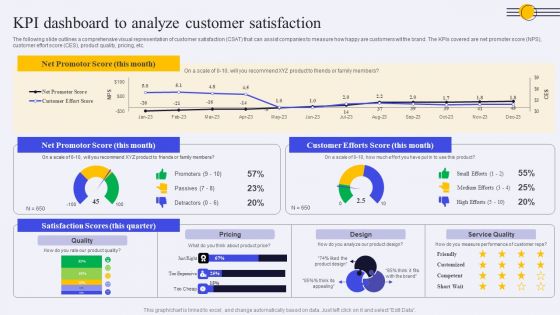
KPI Dashboard To Analyze Customer Satisfaction Ppt PowerPoint Presentation File Infographic Template PDF
The following slide outlines a comprehensive visual representation of customer satisfaction CSAT that can assist companies to measure how happy are customers wit the brand. The KPIs covered are net promoter score NPS, customer effort score CES, product quality, pricing, etc. Coming up with a presentation necessitates that the majority of the effort goes into the content and the message you intend to convey. The visuals of a PowerPoint presentation can only be effective if it supplements and supports the story that is being told. Keeping this in mind our experts created KPI Dashboard To Analyze Customer Satisfaction Ppt PowerPoint Presentation File Infographic Template PDF to reduce the time that goes into designing the presentation. This way, you can concentrate on the message while our designers take care of providing you with the right template for the situation.
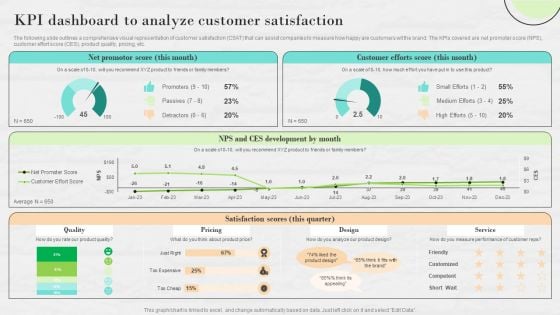
Market Research To Determine Business Opportunities KPI Dashboard To Analyze Customer Satisfaction Graphics PDF
The following slide outlines a comprehensive visual representation of customer satisfaction CSAT that can assist companies to measure how happy are customers wit the brand. The KPIs covered are net promoter score NPS, customer effort score CES, product quality, pricing, etc.Are you in need of a template that can accommodate all of your creative concepts This one is crafted professionally and can be altered to fit any style. Use it with Google Slides or PowerPoint. Include striking photographs, symbols, depictions, and other visuals. Fill, move around, or remove text boxes as desired. Test out color palettes and font mixtures. Edit and save your work, or work with colleagues. Download Market Research To Determine Business Opportunities KPI Dashboard To Analyze Customer Satisfaction Graphics PDF and observe how to make your presentation outstanding. Give an impeccable presentation to your group and make your presentation unforgettable.
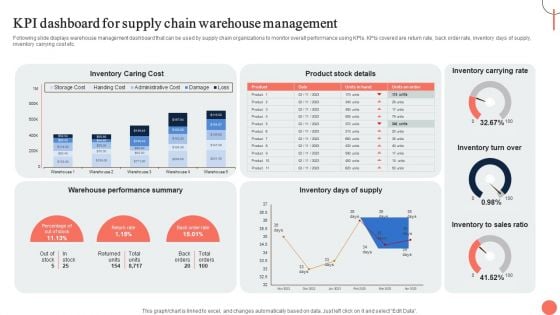
Strategies For Dynamic Supply Chain Agility KPI Dashboard For Supply Chain Warehouse Management Themes PDF
Following slide displays warehouse management dashboard that can be used by supply chain organizations to monitor overall performance using KPIs. KPIs covered are return rate, back order rate, inventory days of supply, inventory carrying cost etc. Want to ace your presentation in front of a live audience Our Strategies For Dynamic Supply Chain Agility KPI Dashboard For Supply Chain Warehouse Management Themes PDF can help you do that by engaging all the users towards you. Slidegeeks experts have put their efforts and expertise into creating these impeccable powerpoint presentations so that you can communicate your ideas clearly. Moreover, all the templates are customizable, and easy to edit and downloadable. Use these for both personal and commercial use.
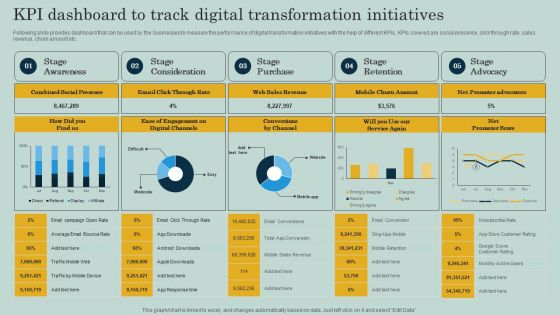
KPI Dashboard To Track Digital Transformation Initiatives Ppt Show Backgrounds PDF
Following slide provides dashboard that can be used by the businesses to measure the performance of digital transformation initiatives with the help of different KPIs. KPIs covered are social presence, click through rate, sales revenue, churn amount etc. The KPI Dashboard To Track Digital Transformation Initiatives Ppt Show Backgrounds PDF is a compilation of the most recent design trends as a series of slides. It is suitable for any subject or industry presentation, containing attractive visuals and photo spots for businesses to clearly express their messages. This template contains a variety of slides for the user to input data, such as structures to contrast two elements, bullet points, and slides for written information. Slidegeeks is prepared to create an impression.
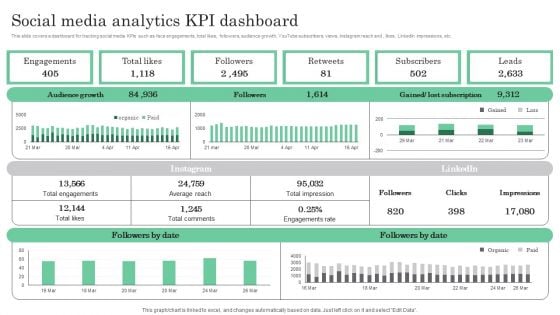
Online Marketing Analytics To Enhance Business Growth Social Media Analytics KPI Dashboard Brochure PDF
This slide covers a dashboard for tracking social media KPIs such as face engagements, total likes, followers, audience growth, YouTube subscribers, views, Instagram reach and , likes, LinkedIn impressions, etc. Slidegeeks is here to make your presentations a breeze with Online Marketing Analytics To Enhance Business Growth Social Media Analytics KPI Dashboard Brochure PDF With our easy to use and customizable templates, you can focus on delivering your ideas rather than worrying about formatting. With a variety of designs to choose from, you are sure to find one that suits your needs. And with animations and unique photos, illustrations, and fonts, you can make your presentation pop. So whether you are giving a sales pitch or presenting to the board, make sure to check out Slidegeeks first.
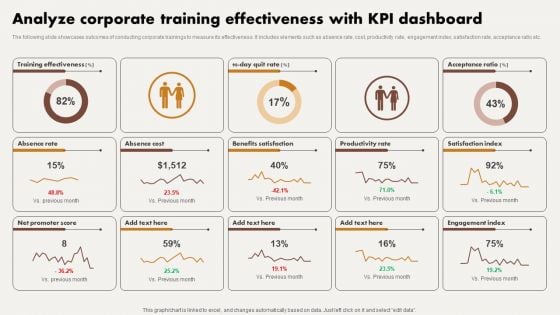
Analyze Corporate Training Effectiveness With KPI Dashboard Ppt Visual Aids Backgrounds PDF
The following slide showcases outcomes of conducting corporate trainings to measure its effectiveness. It includes elements such as absence rate, cost, productivity rate, engagement index, satisfaction rate, acceptance ratio etc. This Analyze Corporate Training Effectiveness With KPI Dashboard Ppt Visual Aids Backgrounds PDF from Slidegeeks makes it easy to present information on your topic with precision. It provides customization options, so you can make changes to the colors, design, graphics, or any other component to create a unique layout. It is also available for immediate download, so you can begin using it right away. Slidegeeks has done good research to ensure that you have everything you need to make your presentation stand out. Make a name out there for a brilliant performance.
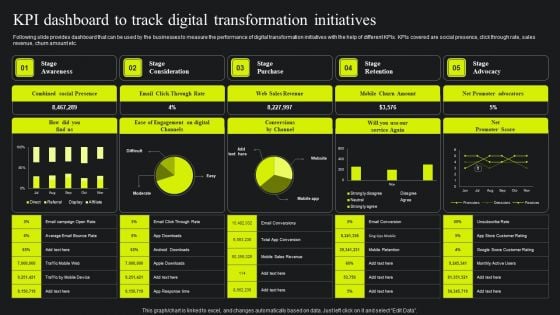
KPI Dashboard To Track Digital Transformation Initiatives Ppt Styles Graphics PDF
Following slide provides dashboard that can be used by the businesses to measure the performance of digital transformation initiatives with the help of different KPIs. KPIs covered are social presence, click through rate, sales revenue, churn amount etc. Take your projects to the next level with our ultimate collection of KPI Dashboard To Track Digital Transformation Initiatives Ppt Styles Graphics PDF. Slidegeeks has designed a range of layouts that are perfect for representing task or activity duration, keeping track of all your deadlines at a glance. Tailor these designs to your exact needs and give them a truly corporate look with your own brand colors they will make your projects stand out from the rest.
Vendor Performance KPI Dashboard Ppt PowerPoint Presentation Complete Deck With Slides
If designing a presentation takes a lot of your time and resources and you are looking for a better alternative, then this Vendor Performance KPI Dashboard Ppt PowerPoint Presentation Complete Deck With Slides is the right fit for you. This is a prefabricated set that can help you deliver a great presentation on the topic. All the eleven slides included in this sample template can be used to present a birds-eye view of the topic. These slides are also fully editable, giving you enough freedom to add specific details to make this layout more suited to your business setting. Apart from the content, all other elements like color, design, theme are also replaceable and editable. This helps in designing a variety of presentations with a single layout. Not only this, you can use this PPT design in formats like PDF, PNG, and JPG once downloaded. Therefore, without any further ado, download and utilize this sample presentation as per your liking.
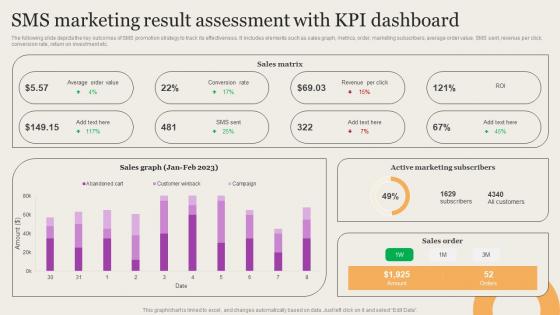
Leveraging Mobile Marketing Strategies Sms Marketing Result Assessment With Kpi Background Pdf
The following slide depicts the key outcomes of SMS promotion strategy to track its effectiveness. It includes elements such as sales graph, metrics, order, marketing subscribers, average order value, SMS sent, revenue per click, conversion rate, return on investment etc. There are so many reasons you need a Leveraging Mobile Marketing Strategies Sms Marketing Result Assessment With Kpi Background Pdf. The first reason is you can not spend time making everything from scratch, Thus, Slidegeeks has made presentation templates for you too. You can easily download these templates from our website easily. The following slide depicts the key outcomes of SMS promotion strategy to track its effectiveness. It includes elements such as sales graph, metrics, order, marketing subscribers, average order value, SMS sent, revenue per click, conversion rate, return on investment etc.
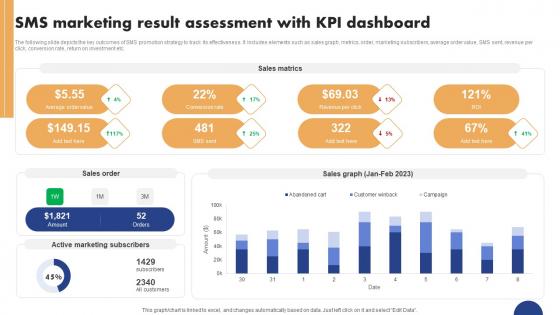
Mobile Ad Campaign Launch Strategy SMS Marketing Result Assessment With KPI Graphics Pdf
The following slide depicts the key outcomes of SMS promotion strategy to track its effectiveness. It includes elements such as sales graph, metrics, order, marketing subscribers, average order value, SMS sent, revenue per click, conversion rate, return on investment etc. There are so many reasons you need a Mobile Ad Campaign Launch Strategy SMS Marketing Result Assessment With KPI Graphics Pdf. The first reason is you can not spend time making everything from scratch, Thus, Slidegeeks has made presentation templates for you too. You can easily download these templates from our website easily. The following slide depicts the key outcomes of SMS promotion strategy to track its effectiveness. It includes elements such as sales graph, metrics, order, marketing subscribers, average order value, SMS sent, revenue per click, conversion rate, return on investment etc.
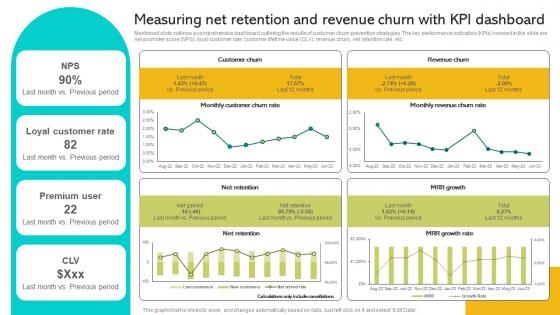
Implementing Strategies To Enhance Measuring Net Retention And Revenue Churn With Kpi Brochure PDF
Mentioned slide outlines a comprehensive dashboard outlining the results of customer churn prevention strategies. The key performance indicators KPIs covered in the slide are net promoter score NPS, loyal customer rate, customer lifetime value CLV, revenue churn, net retention rate, etc. Retrieve professionally designed ng Strategies To Enhance Measuring Net Retention And Revenue Churn With Kpi Brochure PDF to effectively convey your message and captivate your listeners. Save time by selecting pre-made slideshows that are appropriate for various topics, from business to educational purposes. These themes come in many different styles, from creative to corporate, and all of them are easily adjustable and can be edited quickly. Access them as PowerPoint templates or as Google Slides themes. You do not have to go on a hunt for the perfect presentation because Slidegeeks got you covered from everywhere. Mentioned slide outlines a comprehensive dashboard outlining the results of customer churn prevention strategies. The key performance indicators KPIs covered in the slide are net promoter score NPS, loyal customer rate, customer lifetime value CLV, revenue churn, net retention rate, etc.
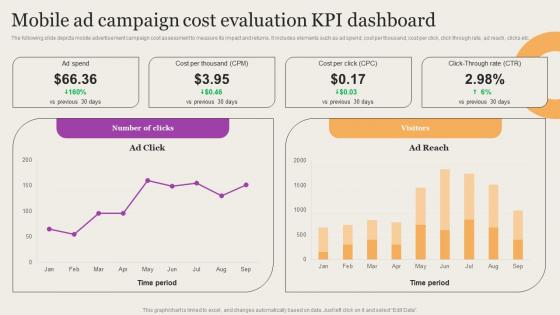
Leveraging Mobile Marketing Strategies Mobile Ad Campaign Cost Evaluation Kpi Sample Pdf
The following slide depicts mobile advertisement campaign cost assessment to measure its impact and returns. It includes elements such as ad spend, cost per thousand, cost per click, click through rate, ad reach, clicks etc. Are you in need of a template that can accommodate all of your creative concepts This one is crafted professionally and can be altered to fit any style. Use it with Google Slides or PowerPoint. Include striking photographs, symbols, depictions, and other visuals. Fill, move around, or remove text boxes as desired. Test out color palettes and font mixtures. Edit and save your work, or work with colleagues. Download Leveraging Mobile Marketing Strategies Mobile Ad Campaign Cost Evaluation Kpi Sample Pdf and observe how to make your presentation outstanding. Give an impeccable presentation to your group and make your presentation unforgettable. The following slide depicts mobile advertisement campaign cost assessment to measure its impact and returns. It includes elements such as ad spend, cost per thousand, cost per click, click through rate, ad reach, clicks etc.
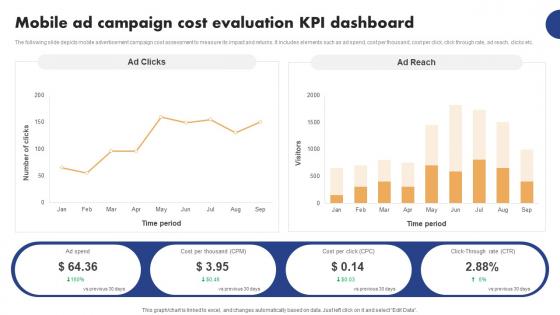
Mobile Ad Campaign Launch Strategy Mobile Ad Campaign Cost Evaluation KPI Elements Pdf
The following slide depicts mobile advertisement campaign cost assessment to measure its impact and returns. It includes elements such as ad spend, cost per thousand, cost per click, click through rate, ad reach, clicks etc. Are you in need of a template that can accommodate all of your creative concepts This one is crafted professionally and can be altered to fit any style. Use it with Google Slides or PowerPoint. Include striking photographs, symbols, depictions, and other visuals. Fill, move around, or remove text boxes as desired. Test out color palettes and font mixtures. Edit and save your work, or work with colleagues. Download Mobile Ad Campaign Launch Strategy Mobile Ad Campaign Cost Evaluation KPI Elements Pdf and observe how to make your presentation outstanding. Give an impeccable presentation to your group and make your presentation unforgettable. The following slide depicts mobile advertisement campaign cost assessment to measure its impact and returns. It includes elements such as ad spend, cost per thousand, cost per click, click through rate, ad reach, clicks etc.
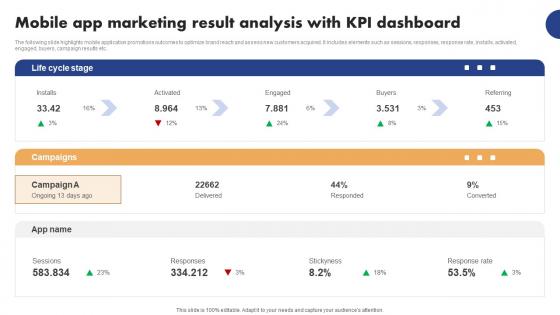
Mobile Ad Campaign Launch Strategy Mobile App Marketing Result Analysis With KPI Slides Pdf
The following slide highlights mobile application promotions outcomes to optimize brand reach and assess new customers acquired. It includes elements such as sessions, responses, response rate, installs, activated, engaged, buyers, campaign results etc. Coming up with a presentation necessitates that the majority of the effort goes into the content and the message you intend to convey. The visuals of a PowerPoint presentation can only be effective if it supplements and supports the story that is being told. Keeping this in mind our experts created Mobile Ad Campaign Launch Strategy Mobile App Marketing Result Analysis With KPI Slides Pdf to reduce the time that goes into designing the presentation. This way, you can concentrate on the message while our designers take care of providing you with the right template for the situation. The following slide highlights mobile application promotions outcomes to optimize brand reach and assess new customers acquired. It includes elements such as sessions, responses, response rate, installs, activated, engaged, buyers, campaign results etc.
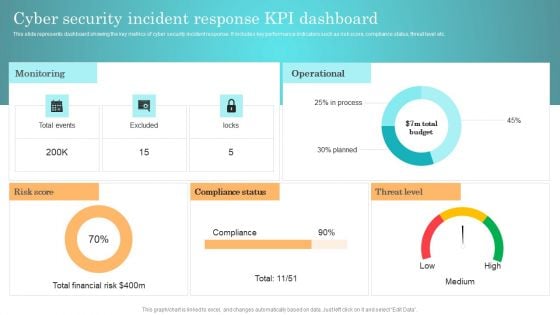
Incident Response Techniques Deployement Cyber Security Incident Response KPI Dashboard Background PDF
This slide represents dashboard showing the key metrics of cyber security incident response. It includes key performance indicators such as risk score, compliance status, threat level etc. From laying roadmaps to briefing everything in detail, our templates are perfect for you. You can set the stage with your presentation slides. All you have to do is download these easy to edit and customizable templates. Incident Response Techniques Deployement Cyber Security Incident Handler Contact Information Guidelines PDF will help you deliver an outstanding performance that everyone would remember and praise you for. Do download this presentation today.
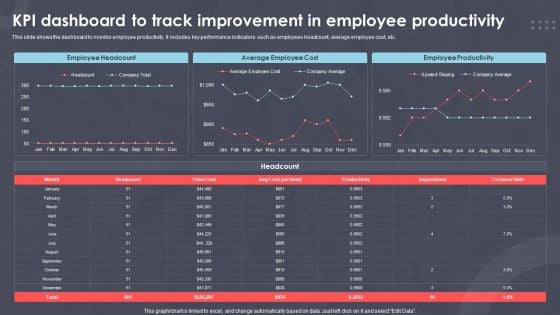
Kpi Dashboard To Track Improvement In Employee Productivity Ppt PowerPoint Presentation Outline Samples PDF
This slide shows the dashboard to monitor employee productivity. It includes key performance indicators such as employees headcount, average employee cost, etc.Showcasing this set of slides titled XXXXXXXXX. The topics addressed in these templates are Employee Headcount, Average Employee, Employee Productivity. All the content presented in this PPT design is completely editable. Download it and make adjustments in color, background, font etc. as per your unique business setting.
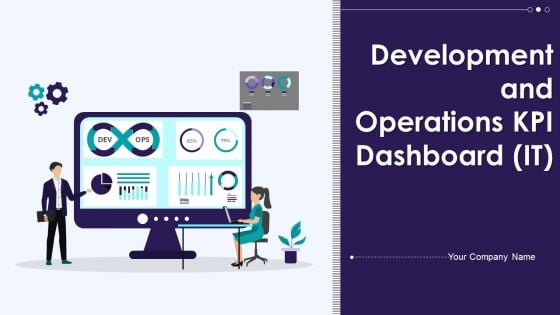
Development And Operations KPI Dashboard IT Ppt PowerPoint Presentation Complete With Slides
Induce strategic thinking by presenting this complete deck. Enthrall your audience by deploying this thought provoking PPT deck. It can be downloaded in both standard and widescreen aspect ratios, thus making it a complete package to use and deploy. Convey your thoughts and actions using the twenty two slides presented in this complete deck. Additionally, feel free to alter its components like color, graphics, design, etc, to create a great first impression. Grab it now by clicking on the download button below.

Impact Of Strategies On Outside Sales Team Kpi Tactics For Improving Field Sales Team SA SS V
This slide showcases the impact of the training program and marketing campaign on key performance indicators such as sales cycle length, cost per lead, win rate, customer acquisition, etc. This Impact Of Strategies On Outside Sales Team Kpi Tactics For Improving Field Sales Team SA SS V is perfect for any presentation, be it in front of clients or colleagues. It is a versatile and stylish solution for organizing your meetings. The Impact Of Strategies On Outside Sales Team Kpi Tactics For Improving Field Sales Team SA SS V features a modern design for your presentation meetings. The adjustable and customizable slides provide unlimited possibilities for acing up your presentation. Slidegeeks has done all the homework before launching the product for you. So, do not wait, grab the presentation templates today This slide showcases the impact of the training program and marketing campaign on key performance indicators such as sales cycle length, cost per lead, win rate, customer acquisition, etc.
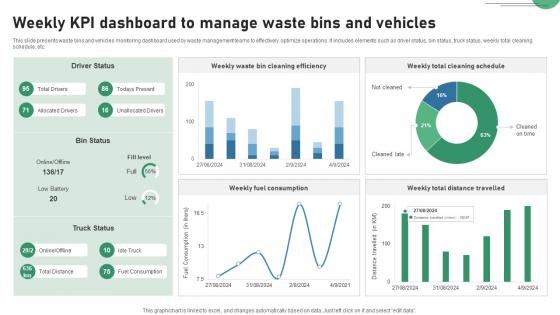
Weekly KPI Dashboard To Manage Waste Bins And Vehicles IOT Applications In Smart Waste IoT SS V
This slide presents waste bins and vehicles monitoring dashboard used by waste management teams to effectively optimize operations. It includes elements such as driver status, bin status, truck status, weekly total cleaning schedule, etc. Find highly impressive Weekly KPI Dashboard To Manage Waste Bins And Vehicles IOT Applications In Smart Waste IoT SS V on Slidegeeks to deliver a meaningful presentation. You can save an ample amount of time using these presentation templates. No need to worry to prepare everything from scratch because Slidegeeks experts have already done a huge research and work for you. You need to download Weekly KPI Dashboard To Manage Waste Bins And Vehicles IOT Applications In Smart Waste IoT SS V for your upcoming presentation. All the presentation templates are 100 percent editable and you can change the color and personalize the content accordingly. Download now. This slide presents waste bins and vehicles monitoring dashboard used by waste management teams to effectively optimize operations. It includes elements such as driver status, bin status, truck status, weekly total cleaning schedule, etc.
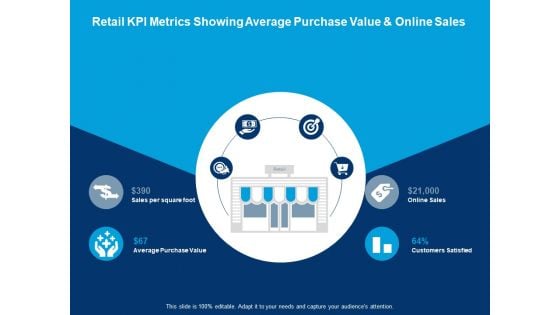
Retail Kpi Metrics Showing Average Purchase Value And Online Sales Average Purchase Value Ppt PowerPoint Presentation Styles Aids
This is a retail kpi metrics showing average purchase value and online sales average purchase value ppt powerpoint presentation styles aids. This is a four stage process. The stages in this process are icons, planning, strategy, analysis, marketing.
Retail Kpi Metrics Showing Average Sales And Sell Through Rate Average Transaction Size Ppt PowerPoint Presentation Icon Brochure
This is a retail kpi metrics showing average sales and sell through rate average transaction size ppt powerpoint presentation icon brochure. This is a four stage process. The stages in this process are icons, planning, strategy, analysis, marketing.
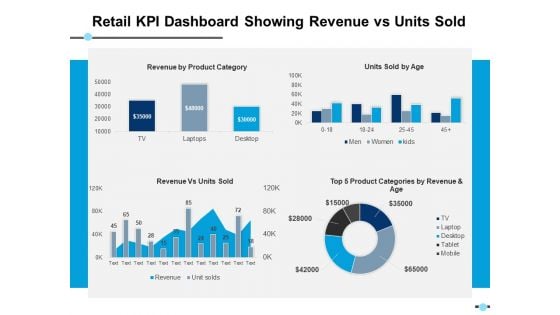
Retail Kpi Dashboard Showing Revenue Vs Units Sold Top 5 Product Categories Ppt PowerPoint Presentation Layouts Designs Download
This is a retail kpi dashboard showing revenue vs units sold top 5 product categories ppt powerpoint presentation layouts designs download. This is a four stage process. The stages in this process are finance, strategy, analysis, marketing.
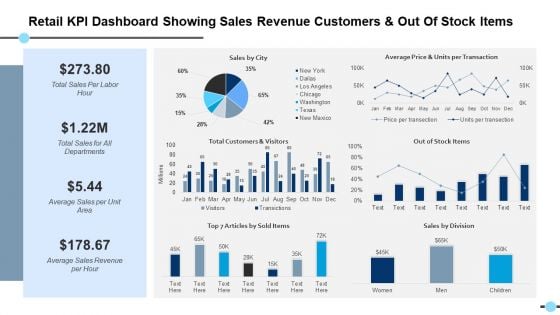
Retail Kpi Dashboard Showing Sales Revenue Customers And Out Of Stock Items Out Of Stock Items Ppt PowerPoint Presentation Files
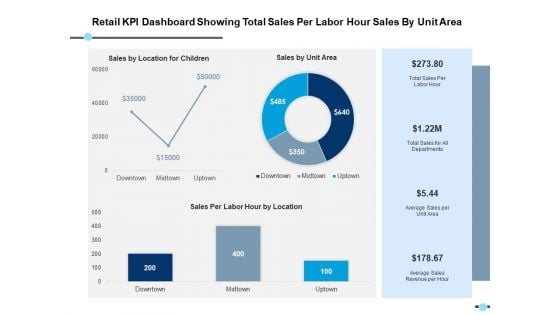
Retail Kpi Dashboard Showing Total Sales Per Labor Hour Sales By Unit Area Ppt PowerPoint Presentation Model Format
This is a retail kpi dashboard showing total sales per labor hour sales by unit area ppt powerpoint presentation model format. This is a three stage process. The stages in this process are finance, strategy, analysis, marketing.
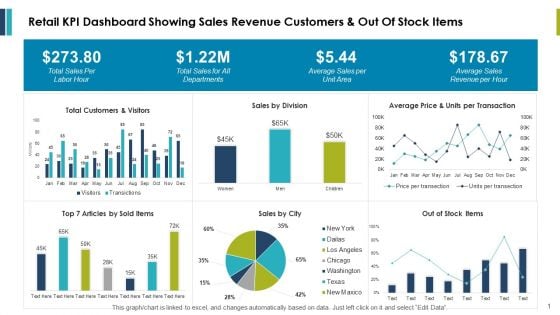
Retail Kpi Dashboard Showing Sales Revenue Customers And Out Of Stock Items Ppt PowerPoint Presentation Outline Example
This is a retail kpi dashboard showing sales revenue customers and out of stock items ppt powerpoint presentation outline example. This is a three stage process. The stages in this process are finance, marketing, management, investment, analysis.
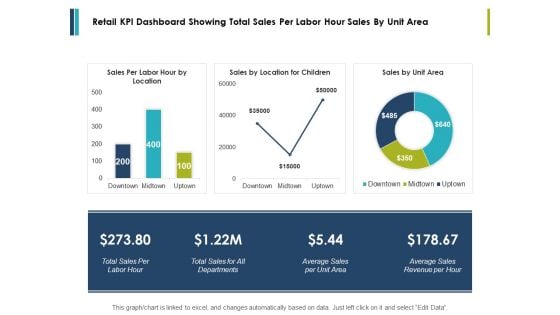
Retail Kpi Dashboard Showing Total Sales Per Labor Hour Sales By Unit Area Ppt PowerPoint Presentation Styles Influencers
This is a retail kpi dashboard showing total sales per labor hour sales by unit area ppt powerpoint presentation styles influencers. This is a three stage process. The stages in this process are finance, marketing, management, investment, analysis.
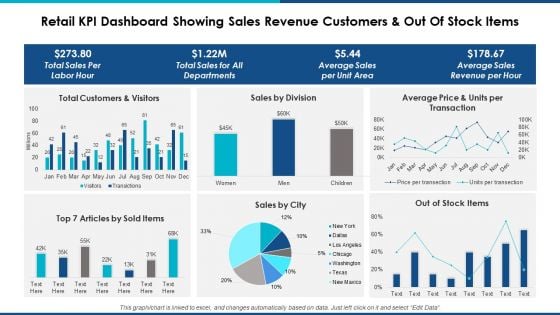
Retail Kpi Dashboard Showing Sales Revenue Customers And Out Of Stock Items Ppt Powerpoint Presentation Professional Background Designs
This is a retail kpi dashboard showing sales revenue customers and out of stock items ppt powerpoint presentation professional background designs. This is a six stage process. The stages in this process are finance, marketing, management, investment, analysis.
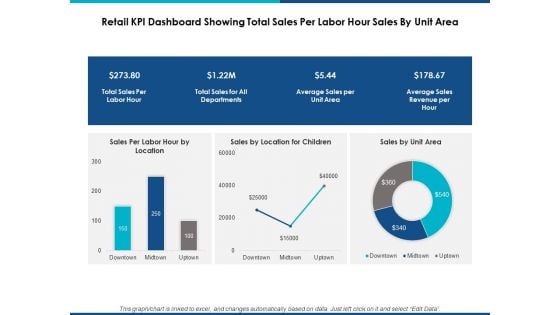
Retail Kpi Dashboard Showing Total Sales Per Labor Hour Sales By Unit Area Ppt Powerpoint Presentation Show Graphic Tips
This is a retail kpi dashboard showing total sales per labor hour sales by unit area ppt powerpoint presentation show graphic tips. This is a three stage process. The stages in this process are finance, marketing, management, investment, analysis.
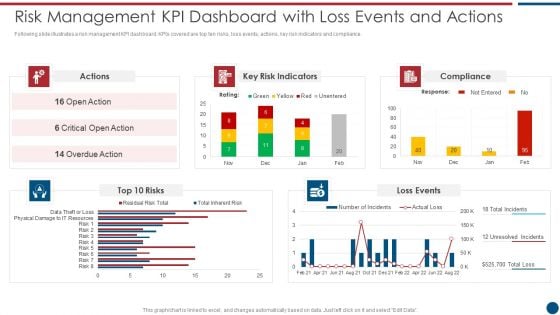
Risk Based Procedures To IT Security Risk Management KPI Dashboard With Loss Events And Actions Mockup PDF
Following slide illustrates a risk management KPI dashboard. KPIs covered are top ten risks, loss events, actions, key risk indicators and compliance. Deliver an awe inspiring pitch with this creative Risk Based Procedures To IT Security Risk Management KPI Dashboard With Loss Events And Actions Mockup PDF bundle. Topics like Key Risk, Indicators Compliance, Loss Events can be discussed with this completely editable template. It is available for immediate download depending on the needs and requirements of the user.
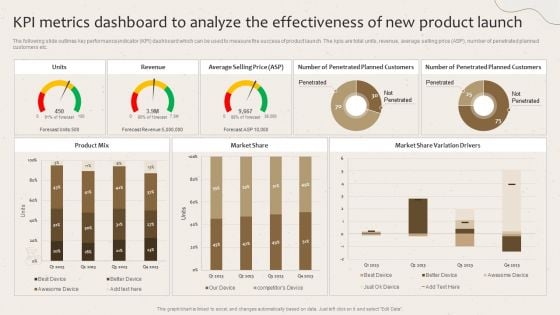
Kpi Metrics Dashboard To Analyze The Effectiveness Of New Product Launch Launching New Beverage Product Diagrams PDF
The following slide outlines key performance indicator KPI dashboard which can be used to measure the success of product launch. The kpis are total units, revenue, average selling price ASP, number of penetrated planned customers etc. Create an editable Kpi Metrics Dashboard To Analyze The Effectiveness Of New Product Launch Launching New Beverage Product Diagrams PDF that communicates your idea and engages your audience. Whether you are presenting a business or an educational presentation, pre-designed presentation templates help save time. Kpi Metrics Dashboard To Analyze The Effectiveness Of New Product Launch Launching New Beverage Product Diagrams PDF is highly customizable and very easy to edit, covering many different styles from creative to business presentations. Slidegeeks has creative team members who have crafted amazing templates. So, go and get them without any delay.
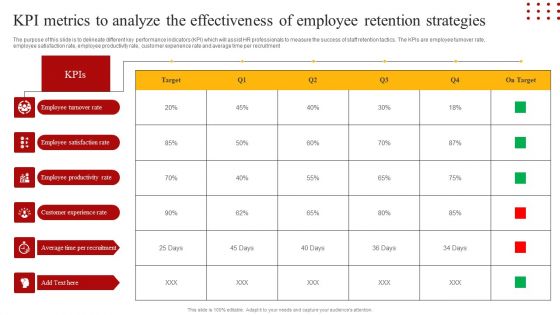
Staff Retention Techniques To Minimize Hiring Expenses KPI Metrics To Analyze The Effectiveness Of Employee Formats PDF
The purpose of this slide is to delineate different key performance indicators KPI which will assist HR professionals to measure the success of staff retention tactics. The KPIs are employee turnover rate, employee satisfaction rate, employee productivity rate, customer experience rate and average time per recruitment Get a simple yet stunning designed Staff Retention Techniques To Minimize Hiring Expenses KPI Metrics To Analyze The Effectiveness Of Employee Formats PDF. It is the best one to establish the tone in your meetings. It is an excellent way to make your presentations highly effective. So, download this PPT today from Slidegeeks and see the positive impacts. Our easy to edit Staff Retention Techniques To Minimize Hiring Expenses KPI Metrics To Analyze The Effectiveness Of Employee Formats PDF can be your go to option for all upcoming conferences and meetings. So, what are you waiting for Grab this template today.
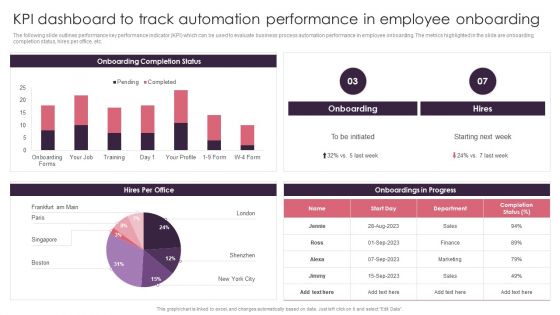
BPA Tools For Process Enhancement And Cost Minimization KPI Dashboard To Track Automation Performance In Employee Onboarding Graphics PDF
The following slide outlines performance key performance indicator KPI which can be used to evaluate business process automation performance in employee onboarding. The metrics highlighted in the slide are onboarding completion status, hires per office, etc. There are so many reasons you need a BPA Tools For Process Enhancement And Cost Minimization KPI Dashboard To Track Automation Performance In Employee Onboarding Graphics PDF. The first reason is you can not spend time making everything from scratch, Thus, Slidegeeks has made presentation templates for you too. You can easily download these templates from our website easily.
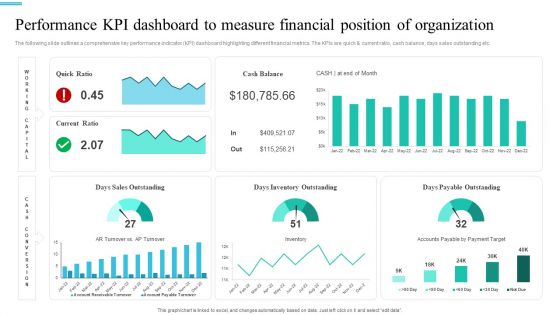
Monetary Planning And Evaluation Guide Performance KPI Dashboard To Measure Financial Position Of Organization Ppt File Slides PDF
The following slide outlines a comprehensive key performance indicator KPI dashboard highlighting different financial metrics. The KPIs are quick and current ratio, cash balance, days sales outstanding etc. The best PPT templates are a great way to save time, energy, and resources. Slidegeeks have 100 percent editable powerpoint slides making them incredibly versatile. With these quality presentation templates, you can create a captivating and memorable presentation by combining visually appealing slides and effectively communicating your message. Download Monetary Planning And Evaluation Guide Performance KPI Dashboard To Measure Financial Position Of Organization Ppt File Slides PDF from Slidegeeks and deliver a wonderful presentation.
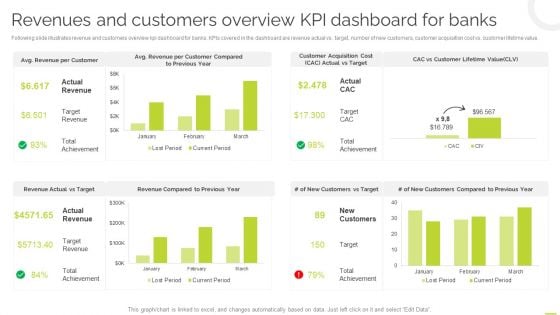
Effective BPM Tool For Business Process Management Revenues And Customers Overview KPI Dashboard For Banks Elements PDF
Following slide illustrates revenue and customers overview kpi dashboard for banks. KPIs covered in the dashboard are revenue actual vs target, number of new customers, customer acquisition cost vs. customer lifetime value. This Effective BPM Tool For Business Process Management Revenues And Customers Overview KPI Dashboard For Banks Elements PDF is perfect for any presentation, be it in front of clients or colleagues. It is a versatile and stylish solution for organizing your meetings. The Effective BPM Tool For Business Process Management Revenues And Customers Overview KPI Dashboard For Banks Elements PDF features a modern design for your presentation meetings. The adjustable and customizable slides provide unlimited possibilities for acing up your presentation. Slidegeeks has done all the homework before launching the product for you. So, do not wait, grab the presentation templates today.
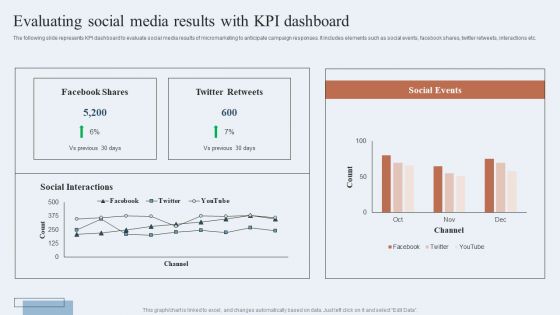
Niche Marketing Guide To Target Specific Customer Groups Evaluating Social Media Results With Kpi Dashboard Inspiration PDF
The following slide represents KPI dashboard to evaluate social media results of micromarketing to anticipate campaign responses. It includes elements such as social events, facebook shares, twitter retweets, interactions etc. Are you searching for a Niche Marketing Guide To Target Specific Customer Groups Evaluating Social Media Results With Kpi Dashboard Inspiration PDF that is uncluttered, straightforward, and original Its easy to edit, and you can change the colors to suit your personal or business branding. For a presentation that expresses how much effort you have put in, this template is ideal. With all of its features, including tables, diagrams, statistics, and lists, its perfect for a business plan presentation. Make your ideas more appealing with these professional slides. Download Niche Marketing Guide To Target Specific Customer Groups Evaluating Social Media Results With Kpi Dashboard Inspiration PDF from Slidegeeks today.
Food Processing Industry Latest Insights Trends And Analytics KPI Dashboard For Tracking Supply Chain Costs Demonstration PDF
This slide represents the KPI dashboard to track the multiple cost associated with supply chain in food manufacturing industry. It includes information regarding cash to cash cycle in days, carry cost of inventory along with details of net sales. There are so many reasons you need a Food Processing Industry Latest Insights Trends And Analytics KPI Dashboard For Tracking Supply Chain Costs Demonstration PDF. The first reason is you can not spend time making everything from scratch, Thus, Slidegeeks has made presentation templates for you too. You can easily download these templates from our website easily.
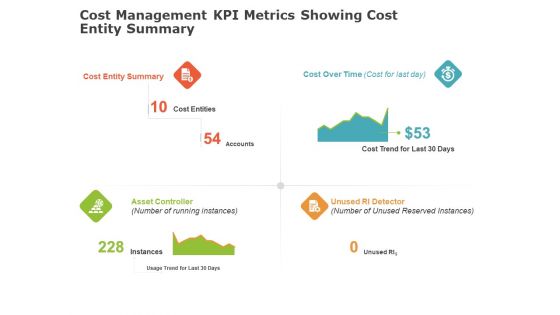
Product Cost Management PCM Cost Management KPI Metrics Showing Cost Entity Summary Ppt Layouts Slide Download PDF
Deliver and pitch your topic in the best possible manner with this product cost management pcm cost management kpi metrics showing cost entity summary ppt layouts slide download pdf. Use them to share invaluable insights on cost, asset, detector and impress your audience. This template can be altered and modified as per your expectations. So, grab it now.
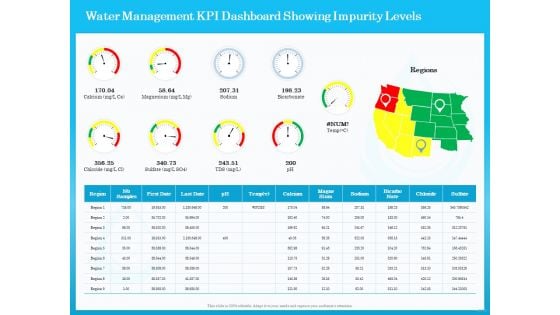
Monitoring And Evaluating Water Quality Water Management KPI Dashboard Showing Impurity Levels Ppt Show Design Inspiration PDF
Presenting this set of slides with name monitoring and evaluating water quality water management kpi dashboard showing impurity levels ppt show design inspiration pdf. The topics discussed in these slides are region, ph, magne sium, sodium, chloride, bicarbo nate. This is a completely editable PowerPoint presentation and is available for immediate download. Download now and impress your audience.
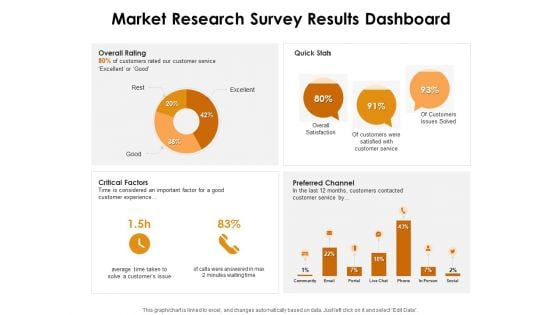
KPI Dashboards Per Industry Market Research Survey Results Dashboard Ppt PowerPoint Presentation Infographic Template Layout Ideas PDF
Deliver and pitch your topic in the best possible manner with this kpi dashboards per industry market research survey results dashboard ppt powerpoint presentation infographic template layout ideas pdf. Use them to share invaluable insights on overall rating, quick stats, critical factors, preferred channel and impress your audience. This template can be altered and modified as per your expectations. So, grab it now.

Product Cost Management PCM Cost Management KPI Dashboards Showing Return On Assets And Asset Turnover Elements PDF
Deliver an awe inspiring pitch with this creative product cost management pcm cost management kpi dashboards showing return on assets and asset turnover elements pdf bundle. Topics like return on assets, asset turnover, maintenance costs, target can be discussed with this completely editable template. It is available for immediate download depending on the needs and requirements of the user.
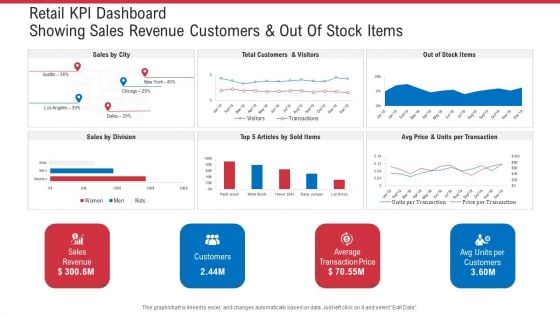
Retail KPI Dashboard Showing Sales Revenue Customers And Out Of Stock Items Ppt Ideas Graphics Design PDF
Deliver an awe-inspiring pitch with this creative retail KPI dashboard showing sales revenue customers and out of stock items ppt ideas graphics design pdf. bundle. Topics like sales revenue, average transaction price, avg units per customers can be discussed with this completely editable template. It is available for immediate download depending on the needs and requirements of the user.
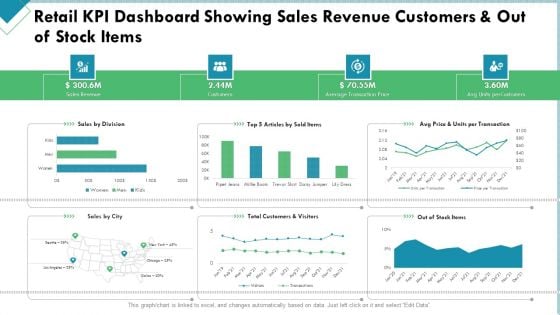
Market Analysis Of Retail Sector Retail KPI Dashboard Showing Sales Revenue Customers And Out Of Stock Items Structure PDF
Deliver and pitch your topic in the best possible manner with this market analysis of retail sector retail kpi dashboard showing sales revenue customers and out of stock items structure pdf. Use them to share invaluable insights on sales revenue, customers, average transaction price and impress your audience. This template can be altered and modified as per your expectations. So, grab it now.
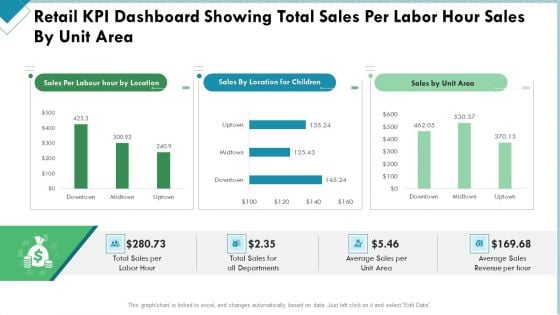
Market Analysis Of Retail Sector Retail KPI Dashboard Showing Total Sales Per Labor Hour Sales By Unit Area Themes PDF
Deliver an awe inspiring pitch with this creative market analysis of retail sector retail kpi dashboard showing total sales per labor hour sales by unit area themes pdf bundle. Topics like sales, revenue, average, departments can be discussed with this completely editable template. It is available for immediate download depending on the needs and requirements of the user.
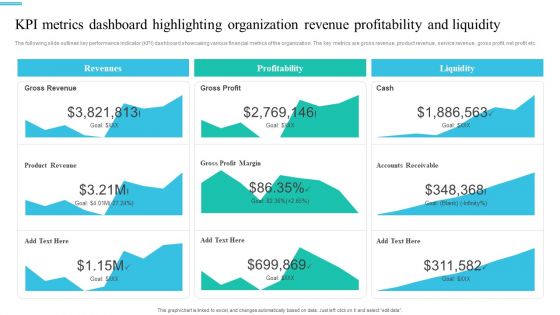
Monetary Planning And Evaluation Guide KPI Metrics Dashboard Highlighting Organization Revenue Profitability And Liquidity Ppt Diagram Images PDF
The following slide outlines key performance indicator KPI dashboard showcasing various financial metrics of the organization. The key metrics are gross revenue, product revenue, service revenue, gross profit, net profit etc. Coming up with a presentation necessitates that the majority of the effort goes into the content and the message you intend to convey. The visuals of a PowerPoint presentation can only be effective if it supplements and supports the story that is being told. Keeping this in mind our experts created Monetary Planning And Evaluation Guide KPI Metrics Dashboard Highlighting Organization Revenue Profitability And Liquidity Ppt Diagram Images PDF to reduce the time that goes into designing the presentation. This way, you can concentrate on the message while our designers take care of providing you with the right template for the situation.
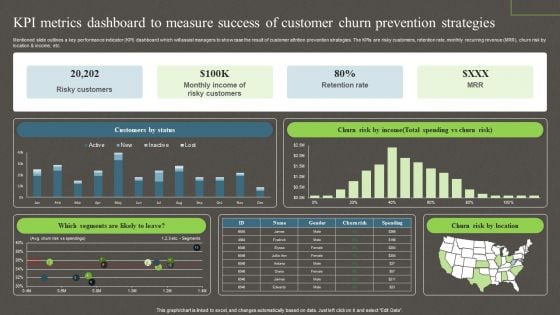
Kpi Metrics Dashboard To Measure Success Of Customer Churn Prevention Strategies Ppt PowerPoint Presentation File Model PDF
Mentioned slide outlines a key performance indicator KPI dashboard which will assist managers to showcase the result of customer attrition prevention strategies. The KPIs are risky customers, retention rate, monthly recurring revenue MRR, churn risk by location and income, etc. This Kpi Metrics Dashboard To Measure Success Of Customer Churn Prevention Strategies Ppt PowerPoint Presentation File Model PDF from Slidegeeks makes it easy to present information on your topic with precision. It provides customization options, so you can make changes to the colors, design, graphics, or any other component to create a unique layout. It is also available for immediate download, so you can begin using it right away. Slidegeeks has done good research to ensure that you have everything you need to make your presentation stand out. Make a name out there for a brilliant performance.
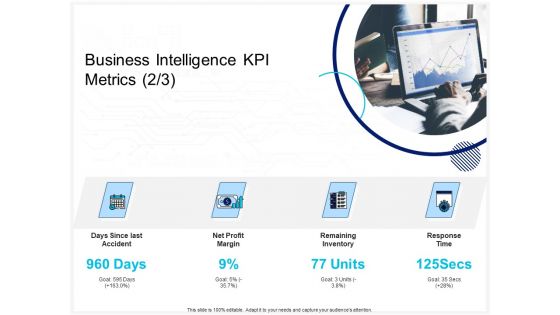
Enterprise Problem Solving And Intellect Business Intelligence KPI Metrics Profit Ppt PowerPoint Presentation Infographic Template Portrait PDF
Presenting this set of slides with name enterprise problem solving and intellect business intelligence kpi metrics profit ppt powerpoint presentation infographic template portrait pdf. This is a four stage process. The stages in this process are days since last accident, net profit margin, remaining inventory, response time. This is a completely editable PowerPoint presentation and is available for immediate download. Download now and impress your audience.


 Continue with Email

 Home
Home


