Kpi
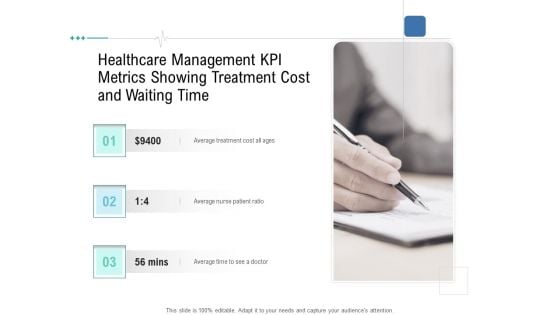
Health Centre Management Business Plan Healthcare Management KPI Metrics Showing Treatment Cost And Waiting Time Portrait PDF
Presenting health centre management business plan healthcare management kpi metrics showing treatment cost and waiting time portrait pdf to provide visual cues and insights. Share and navigate important information on three stages that need your due attention. This template can be used to pitch topics like average treatment cost all ages, average nurse patient ratio, average time to see a doctor. In addtion, this PPT design contains high resolution images, graphics, etc, that are easily editable and available for immediate download.
Sustainability Calculation With KPI Effective Rate Metrics By Customer And Offering Ppt PowerPoint Presentation Icon Files PDF
This slide covers effective rate metrics. It shows over year over comparison of effective rate per customer as well as effective rate per offering. Deliver an awe inspiring pitch with this creative sustainability calculation with kpi effective rate metrics by customer and offering ppt powerpoint presentation icon files pdf bundle. Topics like effective rate metrics by customer and offering can be discussed with this completely editable template. It is available for immediate download depending on the needs and requirements of the user.
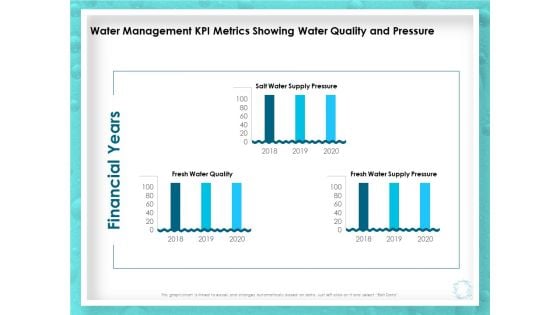
WQM System Water Management KPI Metrics Showing Water Quality And Pressure Ppt PowerPoint Presentation Model Example File PDF
Presenting this set of slides with name wqm system water management kpi metrics showing water quality and pressure ppt powerpoint presentation model example file pdf. The topics discussed in these slides are financial years, fresh water quality, fresh water supply pressure, salt water supply pressure, 2018 to 2020. This is a completely editable PowerPoint presentation and is available for immediate download. Download now and impress your audience.
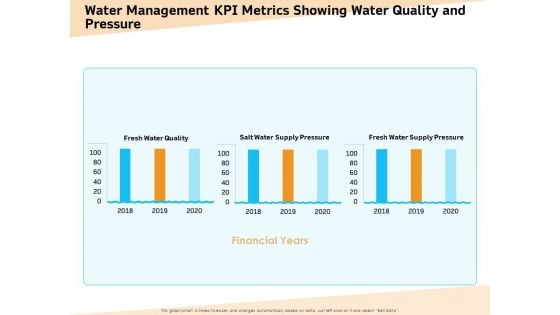
Optimization Of Water Usage Water Management KPI Metrics Showing Water Quality And Pressure Ppt Gallery Graphics PDF
Presenting this set of slides with name optimization of water usage water management kpi metrics showing water quality and pressure ppt gallery graphics pdf. The topics discussed in these slides are financial years, fresh water quality, fresh water supply pressure, salt water supply pressure, 2018 to 2020. This is a completely editable PowerPoint presentation and is available for immediate download. Download now and impress your audience.
Monitoring And Evaluating Water Quality Water Management KPI Metrics Showing Water Quality And Pressure Ppt Icon Maker PDF
Presenting this set of slides with name monitoring and evaluating water quality water management kpi metrics showing water quality and pressure ppt icon maker pdf. The topics discussed in these slides are financial years, fresh water quality, fresh water supply pressure, salt water supply pressure, 2018 to 2020. This is a completely editable PowerPoint presentation and is available for immediate download. Download now and impress your audience.
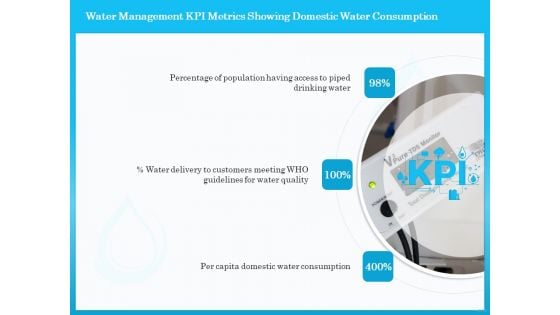
Monitoring And Evaluating Water Quality Water Management KPI Metrics Showing Domestic Water Consumption Ppt Layouts Tips PDF
Presenting this set of slides with name monitoring and evaluating water quality water management kpi metrics showing domestic water consumption ppt layouts tips pdf. This is a three stage process. The stages in this process are drinking water, customers meeting, who guidelines, water quality, per capita domestic water consumption. This is a completely editable PowerPoint presentation and is available for immediate download. Download now and impress your audience.

Product Cost Management PCM Cost Management KPI Metrics Showing Return On Investment Ppt Visual Aids Inspiration PDF
This is a product cost management pcm cost management kpi metrics showing return on investment ppt visual aids inspiration pdf template with various stages. Focus and dispense information on four stages using this creative set, that comes with editable features. It contains large content boxes to add your information on topics like performed, cost, investment, variance, return. You can also showcase facts, figures, and other relevant content using this PPT layout. Grab it now.
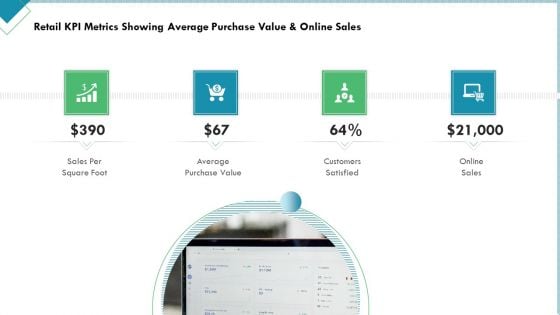
Market Analysis Of Retail Sector Retail KPI Metrics Showing Average Purchase Value And Online Sales Information PDF
Presenting market analysis of retail sector retail kpi metrics showing average purchase value and online sales information pdf to provide visual cues and insights. Share and navigate important information on four stages that need your due attention. This template can be used to pitch topics like sales per square foot, average purchase value, customers satisfied, online sales. In addtion, this PPT design contains high resolution images, graphics, etc, that are easily editable and available for immediate download.
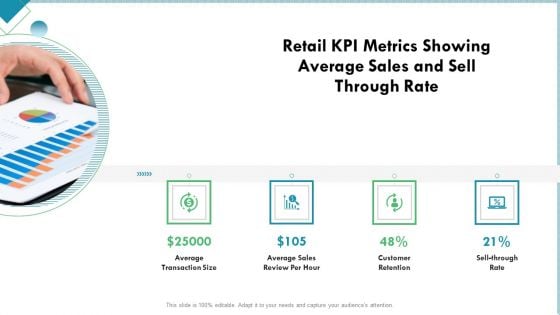
Market Analysis Of Retail Sector Retail KPI Metrics Showing Average Sales And Sell Through Rate Clipart PDF
This is a market analysis of retail sector retail kpi metrics showing average sales and sell through rate clipart pdf template with various stages. Focus and dispense information on four stages using this creative set, that comes with editable features. It contains large content boxes to add your information on topics like average transaction size, average sales review per hour, customer retention, sell through rate. You can also showcase facts, figures, and other relevant content using this PPT layout. Grab it now.

Viral Marketing Techniques To Increase Annual Business Sales Viral Marketing Campaign Plan With KPI Assessment Demonstration PDF
The following slide shows viral marketing campaign plan with KPI analysis. It provides details about buzz, online, offline, word of mouth, team, goals, budget, call-to-action, key performance indicators, fear of missing out FOMO, etc. Slidegeeks is here to make your presentations a breeze with Viral Marketing Techniques To Increase Annual Business Sales Viral Marketing Campaign Plan With KPI Assessment Demonstration PDF With our easy-to-use and customizable templates, you can focus on delivering your ideas rather than worrying about formatting. With a variety of designs to choose from, you are sure to find one that suits your needs. And with animations and unique photos, illustrations, and fonts, you can make your presentation pop. So whether you are giving a sales pitch or presenting to the board, make sure to check out Slidegeeks first

Supply Chain Kpi Dashboard For Effective Financial Analysis Stand Out Digital Supply Chain Tactics Enhancing Graphics PDF
Mentioned slide illustrates KPI dashboard that can be used by managers to assess financial health of supply chain business. KPIs covered are supply chain costs versus sales, cash to order cycle, warehouse operating cost distribution etc.Coming up with a presentation necessitates that the majority of the effort goes into the content and the message you intend to convey. The visuals of a PowerPoint presentation can only be effective if it supplements and supports the story that is being told. Keeping this in mind our experts created Supply Chain Kpi Dashboard For Effective Financial Analysis Stand Out Digital Supply Chain Tactics Enhancing Graphics PDF to reduce the time that goes into designing the presentation. This way, you can concentrate on the message while our designers take care of providing you with the right template for the situation.
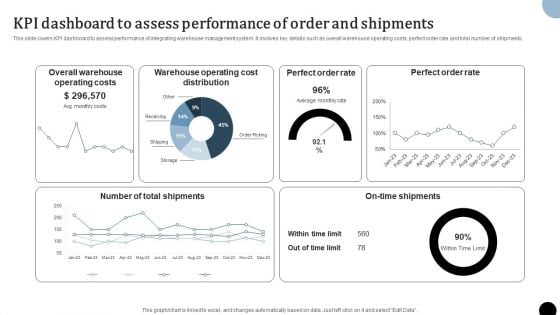
Strategy To Enhance Supply Chain Operations KPI Dashboard To Assess Performance Of Order And Shipments Professional PDF
This slide covers KPI dashboard to assess performance of integrating warehouse management system. It involves key details such as overall warehouse operating costs, perfect order rate and total number of shipments. Slidegeeks has constructed Strategy To Enhance Supply Chain Operations KPI Dashboard To Assess Performance Of Order And Shipments Professional PDF after conducting extensive research and examination. These presentation templates are constantly being generated and modified based on user preferences and critiques from editors. Here, you will find the most attractive templates for a range of purposes while taking into account ratings and remarks from users regarding the content. This is an excellent jumping off point to explore our content and will give new users an insight into our top notch PowerPoint Templates.
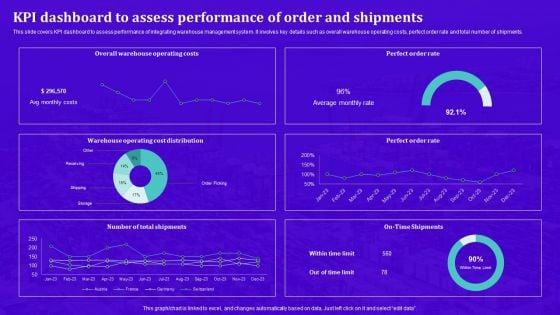
Techniques For Effective Supply Chain Management KPI Dashboard To Assess Performance Of Order And Shipments Structure PDF
This slide covers KPI dashboard to assess performance of integrating warehouse management system. It involves key details such as overall warehouse operating costs, perfect order rate and total number of shipments. Boost your pitch with our creative Techniques For Effective Supply Chain Management KPI Dashboard To Assess Performance Of Order And Shipments Structure PDF. Deliver an awe-inspiring pitch that will mesmerize everyone. Using these presentation templates you will surely catch everyones attention. You can browse the ppts collection on our website. We have researchers who are experts at creating the right content for the templates. So you do not have to invest time in any additional work. Just grab the template now and use them.
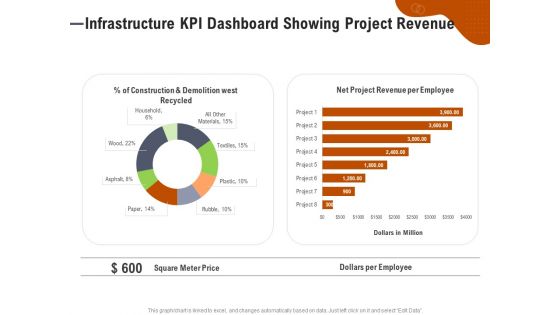
Key Features For Effective Business Management Infrastructure KPI Dashboard Showing Project Revenue Ppt Ideas File Formats PDF
Presenting this set of slides with name key features for effective business management infrastructure kpi dashboard showing project revenue ppt ideas file formats pdf. The topics discussed in these slides are construction and demolition west recycled, net project revenue per employee, square meter price, dollars per employee. This is a completely editable PowerPoint presentation and is available for immediate download. Download now and impress your audience.
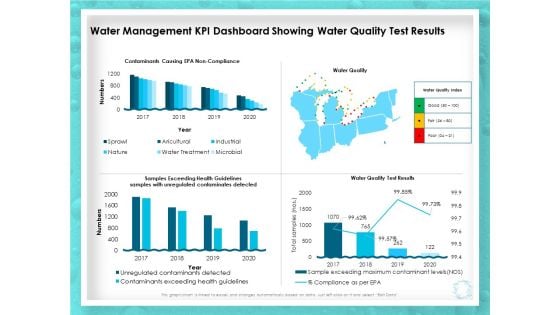
WQM System Water Management KPI Dashboard Showing Water Quality Test Results Ppt PowerPoint Presentation Outline Portfolio PDF
Presenting this set of slides with name wqm system water management kpi dashboard showing water quality test results ppt powerpoint presentation outline portfolio pdf. The topics discussed in these slides are contaminants causing epa non compliance, water quality, water quality test results, samples exceeding health guidelines. This is a completely editable PowerPoint presentation and is available for immediate download. Download now and impress your audience.
Optimization Of Water Usage Water Management KPI Dashboard Showing Water Quality Test Results Ppt Icon Themes PDF
Presenting this set of slides with name optimization of water usage water management kpi dashboard showing water quality test results ppt icon themes pdf. The topics discussed in these slides are contaminants causing epa non compliance, water quality, water quality test results, samples exceeding health guidelines. This is a completely editable PowerPoint presentation and is available for immediate download. Download now and impress your audience.
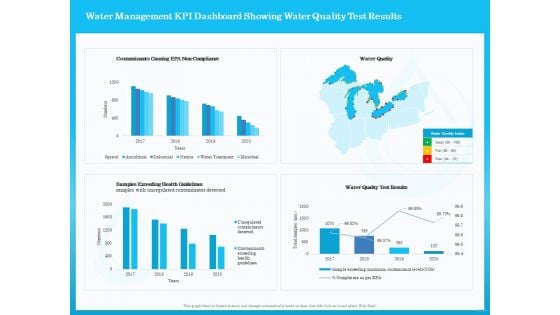
Monitoring And Evaluating Water Quality Water Management KPI Dashboard Showing Water Quality Test Results Ppt Professional Vector PDF
Presenting this set of slides with name monitoring and evaluating water quality water management kpi dashboard showing water quality test results ppt professional vector pdf. The topics discussed in these slides are contaminants causing epa non compliance, water quality, water quality test results, samples exceeding health guidelines. This is a completely editable PowerPoint presentation and is available for immediate download. Download now and impress your audience.
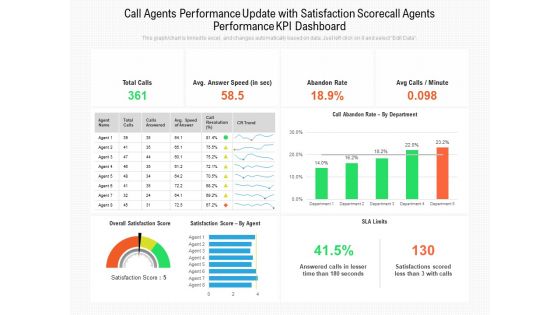
Call Agents Performance Update With Satisfaction Scorecall Agents Performance Kpi Dashboard Ppt PowerPoint Presentation Gallery Background PDF
Presenting this set of slides with name call agents performance update with satisfaction scorecall agents performance kpi dashboard ppt powerpoint presentation gallery background pdf. The topics discussed in these slides are total calls, avg answer speed, abandon rate, avg calls, minute, satisfaction score by agent, sla limits. This is a completely editable PowerPoint presentation and is available for immediate download. Download now and impress your audience.
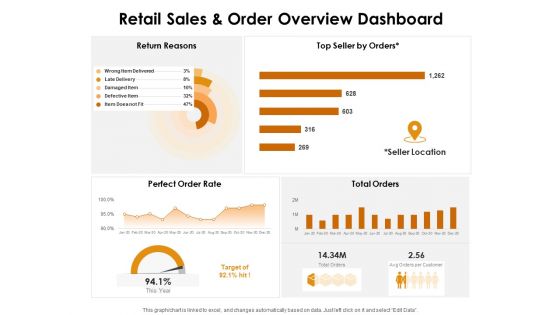
KPI Dashboards Per Industry Retail Sales And Order Overview Dashboard Ppt PowerPoint Presentation Infographic Template Master Slide PDF
Deliver and pitch your topic in the best possible manner with this kpi dashboards per industry retail sales and order overview dashboard ppt powerpoint presentation infographic template master slide pdf. Use them to share invaluable insights on return reasons, top seller orders, perfect order rate, total orders, seller location and impress your audience. This template can be altered and modified as per your expectations. So, grab it now.
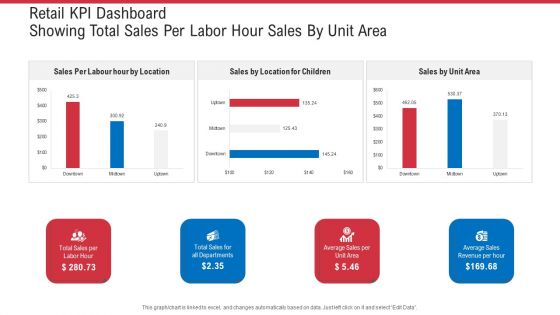
Retail KPI Dashboard Showing Total Sales Per Labor Hour Sales By Unit Area Ppt Summary Microsoft PDF
Deliver and pitch your topic in the best possible manner with this retail KPI dashboard showing total sales per labor hour sales by unit area ppt summary microsoft . Use them to share invaluable insights on total sales for all departments, average sales per unit area, average sales revenue per hour and impress your audience. This template can be altered and modified as per your expectations. So, grab it now.
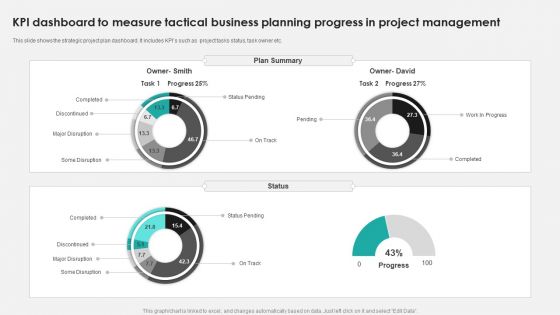
KPI Dashboard To Measure Tactical Business Planning Progress In Project Management Ppt PowerPoint Presentation File Example File PDF
This slide shows the strategic project plan dashboard. It includes KPIs such as project tasks status, task owner etc. Showcasing this set of slides titled KPI Dashboard To Measure Tactical Business Planning Progress In Project Management Ppt PowerPoint Presentation File Example File PDF. The topics addressed in these templates are Discontinued, Some Disruption, Completed. All the content presented in this PPT design is completely editable. Download it and make adjustments in color, background, font etc. as per your unique business setting.
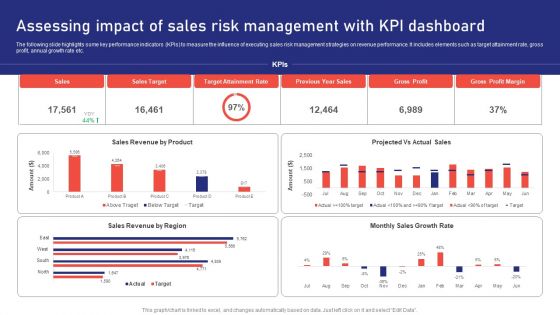
Sales Risk Assessment For Profit Maximization Assessing Impact Of Sales Risk Management With Kpi Dashboard Inspiration PDF
The following slide highlights some key performance indicators KPIs to measure the influence of executing sales risk management strategies on revenue performance. It includes elements such as target attainment rate, gross profit, annual growth rate etc. Find a pre designed and impeccable Sales Risk Assessment For Profit Maximization Assessing Impact Of Sales Risk Management With Kpi Dashboard Inspiration PDF. The templates can ace your presentation without additional effort. You can download these easy to edit presentation templates to make your presentation stand out from others. So, what are you waiting for Download the template from Slidegeeks today and give a unique touch to your presentation.
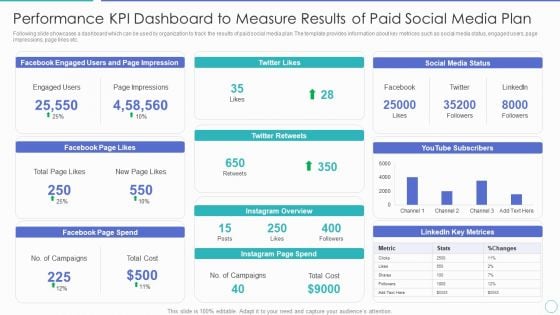
Performance KPI Dashboard To Measure Results Of Paid Social Media Plan Ppt PowerPoint Presentation Gallery Format Ideas PDF
Following slide showcases a dashboard which can be used by organization to track the results of paid social media plan. The template provides information about key metrices such as social media status, engaged users, page impressions, page likes etc. Pitch your topic with ease and precision using this performance kpi dashboard to measure results of paid social media plan ppt powerpoint presentation gallery format ideas pdf. This layout presents information on social media status, instagram page spend, facebook page spend, facebook page likes. It is also available for immediate download and adjustment. So, changes can be made in the color, design, graphics or any other component to create a unique layout.
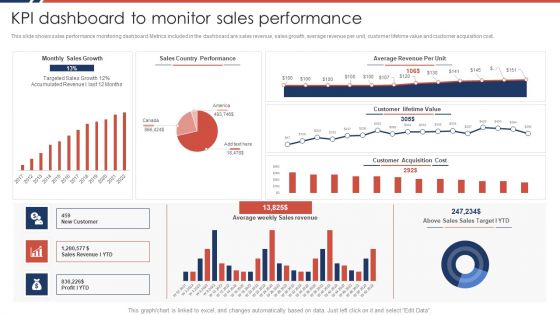
Effective Sales Plan For New Product Introduction In Market KPI Dashboard To Monitor Sales Performance Portrait PDF
This slide shows sales performance monitoring dashboard. Metrics included in the dashboard are sales revenue, sales growth, average revenue per unit, customer lifetime value and customer acquisition cost.Deliver an awe inspiring pitch with this creative Effective Sales Plan For New Product Introduction In Market KPI Dashboard To Monitor Sales Performance Portrait PDF bundle. Topics like Average Revenue, Country Performance, Customer Lifetime can be discussed with this completely editable template. It is available for immediate download depending on the needs and requirements of the user.
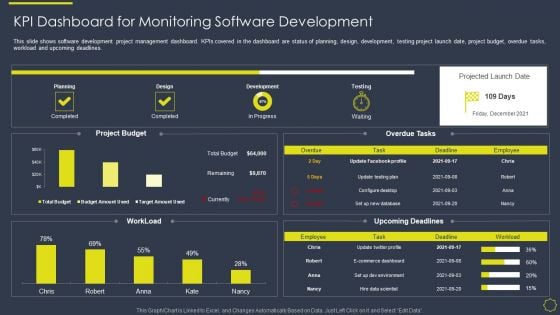
Implementing Development And Operations Platforms For In Time Product Launch IT KPI Dashboard For Monitoring Elements PDF
This slide shows software development project management dashboard. KPIs covered in the dashboard are status of planning, design, development, testing project launch date, project budget, overdue tasks, workload and upcoming deadlines. Deliver and pitch your topic in the best possible manner with this implementing development and operations platforms for in time product launch it kpi dashboard for monitoring elements pdf. Use them to share invaluable insights on development, design, development, planning and impress your audience. This template can be altered and modified as per your expectations. So, grab it now.
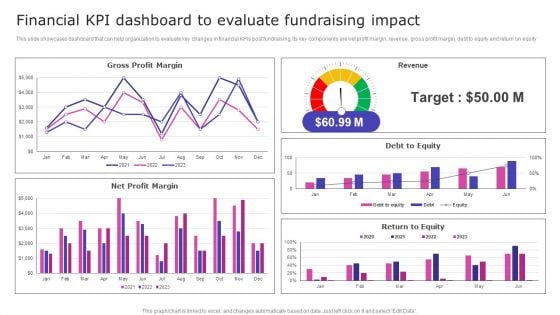
Strategic Fund Acquisition Plan For Business Opertions Expansion Financial KPI Dashboard To Evaluate Fundraising Impact Guidelines PDF
This slide showcases dashboard that can help organization to evaluate key changes in financial KPIs post fundraising. Its key components are net profit margin, revenue, gross profit margin, debt to equity and return on equity. There are so many reasons you need a Strategic Fund Acquisition Plan For Business Opertions Expansion Financial KPI Dashboard To Evaluate Fundraising Impact Guidelines PDF. The first reason is you can not spend time making everything from scratch, Thus, Slidegeeks has made presentation templates for you too. You can easily download these templates from our website easily.
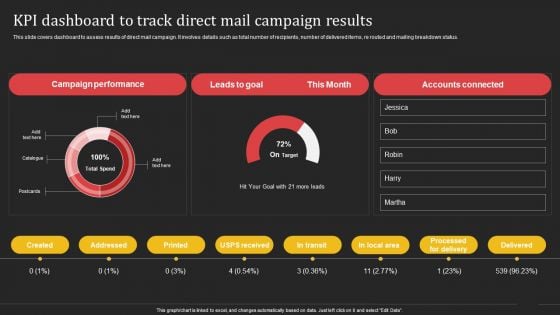
Complete Strategic Manual For Direct Mail Marketing Kpi Dashboard To Track Direct Mail Campaign Results Inspiration PDF
This slide covers dashboard to assess results of direct mail campaign. It involves details such as total number of recipients, number of delivered items, re routed and mailing breakdown status. Take your projects to the next level with our ultimate collection of Complete Strategic Manual For Direct Mail Marketing Kpi Dashboard To Track Direct Mail Campaign Results Inspiration PDF. Slidegeeks has designed a range of layouts that are perfect for representing task or activity duration, keeping track of all your deadlines at a glance. Tailor these designs to your exact needs and give them a truly corporate look with your own brand colors they will make your projects stand out from the rest.
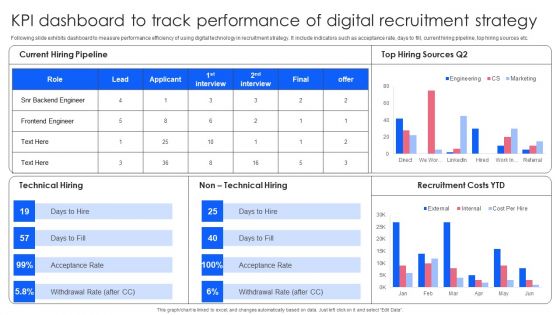
Effective Guide To Build Strong Online Hiring Strategy KPI Dashboard To Track Performance Of Digital Slides PDF
Following slide exhibits dashboard to measure performance efficiency of using digital technology in recruitment strategy. It include indicators such as acceptance rate, days to fill, current hiring pipeline, top hiring sources etc. There are so many reasons you need a Effective Guide To Build Strong Online Hiring Strategy KPI Dashboard To Track Performance Of Digital Slides PDF. The first reason is you cannot spend time making everything from scratch, Thus, Slidegeeks has made presentation templates for you too. You can easily download these templates from our website easily.
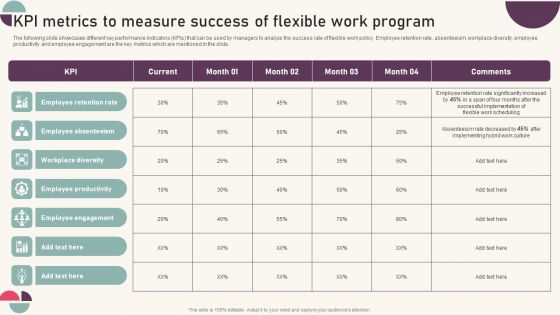
Tactics For Establishing Sustainable Hybrid Work Environment Kpi Metrics To Measure Success Of Flexible Work Mockup PDF
The following slide showcases different key performance indicators KPIs that can be used by managers to analyze the success rate of flexible work policy. Employee retention rate, absenteeism, workplace diversity, employee productivity and employee engagement are the key metrics which are mentioned in the slide. The best PPT templates are a great way to save time, energy, and resources. Slidegeeks have 100 percent editable powerpoint slides making them incredibly versatile. With these quality presentation templates, you can create a captivating and memorable presentation by combining visually appealing slides and effectively communicating your message. Download Tactics For Establishing Sustainable Hybrid Work Environment Kpi Metrics To Measure Success Of Flexible Work Mockup PDF from Slidegeeks and deliver a wonderful presentation.
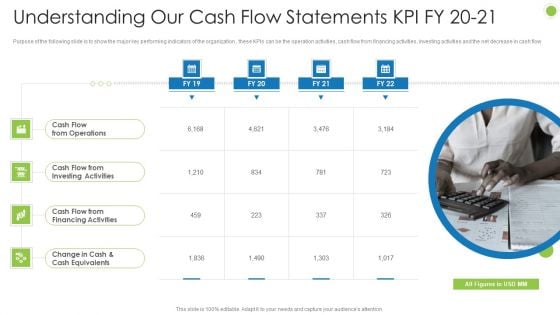
Debt Retrieval Techniques Understanding Our Cash Flow Statements Kpi Fy 20 21 Ppt Infographic Template Background Images PDF
Purpose of the following slide is to show the major key performing indicators of the organization , these KPIs can be the operation activities, cash flow from financing activities, investing activities and the net decrease in cash flow This is a debt retrieval techniques understanding our cash flow statements kpi fy 20 21 ppt infographic template background images pdf template with various stages. Focus and dispense information on four stages using this creative set, that comes with editable features. It contains large content boxes to add your information on topics like cash flow from operations, cash flow from investing activities, cash flow from financing activities, change in cash and cash equivalents. You can also showcase facts, figures, and other relevant content using this PPT layout. Grab it now.
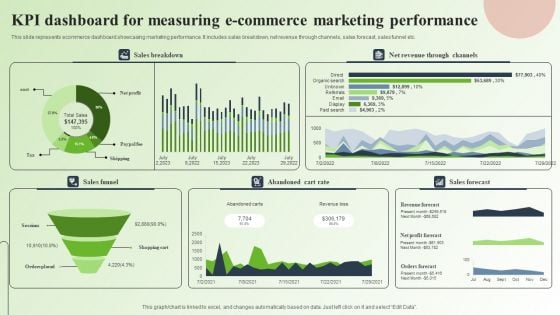
Strategic Guide For Mastering E Commerce Marketing Kpi Dashboard For Measuring E Commerce Marketing Performance Infographics PDF
This slide represents ecommerce dashboard showcasing marketing performance. It includes sales breakdown, net revenue through channels, sales forecast, sales funnel etc. Slidegeeks is here to make your presentations a breeze with Strategic Guide For Mastering E Commerce Marketing Kpi Dashboard For Measuring E Commerce Marketing Performance Infographics PDF With our easy to use and customizable templates, you can focus on delivering your ideas rather than worrying about formatting. With a variety of designs to choose from, you are sure to find one that suits your needs. And with animations and unique photos, illustrations, and fonts, you can make your presentation pop. So whether you are giving a sales pitch or presenting to the board, make sure to check out Slidegeeks first.
Key Performance Indicator Vector Icon Ppt PowerPoint Presentationmodel Brochure
This is a key performance indicator vector icon ppt powerpoint presentationmodel brochure. This is a three stage process. The stages in this process are kpi proposal, kpi plan, kpi scheme.

Key Performance Indicator Analytics Dashboard Ppt PowerPoint Presentation Model Example Topics
This is a key performance indicator analytics dashboard ppt powerpoint presentation model example topics. This is a five stage process. The stages in this process are kpi proposal, kpi plan, kpi scheme.
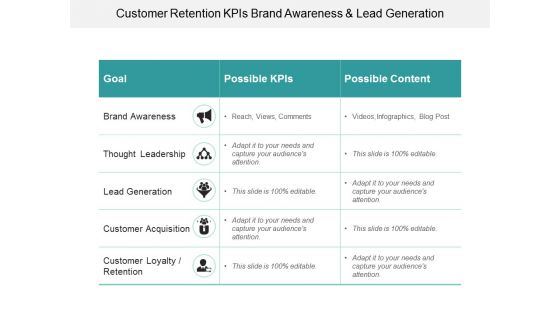
Customer Retention Kpis Brand Awareness And Lead Generation Ppt PowerPoint Presentation Outline Information
This is a customer retention kpis brand awareness and lead generation ppt powerpoint presentation outline information. This is a three stage process. The stages in this process are kpi proposal, kpi plan, kpi scheme.
Ecommerce Kpis Reach Act Convert Engage Ppt PowerPoint Presentation Icon
This is a ecommerce kpis reach act convert engage ppt powerpoint presentation icon. This is a five stage process. The stages in this process are kpi proposal, kpi plan, kpi scheme.
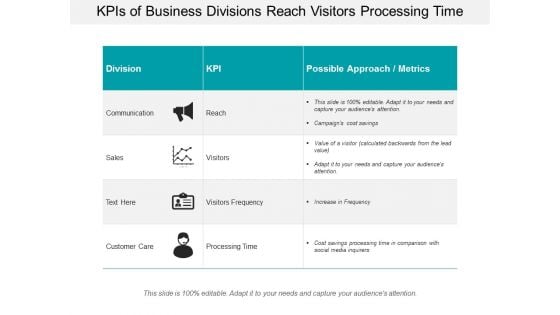
Kpis Of Business Divisions Reach Visitors Processing Time Ppt PowerPoint Presentation Slides Outfit
This is a kpis of business divisions reach visitors processing time ppt powerpoint presentation slides outfit. This is a three stage process. The stages in this process are kpi proposal, kpi plan, kpi scheme.
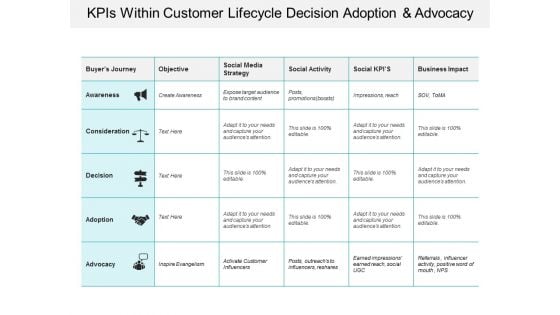
Kpis Within Customer Lifecycle Decision Adoption And Advocacy Ppt PowerPoint Presentation Infographic Template Graphics Design
This is a kpis within customer lifecycle decision adoption and advocacy ppt powerpoint presentation infographic template graphics design. This is a three stage process. The stages in this process are kpi proposal, kpi plan, kpi scheme.
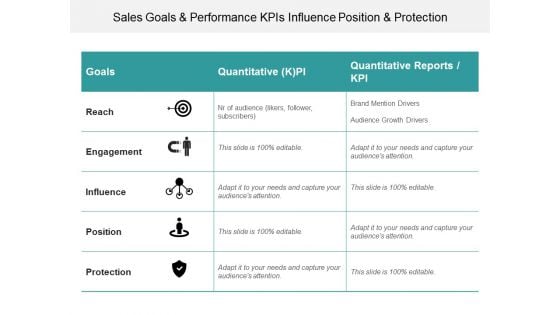
Sales Goals And Performance Kpis Influence Position And Protection Ppt PowerPoint Presentation Styles Inspiration
This is a sales goals and performance kpis influence position and protection ppt powerpoint presentation styles inspiration. This is a three stage process. The stages in this process are kpi proposal, kpi plan, kpi scheme.
Social Media Icons With Pie Charts For Marketing Analysis Ppt PowerPoint Presentation Ideas Example
This is a social media icons with pie charts for marketing analysis ppt powerpoint presentation ideas example. This is a six stage process. The stages in this process are kpi proposal, kpi plan, kpi scheme.
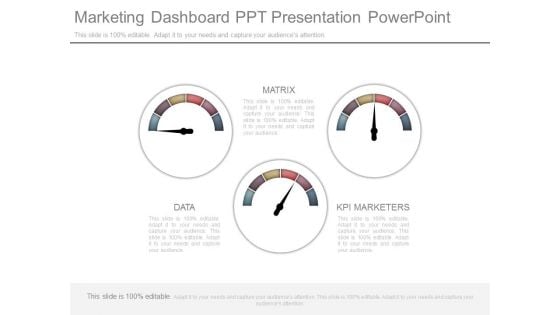
Marketing Dashboard Ppt Presentation Powerpoint
This is a marketing dashboard ppt presentation powerpoint. This is a three stage process. The stages in this process are data, matrix, kpi marketers.
Online Product Planning Ecommerce Management KPIS And Dashboard Ppt Professional Example PDF
Presenting this set of slides with name online product planning ecommerce management kpis and dashboard ppt professional example pdf. This is a two stage process. The stages in this process are kpi metrics, kpi dashboards. This is a completely editable PowerPoint presentation and is available for immediate download. Download now and impress your audience.
Ecommerce Management Kpis And Dashboard Ppt PowerPoint Presentation Show Layouts PDF
Presenting this set of slides with name ecommerce management kpis and dashboard ppt powerpoint presentation show layouts pdf. This is a two stage process. The stages in this process are kpi metrics, kpi dashboards. This is a completely editable PowerPoint presentation and is available for immediate download. Download now and impress your audience.
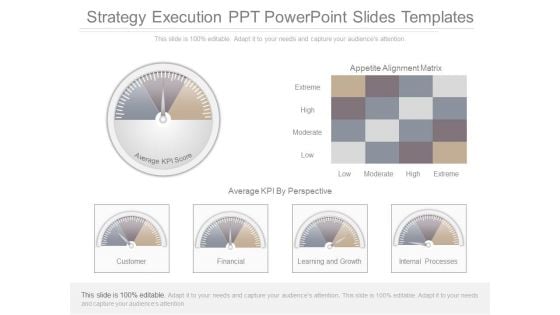
Strategy Execution Ppt Powerpoint Slides Templates
This is a strategy execution ppt powerpoint slides templates. This is a six stage process. The stages in this process are appetite alignment matrix, extreme, high, moderate, low, average kpi by prospective, customer, financial, learning and growth, internal processes, average kpi score.
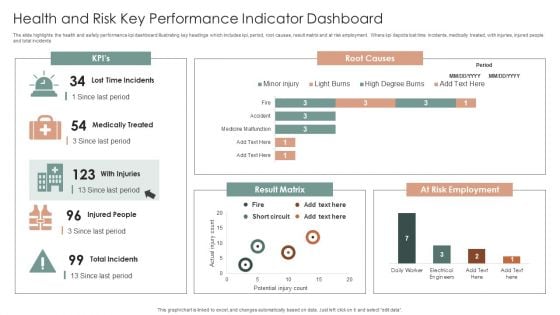
Health And Risk Key Performance Indicator Dashboard Ppt Layouts Graphics Design PDF
The slide highlights the health and safety performance kpi dashboard illustrating key headings which includes kpi, period, root causes, result matrix and at risk employment. Where kpi depicts lost time incidents, medically treated, with injuries, injured people and total incidents. Showcasing this set of slides titled Health And Risk Key Performance Indicator Dashboard Ppt Layouts Graphics Design PDF. The topics addressed in these templates are Root Causes, Result Matrix, At Risk Employment. All the content presented in this PPT design is completely editable. Download it and make adjustments in color, background, font etc. as per your unique business setting.

Education Institute SEO Approach Regular Monitoring Training Ppt
This slide covers monitoring SEO for school as strategy for education industry. It also depicts that education businesses must monitor their website through KPI or metrics such as loading speed, your websites mobile-friendliness, etc.

Actual Project Management Linguistic Presentation Visual Aids
This is a actual project management linguistic presentation visual aids. This is a four stage process. The stages in this process are area, kpi name, target compliance, actual, linguistic, project management, engineering, finance.
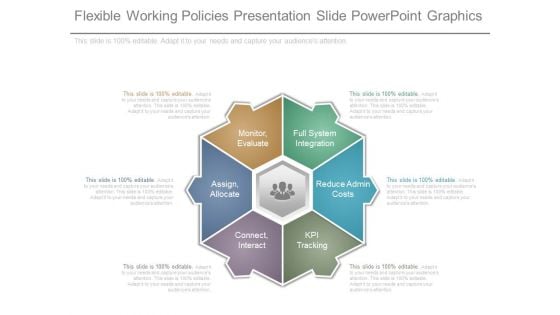
Flexible Working Policies Presentation Slide Powerpoint Graphics
This is a flexible working policies presentation slide powerpoint graphics. This is a six stage process. The stages in this process are assign, allocate, monitor, evaluate, full system integration, reduce admin costs, kpi tracking, connect, interact.
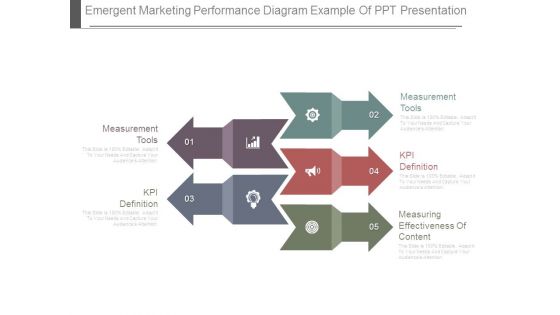
Emergent Marketing Performance Diagram Example Of Ppt Presentation
This is a emergent marketing performance diagram example of ppt presentation. This is a five stage process. The stages in this process are measurement tools, kpi definition, measuring effectiveness of content.
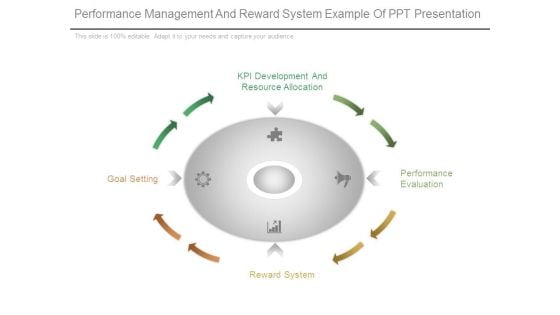
Performance Management And Reward System Example Of Ppt Presentation
This is a performance management and reward system example of ppt presentation. This is a six stage process. The stages in this process are kpi development and resource allocation, performance evaluation, goal setting, reward system.
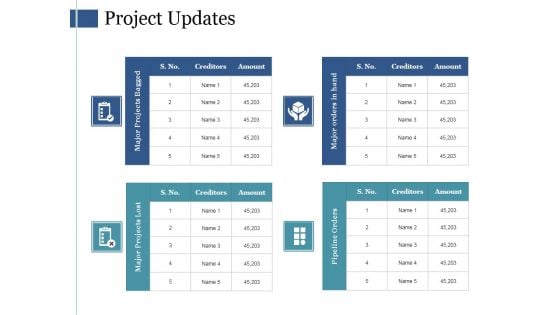
Project Updates Template Ppt PowerPoint Presentation File Graphic Images
This is a project updates template ppt powerpoint presentation file graphic images. This is a six stage process. The stages in this process are sales funnel results, sales process map, top clients, project updates, sales channel kpi tracker.
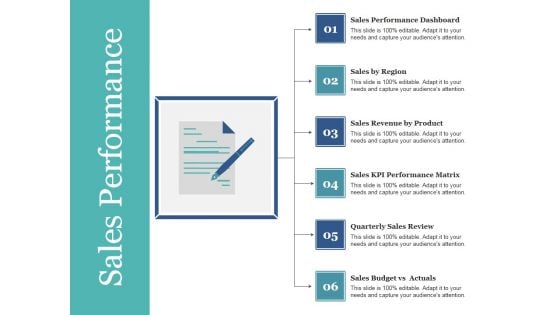
Sales Performance Ppt PowerPoint Presentation Summary Influencers
This is a sales performance ppt powerpoint presentation summary influencers. This is a six stage process. The stages in this process are sales performance dashboard, sales by region, sales revenue by product, sales kpi performance matrix, quarterly sales review.
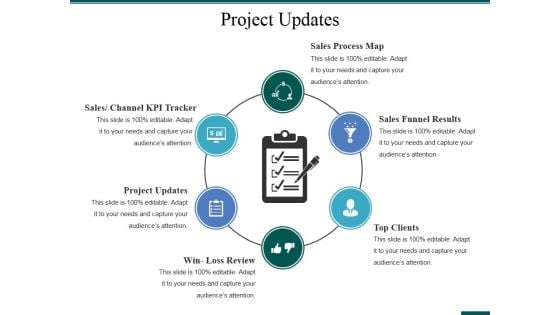
Project Updates Template 1 Ppt PowerPoint Presentation Gallery Portfolio
This is a project updates template 1 ppt powerpoint presentation gallery portfolio. This is a six stage process. The stages in this process are sales channel kpi tracker, project updates, win loss review, sales process map, top clients.
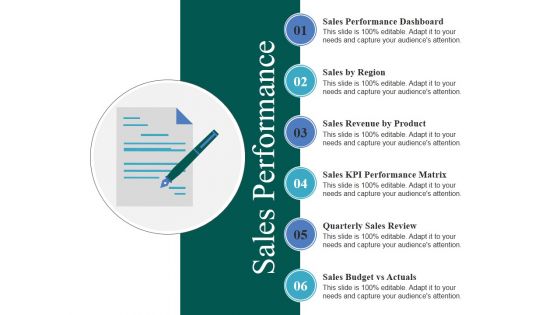
Sales Performance Ppt PowerPoint Presentation Infographics Visuals
This is a sales performance ppt powerpoint presentation infographics visuals. This is a six stage process. The stages in this process are sales by region, sales revenue by product, sales kpi performance matrix, quarterly sales review, sales budget vs actuals.
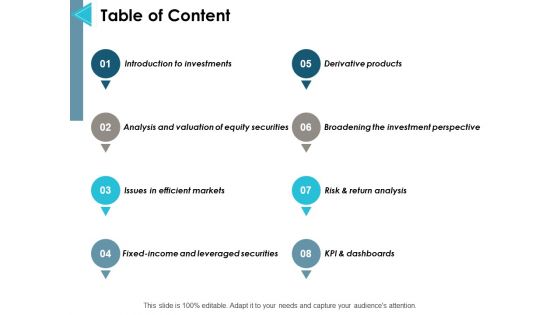
Table Of Content Ppt PowerPoint Presentation Gallery Graphic Tips
This is a table of content ppt powerpoint presentation gallery graphic tips. This is a eight stage process. The stages in this process are introduction to investments, risk and return analysis, issues in efficient markets, kpi and dashboards, management.
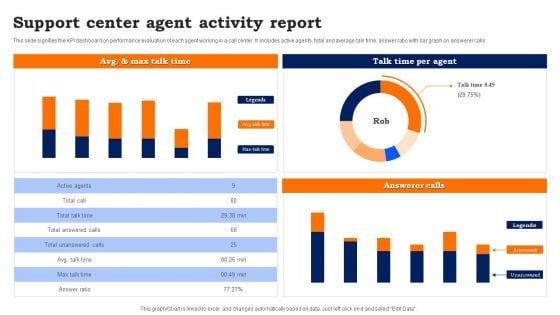
Support Center Agent Activity Report Guidelines PDF
This slide signifies the KPI dashboard on performance evaluation of each agent working in a call center. It includes active agents, total and average talk time, answer ratio with bar graph on answerer calls.
Primary And Secondary Shipping Tracking Metrics Profile Rules PDF
This slide covers the KPI profile for defining measures to evaluate KPI performance. It also includes the details for enlisted KPIs such as ID, name, value, unit and rating. Showcasing this set of slides titled Primary And Secondary Shipping Tracking Metrics Profile Rules PDF. The topics addressed in these templates are Secondary, Primary, Metrics Profile. All the content presented in this PPT design is completely editable. Download it and make adjustments in color, background, font etc. as per your unique business setting.
Data Assimilation Your Title Here Metrics Ppt Icon Skills PDF
This is a data assimilation your title here metrics ppt icon skills pdf template with various stages. Focus and dispense information on two stages using this creative set, that comes with editable features. It contains large content boxes to add your information on topics like kpi metrics, kpi dashboards. You can also showcase facts, figures, and other relevant content using this PPT layout. Grab it now.
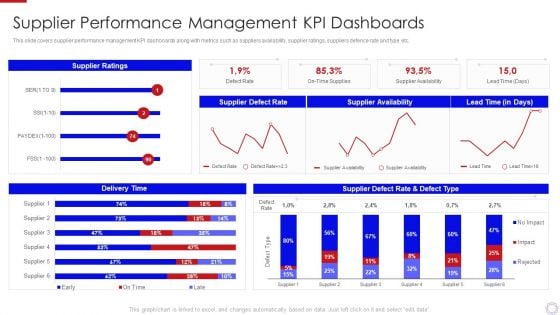
Major Strategies To Nurture Effective Vendor Association Supplier Performance Management Information PDF
This slide covers supplier performance management KPI dashboards along with metrics such as suppliers availability, supplier ratings, suppliers defence rate and type etc. Deliver and pitch your topic in the best possible manner with this major strategies to nurture effective vendor association supplier performance management information pdf. Use them to share invaluable insights on supplier performance management kpi dashboards and impress your audience. This template can be altered and modified as per your expectations. So, grab it now.
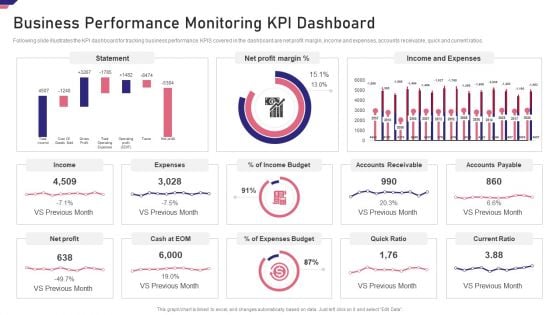
Mergers Acquisition Playbook Mergers Acquisition Playbook Business Performance Guidelines PDF
Following slide illustrates the KPI dashboard for tracking business performance. KPIS covered in the dashboard are net profit margin, income and expenses, accounts receivable, quick and current ratios.Deliver an awe inspiring pitch with this creative Mergers Acquisition Playbook Mergers Acquisition Playbook Business Performance Guidelines PDF bundle. Topics like Business Performance Monitoring KPI Dashboard can be discussed with this completely editable template. It is available for immediate download depending on the needs and requirements of the user.
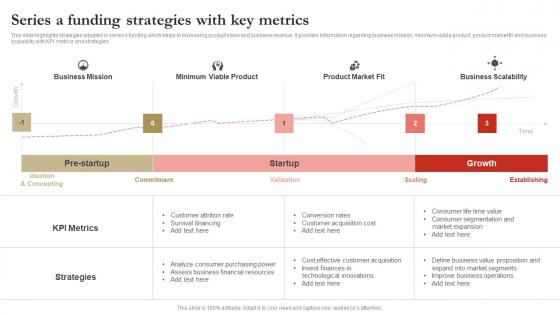
Series A Funding Strategies With Key Metrics Graphics Pdf
This slide highlights strategies adopted in series A funding which helps in increasing product sales and business revenue. It provides information regarding business mission, minimum viable product, product market fit and business scalability with KPI metrics and strategies. Pitch your topic with ease and precision using this Series A Funding Strategies With Key Metrics Graphics Pdf. This layout presents information on Kpi Metrics, Strategies, Financial Resources. It is also available for immediate download and adjustment. So, changes can be made in the color, design, graphics or any other component to create a unique layout. This slide highlights strategies adopted in series A funding which helps in increasing product sales and business revenue. It provides information regarding business mission, minimum viable product, product market fit and business scalability with KPI metrics and strategies.


 Continue with Email

 Home
Home


