Line Chart
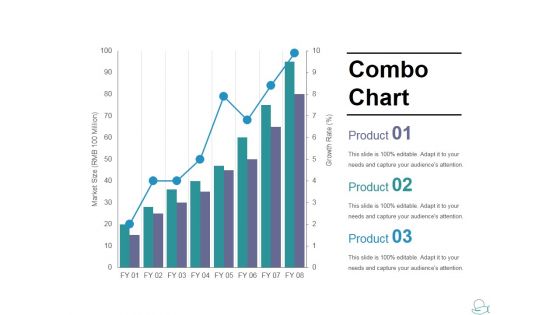
Combo Chart Ppt PowerPoint Presentation Slides Show
This is a combo chart ppt powerpoint presentation slides show. This is a three stage process. The stages in this process are combo chart, market size, product, bar graph, growth.
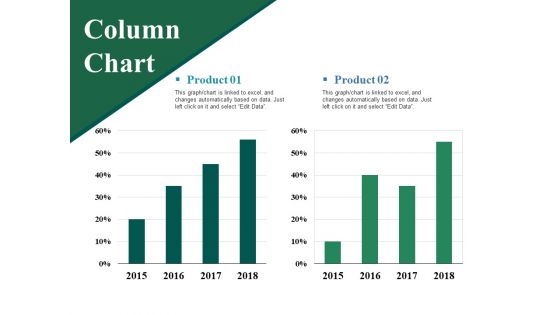
Column Chart Ppt PowerPoint Presentation Layouts Vector
This is a column chart ppt powerpoint presentation layouts vector. This is a two stage process. The stages in this process are product, column chart, bar graph, percentage, finance.
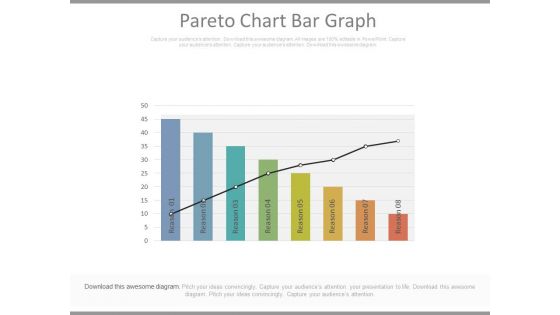
Pareto Chart Bar Graph Ppt Slides
This is a pareto chart bar graph ppt slides. This is a eight stage process. The stages in this process are business, marketing, success.\n
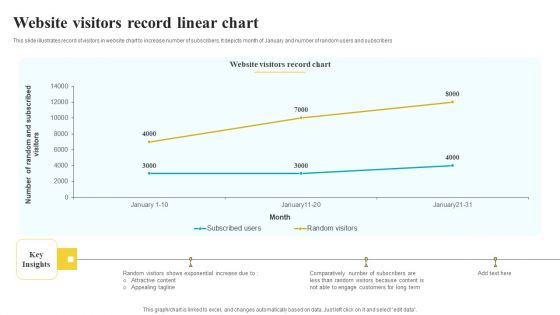
Website Visitors Record Linear Chart Summary PDF
This slide illustrates record of visitors in website chart to increase number of subscribers. It depicts month of January and number of random users and subscribers Showcasing this set of slides titled Website Visitors Record Linear Chart Summary PDF. The topics addressed in these templates are Key Insights, Record Chart, Long Term. All the content presented in this PPT design is completely editable. Download it and make adjustments in color, background, font etc. as per your unique business setting.
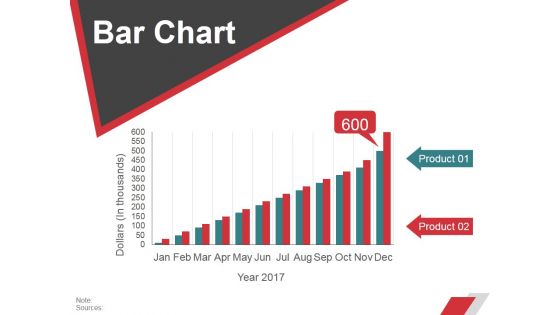
Bar Chart Ppt PowerPoint Presentation Layouts Visuals
This is a bar chart ppt powerpoint presentation layouts visuals. This is a two stage process. The stages in this process are business, strategy, marketing, planning, chart and graph.
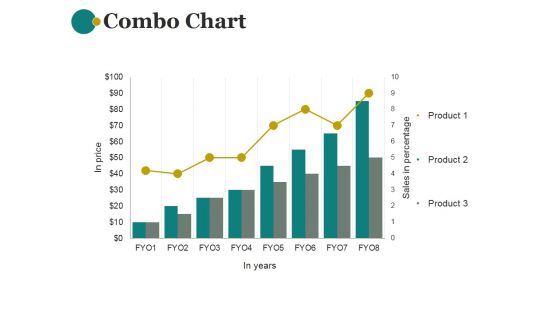
Combo Chart Ppt PowerPoint Presentation Shapes
This is a combo chart ppt powerpoint presentation shapes. This is a eight stage process. The stages in this process are combo chart, business, marketing, sales in percentage, bar graph.
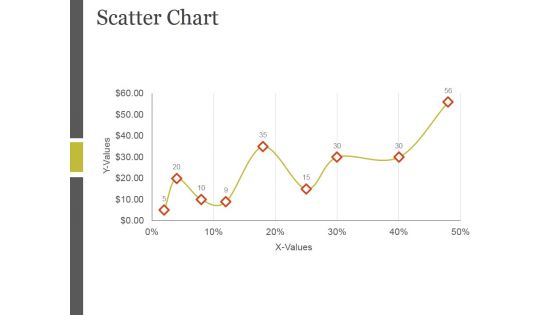
Scatter Chart Ppt PowerPoint Presentation Microsoft
This is a scatter chart ppt powerpoint presentation microsoft. This is a one stage process. The stages in this process are x values, scatter chart, bar graph, growth, business.
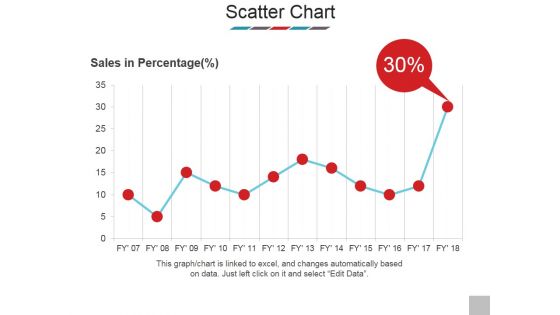
Scatter Chart Ppt PowerPoint Presentation Model Show
This is a scatter chart ppt powerpoint presentation model show. This is a one stage process. The stages in this process are sales in percentage, scatter chart, business, bar graph, marketing.
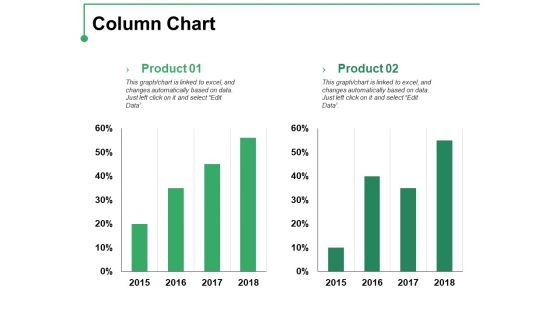
Column Chart Ppt PowerPoint Presentation Professional Template
This is a column chart ppt powerpoint presentation professional template. This is a two stage process. The stages in this process are product, percentage, finance, bar graph, growth.
Area Chart Ppt PowerPoint Presentation Icon Gallery
This is a area chart ppt powerpoint presentation icon gallery. This is a two stage process. The stages in this process are sales in percentage, product, bar graph.
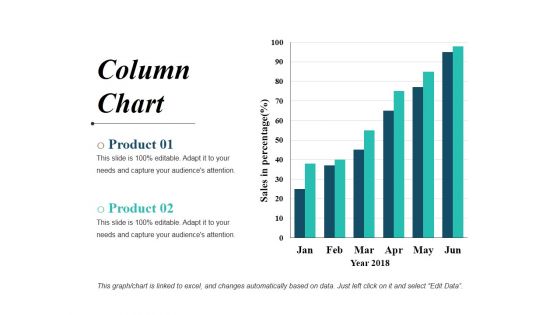
Column Chart Ppt PowerPoint Presentation Professional Layouts
This is a column chart ppt powerpoint presentation professional layouts. This is a six stage process. The stages in this process are bar graph, business, marketing, finance, planning.
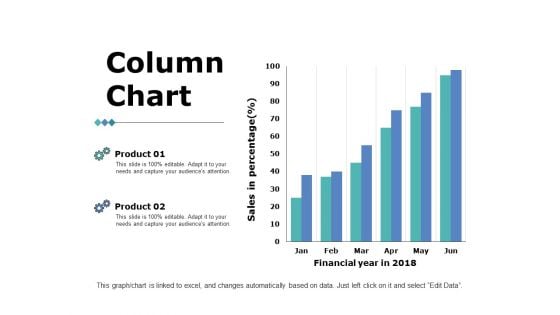
Column Chart Ppt PowerPoint Presentation Summary
This is a column chart ppt powerpoint presentation summary. This is a two stage process. The stages in this process are bar graph, marketing, strategy, finance, planning.
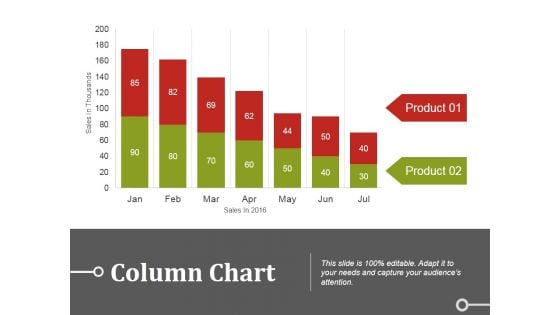
Column Chart Ppt PowerPoint Presentation Summary Introduction
This is a column chart ppt powerpoint presentation summary introduction. This is a two stage process. The stages in this process are business, marketing, bar, graph, finance.
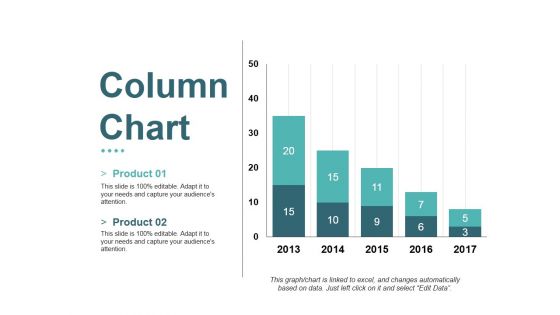
Column Chart Ppt PowerPoint Presentation Summary Maker
This is a column chart ppt powerpoint presentation summary maker. This is a two stage process. The stages in this process are business, marketing, product, bar graph, years.
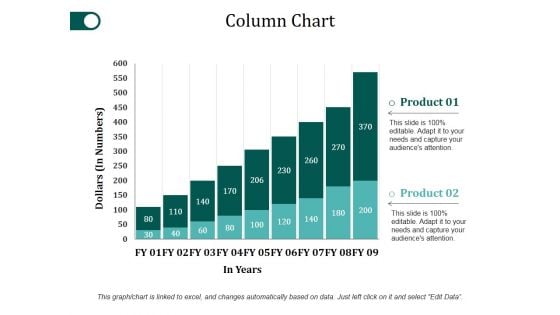
Column Chart Ppt PowerPoint Presentation Portfolio Clipart
This is a column chart ppt powerpoint presentation portfolio clipart. This is a two stage process. The stages in this process are bar graph, growth, success, product, dollars.

Column Chart Ppt PowerPoint Presentation Show Images
This is a column chart ppt powerpoint presentation show images. This is a two stage process. The stages in this process are product, expenditure, years, bar graph, growth.

Combo Chart Ppt PowerPoint Presentation Infographics Ideas
This is a combo chart ppt powerpoint presentation infographics ideas. This is a four stage process. The stages in this process are bar graph, marketing, strategy, finance, analysis.
Bar Chart Ppt PowerPoint Presentation Icon Graphics
This is a bar chart ppt powerpoint presentation icon graphics. This is a twelve stage process. The stages in this process are bar chart, marketing, management, planning, strategy.
Bar Arrow Chart PowerPoint Icon Cc
business bar chart with arrows isolated on a white background. Attain promotions with our Bar Arrow Chart PowerPoint Icon Cc. You will come out on top.
Bar Arrow Chart PowerPoint Icon S
business bar chart with arrows isolated on a white background. Feast your eyes on our Bar Arrow Chart PowerPoint Icon S. Get drawn in by their colorful display.
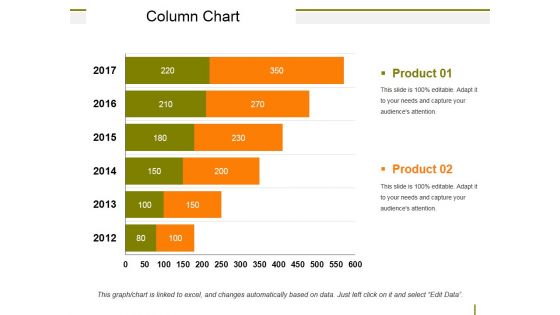
Column Chart Ppt PowerPoint Presentation Show Model
This is a column chart ppt powerpoint presentation show model. This is a six stage process. The stages in this process are business, marketing, bar, planning, strategy.
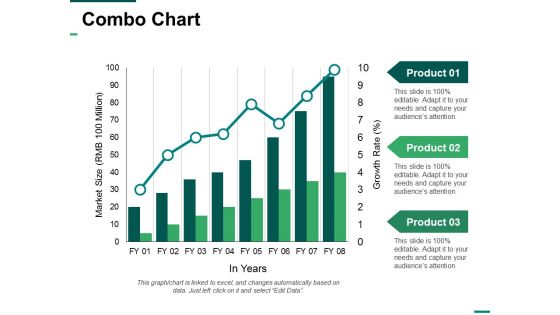
Combo Chart Ppt PowerPoint Presentation Show Summary
This is a combo chart ppt powerpoint presentation show summary. This is a three stage process. The stages in this process are bar, marketing, strategy, finance, planning.
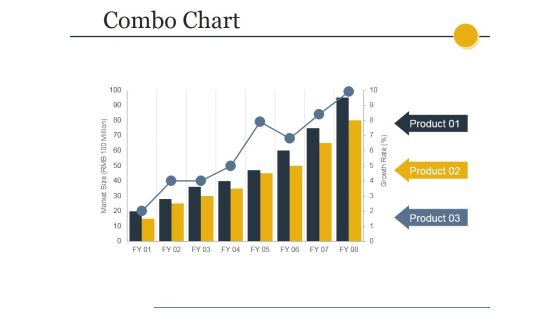
Combo Chart Ppt PowerPoint Presentation Outline Visuals
This is a combo chart ppt powerpoint presentation outline visuals. This is a eight stage process. The stages in this process are business, marketing, bar, success, growth.
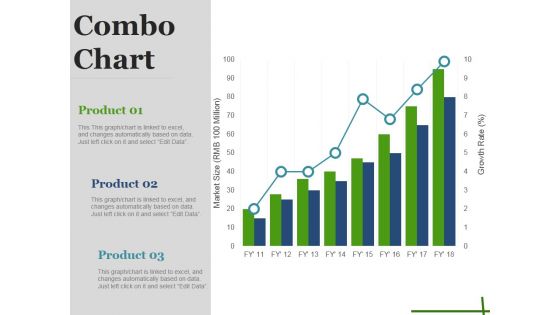
Combo Chart Ppt PowerPoint Presentation File Demonstration
This is a combo chart ppt powerpoint presentation file demonstration. This is a eight stage process. The stages in this process are business, marketing, strategy, bar, success.
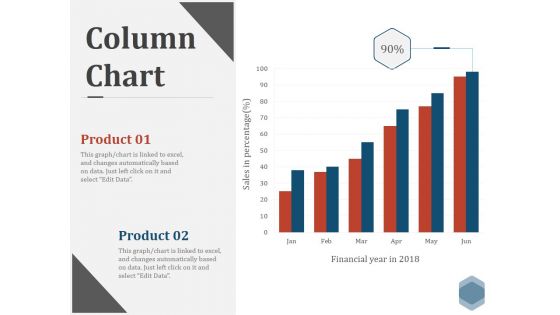
Column Chart Ppt PowerPoint Presentation File Formats
This is a column chart ppt powerpoint presentation file formats. This is a six stage process. The stages in this process are business, marketing, strategy, finance, bar.
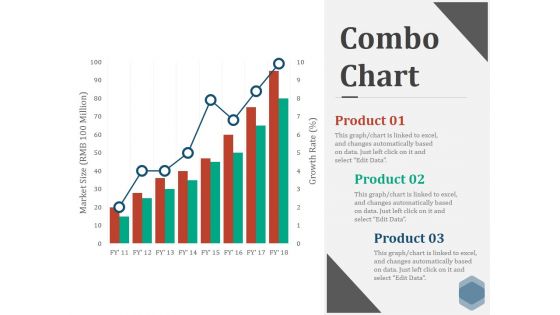
Combo Chart Ppt PowerPoint Presentation Pictures Graphics
This is a combo chart ppt powerpoint presentation pictures graphics. This is a eight stage process. The stages in this process are business, marketing, strategy, finance, bar.
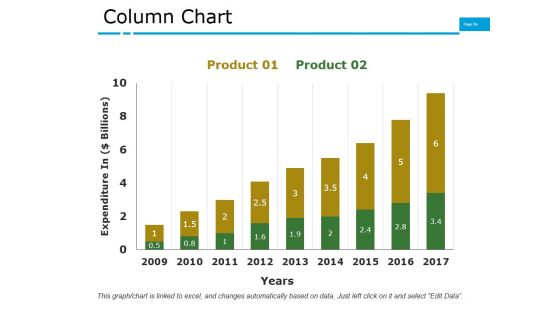
Column Chart Ppt PowerPoint Presentation Pictures Files
This is a column chart ppt powerpoint presentation pictures files. This is a nine stage process. The stages in this process are business, marketing, finance, bar, growth.
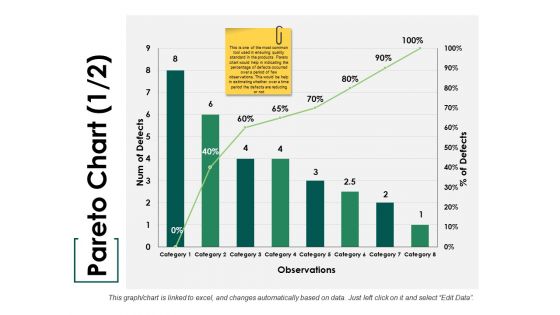
Pareto Chart Ppt PowerPoint Presentation Summary Show
This is a pareto chart ppt powerpoint presentation summary show. This is a eight stage process. The stages in this process are bar, marketing, strategy, finance, teamwork.
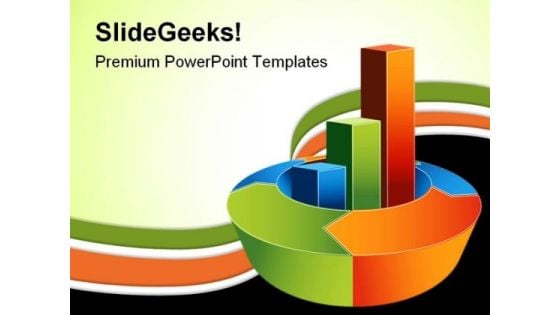
Bar Chart Business PowerPoint Template 0910
business bar chart with arrows isolated on a white background. Our Bar Chart Business PowerPoint Template 0910 make for good company. They ensure you have an enjoyable experience.
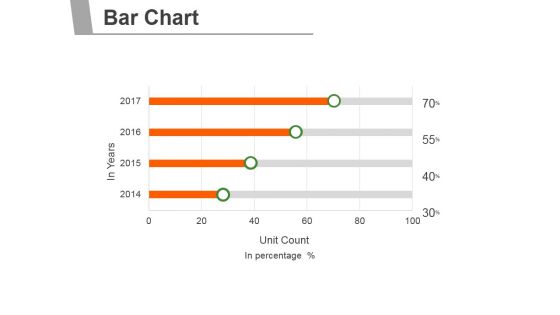
Bar Chart Ppt PowerPoint Presentation Deck
This is a bar chart ppt powerpoint presentation deck. This is a four stage process. The stages in this process are business, marketing, management, bar chart, finance.
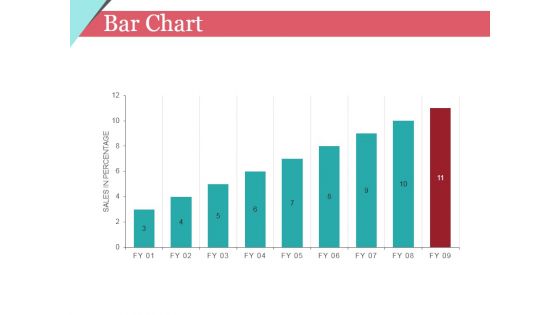
Bar Chart Ppt PowerPoint Presentation Show Show
This is a bar chart ppt powerpoint presentation show show. This is a nine stage process. The stages in this process are business, marketing, chart, growth.
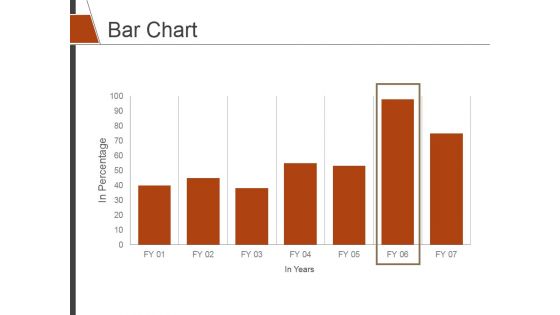
Bar Chart Ppt PowerPoint Presentation Slides Shapes
This is a bar chart ppt powerpoint presentation slides shapes. This is a seven stage process. The stages in this process are bar graph, finance, marketing, strategy, analysis.
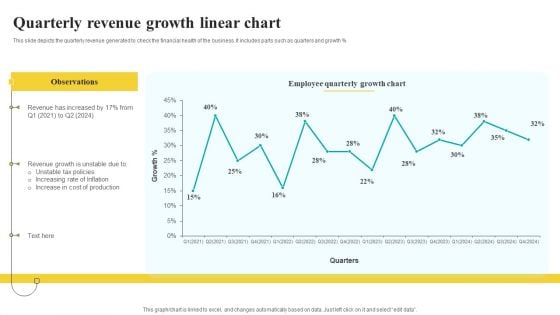
Quarterly Revenue Growth Linear Chart Elements PDF
This slide depicts the quarterly revenue generated to check the financial health of the business. It includes parts such as quarters and growth percent Showcasing this set of slides titled Quarterly Revenue Growth Linear Chart Elements PDF. The topics addressed in these templates are Observations, Growth Chart, Production. All the content presented in this PPT design is completely editable. Download it and make adjustments in color, background, font etc. as per your unique business setting.
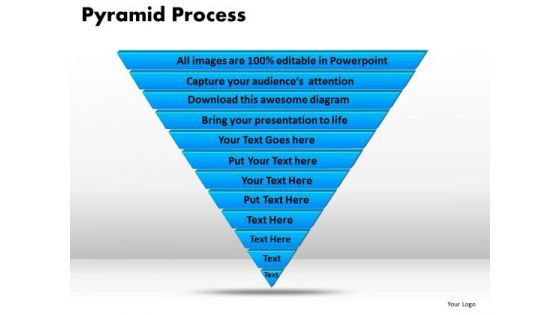
PowerPoint Slides Pyramid Process Chart Ppt Theme
PowerPoint Slides pyramid Process Chart PPT Theme-This Pyramid Diagram may be defined as representation of data in the form of a triangle separated by horizontal lines. The widest section may contain the general topic while the narrowest section may contain a much more specific topic-business, chart, color, concept, conceptual, construction, corporate, creating, data, design, diagram, direction, focus, graph, group, growth, hierarchy, illustration, information, isolated, layer, layered, level, manage, management, model, object, organization, performance, population, presentation, principal, process, progress, pyramid, rank, resource, shape, stage, structure, support, symbol, top, triangle, vector-PowerPoint Slides pyramid Process Chart PPT Theme Our PowerPoint Slides Pyramid Process Chart Ppt Theme have a enabling effect. They allow youto act as per your choice.
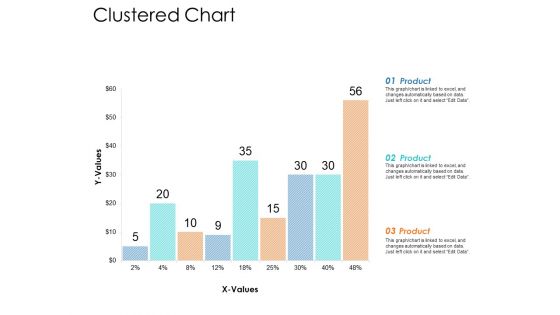
Clustered Chart Ppt Powerpoint Presentation Inspiration Guidelines
Presenting this set of slides with name clustered chart ppt powerpoint presentation inspiration guidelines. The topics discussed in these slide is clustered bar . This is a completely editable PowerPoint presentation and is available for immediate download. Download now and impress your audience.
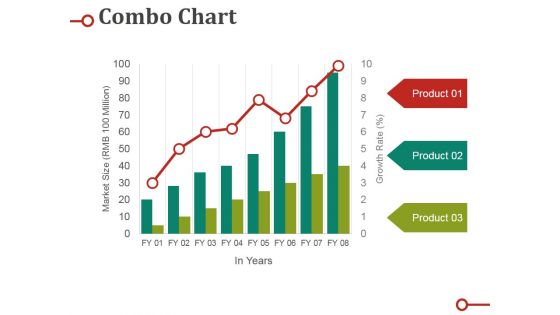
Combo Chart Ppt PowerPoint Presentation Gallery Sample
This is a combo chart ppt powerpoint presentation gallery sample. This is a three stage process. The stages in this process are market size, product, growth rate, bar, graph.
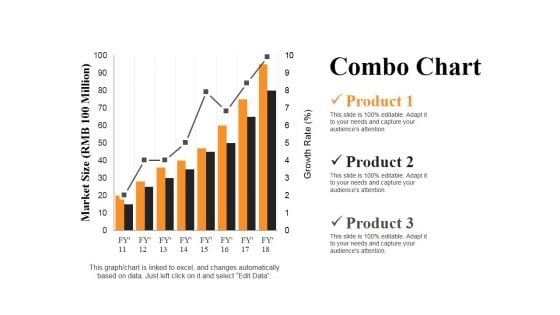
Combo Chart Ppt PowerPoint Presentation Summary Slides
This is a combo chart ppt powerpoint presentation summary slides. This is a three stage process. The stages in this process are market size, product, growth rate, bar graph, success.
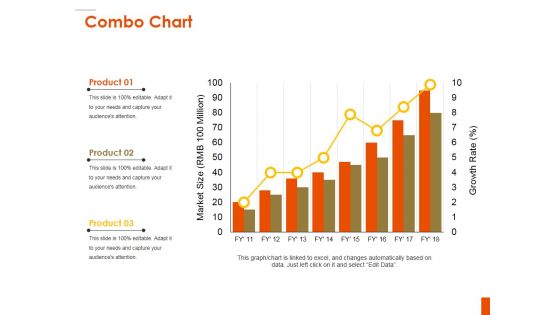
Combo Chart Ppt PowerPoint Presentation Inspiration Background
This is a combo chart ppt powerpoint presentation inspiration background. This is a three stage process. The stages in this process are product, bar graph, market size, growth, growth rate.
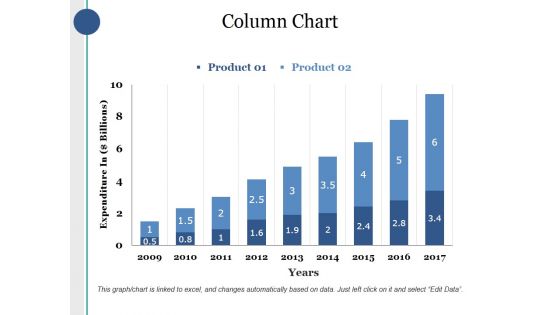
Column Chart Ppt PowerPoint Presentation Infographics Deck
This is a column chart ppt powerpoint presentation infographics deck. This is a two stage process. The stages in this process are product, expenditure in, years, bar graph, growth.
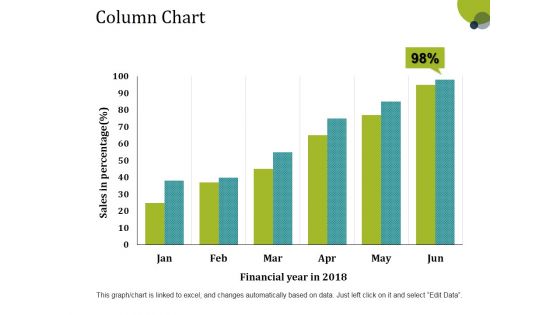
Column Chart Ppt PowerPoint Presentation Layouts Tips
This is a column chart ppt powerpoint presentation layouts tips. This is a six stage process. The stages in this process are sales in percentage, financial year, bar graph, growth, success.
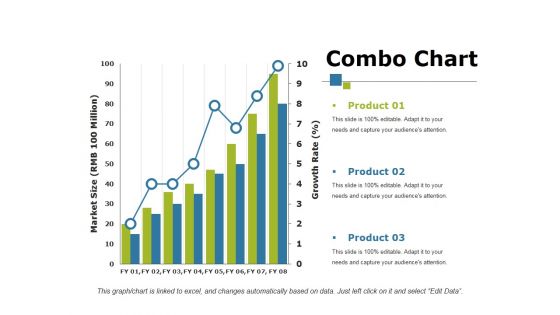
Combo Chart Ppt PowerPoint Presentation Show Influencers
This is a combo chart ppt powerpoint presentation show influencers. This is a three stage process. The stages in this process are product, bar graph, growth, growth rate, market size.
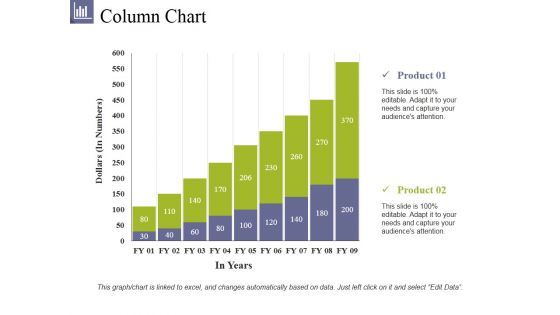
Column Chart Ppt PowerPoint Presentation File Summary
This is a column chart ppt powerpoint presentation file summary. This is a two stage process. The stages in this process are product, dollars, in years, bar graph, growth.
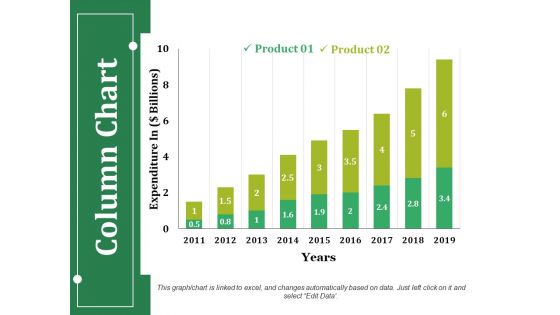
Column Chart Ppt PowerPoint Presentation Infographics Guidelines
This is a column chart ppt powerpoint presentation infographics guidelines. This is a two stage process. The stages in this process are product, expenditure in, years, business, bar graph.
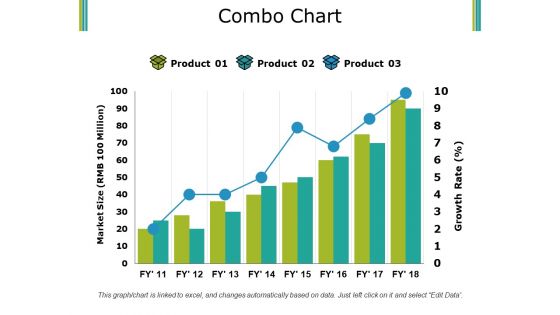
Combo Chart Ppt PowerPoint Presentation Pictures Summary
This is a combo chart ppt powerpoint presentation pictures summary. This is a three stage process. The stages in this process are product, market size, growth rate, bar graph, success.
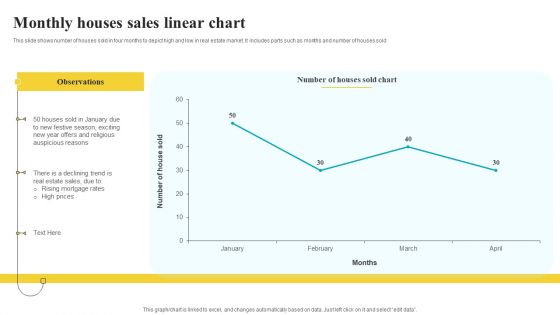
Monthly Houses Sales Linear Chart Pictures PDF
This slide shows number of houses sold in four months to depict high and low in real estate market. It includes parts such as months and number of houses sold Pitch your topic with ease and precision using this Monthly Houses Sales Linear Chart Pictures PDF. This layout presents information on Observations, Auspicious Reasons, Sales Linear Chart. It is also available for immediate download and adjustment. So, changes can be made in the color, design, graphics or any other component to create a unique layout.
Bar Chart Ppt PowerPoint Presentation Icon Diagrams
This is a bar chart ppt powerpoint presentation icon diagrams. This is a two stage process. The stages in this process are bar chart, finance, analysis, business, marketing, strategy.
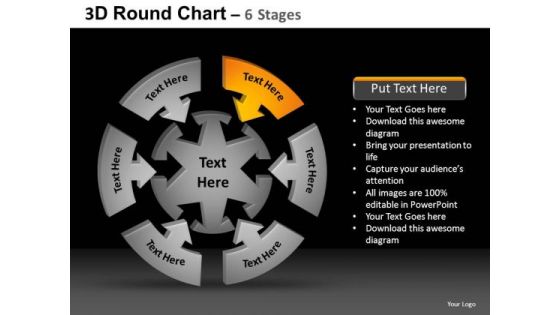
PowerPoint Slidelayout Leadership Round Chart Ppt Theme
PowerPoint Slidelayout Leadership Round Chart PPT Theme-These high quality powerpoint pre-designed slides and powerpoint templates have been carefully created by our professional team to help you impress your audience. All slides have been created and are 100% editable in powerpoint. Each and every property of any graphic - color, size, orientation, shading, outline etc. can be modified to help you build an effective powerpoint presentation. Any text can be entered at any point in the powerpoint template or slide. Simply DOWNLOAD, TYPE and PRESENT! Do not let complacency set in. Our PowerPoint Slidelayout Leadership Round Chart Ppt Theme will assist you in raising the bar.
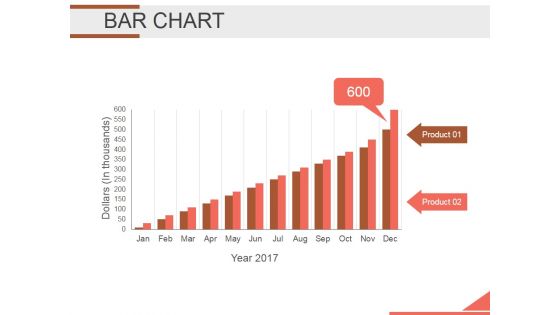
Bar Chart Ppt PowerPoint Presentation Background Designs
This is a bar chart ppt powerpoint presentation background designs. This is a twelve stage process. The stages in this process are bar graph, finance, marketing, strategy, analysis, investment.
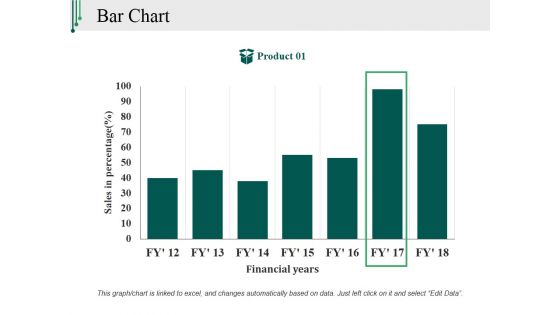
Bar Chart Ppt PowerPoint Presentation Outline Backgrounds
This is a bar chart ppt powerpoint presentation outline backgrounds. This is a one stage process. The stages in this process are sales in percentage, financial years, product, bar graph, finance.
Bar Arrow Chart PowerPoint Icon C
business bar chart with arrows isolated on a white background. Erase all ambiguity with our Bar Arrow Chart PowerPoint Icon C. They will put your point across in a decisive way.
Bar Chart Ppt PowerPoint Presentation Icon Demonstration
This is a bar chart ppt powerpoint presentation icon demonstration. This is a seven stage process. The stages in this process are product, sales in percentage, financial year, graph.
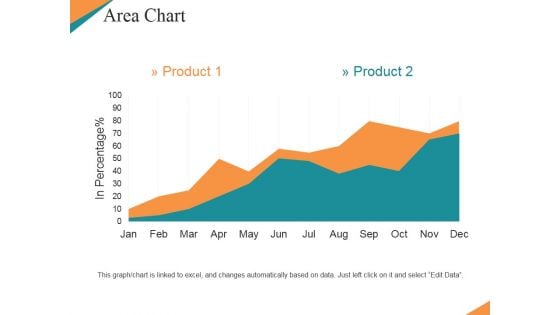
Area Chart Ppt PowerPoint Presentation Summary Templates
This is a area chart ppt powerpoint presentation summary templates. This is a two stage process. The stages in this process are product, in percentage, bar graph, growth, business.
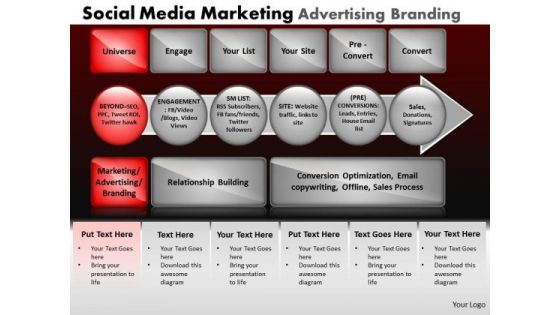
PowerPoint Process Chart Social Media Ppt Layout
PowerPoint Process Chart social media PPT Layout-These high quality powerpoint pre-designed slides and powerpoint templates have been carefully created by our professional team to help you impress your audience. All slides have been created and are 100% editable in powerpoint. Each and every property of any graphic - color, size, orientation, shading, outline etc. can be modified to help you build an effective powerpoint presentation. Any text can be entered at any point in the powerpoint template or slide. Simply DOWNLOAD, TYPE and PRESENT! Do not let complacency set in. Our PowerPoint Process Chart Social Media Ppt Layout will assist you in raising the bar.
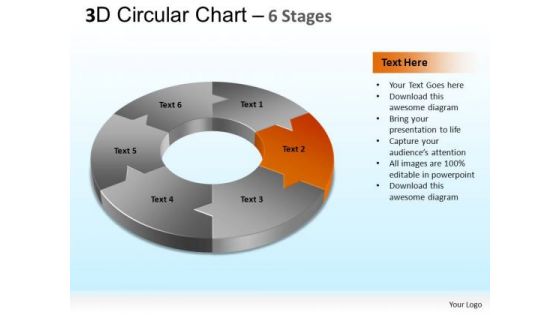
PowerPoint Slides Strategy Circular Chart Ppt Backgrounds
PowerPoint Slides Strategy circular chart PPT Backgrounds Business Power Points-. The Circle of Life - a concept emmbedded in our minds and hence easy to comprehend. Life and Business is made up of processes comprising stages that flow from one to another. An excellent graphic to attract the attention of and understanding by your audience to improve earnings.-These amazing PowerPoint pre-designed slides and PowerPoint templates have been carefully created by our team of experts to help you impress your audience. Our stunning collection of Powerpoint slides are 100% editable and can easily fit in any PowerPoint presentations. By using these animations and graphics in PowerPoint and you can easily make professional presentations. Any text can be entered at any point in the PowerPoint template or slide. Just DOWNLOAD our awesome PowerPoint templates and you are ready to go. Set an example with your views. Place the bar with our PowerPoint Slides Strategy Circular Chart Ppt Backgrounds.
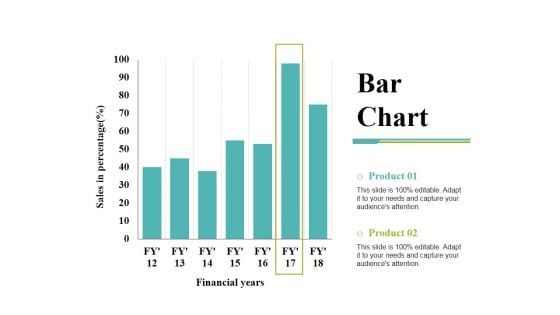
Bar Chart Ppt PowerPoint Presentation Inspiration Demonstration
This is a bar chart ppt powerpoint presentation inspiration demonstration. This is a two stage process. The stages in this process are bar chart, financial years, sales in percentage, product, finance.
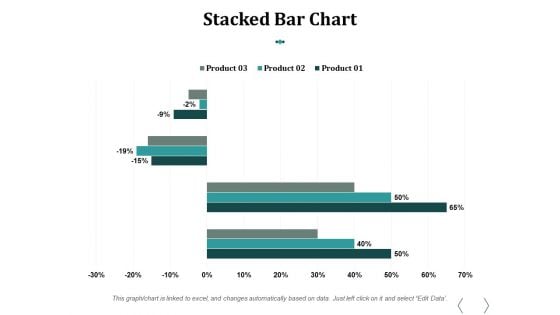
Stacked Bar Chart Ppt PowerPoint Presentation Influencers
This is a stacked bar chart ppt powerpoint presentation influencers. This is a three stage process. The stages in this process are stacked bar chart, product, percentage, finance, business.
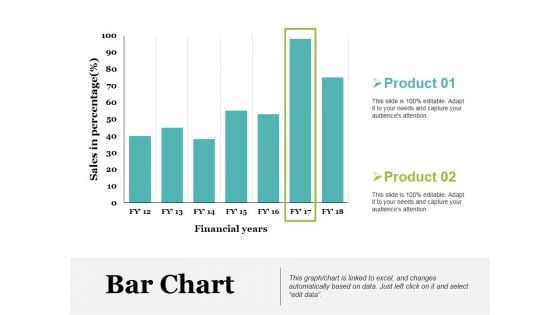
Bar Chart Ppt PowerPoint Presentation Model Picture
This is a bar chart ppt powerpoint presentation model picture. This is a two stage process. The stages in this process are product, sales in percentage, financial years, bar chart.
Column Chart Ppt PowerPoint Presentation Icon Show
This is a column chart ppt powerpoint presentation icon show. This is a two stage process. The stages in this process are column chart, product, years, bar graph, growth.
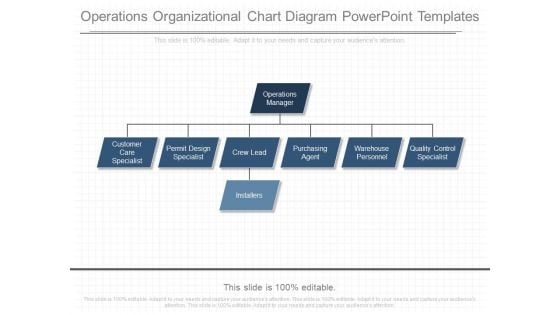
Operations Organizational Chart Diagram Powerpoint Templates
This is a operations organizational chart diagram powerpoint templates. This is a eight stage process. The stages in this process are operations manager, customer care specialist, permit design specialist, crew lead, purchasing agent, warehouse personnel, quality control specialist, installers.\n\n
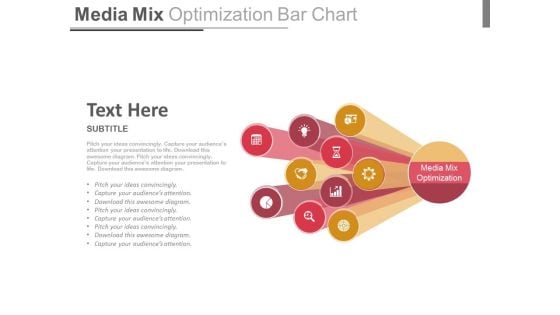
Media Mix Optimization Bar Chart Ppt Slides
This is a media mix optimization bar chart ppt slides. This is a one stage process. The stages in this process are business, media, success.


 Continue with Email

 Home
Home


