Line Chart

Pareto Chart Ppt PowerPoint Presentation Ideas
This is a pareto chart ppt powerpoint presentation ideas. This is a four stage process. The stages in this process are bar graph, finance, marketing, strategy, analysis, business.
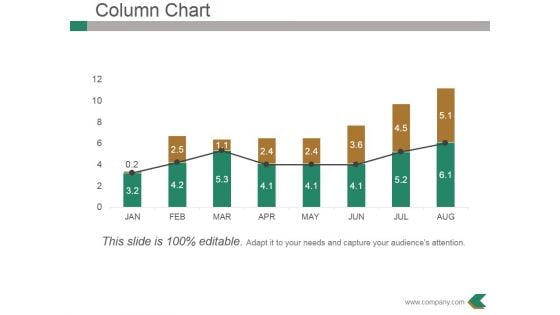
Column Chart Ppt PowerPoint Presentation Professional Example
This is a column chart ppt powerpoint presentation professional example. This is a eight stage process. The stages in this process are bar graph, growth, success, business, marketing.
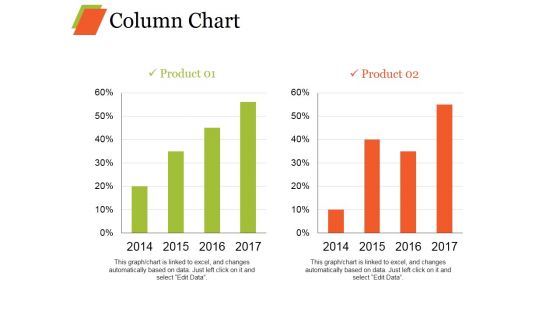
Column Chart Ppt PowerPoint Presentation Infographics Model
This is a column chart ppt powerpoint presentation infographics model. This is a two stage process. The stages in this process are bar graph, growth, product, percentage, year.
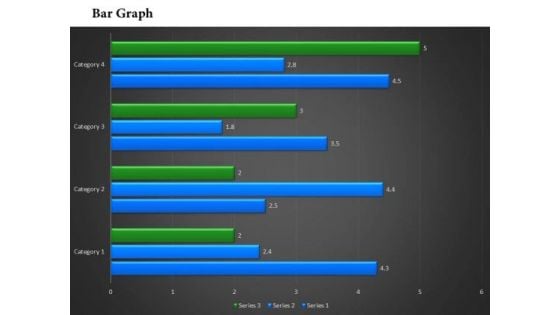
Business Framework Bar Chart In PowerPoint Presentation
This power point diagram slide has been designed with graphic of bar chart. In this diagram slide we have used green and blue colored vertical bar graph. Display result analysis with this bar graph diagram and use it in your result verification and analysis related presentations.
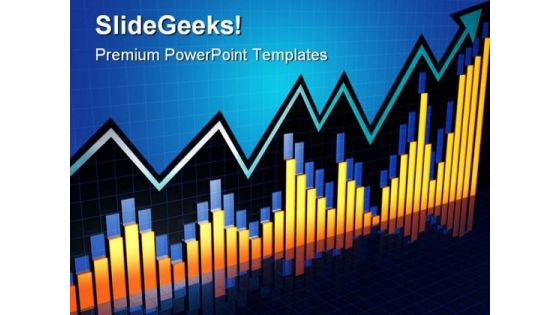
Chart Growth Business PowerPoint Template 0910
Arrow pointing to the higher financial chart bar 3d illustration Enter onto your new path with our Chart Growth Business PowerPoint Template 0910. Your thoughts will make a solid beginning.
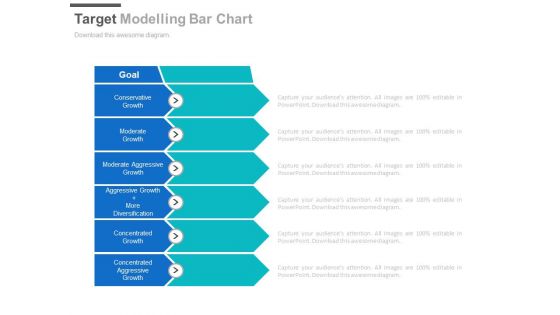
Target Modelling Bar Chart Ppt Slides
This is a target modelling bar chart ppt slides. This is a six stage process. The stages in this process are arrows, business, success.
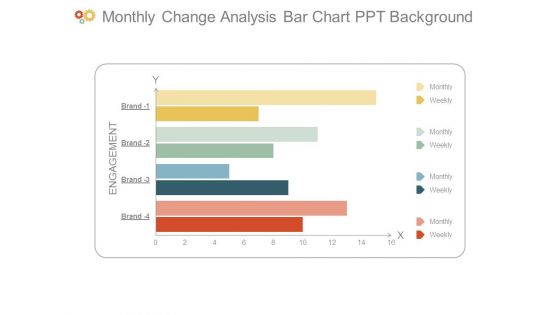
Monthly Change Analysis Bar Chart Ppt Background
This is a monthly change analysis bar chart ppt background. This is a four stage process. The stages in this process are engagement, monthly, weekly, brand.
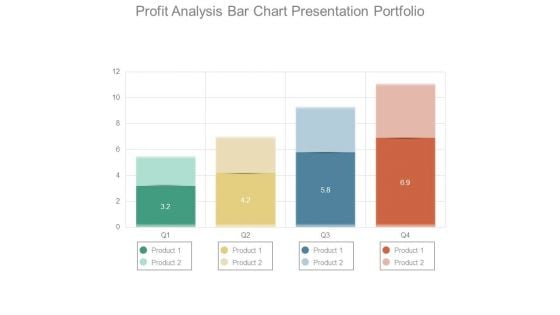
Profit Analysis Bar Chart Presentation Portfolio
This is a profit analysis bar chart presentation portfolio. This is a four stage process. The stages in this process are product.
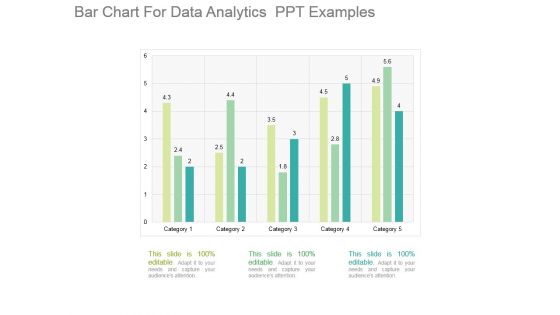
Bar Chart For Data Analytics Ppt Examples
This is a bar chart for data analytics ppt examples. This is a five stage process. The stages in this process are category.
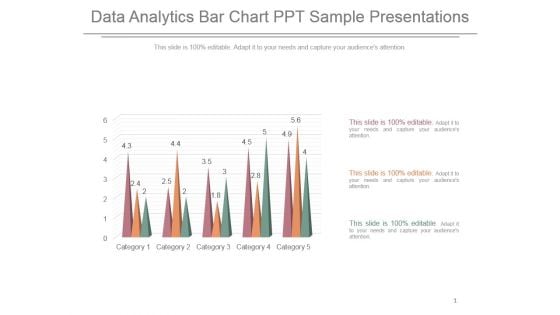
Data Analytics Bar Chart Ppt Sample Presentations
This is a data analytics bar chart ppt sample presentations. This is a five stage process. The stages in this process are category.
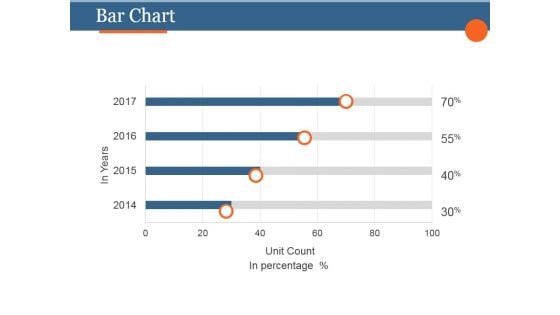
Bar Chart Ppt PowerPoint Presentation Layouts
This is a bar chart ppt powerpoint presentation layouts. This is a four stage process. The stages in this process are business, strategy, marketing, analysis, finance.

Bar Chart Ppt PowerPoint Presentation File Skills
This is a bar chart ppt powerpoint presentation file skills. This is a nine stage process. The stages in this process are business, marketing, growth, finance, management.
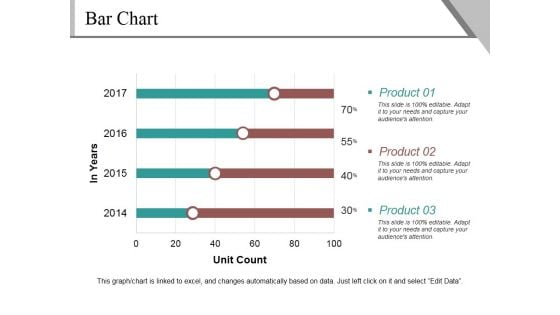
Bar Chart Ppt PowerPoint Presentation Summary Pictures
This is a bar chart ppt powerpoint presentation summary pictures. This is a four stage process. The stages in this process are product, unit count, finance, percentage, business.
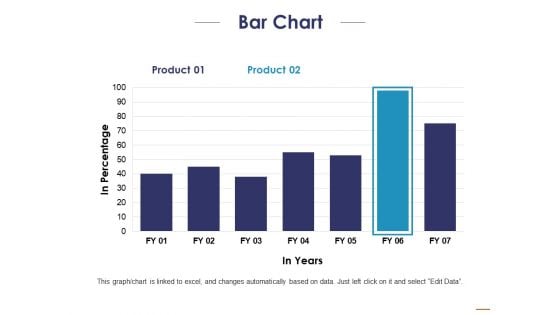
Bar Chart Ppt PowerPoint Presentation Portfolio Inspiration
This is a bar chart ppt powerpoint presentation portfolio inspiration. This is a two stage process. The stages in this process are product, in percentage, in years.
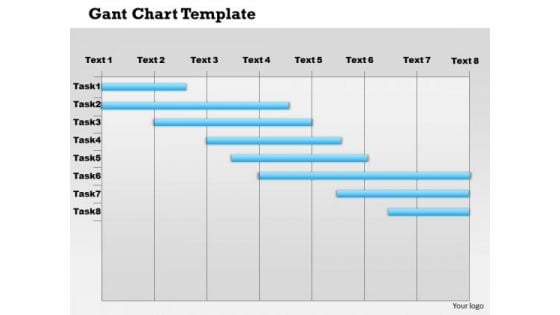
Business Framework Gantt Chart PowerPoint Presentation
A Gantt chart is a type of bar chart, that illustrates a project schedule. Gantt charts illustrate the start and finish dates of the terminal elements and summary elements of a project. Terminal elements and summary elements comprise the work breakdown structure of the project. Use this image slide to depict project management in your presentations.
Bar Chart Business PowerPoint Template 0810
3D illustration of a colorful multi-segment bar chart over top of a light blue textured background with plenty of open space for your text Grab the chance to use our Bar Chart Business PowerPoint Template 0810. Dip your hand in the lucky basket.
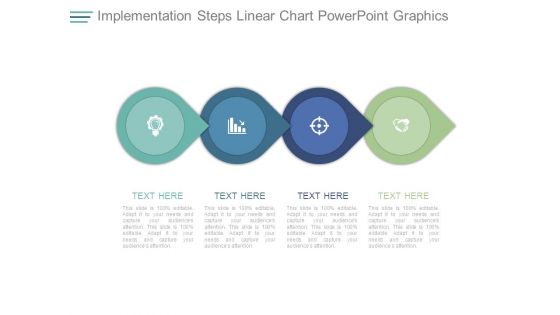
Implementation Steps Linear Chart Powerpoint Graphics
This is a implementation steps linear chart powerpoint graphics. This is a four stage process. The stages in this process are business, marketing, icons, strategy, management.
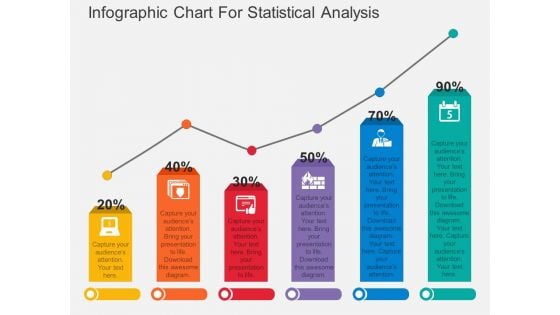
Infographic Chart For Statistical Analysis Powerpoint Template
Download this exclusive business diagram to display statistical analysis. This PowerPoint template contains bar chart with percentage values. This diagram is useful for business presentations.
Bar Chart Ppt PowerPoint Presentation Portfolio Icons
This is a bar chart ppt powerpoint presentation portfolio icons. This is a seven stage process. The stages in this process are in years, in percentage, finance, business marketing.
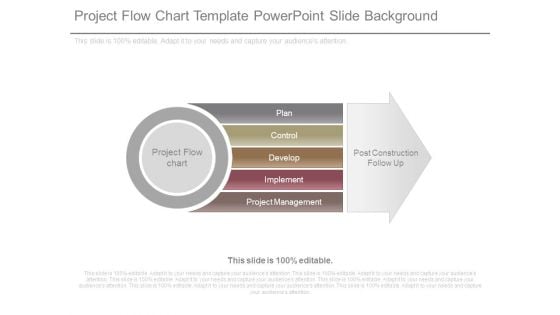
Project Flow Chart Template Powerpoint Slide Background
This is a project flow chart template powerpoint slide background. This is a five stage process. The stages in this process are project flow chart, plan, control, develop, implement, project management, post construction follow up.

Ppt Linear Chart 7 Stages5 PowerPoint Templates
PPT linear chart 7 stages5 PowerPoint Templates-Use this 3d Arrow PPT slide to show the sequence of events in a story or describe the steps to be taken in a process. This image has been conceived to enable you to emphatically communicate your ideas in Counsel teams with our Ppt Linear Chart 7 Stages5 PowerPoint Templates. Download without worries with our money back guaranteee.
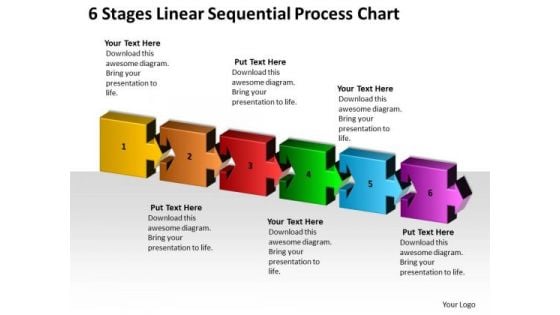
Timeline 6 Stages Linear Sequential Process Chart
Our great team has conjured up a web of Timeline 6 Stages Linear Sequential Process Chart. Use them to string together your glistening ideas.Think of it and be sure we have it. Our Timeline 6 Stages Linear Sequential Process Chart offer you the widest possible range of options.
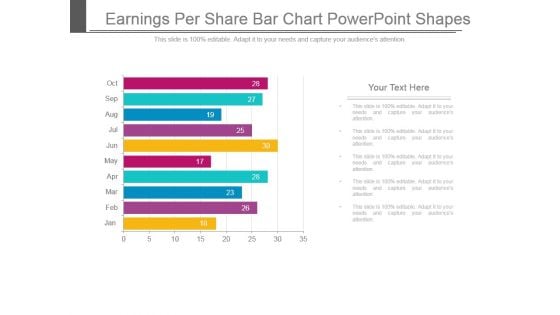
Earnings Per Share Bar Chart Powerpoint Shapes
This is a earnings per share bar chart powerpoint shapes. This is a ten stage process. The stages in this process are jan, feb, mar, apr, may, jun, jul, aug, sep, oct.
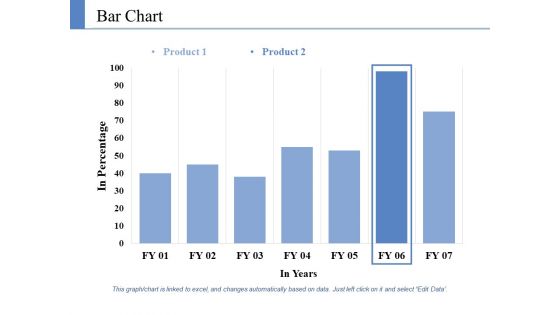
Bar Chart Ppt PowerPoint Presentation Ideas Deck
This is a bar chart ppt powerpoint presentation ideas deck. This is a two stage process. The stages in this process are product, in percentage, in years, financial, business.
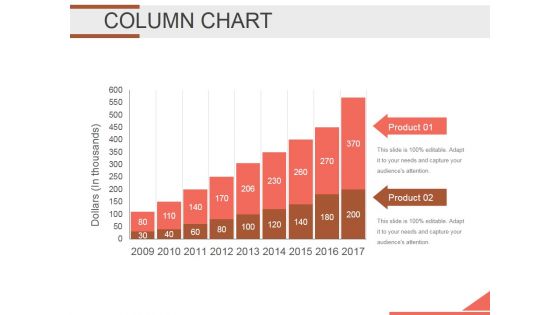
Column Chart Ppt PowerPoint Presentation Background Designs
This is a column chart ppt powerpoint presentation background designs. This is a two stage process. The stages in this process are bar graph, finance, marketing, strategy, analysis, business.
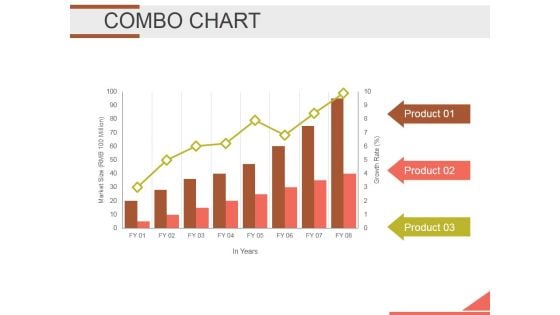
Combo Chart Ppt PowerPoint Presentation Infographics Infographics
This is a combo chart ppt powerpoint presentation infographics infographics. This is a three stage process. The stages in this process are bar graph, growth, finance, marketing, strategy, business.
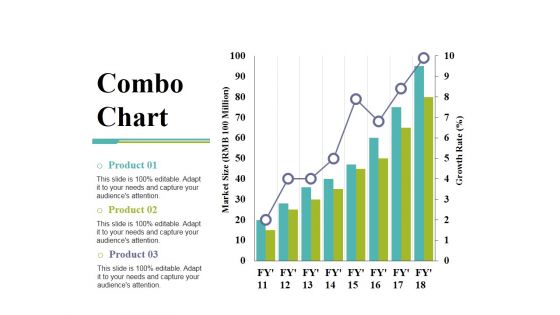
Combo Chart Ppt PowerPoint Presentation Show Deck
This is a combo chart ppt powerpoint presentation show deck. This is a three stage process. The stages in this process are growth rate, market size, product, bar graph, growth.
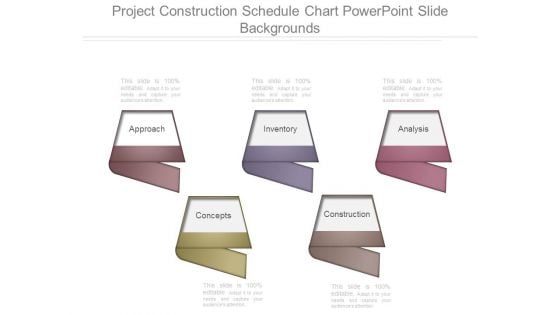
Project Construction Schedule Chart Powerpoint Slide Backgrounds
This is a project construction schedule chart powerpoint slide backgrounds. This is a five stage process. The stages in this process are approach, inventory, analysis, construction, concepts.
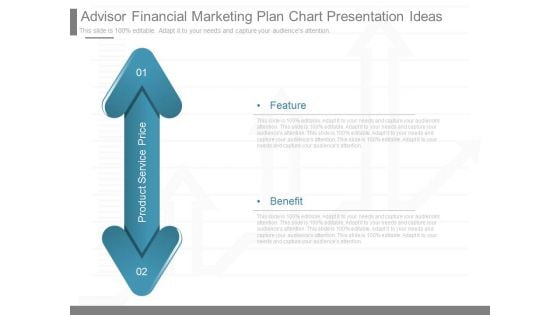
Advisor Financial Marketing Plan Chart Presentation Ideas
This is a advisor financial marketing plan chart presentation ideas. This is a two stage process. The stages in this process are product service price, feature, benefit.
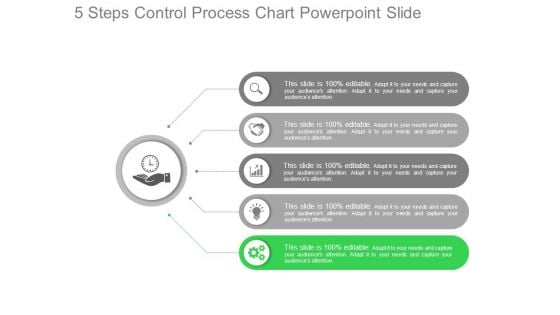
5 Steps Control Process Chart Powerpoint Slide
This is a 5 steps control process chart powerpoint slide. This is a five stage process. The stages in this process are business, marketing, icons, strategy.
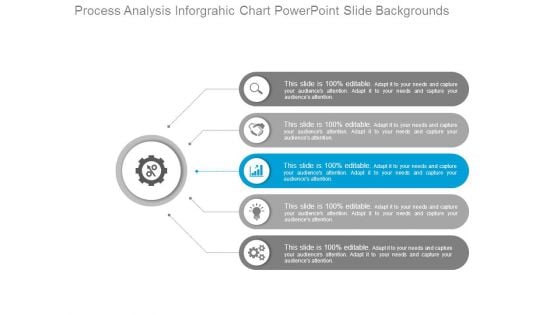
Process Analysis Inforgrahic Chart Powerpoint Slide Backgrounds
This is a process analysis inforgrahic chart powerpoint slide backgrounds. This is a five stage process. The stages in this process are customer business, marketing, icons, strategy.

Organizational Design And Structure Chart Powerpoint Images
This is a organizational design and structure chart powerpoint images. This is a five stage process. The stages in this process are strategy, structure, rewards, people, processes.
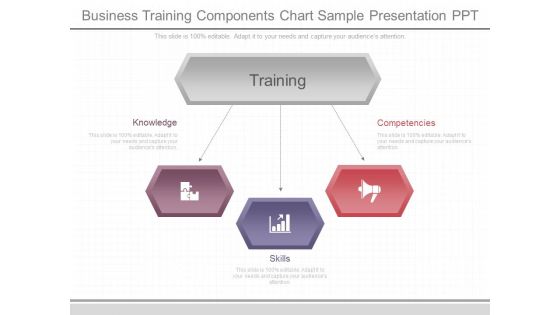
Business Training Components Chart Sample Presentation Ppt
This is a business training components chart sample presentation ppt. This is a three stage process. The stages in this process are training, knowledge, skills, competencies.
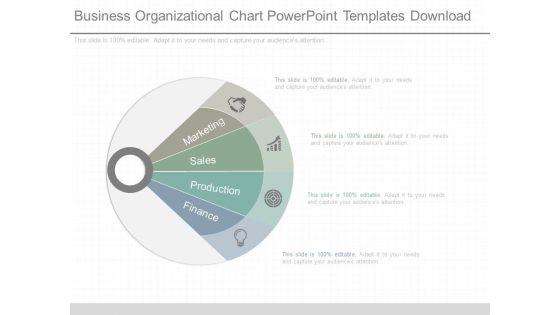
Business Organizational Chart Powerpoint Templates Download
This is a business organizational chart powerpoint templates download. This is a four stage process. The stages in this process are marketing, sales, production, finance.
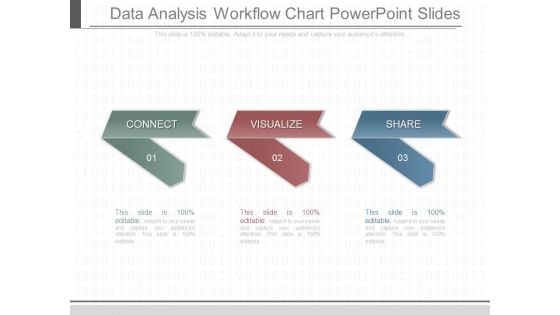
Data Analysis Workflow Chart Powerpoint Slides
This is a data analysis workflow chart powerpoint slides. This is a three stage process. The stages in this process are connect, visualize, share.
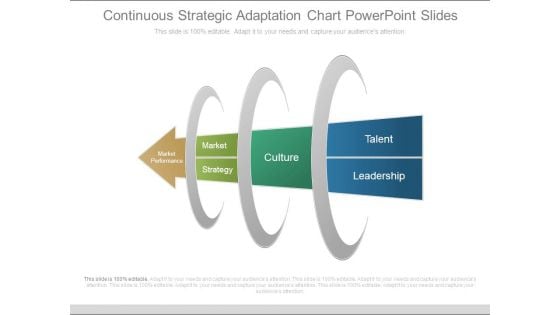
Continuous Strategic Adaptation Chart Powerpoint Slides
This is a continuous strategic adaptation chart powerpoint slides. This is a four stage process. The stages in this process are market performance, market, strategy, culture, talent, leadership.
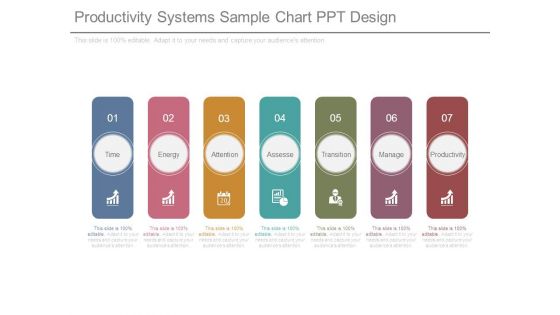
Productivity Systems Sample Chart Ppt Design
This is a productivity systems sample chart ppt design. This is a seven stage process. The stages in this process are time, energy, attention, assesse, transition, manage, productivity.

Economic Order Quantity Chart Ppt Example File
This is a economic order quantity chart ppt example file. This is a four stage process. The stages in this process are inventory cost, ordering, carrying, eoq model.
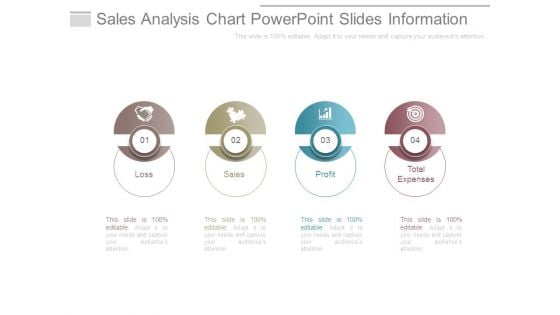
Sales Analysis Chart Powerpoint Slides Information
This is a sales analysis chart powerpoint slides information. This is a four stage process. The stages in this process are loss, sales, profit, total expenses.
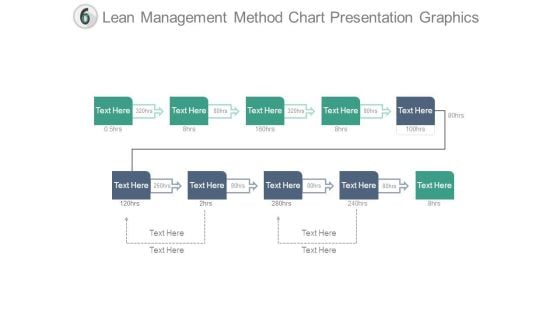
Lean Management Method Chart Presentation Graphics
This is a lean management method chart presentation graphics. This is a ten stage process. The stages in this process are management, presentation, analysis, strategy, business.
Process Structure Chart Sample Of Ppt Presentation
This is a process structure chart sample of ppt presentation. This is a five stage process. The stages in this process are business, management, process, marketing, cyclic.
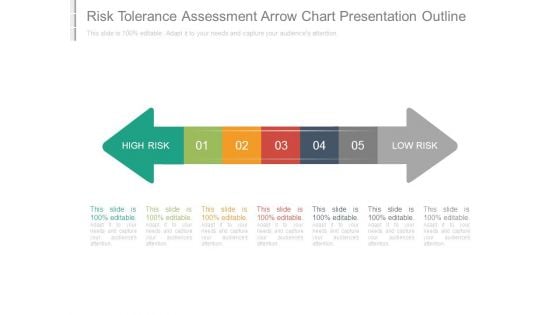
Risk Tolerance Assessment Arrow Chart Presentation Outline
This is a risk tolerance assessment arrow chart presentation outline. This is a five stage process. The stages in this process are high risk, low risk.
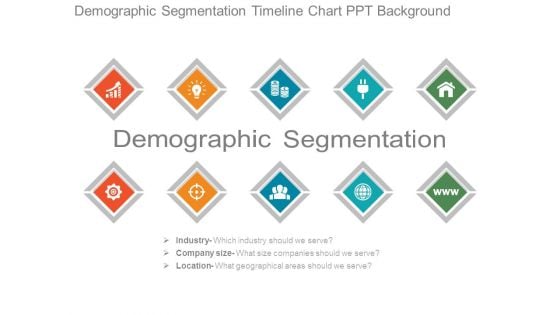
Demographic Segmentation Timeline Chart Ppt Background
This is a demographic segmentation timeline chart ppt background. This is a five stage process. The stages in this process are industry, company size, location.
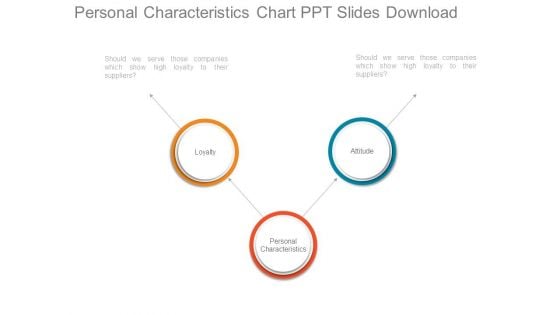
Personal Characteristics Chart Ppt Slides Download
This is a personal characteristics chart ppt slides download. This is a two stage process. The stages in this process are loyalty, attitude, personal characteristics.
Pie Chart Ppt PowerPoint Presentation Layouts Icons
This is a pie chart ppt powerpoint presentation layouts icons. This is a three stage process. The stages in this process are business, finance, analysis, marketing, strategy.
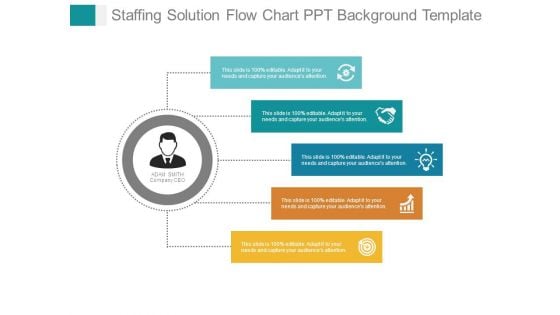
Staffing Solution Flow Chart Ppt Background Template
This is a staffing solution flow chart ppt background template. This is a five stage process. The stages in this process are business, success, strategy, management, icons.
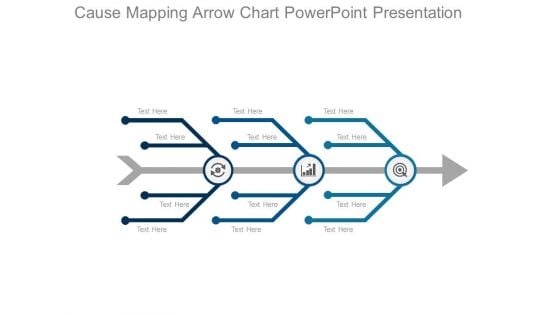
Cause Mapping Arrow Chart Powerpoint Presentation
This is a cause mapping arrow chart powerpoint presentation. This is a three stage process. The stages in this process are arrows, icons, business, marketing, management.
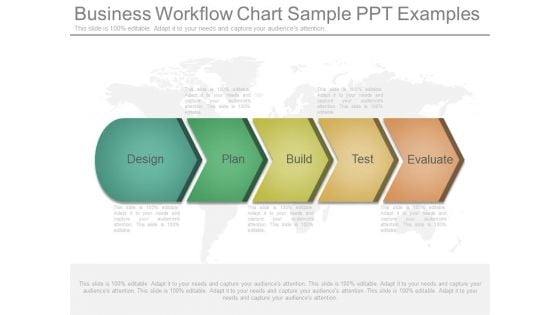
Business Workflow Chart Sample Ppt Examples
This is a business workflow chart sample ppt examples. This is a five stage process. The stages in this process are design, plan, build, test, evaluate.
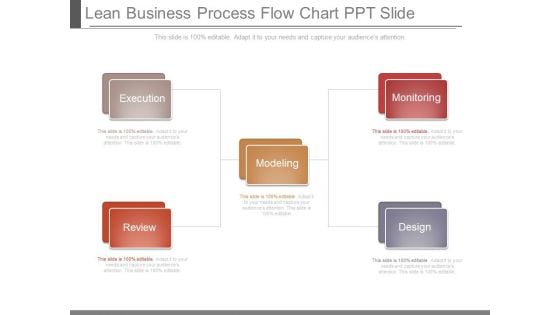
Lean Business Process Flow Chart Ppt Slide
This is a lean business process flow chart ppt slide. This is a five stage process. The stages in this process are execution, review, modeling, design, monitoring.
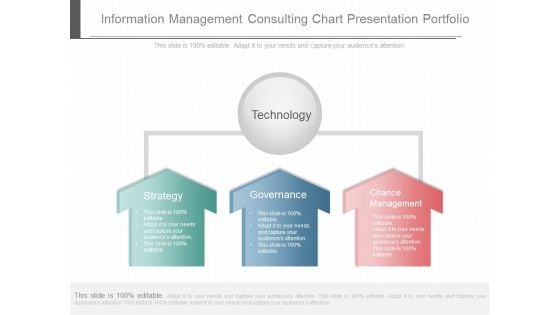
Information Management Consulting Chart Presentation Portfolio
This is a information management consulting chart presentation portfolio. This is a three stage process. The stages in this process are technology, strategy, governance, chance management.

Value Production Flow Chart Presentation Powerpoint
This is a value production flow chart presentation powerpoint. This is a three stage process. The stages in this process are value production, cost, revenue, profit.
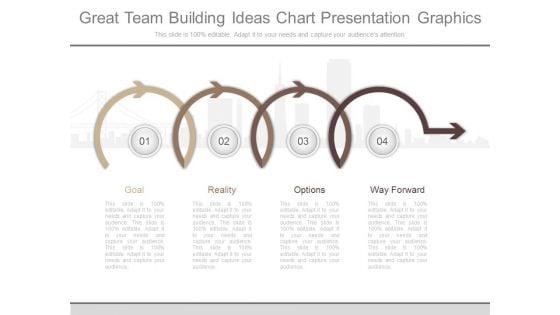
Great Team Building Ideas Chart Presentation Graphics
This is a great team building ideas chart presentation graphics. This is a four stage process. The stages in this process are goal, reality, options, way forward.
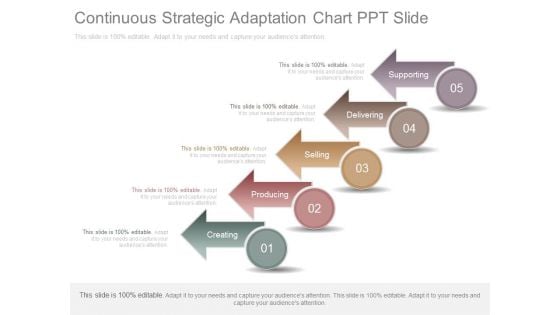
Continuous Strategic Adaptation Chart Ppt Slide
This is a continuous strategic adaptation chart ppt slide. This is a five stage process. The stages in this process are creating, producing, selling, delivering, supporting.
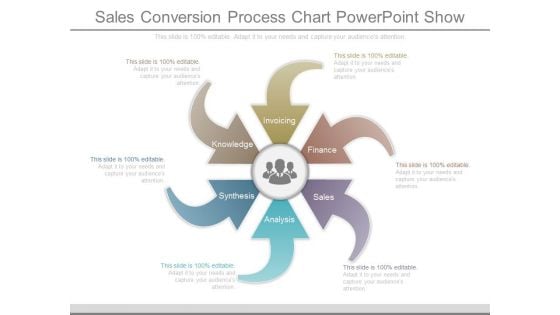
Sales Conversion Process Chart Powerpoint Show
This is a sales conversion process chart powerpoint show. This is a six stage process. The stages in this process are invoicing, finance, sales, analysis, synthesis, knowledge.
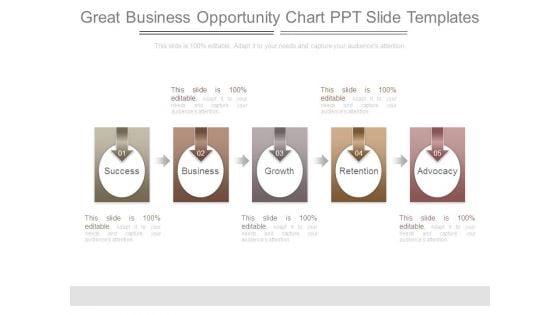
Great Business Opportunity Chart Ppt Slide Templates
This is a great business opportunity chart ppt slide templates. This is a five stage process. The stages in this process are success, business, growth, retention, advocacy.
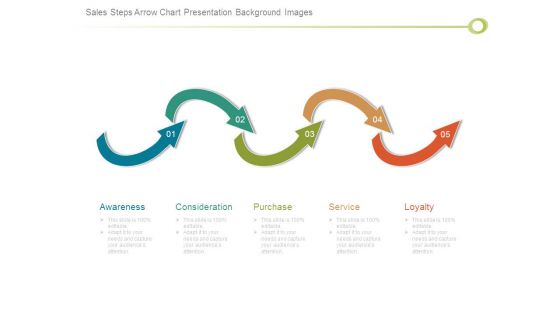
Sales Steps Arrow Chart Presentation Background Images
This is a sales steps arrow chart presentation background images. This is a five stage process. The stages in this process are awareness, consideration, purchase, service, loyalty.
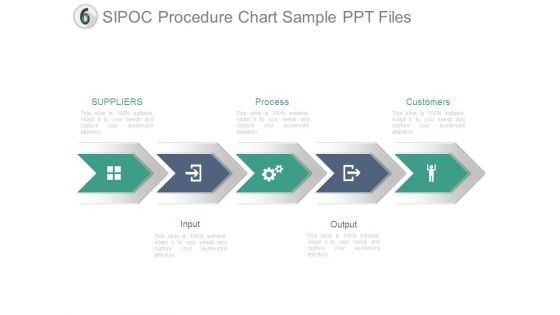
Sipoc Procedure Chart Sample Ppt Files
This is a sipoc procedure chart sample ppt files. This is a five stage process. The stages in this process are suppliers, process, customers, input, output.
Three Arrows Voc Chart Powerpoint Presentation Examples
This is a three arrows voc chart powerpoint presentation examples. This is a three stage process. The stages in this process are business, management, marketing, arrow, strategy.
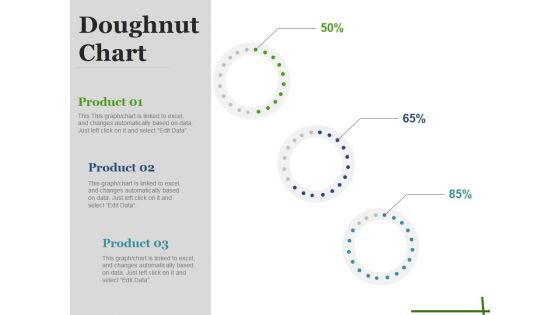
Doughnut Chart Ppt PowerPoint Presentation Styles Backgrounds
This is a doughnut chart ppt powerpoint presentation styles backgrounds. This is a three stage process. The stages in this process are percentage, finance, business, marketing, strategy.
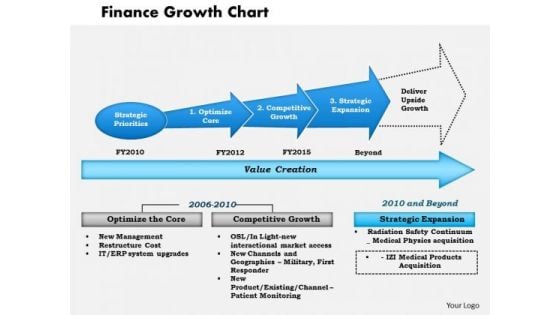
Business Framework Finance Growth Chart PowerPoint Presentation
This business framework PPT diagram has been crafted with graphic of linear arrow diagram. This PPT diagram contains the linear flow chart. This PPT diagram may be used for business strategy and finance transformation.


 Continue with Email

 Home
Home


