Line Graph
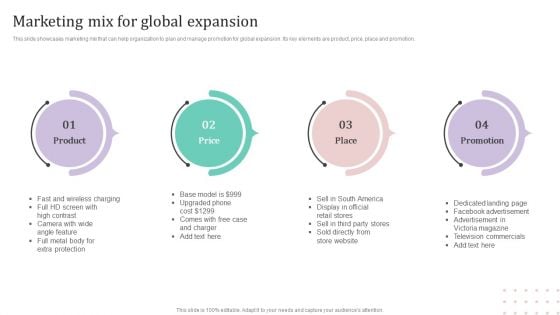
Marketing Mix For Global Expansion Ppt PowerPoint Presentation Diagram Graph Charts PDF
This slide showcases marketing mix that can help organization to plan and manage promotion for global expansion. Its key elements are product, price, place and promotion.If you are looking for a format to display your unique thoughts, then the professionally designed Marketing Mix For Global Expansion Ppt PowerPoint Presentation Diagram Graph Charts PDF is the one for you. You can use it as a Google Slides template or a PowerPoint template. Incorporate impressive visuals, symbols, images, and other charts. Modify or reorganize the text boxes as you desire. Experiment with shade schemes and font pairings. Alter, share or cooperate with other people on your work. Download Marketing Mix For Global Expansion Ppt PowerPoint Presentation Diagram Graph Charts PDF and find out how to give a successful presentation. Present a perfect display to your team and make your presentation unforgettable.
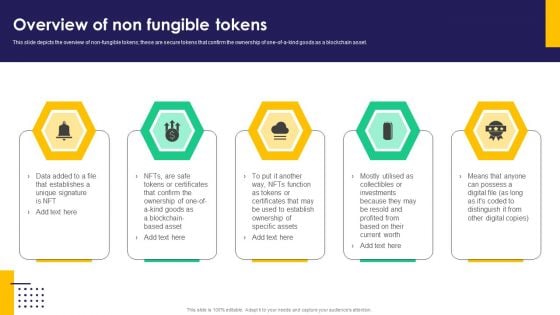
Overview Of Non Fungible Tokens Ppt PowerPoint Presentation Diagram Graph Charts PDF
This slide depicts the overview of non-fungible tokens these are secure tokens that confirm the ownership of one-of-a-kind goods as a blockchain asset. If you are looking for a format to display your unique thoughts, then the professionally designed Overview Of Non Fungible Tokens Ppt PowerPoint Presentation Diagram Graph Charts PDF is the one for you. You can use it as a Google Slides template or a PowerPoint template. Incorporate impressive visuals, symbols, images, and other charts. Modify or reorganize the text boxes as you desire. Experiment with shade schemes and font pairings. Alter, share or cooperate with other people on your work. Download Overview Of Non Fungible Tokens Ppt PowerPoint Presentation Diagram Graph Charts PDF and find out how to give a successful presentation. Present a perfect display to your team and make your presentation unforgettable.
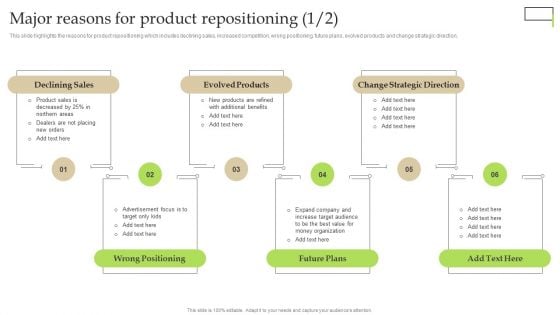
Major Reasons For Product Repositioning Ppt PowerPoint Presentation Diagram Graph Charts PDF
This slide highlights the reasons for product repositioning which includes declining sales, increased competition, wrong positioning, future plans, evolved products and change strategic direction. Do you have to make sure that everyone on your team knows about any specific topic I yes, then you should give Major Reasons For Product Repositioning Ppt PowerPoint Presentation Diagram Graph Charts PDF a try. Our experts have put a lot of knowledge and effort into creating this impeccable Major Reasons For Product Repositioning Ppt PowerPoint Presentation Diagram Graph Charts PDF. You can use this template for your upcoming presentations, as the slides are perfect to represent even the tiniest detail. You can download these templates from the Slidegeeks website and these are easy to edit. So grab these today
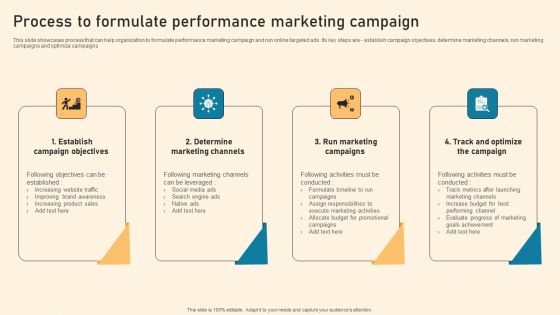
Process To Formulate Performance Marketing Campaign Ppt PowerPoint Presentation Diagram Graph Charts PDF
This slide showcases process that can help organization to formulate performance marketing campaign and run online targeted ads. Its key steps are - establish campaign objectives, determine marketing channels, run marketing campaigns and optimize campaigns Explore a selection of the finest Process To Formulate Performance Marketing Campaign Ppt PowerPoint Presentation Diagram Graph Charts PDF here. With a plethora of professionally designed and pre made slide templates, you can quickly and easily find the right one for your upcoming presentation. You can use our Process To Formulate Performance Marketing Campaign Ppt PowerPoint Presentation Diagram Graph Charts PDF to effectively convey your message to a wider audience. Slidegeeks has done a lot of research before preparing these presentation templates. The content can be personalized and the slides are highly editable. Grab templates today from Slidegeeks.

Key Texting And SMS Marketing Statistics Ppt PowerPoint Presentation Diagram Graph Charts PDF
This slide represents the statistical data to help marketers analyze the benefits and importance of SMS marketing for business growth and development. It includes key SMS marketing statistics such as click through rates, opt-ins etc. Get a simple yet stunning designed Key Texting And SMS Marketing Statistics Ppt PowerPoint Presentation Diagram Graph Charts PDF. It is the best one to establish the tone in your meetings. It is an excellent way to make your presentations highly effective. So, download this PPT today from Slidegeeks and see the positive impacts. Our easy to edit Key Texting And SMS Marketing Statistics Ppt PowerPoint Presentation Diagram Graph Charts PDF can be your go to option for all upcoming conferences and meetings. So, what are you waiting for Grab this template today.

Strategies And Tactics For Effective Growth Of Business Ppt PowerPoint Presentation Diagram Graph Charts PDF
Persuade your audience using this strategies and tactics for effective growth of business ppt powerpoint presentation diagram graph charts pdf. This PPT design covers three stages, thus making it a great tool to use. It also caters to a variety of topics including strategies and tactics for effective growth of business. Download this PPT design now to present a convincing pitch that not only emphasizes the topic but also showcases your presentation skills.
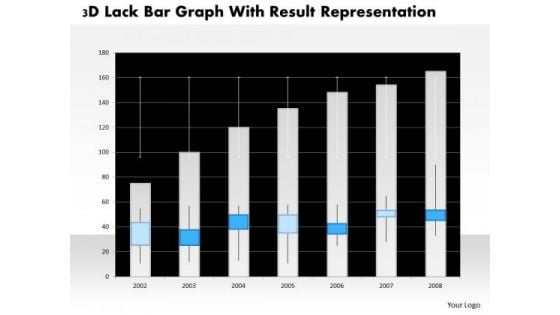
Business Diagram 3d Lack Bar Graph With Result Representation PowerPoint Slide
This business diagram has graphic of 3d lack bar graph. This diagram is a data visualization tool that gives you a simple way to present statistical information. This slide helps your audience examine and interpret the data you present.
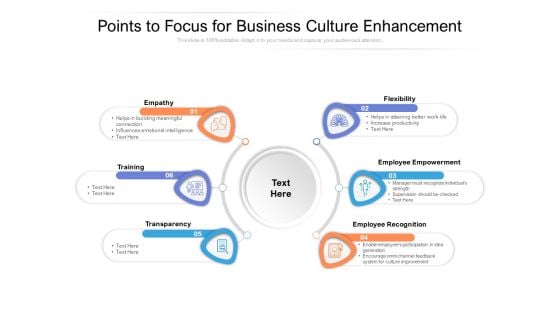
Points To Focus For Business Culture Enhancement Ppt PowerPoint Presentation Diagram Graph Charts PDF
Persuade your audience using this points to focus for business culture enhancement ppt powerpoint presentation diagram graph charts pdf. This PPT design covers six stages, thus making it a great tool to use. It also caters to a variety of topics including empathy, training, transparency, flexibility, employee empowerment, employee recognition. Download this PPT design now to present a convincing pitch that not only emphasizes the topic but also showcases your presentation skills.
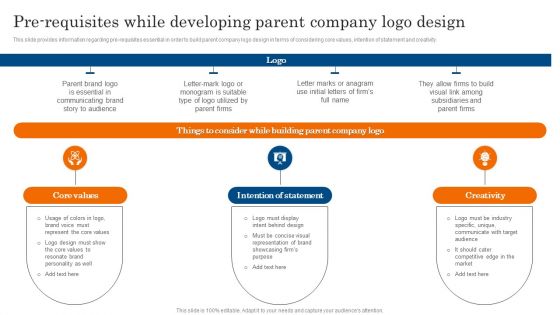
Pre Requisites While Developing Parent Company Logo Design Ppt PowerPoint Presentation Diagram Graph Charts PDF
This slide provides information regarding pre requisites essential in order to build parent company logo design in terms of considering core values, intention of statement and creativity. The Pre Requisites While Developing Parent Company Logo Design Ppt PowerPoint Presentation Diagram Graph Charts PDF is a compilation of the most recent design trends as a series of slides. It is suitable for any subject or industry presentation, containing attractive visuals and photo spots for businesses to clearly express their messages. This template contains a variety of slides for the user to input data, such as structures to contrast two elements, bullet points, and slides for written information. Slidegeeks is prepared to create an impression.
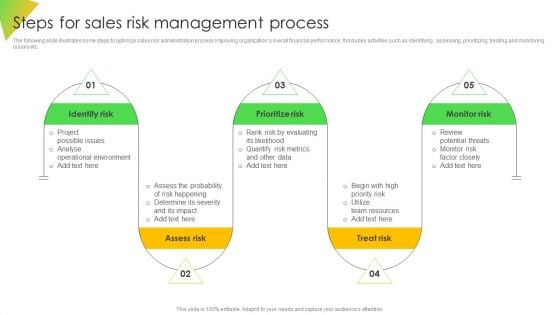
Steps For Sales Risk Management Process Ppt Diagram Graph Charts PDF
The following slide illustrates some steps to optimize sales risk administration process improving organizations overall financial performance. It includes activities such as identifying , assessing, prioritizing, treating and monitoring issues etc. The Steps For Sales Risk Management Process Ppt Diagram Graph Charts PDF is a compilation of the most recent design trends as a series of slides. It is suitable for any subject or industry presentation, containing attractive visuals and photo spots for businesses to clearly express their messages. This template contains a variety of slides for the user to input data, such as structures to contrast two elements, bullet points, and slides for written information. Slidegeeks is prepared to create an impression.
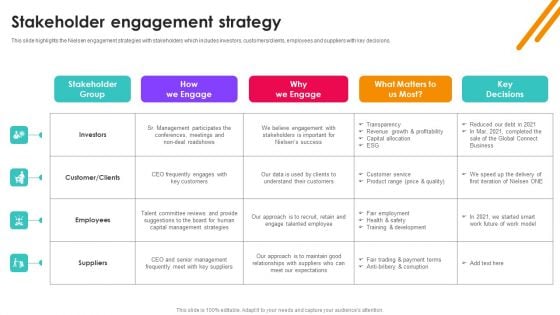
Nielsen Business Profile Stakeholder Engagement Strategy Ppt PowerPoint Presentation Diagram Graph Charts PDF
This slide highlights the Nielsen engagement strategies with stakeholders which includes investors, customers or clients, employees and suppliers with key decisions. The Nielsen Business Profile Stakeholder Engagement Strategy Ppt PowerPoint Presentation Diagram Graph Charts PDF is a compilation of the most recent design trends as a series of slides. It is suitable for any subject or industry presentation, containing attractive visuals and photo spots for businesses to clearly express their messages. This template contains a variety of slides for the user to input data, such as structures to contrast two elements, bullet points, and slides for written information. Slidegeeks is prepared to create an impression.
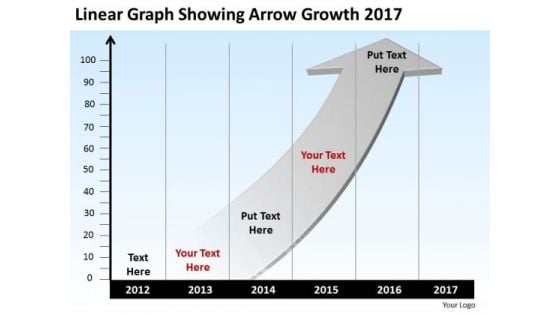
Linear Graph Showing Arrow Growth 2017 PowerPoint Templates Ppt Slides Graphics
We present our Linear Graph Showing Arrow Growth 2017 PowerPoint Templates PPT Slides Graphics.Use our Marketing PowerPoint Templates because Our PowerPoint Templates and Slides are like the strings of a tennis racquet. Well strung to help you serve aces. Download and present our Timelines PowerPoint Templates because Our PowerPoint Templates and Slides are a sure bet. Gauranteed to win against all odds. Present our Business PowerPoint Templates because Our PowerPoint Templates and Slides are truly out of this world. Even the MIB duo has been keeping tabs on our team. Use our Arrows PowerPoint Templates because You should Ascend the ladder of success with ease. Our PowerPoint Templates and Slides will provide strong and sturdy steps. Use our Time planning PowerPoint Templates because Our PowerPoint Templates and Slides are innately eco-friendly. Their high recall value negate the need for paper handouts.Use these PowerPoint slides for presentations relating to Art, Background, Button, Call, City, Colorful, Concept, Country, Destination, Editable, Flag, Fuel, Geography, Graphic, Home, Icon, Illustration, Journey, Land, Locate, Location, Macro, Map, Mapping, Mark, Navigate, Needle, Petrol, Pin, Pinpoint, Place, Pointing, Pump, Push, Pushpin, Restaurant, Road, Roadmap, Service, Set, Shiny, Space, Symbol, Town, Travel, Trip. The prominent colors used in the PowerPoint template are Gray, Black, Red. Clear out the confusion with your views. Expound on your decisions with our Linear Graph Showing Arrow Growth 2017 PowerPoint Templates Ppt Slides Graphics.
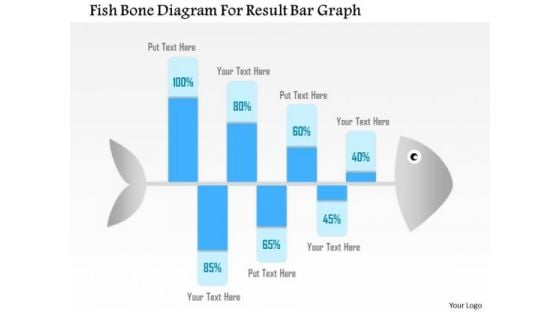
Business Diagram Fish Bone Diagram For Result Bar Graph Presentation Template
Graphic of fish bone has been used to design this Power Point template slide. This PPT slide contains the concept of problem analysis and root cause analysis. Use this PPT slide and display process of root cause analysis for any field. This PPT slide is very well designed for business and production related problem analysis.
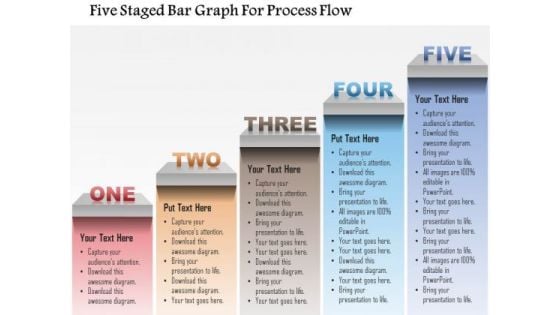
Busines Diagram Five Staged Bar Graph For Process Flow Presentation Template
This business diagram displays graphic of five staged business info graphics. This diagram is useful to display business growth steps. Add this image in your presentations to visually support your content and express your thoughts.

Business Diagram Data Driven Bar Graph And Pie Chart For Analysis PowerPoint Slide
This PowerPoint template displays technology gadgets with various business charts. Use this diagram slide, in your presentations to make business reports for statistical analysis. You may use this diagram to impart professional appearance to your presentations.
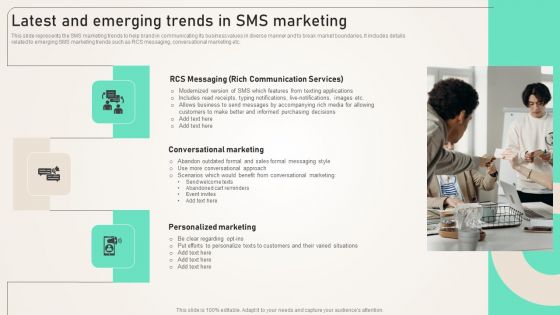
Latest And Emerging Trends In SMS Marketing Ppt PowerPoint Presentation Diagram Graph Charts PDF
This slide represents the SMS marketing trends to help brand in communicating its business values in diverse manner and to break market boundaries. It includes details related to emerging SMS marketing trends such as RCS messaging, conversational marketing etc. Present like a pro with Latest And Emerging Trends In SMS Marketing Ppt PowerPoint Presentation Diagram Graph Charts PDF Create beautiful presentations together with your team, using our easy to use presentation slides. Share your ideas in real time and make changes on the fly by downloading our templates. So whether you are in the office, on the go, or in a remote location, you can stay in sync with your team and present your ideas with confidence. With Slidegeeks presentation got a whole lot easier. Grab these presentations today.
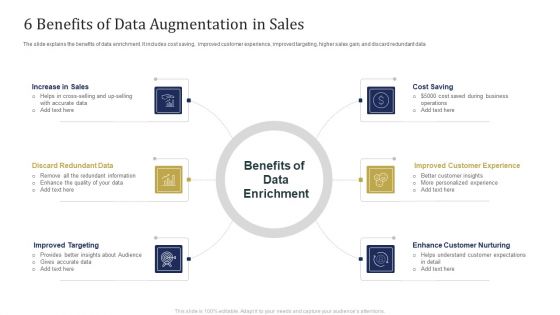
6 Benefits Of Data Augmentation In Sales Ppt Diagram Graph Charts PDF
The slide explains the benefits of data enrichment. It includes cost saving, improved customer experience, improved targeting, higher sales gain, and discard redundant data. Presenting 6 Benefits Of Data Augmentation In Sales Ppt Diagram Graph Charts PDF to dispense important information. This template comprises six stages. It also presents valuable insights into the topics including Discard Redundant Data, Improved Targeting, Enhance Customer Nurturing, Cost Saving. This is a completely customizable PowerPoint theme that can be put to use immediately. So, download it and address the topic impactfully.
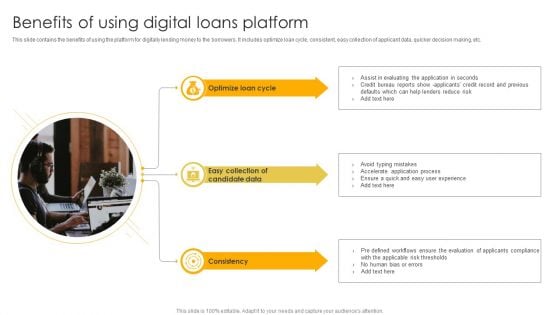
Benefits Of Using Digital Loans Platform Ppt Diagram Graph Charts PDF
This slide contains the benefits of using the platform for digitally lending money to the borrowers. It includes optimize loan cycle, consistent, easy collection of applicant data, quicker decision making, etc. Persuade your audience using this Benefits Of Using Digital Loans Platform Ppt Diagram Graph Charts PDF. This PPT design covers three stages, thus making it a great tool to use. It also caters to a variety of topics including Optimize Loan Cycle, Easy Collection, Candidate Data. Download this PPT design now to present a convincing pitch that not only emphasizes the topic but also showcases your presentation skills.
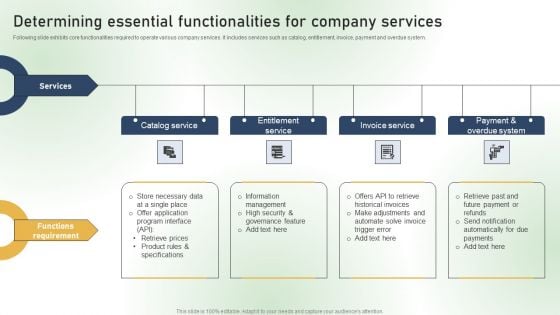
Determining Essential Functionalities For Company Services Ppt PowerPoint Presentation Diagram Graph Charts PDF
Following slide exhibits core functionalities required to operate various company services. It includes services such as catalog, entitlement, invoice, payment and overdue system. This modern and well arranged Determining Essential Functionalities For Company Services Ppt PowerPoint Presentation Diagram Graph Charts PDF provides lots of creative possibilities. It is very simple to customize and edit with the Powerpoint Software. Just drag and drop your pictures into the shapes. All facets of this template can be edited with Powerpoint no extra software is necessary. Add your own material, put your images in the places assigned for them, adjust the colors, and then you can show your slides to the world, with an animated slide included.
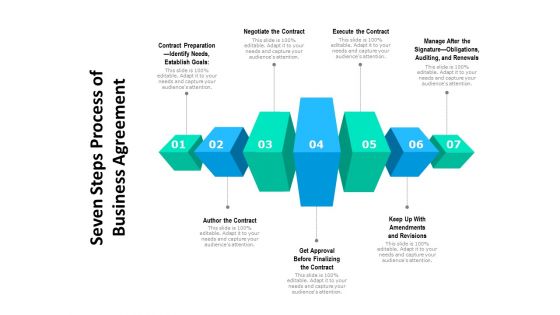
Seven Steps Process Of Business Agreement Ppt PowerPoint Presentation Diagram Graph Charts PDF
Presenting seven steps process of business agreement ppt powerpoint presentation diagram graph charts pdf to dispense important information. This template comprises seven stages. It also presents valuable insights into the topics including contract preparation, identify needs, establish goals, negotiate the contract, execute the contract, manage after the signature, obligations, auditing, and renewals, author the contract, get approval before finalizing the contract, keep up with amendments and revisions. This is a completely customizable PowerPoint theme that can be put to use immediately. So, download it and address the topic impactfully.
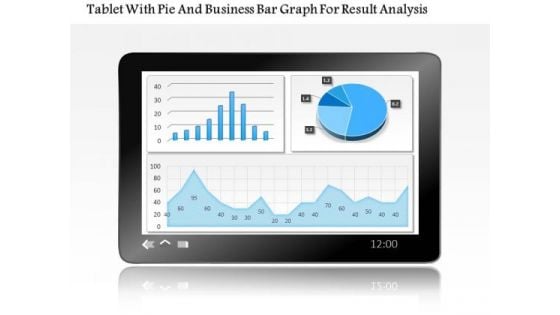
Business Diagram Tablet With Pie And Business Bar Graph For Result Analysis PowerPoint Slide
This PowerPoint template displays technology gadgets with various business charts. Use this diagram slide, in your presentations to make business reports for statistical analysis. You may use this diagram to impart professional appearance to your presentations.
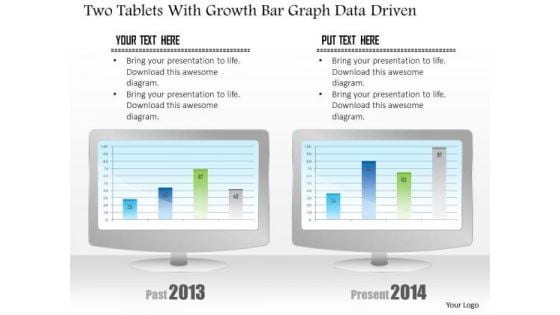
Business Diagram Two Tablets With Growth Bar Graph Data Driven PowerPoint Slide
This business diagram has been designed with comparative charts on tablets. This slide suitable for data representation. You can also use this slide to present business reports and information. Use this diagram to present your views in a wonderful manner.

Bar Graph Option Market Diversification Strategy Ppt PowerPoint Presentation Complete Deck
Share a great deal of information on the topic by deploying this bar graph option market diversification strategy ppt powerpoint presentation complete deck. Support your ideas and thought process with this prefabricated set. It includes a set of eleven slides, all fully modifiable and editable. Each slide can be restructured and induced with the information and content of your choice. You can add or remove large content boxes as well, to make this PPT slideshow more personalized. Its high-quality graphics and visuals help in presenting a well-coordinated pitch. This PPT template is also a resourceful tool to take visual cues from and implement the best ideas to help your business grow and expand. The main attraction of this well-formulated deck is that everything is editable, giving you the freedom to adjust it to your liking and choice. Changes can be made in the background and theme as well to deliver an outstanding pitch. Therefore, click on the download button now to gain full access to this multifunctional set.
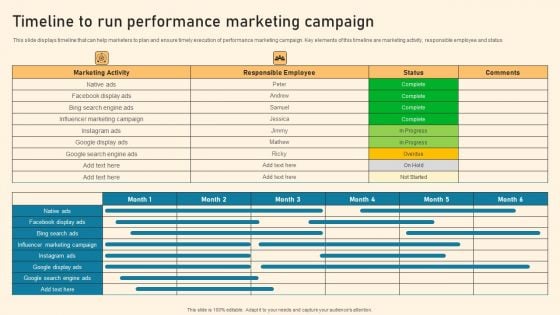
Timeline To Run Performance Marketing Campaign Ppt PowerPoint Presentation Diagram Graph Charts PDF
This slide displays timeline that can help marketers to plan and ensure timely execution of performance marketing campaign. Key elements of this timeline are marketing activity, responsible employee and status The Timeline To Run Performance Marketing Campaign Ppt PowerPoint Presentation Diagram Graph Charts PDF is a compilation of the most recent design trends as a series of slides. It is suitable for any subject or industry presentation, containing attractive visuals and photo spots for businesses to clearly express their messages. This template contains a variety of slides for the user to input data, such as structures to contrast two elements, bullet points, and slides for written information. Slidegeeks is prepared to create an impression.
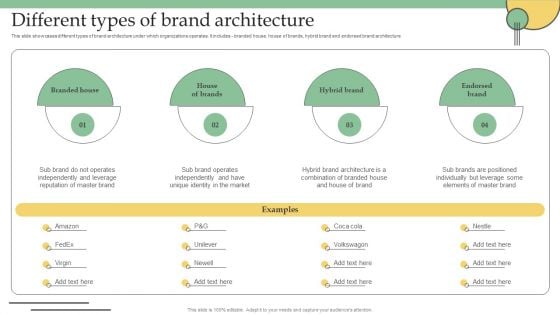
Different Types Of Brand Architecture Ppt PowerPoint Presentation Diagram Graph Charts PDF
This slide showcases different types of brand architecture under which organizations operates. It includes - branded house, house of brands, hybrid brand and endorsed brand architecture. Welcome to our selection of the Different Types Of Brand Architecture Ppt PowerPoint Presentation Diagram Graph Charts PDF. These are designed to help you showcase your creativity and bring your sphere to life. Planning and Innovation are essential for any business that is just starting out. This collection contains the designs that you need for your everyday presentations. All of our PowerPoints are 100 percent editable, so you can customize them to suit your needs. This multi purpose template can be used in various situations. Grab these presentation templates today.
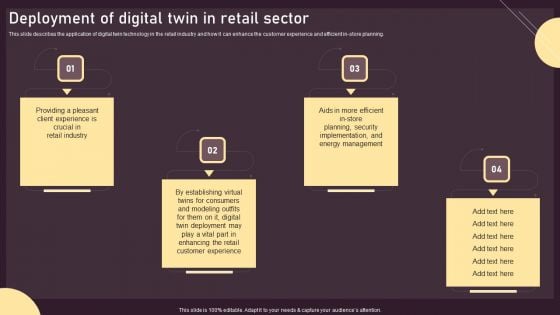
Deployment Of Digital Twin In Retail Sector Ppt PowerPoint Presentation Diagram Graph Charts PDF
This slide describes the application of digital twin technology in the retail industry and how it can enhance the customer experience and efficient in store planning. This Deployment Of Digital Twin In Retail Sector Ppt PowerPoint Presentation Diagram Graph Charts PDF from Slidegeeks makes it easy to present information on your topic with precision. It provides customization options, so you can make changes to the colors, design, graphics, or any other component to create a unique layout. It is also available for immediate download, so you can begin using it right away. Slidegeeks has done good research to ensure that you have everything you need to make your presentation stand out. Make a name out there for a brilliant performance.
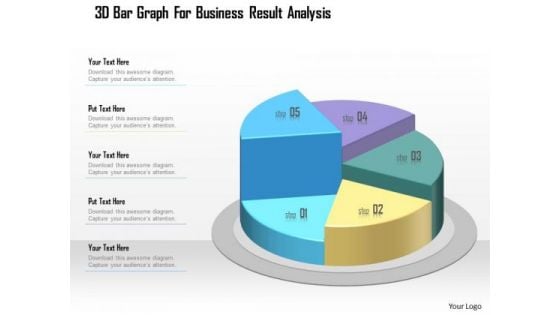
Business Diagram 3d Bar Graph For Business Result Analysis Presentation Template
This business slide displays five staged pie chart. This diagram is a data visualization tool that gives you a simple way to present statistical information. This slide helps your audience examine and interpret the data you present.
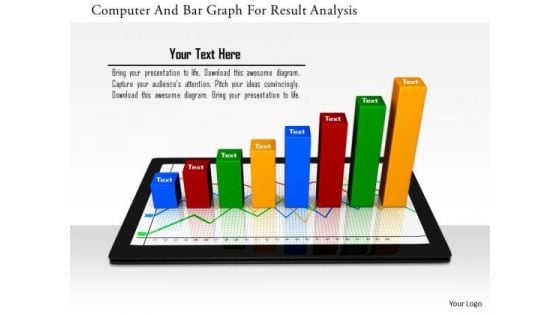
Stock Photo Computer And Bar Graph For Result Analysis PowerPoint Slide
This Power point template has been crafted with graphic of computer and bar graph. This PPT contains the concept of technology and result analysis. Use this PPT for your business and technology related presentations.
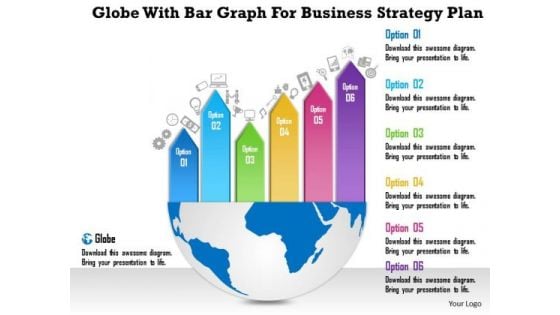
Business Diagram Globe With Bar Graph For Business Strategy Plan Presentation Template
This power point template diagram has been crafted with graphic of globe and bar graph. This PPT diagram contains the concept of business strategy and business plans for global market. Use this PPT for business and marketing related presentations.
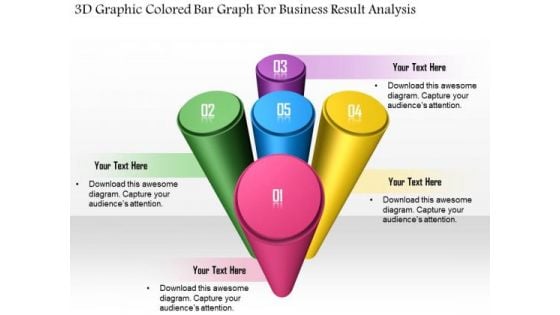
Business Diagram 3d Graphic Colored Bar Graph For Business Result Analysis Presentation Template
This Power Point template has been designed with graphic of 3d graphic and colored bar graph. Use this slide to represent six steps of any business process. Use this diagram for your business presentations and get exclusive comments on your efforts.
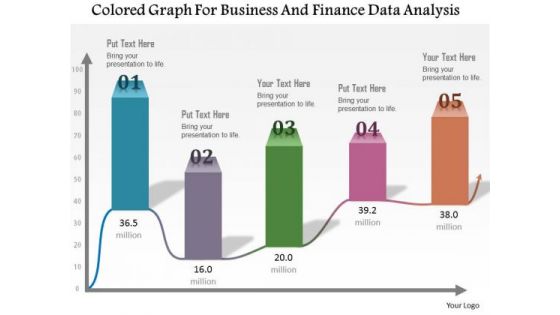
Business Diagram Colored Graph For Business And Finance Data Analysis Presentation Template
This Power Point template has been designed with graphic of colored bar graph. Use this slide to represent five steps of any business process. Use this diagram for your business presentations and get exclusive comments on your efforts.
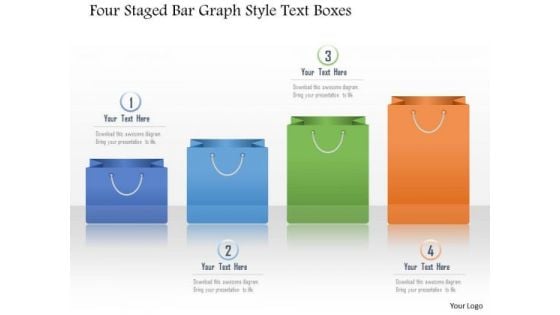
Business Diagram Four Staged Bar Graph Style Text Boxes Presentation Template
This Power Point diagram has been crafted with graphic of four shopping bags. It contains diagram of colorful shopping bag graphics depicting progress steps. Use this diagram to build professional presentation for your viewers.
Four Banners With Idea Generation Bar Graph Gears Icons Powerpoint Templates
This PPT slide has been designed with four banners. This professional template contains concept of idea generation and analysis. Blend your views with this professional slide.
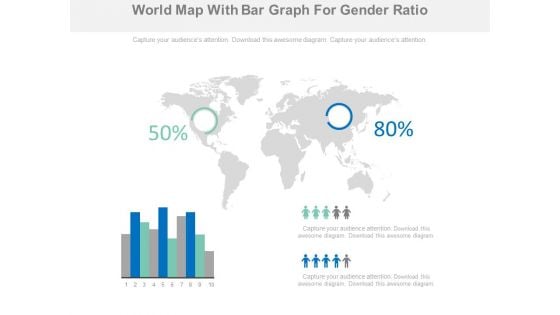
World Map With Bar Graph And Higher Population Areas Powerpoint Slides
This professionally designed PowerPoint template is as an effective tool to display high population areas on world. You can download this diagram to visually support your content. Above PPT slide is suitable for business presentation.
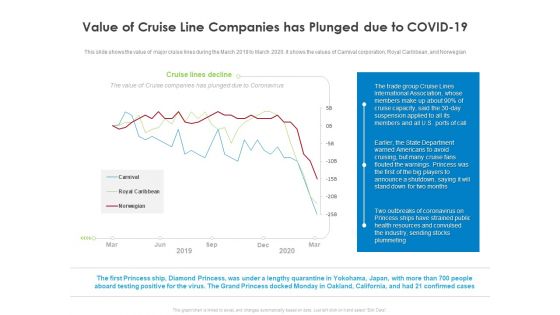
COVID 19 Risk Analysis Mitigation Policies Ocean Liner Sector Value Of Cruise Line Companies Has Plunged Due To COVID 19 Themes PDF
This slide shows the value of major cruise lines during the March 2019 to March 2020. it shows the values of Carnival corporation, Royal Caribbean, and Norwegian. Deliver an awe inspiring pitch with this creative covid 19 risk analysis mitigation policies ocean liner sector value of cruise line companies has plunged due to covid 19 themes pdf bundle. Topics like value of cruise line companies has plunged due to covid 19 can be discussed with this completely editable template. It is available for immediate download depending on the needs and requirements of the user.
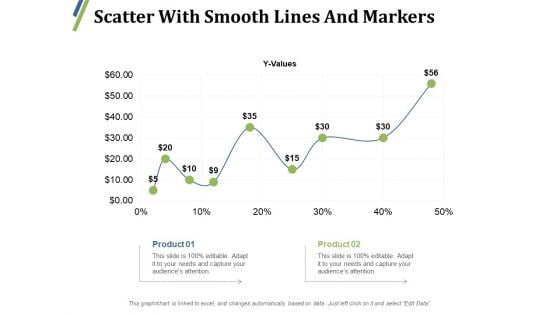
Scatter With Smooth Lines And Markers Ppt PowerPoint Presentation Outline Inspiration
This is a scatter with smooth lines and markers ppt powerpoint presentation outline inspiration. This is a two stage process. The stages in this process are product, percentage, finance, growth, line graph.
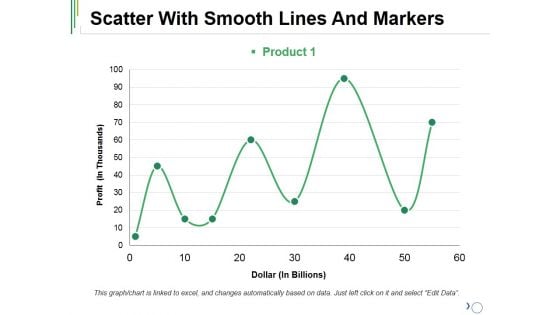
Scatter With Smooth Lines And Markers Ppt PowerPoint Presentation Outline Mockup
This is a scatter with smooth lines and markers ppt powerpoint presentation outline mockup. This is a one stage process. The stages in this process are product, finance, line graph, business, management.
Bar Graph And Pie Charts For Business Reports Vector Icon Ppt PowerPoint Presentation Show Graphics Tutorials PDF
Pitch your topic with ease and precision using this bar graph and pie charts for business reports vector icon ppt powerpoint presentation show graphics tutorials pdf. This layout presents information on bar graph and pie charts for business reports vector icon. It is also available for immediate download and adjustment. So, changes can be made in the color, design, graphics or any other component to create a unique layout.
Stock Market Analysis Magnifying Glass Over Bar Graph And Dollar Sign Ppt PowerPoint Presentation Icon Visual Aids
This is a stock market analysis magnifying glass over bar graph and dollar sign ppt powerpoint presentation icon visual aids. This is a four stage process. The stages in this process are stock market, financial markets, bull market.
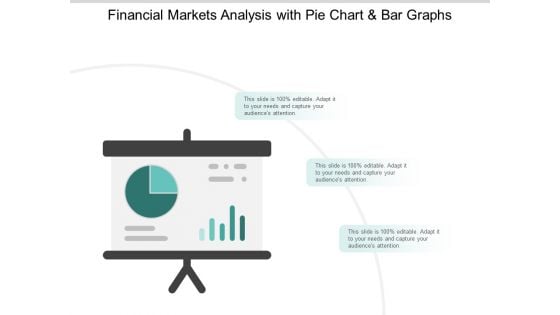
Stock Market Survey Reporting With Pie Chat And Bar Graph Ppt PowerPoint Presentation Infographic Template Example 2015
This is a stock market survey reporting with pie chat and bar graph ppt powerpoint presentation infographic template example 2015. This is a three stage process. The stages in this process are stock market, financial markets, bull market.
Consulting Services With Bar Graph And Chat Bo Vector Icon Ppt PowerPoint Presentation File Background Designs PDF
Persuade your audience using this consulting services with bar graph and chat bo vector icon ppt powerpoint presentation file background designs pdf. This PPT design covers three stages, thus making it a great tool to use. It also caters to a variety of topics including consulting services with bar graph and chat bo vector icon. Download this PPT design now to present a convincing pitch that not only emphasizes the topic but also showcases your presentation skills.
Key Drivers Of Sales And Marketing Growth With Bar Graph Vector Icon Ppt PowerPoint Presentation File Inspiration PDF
Presenting key drivers of sales and marketing growth with bar graph vector icon ppt powerpoint presentation file inspiration pdf to dispense important information. This template comprises one stages. It also presents valuable insights into the topics including key drivers of sales and marketing growth with bar graph vector icon. This is a completely customizable PowerPoint theme that can be put to use immediately. So, download it and address the topic impactfully.
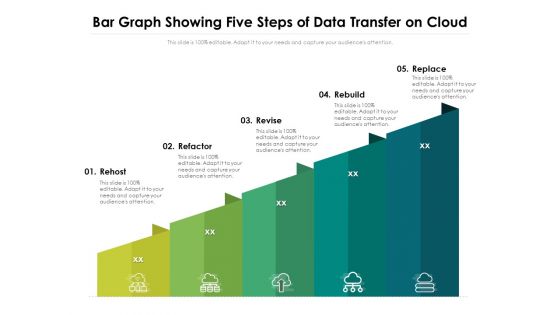
Bar Graph Showing Five Steps Of Data Transfer On Cloud Ppt PowerPoint Presentation Ideas Slide Download PDF
Presenting this set of slides with name bar graph showing five steps of data transfer on cloud ppt powerpoint presentation ideas slide download pdf. This is a five stage process. The stages in this process are rehost, refactor, revise, rebuild, replace. This is a completely editable PowerPoint presentation and is available for immediate download. Download now and impress your audience.
Circular Process With Lines Diagonal Lines Ppt PowerPoint Presentation Complete Deck
Share a great deal of information on the topic by deploying this circular process with lines diagonal lines ppt powerpoint presentation complete deck. Support your ideas and thought process with this prefabricated set. It includes a set of twelve slides, all fully modifiable and editable. Each slide can be restructured and induced with the information and content of your choice. You can add or remove large content boxes as well, to make this PPT slideshow more personalized. Its high-quality graphics and visuals help in presenting a well-coordinated pitch. This PPT template is also a resourceful tool to take visual cues from and implement the best ideas to help your business grow and expand. The main attraction of this well-formulated deck is that everything is editable, giving you the freedom to adjust it to your liking and choice. Changes can be made in the background and theme as well to deliver an outstanding pitch. Therefore, click on the download button now to gain full access to this multifunctional set.
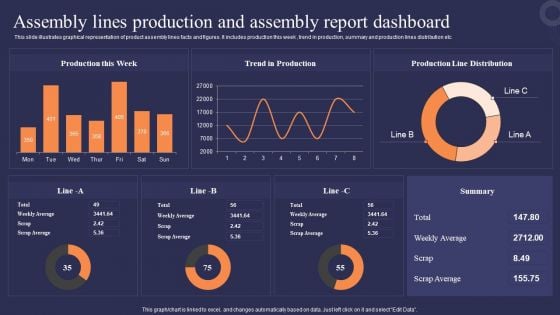
Assembly Lines Production And Assembly Report Dashboard Microsoft PDF
This slide illustrates graphical representation of product assembly lines facts and figures. It includes production this week , trend in production, summary and production lines distribution etc.Showcasing this set of slides titled Assembly Lines Production And Assembly Report Dashboard Microsoft PDF. The topics addressed in these templates are Production, Trend Production, Production Distribution. All the content presented in this PPT design is completely editable. Download it and make adjustments in color, background, font etc. as per your unique business setting.
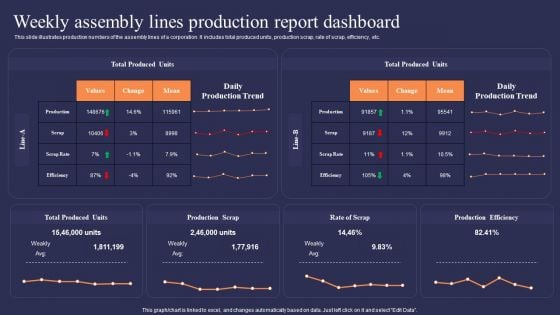
Weekly Assembly Lines Production Report Dashboard Demonstration PDF
This slide illustrates production numbers of the assembly lines of a corporation. It includes total produced units, production scrap, rate of scrap, efficiency, etc.Showcasing this set of slides titled Weekly Assembly Lines Production Report Dashboard Demonstration PDF. The topics addressed in these templates are Total Produced, Production Efficiency, Production Scrap. All the content presented in this PPT design is completely editable. Download it and make adjustments in color, background, font etc. as per your unique business setting.
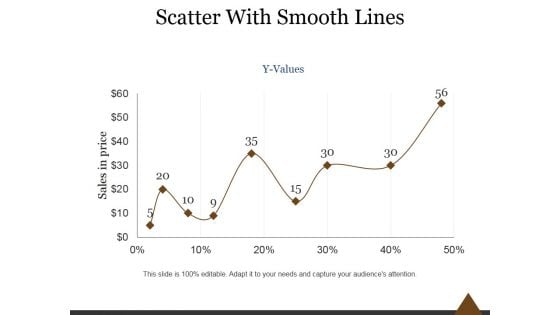
Scatter With Smooth Lines Ppt PowerPoint Presentation Picture
This is a scatter with smooth lines ppt powerpoint presentation picture. This is a one stage process. The stages in this process are scatter, smooth, lines, business, marketing.
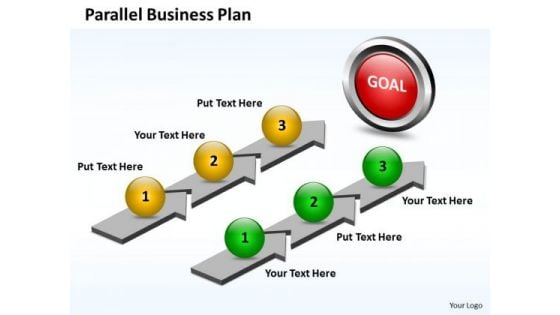
Business Charts PowerPoint Templates Parallel Lines Lesson Plans
Business Charts PowerPoint templates parallel lines lesson plans-Use this PowerPoint Diagram to explain the parallel Processes occurring in Business. It signifies alongside, coextending, coextensive, coordinate, equidistant, extending equally, in the same direction, lateral, laterally, never meeting, running alongside.-Business Charts PowerPoint templates parallel lines lesson plans Entice listeners both near and far. Our Business Charts PowerPoint Templates Parallel Lines Lesson Plans have an alluring effect.
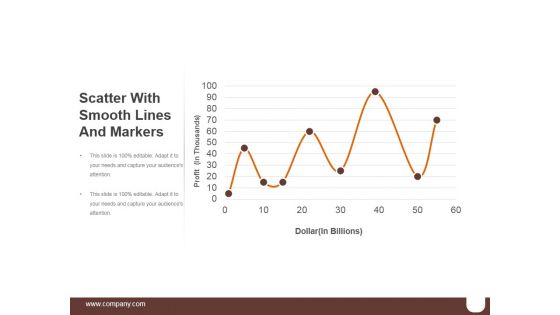
Scatter With Smooth Lines And Markers Ppt PowerPoint Presentation Ideas
This is a scatter with smooth lines and markers ppt powerpoint presentation ideas. This is a seven stage process. The stages in this process are business, marketing, percentage, success, finance.
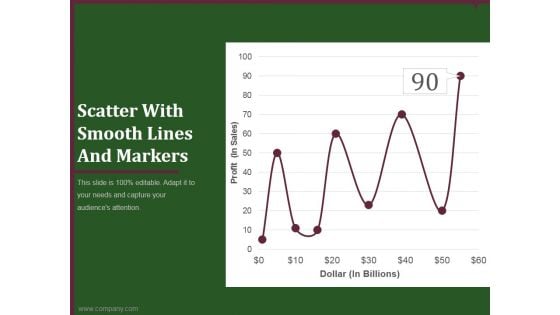
Scatter With Smooth Lines And Markers Ppt PowerPoint Presentation Example
This is a scatter with smooth lines and markers ppt powerpoint presentation example. This is a seven stage process. The stages in this process are business, marketing, success, growth, finance.
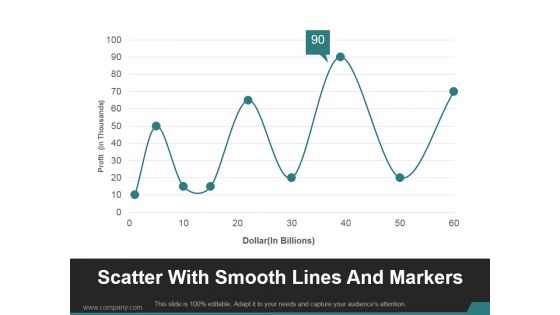
Scatter With Smooth Lines And Markers Ppt PowerPoint Presentation Show
This is a scatter with smooth lines and markers ppt powerpoint presentation show. This is a nine stage process. The stages in this process are business, marketing, line chart, profit, management.
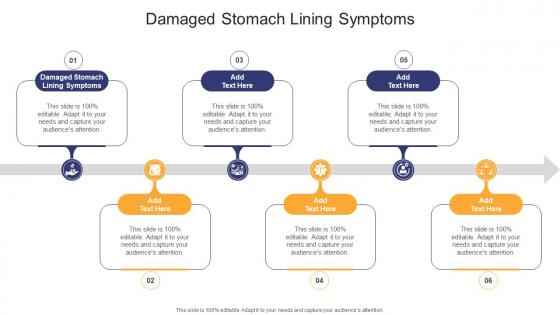
Damaged Stomach Lining Symptoms In Powerpoint And Google Slides Cpb
Presenting our innovatively-designed set of slides titled Damaged Stomach Lining Symptoms In Powerpoint And Google Slides Cpb. This completely editable PowerPoint graphic exhibits Damaged Stomach Lining Symptoms that will help you convey the message impactfully. It can be accessed with Google Slides and is available in both standard screen and widescreen aspect ratios. Apart from this, you can download this well-structured PowerPoint template design in different formats like PDF, JPG, and PNG. So, click the download button now to gain full access to this PPT design. Our Damaged Stomach Lining Symptoms In Powerpoint And Google Slides Cpb are topically designed to provide an attractive backdrop to any subject. Use them to look like a presentation pro.

Cyber Security Pick Lines In Powerpoint And Google Slides Cpb
Introducing our well designed Cyber Security Pick Lines In Powerpoint And Google Slides Cpb. This PowerPoint design presents information on topics like Cyber Security Pick Lines. As it is predesigned it helps boost your confidence level. It also makes you a better presenter because of its high quality content and graphics. This PPT layout can be downloaded and used in different formats like PDF, PNG, and JPG. Not only this, it is available in both Standard Screen and Widescreen aspect ratios for your convenience. Therefore, click on the download button now to persuade and impress your audience. Our Cyber Security Pick Lines In Powerpoint And Google Slides Cpb are topically designed to provide an attractive backdrop to any subject. Use them to look like a presentation pro.
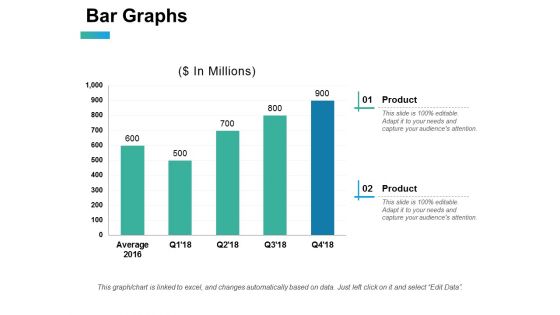
Bar Graphs Ppt PowerPoint Presentation Gallery Elements
This is a bar graphs ppt powerpoint presentation gallery elements. This is a two stage process. The stages in this process are Bar Graphs, Business, Strategy, Marketing, Analysis.

Spa Resort Business Plan Global Hotels Resorts And Cruise Lines Market By Geography BP SS V
This slide showcases the global hotels, resort and cruise lines industry by geography which includes North America, Europe, Asia-Pacific, Middle East and Africa and Central and South America. Find highly impressive Spa Resort Business Plan Global Hotels Resorts And Cruise Lines Market By Geography BP SS V on Slidegeeks to deliver a meaningful presentation. You can save an ample amount of time using these presentation templates. No need to worry to prepare everything from scratch because Slidegeeks experts have already done a huge research and work for you. You need to download Spa Resort Business Plan Global Hotels Resorts And Cruise Lines Market By Geography BP SS V for your upcoming presentation. All the presentation templates are 100 percent editable and you can change the color and personalize the content accordingly. Download now This slide showcases the global hotels, resort and cruise lines industry by geography which includes North America, Europe, Asia-Pacific, Middle East and Africa and Central and South America.
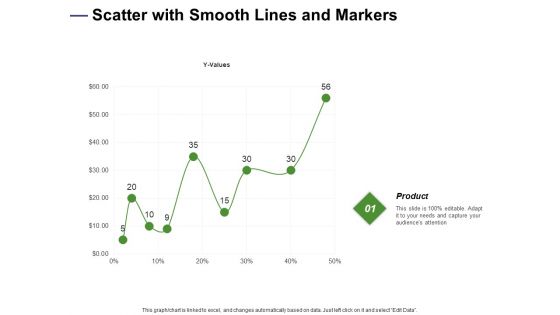
Designing Compensation Systems For Professionals Scatter With Smooth Lines And Markers Clipart PDF
Presenting this set of slides with name designing compensation systems for professionals scatter with smooth lines and markers clipart pdf. The topics discussed in these slide is scatter with smooth lines and markers. This is a completely editable PowerPoint presentation and is available for immediate download. Download now and impress your audience.
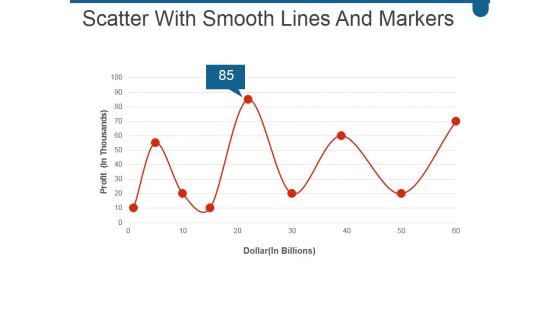
Scatter With Smooth Lines And Markers Ppt PowerPoint Presentation Professional Visual Aids
This is a scatter with smooth lines and markers ppt powerpoint presentation professional visual aids. This is a nine stage process. The stages in this process are business, marketing, success, growth, line.
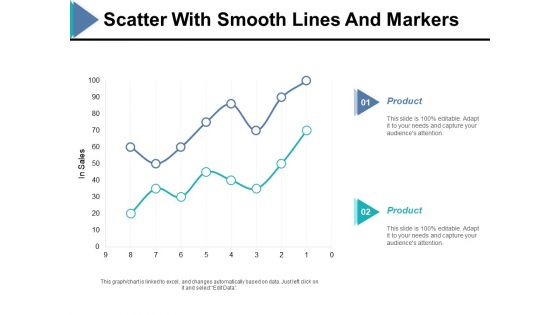
Scatter With Smooth Lines And Markers Ppt PowerPoint Presentation Ideas Example
This is a scatter with smooth lines and markers ppt powerpoint presentation ideas example. This is a two stage process. The stages in this process are in sales, finance, bar graph, product, business.
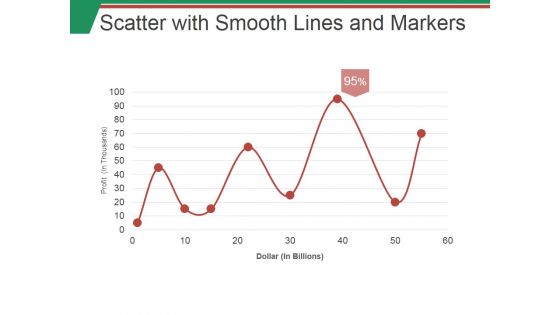
Scatter With Smooth Lines And Markers Ppt PowerPoint Presentation Infographic Template Images
This is a scatter with smooth lines and markers ppt powerpoint presentation infographic template images. This is a nine stage process. The stages in this process are business, marketing, finance, planning, success.
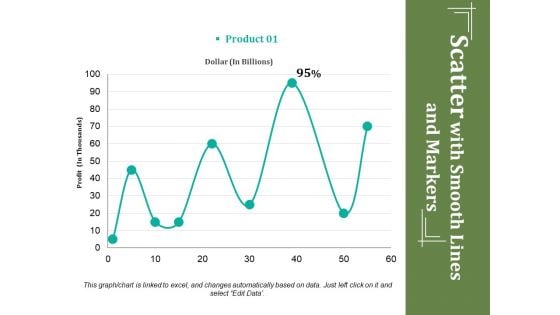
Scatter With Smooth Lines And Markers Ppt PowerPoint Presentation Ideas Deck
This is a scatter with smooth lines and markers ppt powerpoint presentation ideas deck. This is a one stage process. The stages in this process are profit, dollar, percentage, business, growth.


 Continue with Email

 Home
Home


