Line Graph
Data Handling Types With Frequency Distribution Ppt PowerPoint Presentation Icon Diagrams PDF
Presenting data handling types with frequency distribution ppt powerpoint presentation icon diagrams pdf to dispense important information. This template comprises seven stages. It also presents valuable insights into the topics including frequency distribution, line graph, pictograph. This is a completely customizable PowerPoint theme that can be put to use immediately. So, download it and address the topic impactfully.
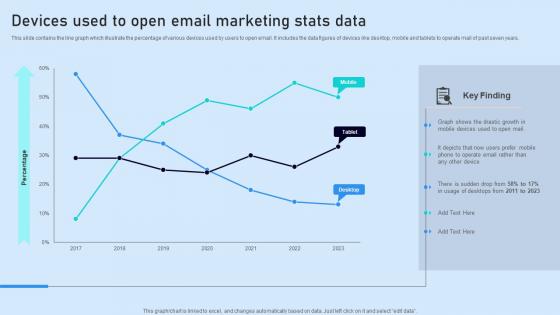
Devices Used To Open Email Marketing Stats Data Brochure Pdf
This slide contains the line graph which illustrate the percentage of various devices used by users to open email. It includes the data figures of devices like desktop, mobile and tablets to operate mail of past seven years. Pitch your topic with ease and precision using this Devices Used To Open Email Marketing Stats Data Brochure Pdf. This layout presents information on Key Finding, Stats Data, Devices. It is also available for immediate download and adjustment. So, changes can be made in the color, design, graphics or any other component to create a unique layout. This slide contains the line graph which illustrate the percentage of various devices used by users to open email. It includes the data figures of devices like desktop, mobile and tablets to operate mail of past seven years.

Market Potential Property Listings Platform Pitch Deck PPT Sample
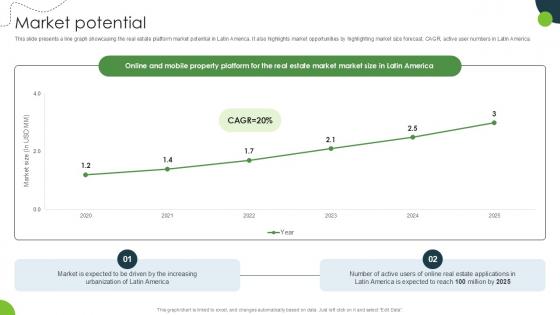
This slide presents a line graph showcasing the real estate platform market potential in Latin America. It also highlights market opportunities by highlighting market size forecast, CAGR, active user numbers in Latin America. Are you in need of a template that can accommodate all of your creative concepts This one is crafted professionally and can be altered to fit any style. Use it with Google Slides or PowerPoint. Include striking photographs, symbols, depictions, and other visuals. Fill, move around, or remove text boxes as desired. Test out color palettes and font mixtures. Edit and save your work, or work with colleagues. Download Market Potential Property Listings Platform Pitch Deck PPT Sample and observe how to make your presentation outstanding. Give an impeccable presentation to your group and make your presentation unforgettable. This slide presents a line graph showcasing the real estate platform market potential in Latin America.It also highlights market opportunities by highlighting market size forecast, CAGR, active user numbers in Latin America.
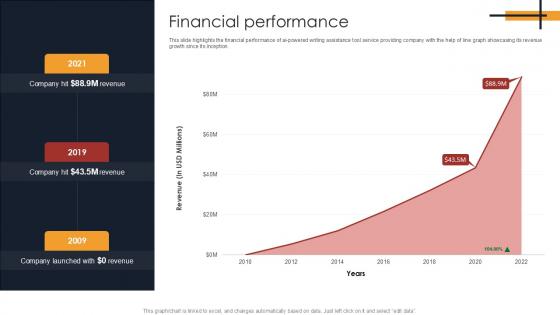
Financial Performance Writing Enhancement Software Pitch Deck PPT Example
This slide highlights the financial performance of ai powered writing assistance tool service providing company with the help of line graph showcasing its revenue growth since its inception. Find a pre designed and impeccable Financial Performance Writing Enhancement Software Pitch Deck PPT Example. The templates can ace your presentation without additional effort. You can download these easy to edit presentation templates to make your presentation stand out from others. So, what are you waiting for Download the template from Slidegeeks today and give a unique touch to your presentation. This slide highlights the financial performance of ai powered writing assistance tool service providing company with the help of line graph showcasing its revenue growth since its inception.
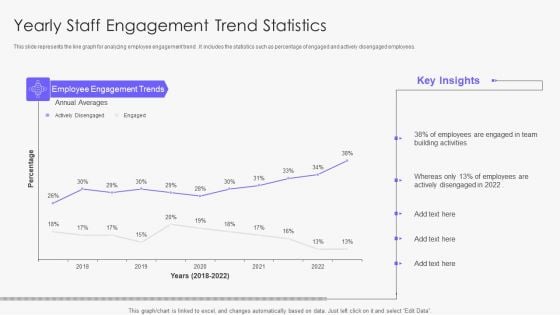
Yearly Staff Engagement Trend Statistics Demonstration PDF
This slide represents the line graph for analyzing employee engagement trend . It includes the statistics such as percentage of engaged and actively disengaged employees. Pitch your topic with ease and precision using this Yearly Staff Engagement Trend Statistics Demonstration PDF. This layout presents information on Team, Employees, Average. It is also available for immediate download and adjustment. So, changes can be made in the color, design, graphics or any other component to create a unique layout.
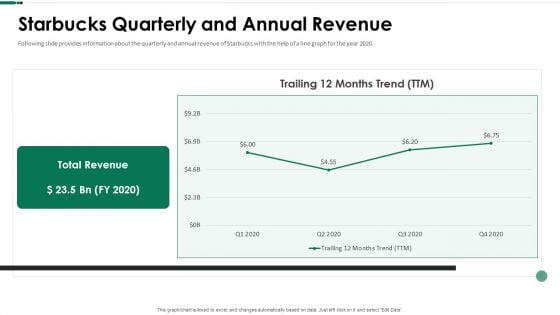
Starbucks Quarterly And Annual Revenue Ppt Slides Introduction PDF
Following slide provides information about the quarterly and annual revenue of Starbucks with the help of a line graph for the year 2020. Deliver and pitch your topic in the best possible manner with this starbucks quarterly and annual revenue ppt slides introduction pdf. Use them to share invaluable insights on starbucks quarterly and annual revenue and impress your audience. This template can be altered and modified as per your expectations. So, grab it now.
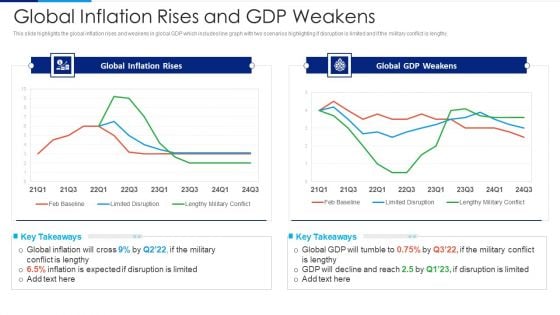
Russia Ukraine Conflict Effect Global Inflation Rises And Gdp Weakens Professional PDF
This slide highlights the global inflation rises and weakens in global GDP which includes line graph with two scenarios highlighting if disruption is limited and if the military conflict is lengthy. Deliver an awe inspiring pitch with this creative Russia Ukraine Conflict Effect Global Inflation Rises And Gdp Weakens Professional PDF bundle. Topics like Global Inflation Rises, Global GDP Weakens can be discussed with this completely editable template. It is available for immediate download depending on the needs and requirements of the user.
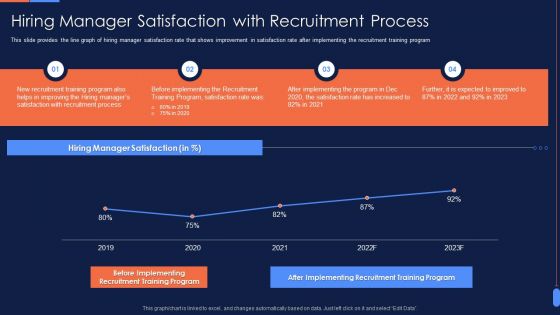
Recruitment Training To Optimize Hiring Manager Satisfaction With Recruitment Process Topics PDF
This slide provides the line graph of hiring manager satisfaction rate that shows improvement in satisfaction rate after implementing the recruitment training program. Deliver an awe inspiring pitch with this creative Recruitment Training To Optimize Hiring Manager Satisfaction With Recruitment Process Topics PDF bundle. Topics like New Recruitment Training Program, New Recruitment Training Program, 2019 TO 2023 can be discussed with this completely editable template. It is available for immediate download depending on the needs and requirements of the user.
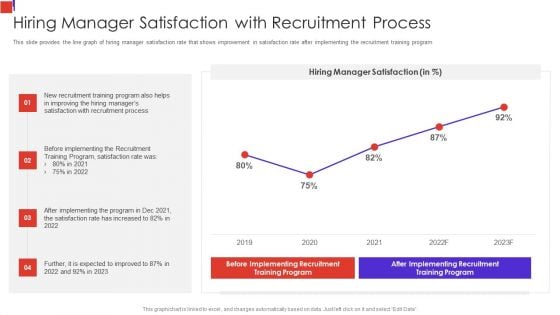
Outline Of Employee Recruitment Hiring Manager Satisfaction With Recruitment Process Clipart PDF
This slide provides the line graph of hiring manager satisfaction rate that shows improvement in satisfaction rate after implementing the recruitment training program Deliver and pitch your topic in the best possible manner with this Outline Of Employee Recruitment Hiring Manager Satisfaction With Recruitment Process Clipart PDF Use them to share invaluable insights on Recruitment Training, Improving The Hiring, Satisfaction With Recruitment and impress your audience. This template can be altered and modified as per your expectations. So, grab it now.
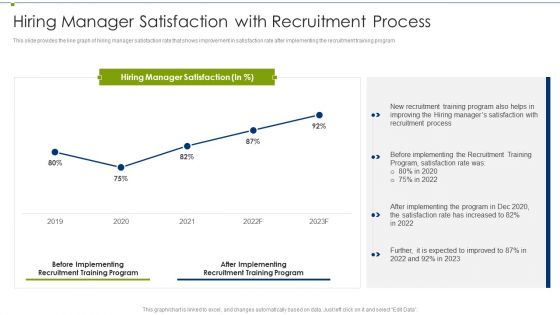
Recruitment Training Program For Workforce Hiring Manager Satisfaction With Recruitment Process Infographics PDF
This slide provides the line graph of hiring manager satisfaction rate that shows improvement in satisfaction rate after implementing the recruitment training program Deliver and pitch your topic in the best possible manner with this Recruitment Training Program For Workforce Hiring Manager Satisfaction With Recruitment Process Infographics PDF Use them to share invaluable insights on Recruitment Training Program, Improving The Hiring Managers, Recruitment Process and impress your audience. This template can be altered and modified as per your expectations. So, grab it now.
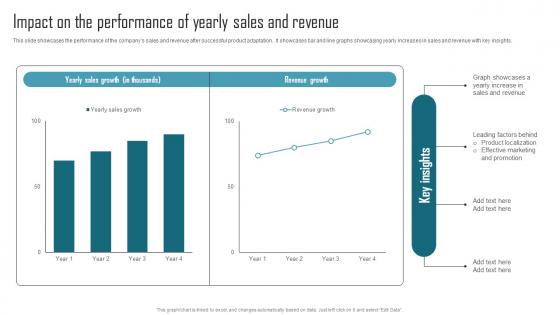
Effective Product Adaptation Impact On The Performance Of Yearly Sales And Revenue Introduction PDF
This slide showcases the performance of the companys sales and revenue after successful product adaptation.. It showcases bar and line graphs showcasing yearly increases in sales and revenue with key insights. Retrieve professionally designed Effective Product Adaptation Impact On The Performance Of Yearly Sales And Revenue Introduction PDF to effectively convey your message and captivate your listeners. Save time by selecting pre-made slideshows that are appropriate for various topics, from business to educational purposes. These themes come in many different styles, from creative to corporate, and all of them are easily adjustable and can be edited quickly. Access them as PowerPoint templates or as Google Slides themes. You do not have to go on a hunt for the perfect presentation because Slidegeeks got you covered from everywhere. This slide showcases the performance of the companys sales and revenue after successful product adaptation.. It showcases bar and line graphs showcasing yearly increases in sales and revenue with key insights.

Financial Projections Work Management Tool Pitch Deck
This slide presents the financial projection of the company with the help of line graphs. It showcases projected increase in company revenue and growth of EBITDA.Slidegeeks is here to make your presentations a breeze with Financial Projections Work Management Tool Pitch Deck With our easy-to-use and customizable templates, you can focus on delivering your ideas rather than worrying about formatting. With a variety of designs to choose from, you are sure to find one that suits your needs. And with animations and unique photos, illustrations, and fonts, you can make your presentation pop. So whether you are giving a sales pitch or presenting to the board, make sure to check out Slidegeeks first This slide presents the financial projection of the company with the help of line graphs. It showcases projected increase in company revenue and growth of EBITDA.
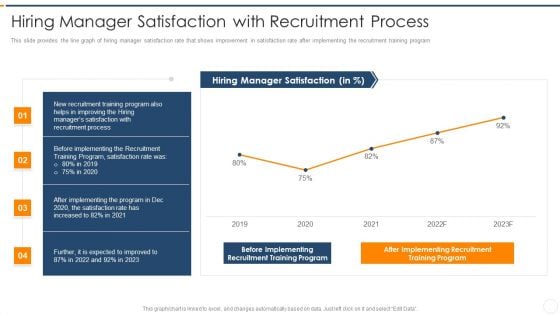
Recruitment Training Enhance Candidate Hiring Process Hiring Manager Satisfaction With Recruitment Process Slides PDF
This slide provides the line graph of hiring manager satisfaction rate that shows improvement in satisfaction rate after implementing the recruitment training program. Deliver and pitch your topic in the best possible manner with this recruitment training enhance candidate hiring process hiring manager satisfaction with recruitment process slides pdf. Use them to share invaluable insights on hiring manager satisfaction with recruitment process and impress your audience. This template can be altered and modified as per your expectations. So, grab it now.
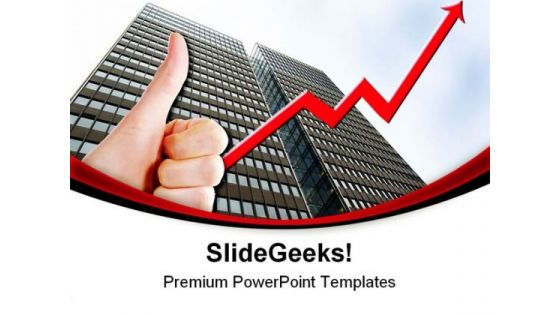
Business02 Success PowerPoint Themes And PowerPoint Slides 0711
Microsoft PowerPoint Theme and Slide with a thumbs up with a graph line going up with a tall business building Display your aptitude with our Business02 Success PowerPoint Themes And PowerPoint Slides 0711. Ideas will flow effortlessly.
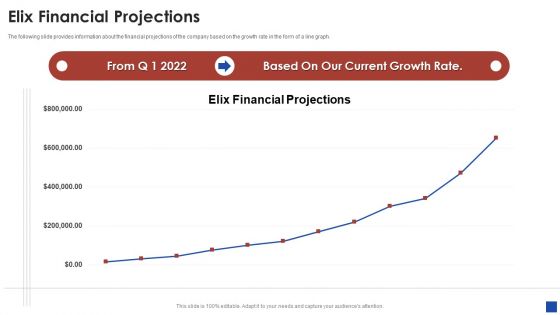
Elix Incubator Venture Capital Funding Elix Financial Projections Background PDF
The following slide provides information about the financial projections of the company based on the growth rate in the form of a line graph. Deliver an awe inspiring pitch with this creative elix incubator venture capital funding elix financial projections background pdf bundle. Topics like elix financial projections can be discussed with this completely editable template. It is available for immediate download depending on the needs and requirements of the user.
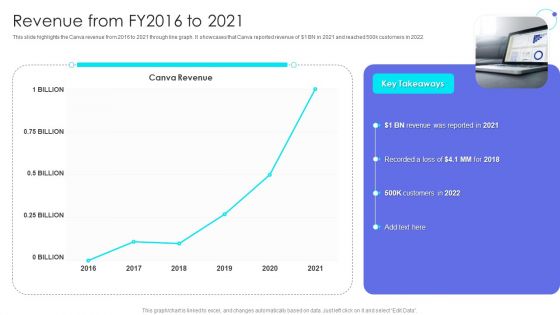
Canva Pro Business Profile Revenue From Fy2016 To 2021 Sample PDF
This slide highlights the Canva revenue from 2016 to 2021 through line graph. It showcases that Canva reported revenue of doller 1 BN in 2021 and reached 500k customers in 2022. Deliver an awe inspiring pitch with this creative Canva Pro Business Profile Revenue From Fy2016 To 2021 Sample PDF bundle. Topics like Customers, Revenue can be discussed with this completely editable template. It is available for immediate download depending on the needs and requirements of the user.
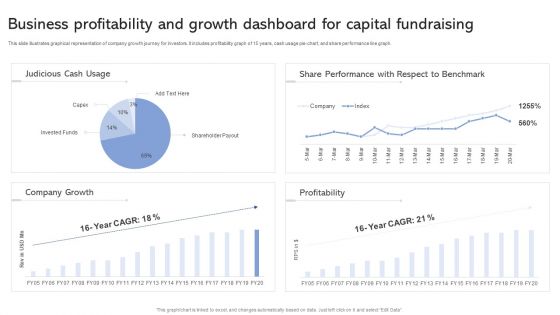
Business Profitability And Growth Dashboard For Capital Fundraising Ppt Slides Guide PDF
This slide illustrates graphical representation of company growth journey for investors. It includes profitability graph of 15 years, cash usage pie-chart, and share performance line graph. Showcasing this set of slides titled Business Profitability And Growth Dashboard For Capital Fundraising Ppt Slides Guide PDF. The topics addressed in these templates are Judicious Cash Usage, Share Performance, Respect To Benchmark. All the content presented in this PPT design is completely editable. Download it and make adjustments in color, background, font etc. as per your unique business setting.
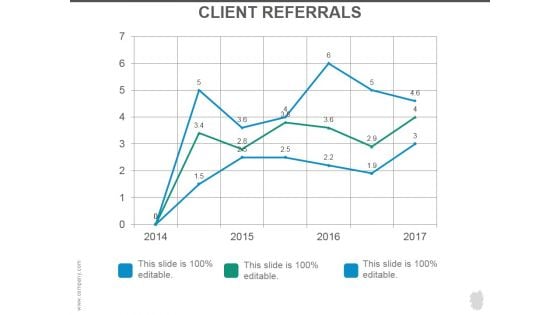
Client Referrals Ppt PowerPoint Presentation Example 2015
This is a client referrals ppt powerpoint presentation example 2015. This is a three stage process. The stages in this process are business, marketing, management, bar graph, line bar.
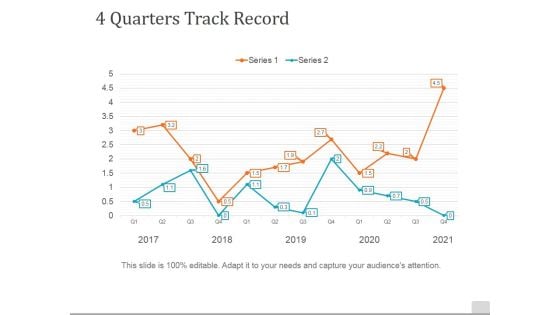
4 Quarters Track Record Template 1 Ppt PowerPoint Presentation Slides Example
This is a 4 quarters track record template 1 ppt powerpoint presentation slides example. This is a two stage process. The stages in this process are management, business, marketing, graph, line chart.
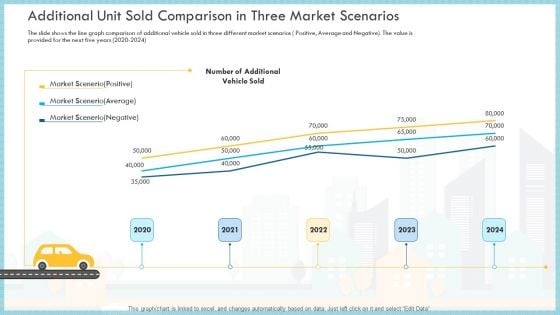
Additional Unit Sold Comparison In Three Market Scenarios Sold Themes PDF
The slide shows the line graph comparison of additional vehicle sold in three different market scenarios Positive, Average and Negative. The value is provided for the next five years 2020 to 2024 Deliver an awe inspiring pitch with this creative additional unit sold comparison in three market scenarios sold themes pdf bundle. Topics like market scenario positive, market scenario average, market scenario negative can be discussed with this completely editable template. It is available for immediate download depending on the needs and requirements of the user.
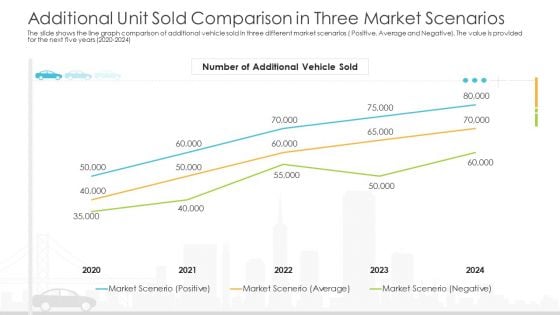
Vehicle Sales Plunge In An Automobile Firm Additional Unit Sold Comparison In Three Market Scenarios Introduction PDF
The slide shows the line graph comparison of additional vehicle sold in three different market scenarios Positive, Average and Negative. The value is provided for the next five years 2020 2024 Deliver an awe inspiring pitch with this creative vehicle sales plunge in an automobile firm additional unit sold comparison in three market scenarios introduction pdf bundle. Topics like additional unit sold comparison in three market scenarios can be discussed with this completely editable template. It is available for immediate download depending on the needs and requirements of the user.
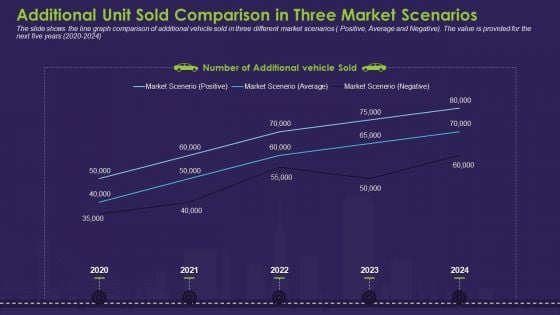
Additional Unit Sold Comparison In Three Market Scenarios Introduction PDF
The slide shows the line graph comparison of additional vehicle sold in three different market scenarios Positive, Average and Negative. The value is provided for the next five years 2020 to 2024.Deliver an awe-inspiring pitch with this creative additional unit sold comparison in three market scenarios introduction pdf. bundle. Topics like market scenario, positive, market scenario average, market scenario negative, 2020 to 2024 can be discussed with this completely editable template. It is available for immediate download depending on the needs and requirements of the user.
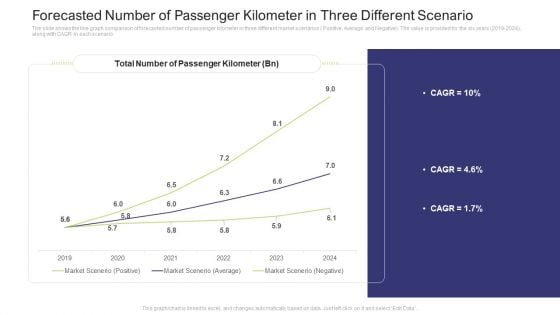
Forecasted Number Of Passenger Kilometer In Three Different Scenario Slides PDF
The slide shows the line graph comparison of forecasted number of passenger kilometer in three different market scenarios Positive, Average and Negative. The value is provided for the six years 2019 to 2024, along with CAGR in each scenario.Deliver an awe-inspiring pitch with this creative forecasted number of passenger kilometer in three different scenario slides pdf. bundle. Topics like total number of passenger kilometer, 2019 to 2024 can be discussed with this completely editable template. It is available for immediate download depending on the needs and requirements of the user.
Declining Of A Motor Vehicle Company Additional Unit Sold Comparison In Three Market Scenarios Topics PDF
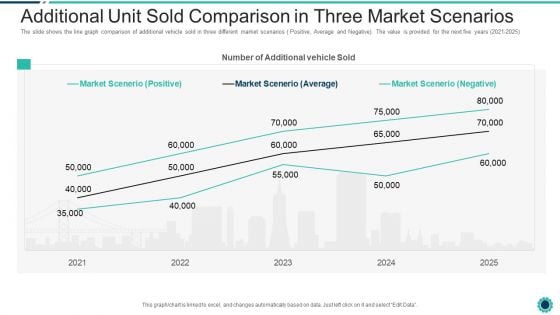
The slide shows the line graph comparison of additional vehicle sold in three different market scenarios Positive, Average and Negative. The value is provided for the next five years 2021 2025. Deliver an awe inspiring pitch with this creative declining of a motor vehicle company additional unit sold comparison in three market scenarios topics pdf bundle. Topics like market scenarios positive, average, negative can be discussed with this completely editable template. It is available for immediate download depending on the needs and requirements of the user.
What Does Account Growth Look Like Pitch Deck Of Vulpine Interactive Fundraising Template Pdf
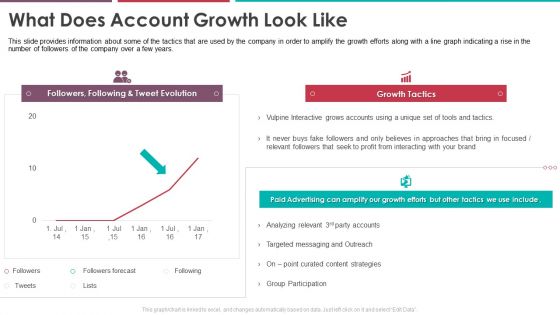
This slide provides information about some of the tactics that are used by the company in order to amplify the growth efforts along with a line graph indicating a rise in the number of followers of the company over a few years. This is a what does account growth look like pitch deck of vulpine interactive fundraising template pdf template with various stages. Focus and dispense information on six stages using this creative set, that comes with editable features. It contains large content boxes to add your information on topics like tweet evolution, growth tactics. You can also showcase facts, figures, and other relevant content using this PPT layout. Grab it now.
Forecasted Number Of Passenger Kilometer In Three Different Scenario Elements PDF
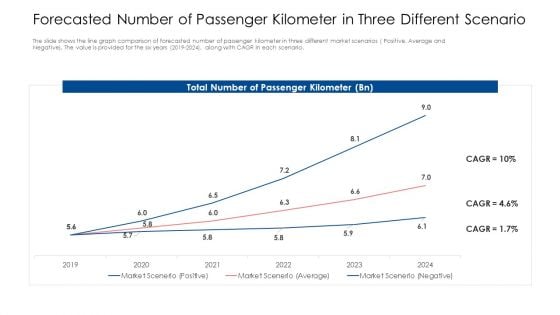
The slide shows the line graph comparison of forecasted number of passenger kilometer in three different market scenarios Positive, Average and Negative. The value is provided for the six years 2019-2024, along with CAGR in each scenario. Deliver an awe inspiring pitch with this creative forecasted number of passenger kilometer in three different scenario elements pdf bundle. Topics like forecasted number of passenger kilometer in three different scenario can be discussed with this completely editable template. It is available for immediate download depending on the needs and requirements of the user.
Forecasted Number Of Passenger Kilometer In Three Different Scenario Themes PDF
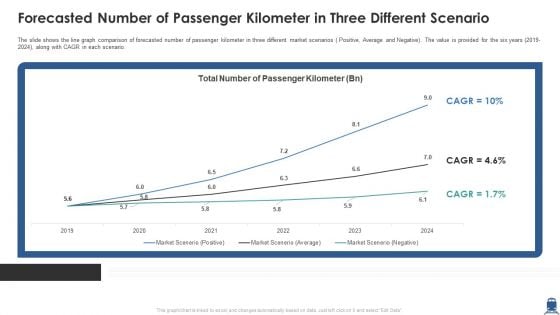
The slide shows the line graph comparison of forecasted number of passenger kilometer in three different market scenarios Positive, Average and Negative. The value is provided for the six years 2019-2024, along with CAGR in each scenario. Deliver and pitch your topic in the best possible manner with this forecasted number of passenger kilometer in three different scenario themes pdf. Use them to share invaluable insights on forecasted number of passenger kilometer in three different scenario and impress your audience. This template can be altered and modified as per your expectations. So, grab it now.
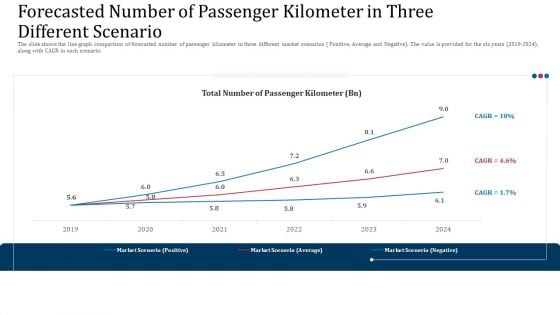
Forecasted Number Of Passenger Kilometer In Three Different Scenario Background PDF
The slide shows the line graph comparison of forecasted number of passenger kilometer in three different market scenarios Positive, Average and Negative. The value is provided for the six years 2019 to 2024, along with CAGR in each scenario.Deliver and pitch your topic in the best possible manner with this forecasted number of passenger kilometer in three different scenario background pdf. Use them to share invaluable insights on forecasted number of passenger kilometer in three different scenario and impress your audience. This template can be altered and modified as per your expectations. So, grab it now.
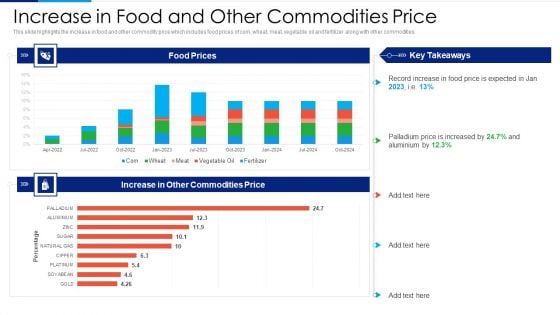
Russia Ukraine Conflict Effect Increase In Food And Other Commodities Price Pictures PDF
This slide highlights the global inflation rises and weakens in global GDP which includes line graph with two scenarios highlighting if disruption is limited and if the military conflict is lengthy. Deliver and pitch your topic in the best possible manner with this Russia Ukraine Conflict Effect Increase In Food And Other Commodities Price Pictures PDF. Use them to share invaluable insights on Global Inflation Rises, Global GDP Weakens, Feb Baseline, Limited Disruption and impress your audience. This template can be altered and modified as per your expectations. So, grab it now.
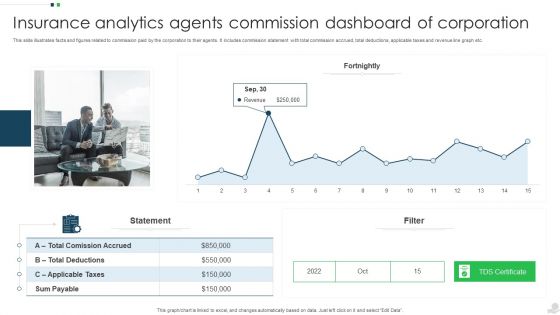
Insurance Analytics Agents Commission Dashboard Of Corporation Introduction PDF
This slide illustrates facts and figures related to commission paid by the corporation to their agents. It includes commission statement with total commission accrued, total deductions, applicable taxes and revenue line graph etc. Pitch your topic with ease and precision using this Insurance Analytics Agents Commission Dashboard Of Corporation Introduction PDF. This layout presents information on Applicable Taxes, Sum Payable, Revenue. It is also available for immediate download and adjustment. So, changes can be made in the color, design, graphics or any other component to create a unique layout.
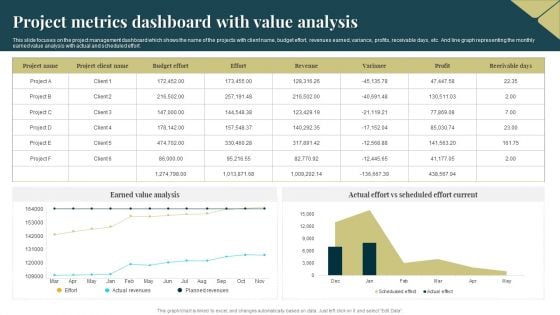
Project Metrics Dashboard With Value Analysis Introduction PDF
This slide focuses on the project management dashboard which shows the name of the projects with client name, budget effort, revenues earned, variance, profits, receivable days, etc. And line graph representing the monthly earned value analysis with actual and scheduled effort. Showcasing this set of slides titled Project Metrics Dashboard With Value Analysis Introduction PDF. The topics addressed in these templates are Budget Effort, Revenues, Earned Value Analysis. All the content presented in this PPT design is completely editable. Download it and make adjustments in color, background, font etc. as per your unique business setting.
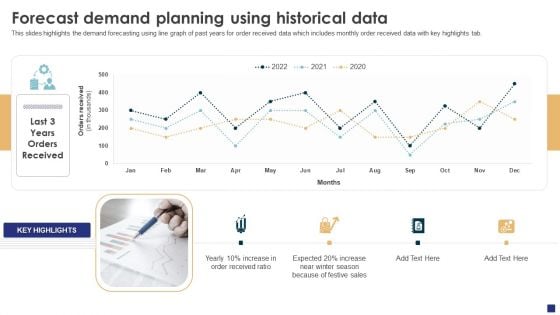
Comprehensive Guide To Ecommerce Forecast Demand Planning Using Historical Data Designs PDF
This slides highlights the demand forecasting using line graph of past years for order received data which includes monthly order received data with key highlights tab. Make sure to capture your audiences attention in your business displays with our gratis customizable Comprehensive Guide To Ecommerce Forecast Demand Planning Using Historical Data Designs PDF. These are great for business strategies, office conferences, capital raising or task suggestions. If you desire to acquire more customers for your tech business and ensure they stay satisfied, create your own sales presentation with these plain slides.
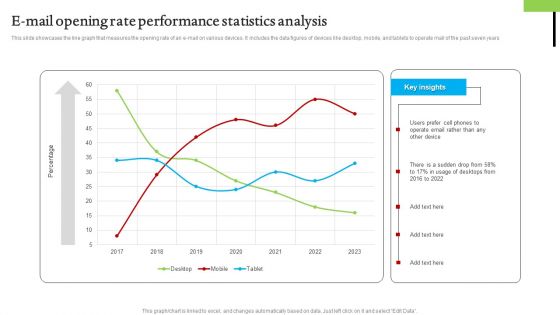
E Mail Opening Rate Performance Statistics Analysis Mockup PDF
This slide showcases the line graph that measures the opening rate of an e-mail on various devices. It includes the data figures of devices like desktop, mobile, and tablets to operate mail of the past seven years. Showcasing this set of slides titled E Mail Opening Rate Performance Statistics Analysis Mockup PDF. The topics addressed in these templates are E Mail Opening Rate, Performance Statistics Analysis. All the content presented in this PPT design is completely editable. Download it and make adjustments in color, background, font etc. as per your unique business setting.
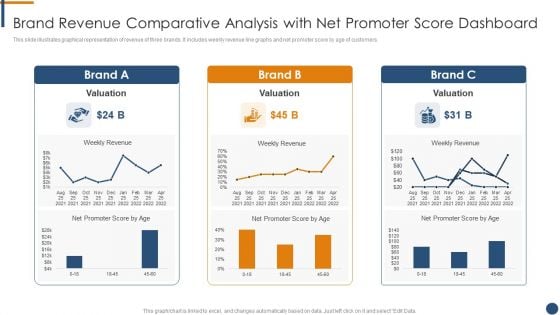
Brand Revenue Comparative Analysis With Net Promoter Score Dashboard Mockup PDF
This slide illustrates graphical representation of revenue of three brands. It includes weekly revenue line graphs and net promoter score by age of customers.Pitch your topic with ease and precision using this Brand Revenue Comparative Analysis With Net Promoter Score Dashboard Mockup PDF. This layout presents information on Brand Revenue Comparative Analysis With Net Promoter Score Dashboard. It is also available for immediate download and adjustment. So, changes can be made in the color, design, graphics or any other component to create a unique layout.
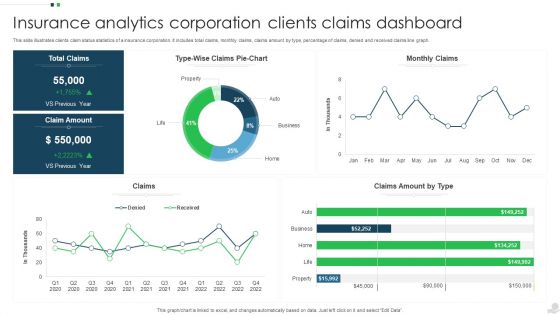
Insurance Analytics Corporation Clients Claims Dashboard Summary PDF
This slide illustrates clients claim status statistics of a insurance corporation. It includes total claims, monthly claims, claims amount by type, percentage of claims, denied and received claims line graph. Showcasing this set of slides titled Insurance Analytics Corporation Clients Claims Dashboard Summary PDF. The topics addressed in these templates are Insurance Analytics Corporation, Clients Claims Dashboard. All the content presented in this PPT design is completely editable. Download it and make adjustments in color, background, font etc. as per your unique business setting.
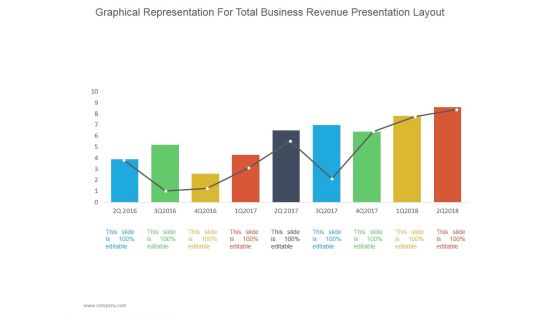
Graphical Representation For Total Business Revenue Ppt PowerPoint Presentation Diagrams
This is a graphical representation for total business revenue ppt powerpoint presentation diagrams. This is a nine stage process. The stages in this process are business, strategy, line chart, bar graph, marketing, management.
Market Potential Land And Property Marketplace Pitch Deck PPT Sample
This slide presents a line graph showcasing the real estate platform market potential in Latin America. It also highlights market opportunities by highlighting market size forecast, CAGR, active user numbers in Latin America. Are you in need of a template that can accommodate all of your creative concepts This one is crafted professionally and can be altered to fit any style. Use it with Google Slides or PowerPoint. Include striking photographs, symbols, depictions, and other visuals. Fill, move around, or remove text boxes as desired. Test out color palettes and font mixtures. Edit and save your work, or work with colleagues. Download Market Potential Land And Property Marketplace Pitch Deck PPT Sample and observe how to make your presentation outstanding. Give an impeccable presentation to your group and make your presentation unforgettable. This slide presents a line graph showcasing the real estate platform market potential in Latin America. It also highlights market opportunities by highlighting market size forecast, CAGR, active user numbers in Latin America.

American Financial Background PowerPoint Templates And PowerPoint Backgrounds 0711
Microsoft PowerPoint Template and Background with vintage united states silver certificate under red white and blue american flag with declining graph line Honest effort always shows through. Our American Financial Background PowerPoint Templates And PowerPoint Backgrounds 0711 are a good example.
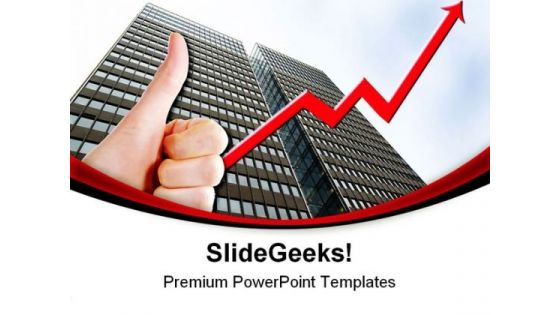
Business02 Success PowerPoint Templates And PowerPoint Backgrounds 0711
Microsoft PowerPoint Template and Background with a thumbs up with a graph line going up with a tall business building Force an outcome with our Business02 Success PowerPoint Templates And PowerPoint Backgrounds 0711. Try us out and see what a difference our templates make.
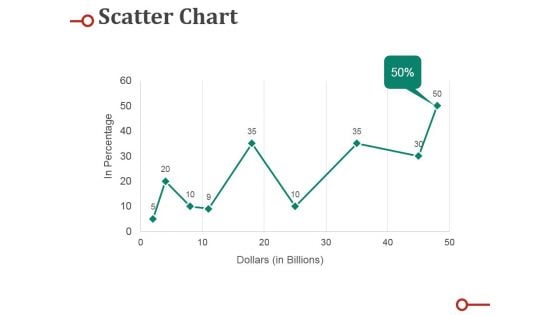
Scatter Chart Ppt PowerPoint Presentation Professional Deck
This is a scatter chart ppt powerpoint presentation professional deck. This is a nine stage process. The stages in this process are percentage, business, marketing, graph, line.
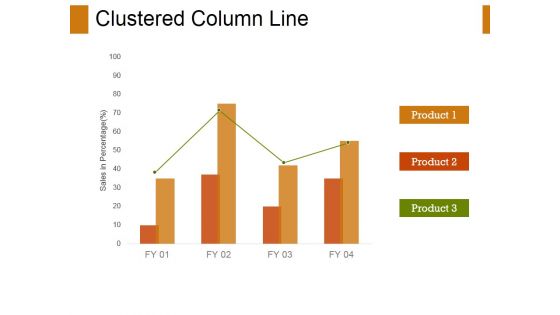
Clustered Column-Line Ppt PowerPoint Presentation Ideas Diagrams
This is a clustered column-line ppt powerpoint presentation ideas diagrams. This is a three stage process. The stages in this process are clustered column line, business, finance, marketing, strategy.
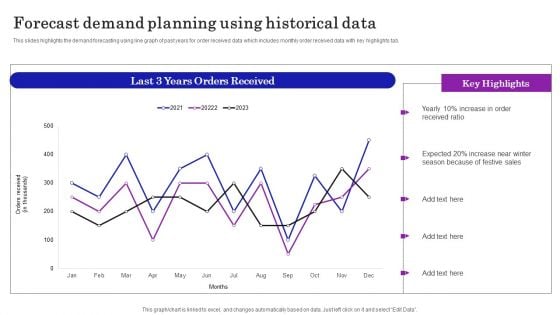
Supply Chain Planning To Enhance Logistics Process Forecast Demand Planning Using Historical Data Ideas PDF
This slides highlights the demand forecasting using line graph of past years for order received data which includes monthly order received data with key highlights tab. Slidegeeks is here to make your presentations a breeze with Supply Chain Planning To Enhance Logistics Process Forecast Demand Planning Using Historical Data Ideas PDF With our easy to use and customizable templates, you can focus on delivering your ideas rather than worrying about formatting. With a variety of designs to choose from, you are sure to find one that suits your needs. And with animations and unique photos, illustrations, and fonts, you can make your presentation pop. So whether you are giving a sales pitch or presenting to the board, make sure to check out Slidegeeks first.
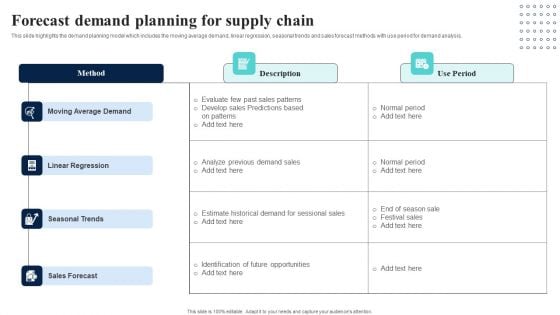
Supply Network Planning And Administration Tactics Forecast Demand Planning Structure PDF
This slides highlights the demand forecasting using line graph of past years for order received data which includes monthly order received data with key highlights tab. Get a simple yet stunning designed Supply Network Planning And Administration Tactics Forecast Demand Planning Structure PDF. It is the best one to establish the tone in your meetings. It is an excellent way to make your presentations highly effective. So, download this PPT today from Slidegeeks and see the positive impacts. Our easy to edit Supply Network Planning And Administration Tactics Forecast Demand Planning Structure PDF can be your go to option for all upcoming conferences and meetings. So, what are you waiting for Grab this template today.
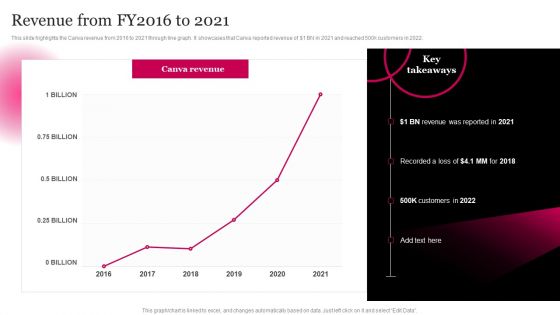
Picture Editing Company Outline Revenue From FY2016 To 2021 Rules PDF
This slide highlights the Canva revenue from 2016 to 2021 through line graph. It showcases that Canva reported revenue of doller 1 BN in 2021 and reached 500k customers in 2022. Slidegeeks is here to make your presentations a breeze with Picture Editing Company Outline Revenue From FY2016 To 2021 Rules PDF With our easy to use and customizable templates, you can focus on delivering your ideas rather than worrying about formatting. With a variety of designs to choose from, you are sure to find one that suits your needs. And with animations and unique photos, illustrations, and fonts, you can make your presentation pop. So whether you are giving a sales pitch or presenting to the board, make sure to check out Slidegeeks first.
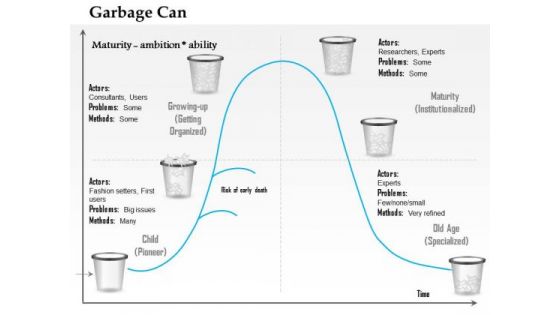
Business Framework Garbage Can Life Cycle Model PowerPoint Presentation
This image slide has been designed to display garbage can model of organizational choice. This image slide has been designed with graph having garbage line to calculate maturity. Use this image slide in business and marketing presentations. This image slide will enhance the quality of your presentations.
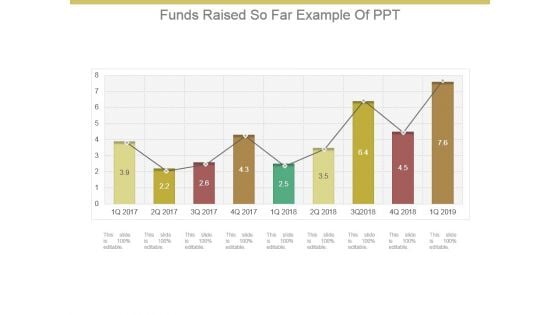
Funds Raised So Far Example Of Ppt
This is a funds raised so far example of ppt. This is a nine stage process. The stages in this process are business, marketing, graph, management, line.

Byjus Investor Capital Financing Pitch Deck Byjus Annual Revenue And Growth Rate Background PDF
This slide provides information about the annual revenue and growth rate of Byjus in terms of graph and line chart for 3 years.Deliver an awe inspiring pitch with this creative Byjus Investor Capital Financing Pitch Deck Byjus Annual Revenue And Growth Rate Background PDF bundle. Topics like Annual Revenue, Annual Growth, Previous Period can be discussed with this completely editable template. It is available for immediate download depending on the needs and requirements of the user.
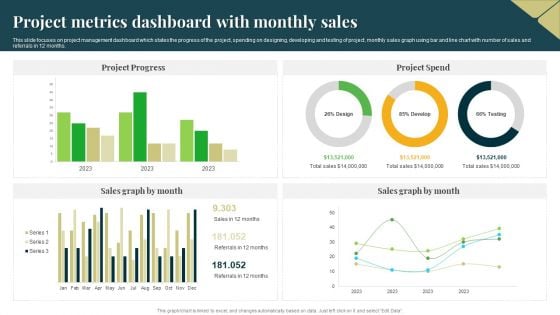
Project Metrics Dashboard With Monthly Sales Professional PDF
This slide focuses on project management dashboard which states the progress of the project, spending on designing, developing and testing of project, monthly sales graph using bar and line chart with number of sales and referrals in 12 months. Pitch your topic with ease and precision using this Project Metrics Dashboard With Monthly Sales Professional PDF. This layout presents information on Project Progress, Project Spend, Sales Graph. It is also available for immediate download and adjustment. So, changes can be made in the color, design, graphics or any other component to create a unique layout.
Bar Graph01 Business PowerPoint Templates And PowerPoint Backgrounds 1211
Microsoft PowerPoint Template and Background with colorful bar graph Our Bar Graph01 Business PowerPoint Templates And PowerPoint Backgrounds 1211 add it all up. Count on them to deliver the numbers.
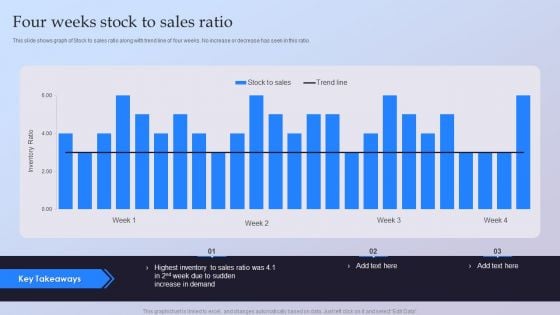
Four Weeks Stock To Sales Ratio Ppt Ideas Guide PDF
This slide shows graph of Stock to sales ratio along with trend line of four weeks. No increase or decrease has seen in this ratio. Pitch your topic with ease and precision using this Four Weeks Stock To Sales Ratio Ppt Ideas Guide PDF. This layout presents information on Highest Inventory, Sales Ratio, Increase Demand. It is also available for immediate download and adjustment. So, changes can be made in the color, design, graphics or any other component to create a unique layout.
Bar Graph01 Finance PowerPoint Templates And PowerPoint Themes 0512
Microsoft Powerpoint Templates and Background with bar chart growth-These templates can be used for presentations relating to-Bar chart growth, abstract, business, finance, success, marketing-Bar Graph01 Finance PowerPoint Templates And PowerPoint Themes 0512 Explanations are a cinch with our Bar Graph01 Finance PowerPoint Templates And PowerPoint Themes 0512. Your thoughts will be easily accepted.
Bar Graph02 Success PowerPoint Templates And PowerPoint Themes 0512
Microsoft Powerpoint Templates and Background with bar chart growth-These templates can be used for presentations relating to-Bar chart growth, abstract, business, finance, success, marketing-Bar Graph02 Success PowerPoint Templates And PowerPoint Themes 0512 Take your cause forward with passion. Our Bar Graph02 Success PowerPoint Templates And PowerPoint Themes 0512 will espouse your thoughts.

Success Bar Graph01 Future PowerPoint Templates And PowerPoint Themes 0512
Microsoft Powerpoint Templates and Background with success Do not go purely by the face value of our Success Bar Graph01 Future PowerPoint Templates And PowerPoint Themes 0512. Dwell on them and you will discover lot's more.
Graph01 Finance PowerPoint Templates And PowerPoint Backgrounds 0511
Microsoft PowerPoint Template and Background with financial computing deskto computer with bar chart Delve on the cold facts in detail. Explain the factual analysis on our Graph01 Finance PowerPoint Templates And PowerPoint Backgrounds 0511.
Graph01 Business PowerPoint Templates And PowerPoint Backgrounds 0611
Microsoft PowerPoint Template and Background with confident businessman climbing a bar chart Our Graph01 Business PowerPoint Templates And PowerPoint Backgrounds 0611 team love fact finding missions. They enjoy bringing the truth to you.
Graph02 Business PowerPoint Templates And PowerPoint Backgrounds 0611
Microsoft PowerPoint Template and Background with a bar chart showing falling profits Create dreams with our Graph02 Business PowerPoint Templates And PowerPoint Backgrounds 0611. Give your audience a dose of fascination.
Graph01 Finance PowerPoint Themes And PowerPoint Slides 0511
Microsoft PowerPoint Slide and Theme with financial computing deskto computer with bar chart Interpret plans with our Graph01 Finance PowerPoint Themes And PowerPoint Slides 0511. Download without worries with our money back guaranteee.
Profit Graph01 Business PowerPoint Templates And PowerPoint Themes 0512
Microsoft Powerpoint Templates and Background with bar chart growth-Profit Graph01 Business PowerPoint Templates And PowerPoint Themes 0512-These PowerPoint designs and slide layouts can be used for themes relating to -Bar chart growth, shapes, business, finance, success, marketing Address eco-clubs with our Profit Graph01 Business PowerPoint Templates And PowerPoint Themes 0512. Advocate curbing of carbon emissions.
Bar Graph01 Business PowerPoint Templates And PowerPoint Themes 0512
Microsoft Powerpoint Templates and Background with bar graph-Bar Graph01 Business PowerPoint Templates And PowerPoint Themes 0512-These PowerPoint designs and slide layouts can be used for themes relating to -Bar graph,success, marketing, sales, business, finance Charge your account with our Bar Graph01 Business PowerPoint Templates And PowerPoint Themes 0512. Earn the interest of your audience.
Bar Graph01 Success PowerPoint Templates And PowerPoint Themes 0512
Microsoft Powerpoint Templates and Background with success-Bar Graph01 Success PowerPoint Templates And PowerPoint Themes 0512-These PowerPoint designs and slide layouts can be used for themes relating to -Success, business, shapes, marketing, sales, finance Exhibit your erudition on our Bar Graph01 Success PowerPoint Templates And PowerPoint Themes 0512. Give the audience a taste of your profound knowledge.


 Continue with Email

 Home
Home


