Linear Programming
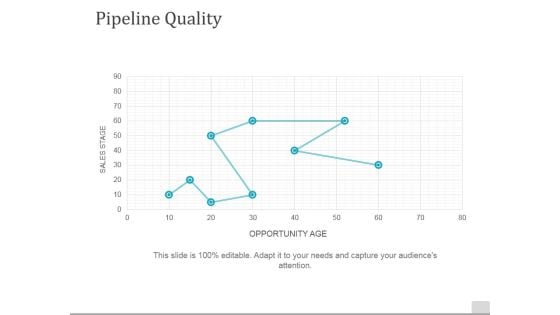
Pipeline Quality Template 2 Ppt PowerPoint Presentation Inspiration Show
This is a pipeline quality template 2 ppt powerpoint presentation inspiration show. This is a one stage process. The stages in this process are sales stage, opportunity age, pipeline, quality, line chart.
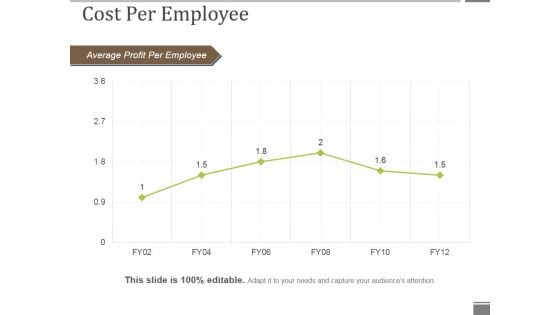
Cost Per Employee Ppt PowerPoint Presentation Model Graphics Download
This is a cost per employee ppt powerpoint presentation model graphics download. This is a six stage process. The stages in this process are average profit per employee, line chart, business, marketing, management.
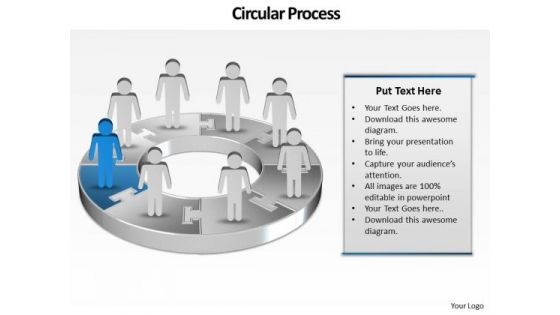
Ppt Group Of People Pie Chart Person Presentation Standing Blue Piece PowerPoint Templates
PPT group of people pie chart person presentation standing blue piece PowerPoint Templates-This PowerPoint Diagram shows the Round Description of steps which are involved in development Process. It includes Eight Steps. You can change color, size and orientation of any icon to your liking.-PPT group of people pie chart person presentation standing blue piece PowerPoint Templates-arrow, bar, business, businessman, candidate, cartoon, character, chart, circle, circular, client, communication, company, concept, diagram, finance, growth, human, illustration, increase, information, marketing, person, presentation, process, profit, sales, stats, success, target Expound your logic on our Ppt Group Of People Pie Chart Person Presentation Standing Blue Piece PowerPoint Templates. Let them in on your chain of thought.
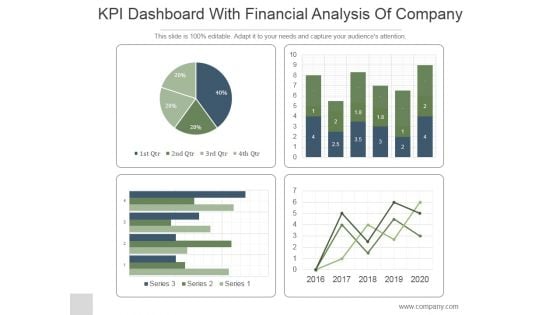
KPI Dashboard With Financial Analysis Of Company Ppt PowerPoint Presentation Backgrounds
This is a kpi dashboard with financial analysis of company ppt powerpoint presentation backgrounds. This is a four stage process. The stages in this process are business, strategy, marketing, line graph, finance.
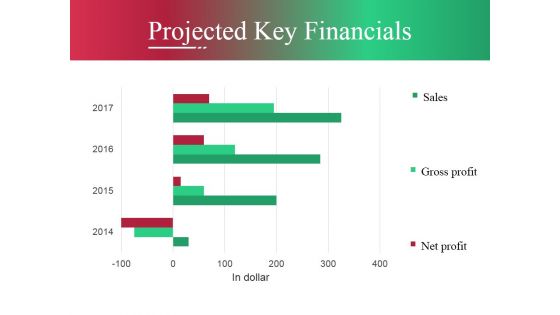
Projected Key Financials Ppt PowerPoint Presentation Pictures Master Slide
This is a projected key financials ppt powerpoint presentation pictures master slide. This is a three stage process. The stages in this process are business, marketing, line, graph, success.
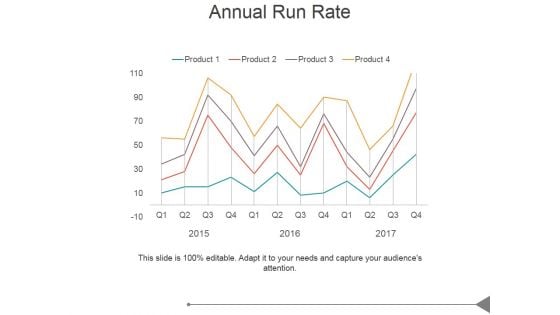
Annual Run Rate Ppt PowerPoint Presentation Designs Download
This is a annual run rate ppt powerpoint presentation designs download. This is a four stage process. The stages in this process are business, marketing, success, business plan, bar graph.
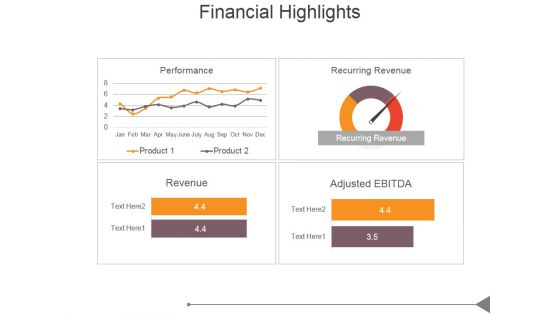
Financial Highlights Template 1 Ppt PowerPoint Presentation Model
This is a financial highlights template 1 ppt powerpoint presentation model. This is a four stage process. The stages in this process are business, marketing, success, business plan, bar graph.
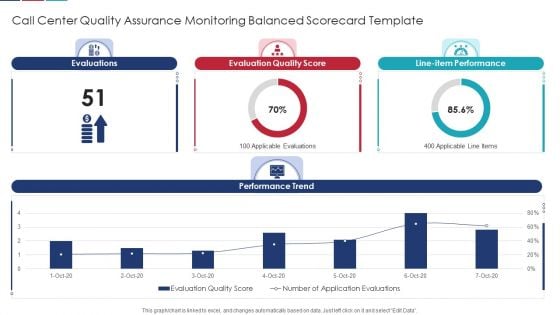
Call Center Quality Assurance Monitoring Balanced Scorecard Template Formats PDF
Deliver and pitch your topic in the best possible manner with this Call Center Quality Assurance Monitoring Balanced Scorecard Template Formats PDF Use them to share invaluable insights on Evaluation Quality, Line Performance, Evaluations and impress your audience. This template can be altered and modified as per your expectations. So, grab it now.
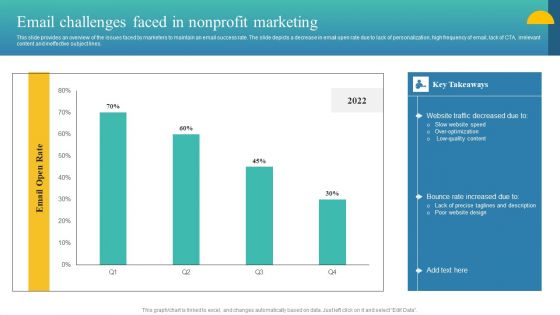
Charity Fundraising Marketing Plan Email Challenges Faced In Nonprofit Marketing Pictures PDF
This slide provides an overview of the issues faced by marketers to maintain an email success rate. The slide depicts a decrease in email open rate due to lack of personalization, high frequency of email, lack of CTA, irrelevant content and ineffective subject lines. Formulating a presentation can take up a lot of effort and time, so the content and message should always be the primary focus. The visuals of the PowerPoint can enhance the presenters message, so our Charity Fundraising Marketing Plan Email Challenges Faced In Nonprofit Marketing Pictures PDF was created to help save time. Instead of worrying about the design, the presenter can concentrate on the message while our designers work on creating the ideal templates for whatever situation is needed. Slidegeeks has experts for everything from amazing designs to valuable content, we have put everything into Charity Fundraising Marketing Plan Email Challenges Faced In Nonprofit Marketing Pictures PDF.
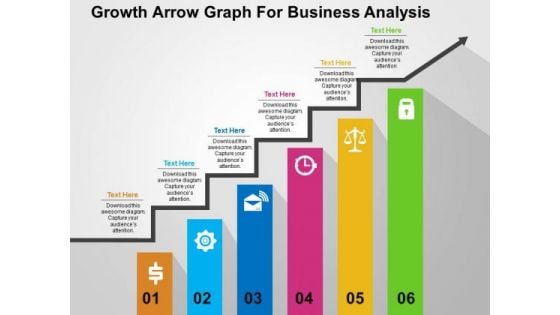
Growth Arrow Graph For Business Analysis PowerPoint Templates
Use this PowerPoint template containing growth arrow graph for business analysis. This PPT slide contains bar graph with icons. This slide is designed to attract the attention of your audience towards business plan evaluation.
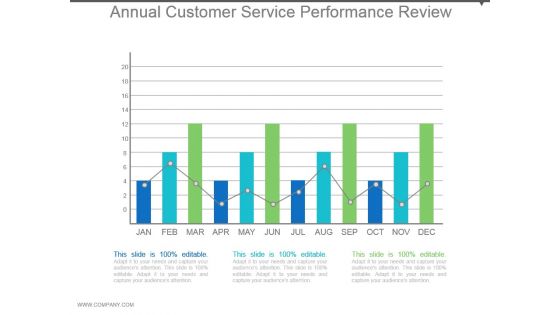
Annual Customer Service Performance Review Example Of Ppt
This is a annual customer service performance review example of ppt. This is a twelve stage process. The stages in this process are bar graph, growth, data, customer, success.
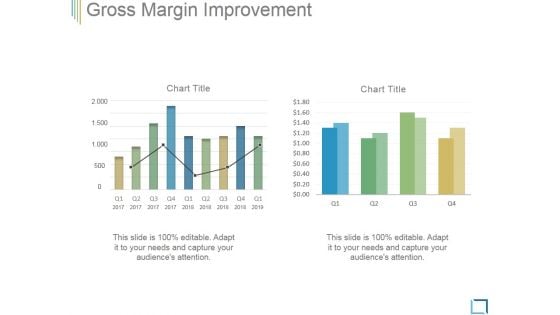
Gross Margin Improvement Ppt PowerPoint Presentation Guidelines
This is a gross margin improvement ppt powerpoint presentation guidelines. This is a two stage process. The stages in this process are business, bar graph, investment, marketing, strategy, success.
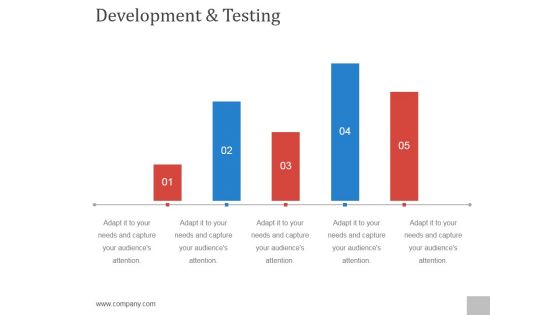
Development And Testing Ppt PowerPoint Presentation Background Designs
This is a development and testing ppt powerpoint presentation background designs. This is a five stage process. The stages in this process are step, business, growth, success, bar graph.
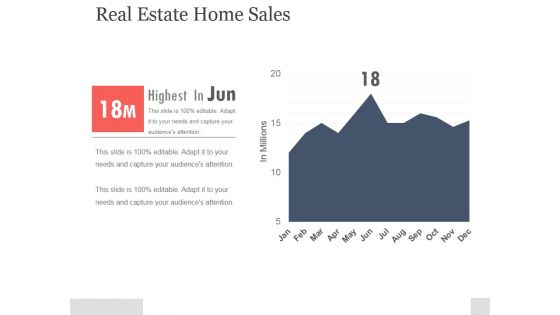
Real Estate Home Sales Ppt PowerPoint Presentation Pictures
This is a real estate home sales ppt powerpoint presentation pictures. This is a one stage process. The stages in this process are bar graph, business, marketing, success, management.
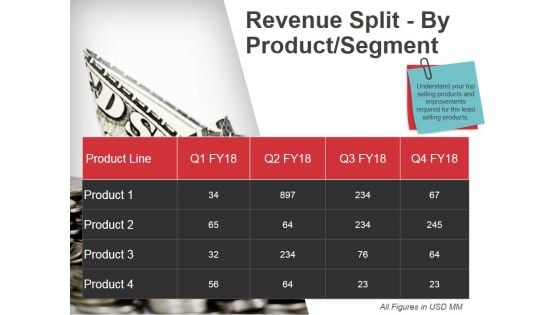
Revenue Split By Product Segment Ppt PowerPoint Presentation Ideas Graphics
This is a revenue split by product segment ppt powerpoint presentation ideas graphics. This is a four stage process. The stages in this process are business, marketing, bar graph, success.
Distribution Growth Ppt PowerPoint Presentation Slides Icons
This is a distribution growth ppt powerpoint presentation slides icons. This is a six stage process. The stages in this process are business, bar graph, finance, marketing, strategy, growth.
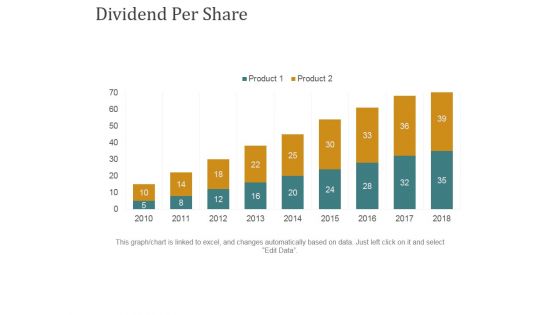
Dividend Per Share Ppt PowerPoint Presentation Summary Rules
This is a dividend per share ppt powerpoint presentation summary rules. This is a nine stage process. The stages in this process are business, bar graph, finance, marketing, strategy, growth.

Staff With Professional Qualification Ppt PowerPoint Presentation Gallery Graphics Pictures
This is a staff with professional qualification ppt powerpoint presentation gallery graphics pictures. This is a five stage process. The stages in this process are qualification, bar graph, business, marketing, success.
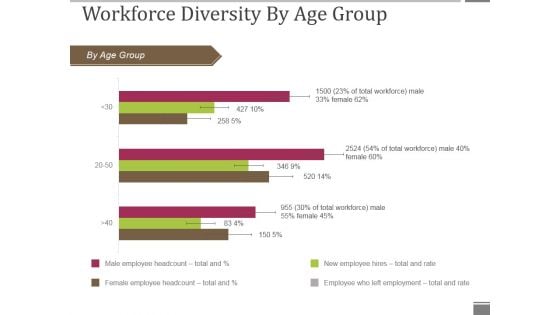
Workforce Diversity By Age Group Ppt PowerPoint Presentation Visual Aids Gallery
This is a workforce diversity by age group ppt powerpoint presentation visual aids gallery. This is a three stage process. The stages in this process are by age group, bar graph, business, marketing, presentation.
Workforce Diversity By Region Ppt PowerPoint Presentation Icon Graphics Pictures
This is a workforce diversity by region ppt powerpoint presentation icon graphics pictures. This is a four stage process. The stages in this process are by region, bar graph, business, presentation, marketing.
Stacked Area Clustered Column Ppt PowerPoint Presentation Icon Aids
This is a stacked area clustered column ppt powerpoint presentation icon aids. This is a three stage process. The stages in this process are business, marketing, finance, bar, graph.
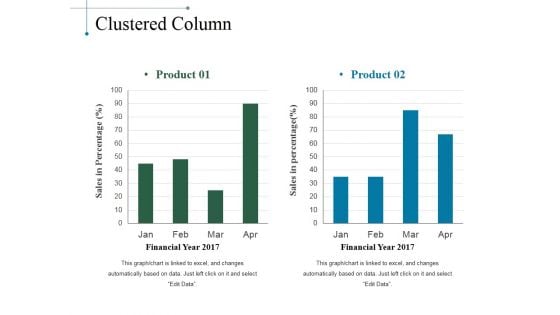
Clustered Column Ppt PowerPoint Presentation Slides Smartart
This is a clustered column ppt powerpoint presentation slides smartart. This is a two stage process. The stages in this process are product, sales in percentage, financial year, bar graph.
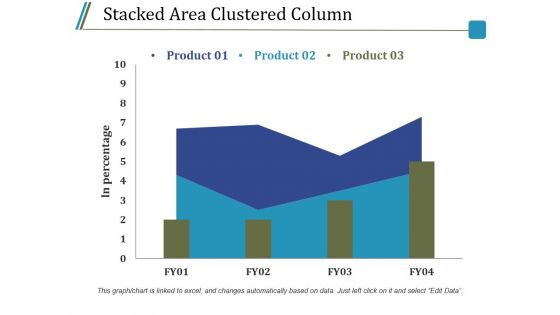
Stacked Area Clustered Column Ppt PowerPoint Presentation Model Guidelines
This is a stacked area clustered column ppt powerpoint presentation model guidelines. This is a three stage process. The stages in this process are product, in percentage, bar graph, growth, success.
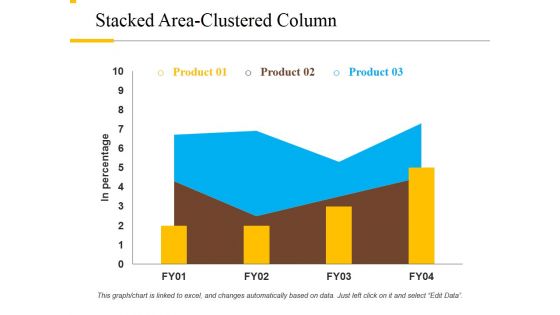
Stacked Area Clustered Column Ppt PowerPoint Presentation File Background Designs
This is a stacked area clustered column ppt powerpoint presentation file background designs. This is a three stage process. The stages in this process are product, in percentage, growth, success, bar graph.
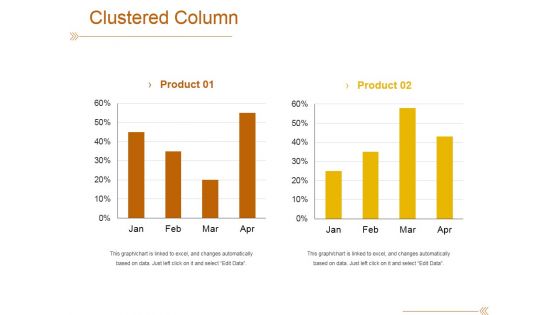
Clustered Column Template 1 Ppt PowerPoint Presentation Outline File Formats
This is a clustered column template 1 ppt powerpoint presentation outline file formats. This is a two stage process. The stages in this process are product, bar graph, success, growth, finance.
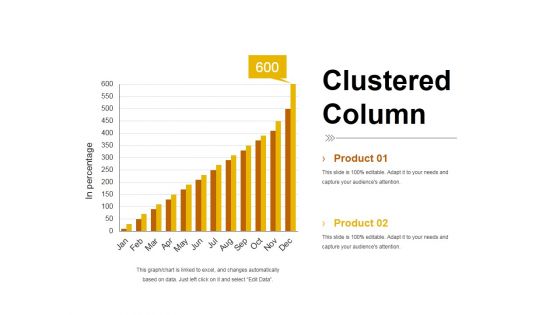
Clustered Column Template 2 Ppt PowerPoint Presentation Summary Smartart
This is a clustered column template 2 ppt powerpoint presentation summary smartart. This is a two stage process. The stages in this process are product, bar graph, in percentage, clustered column, growth.
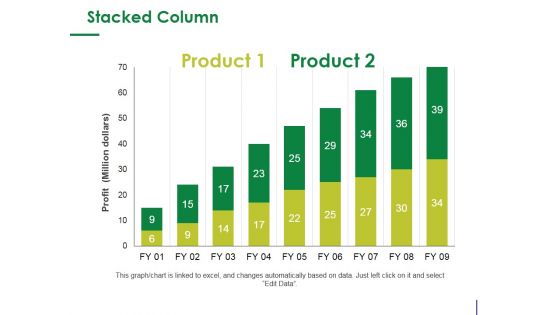
Stacked Column Ppt PowerPoint Presentation Infographic Template Design Ideas
This is a stacked column ppt powerpoint presentation infographic template design ideas. This is a two stage process. The stages in this process are product, profit, bar graph, growth, success.
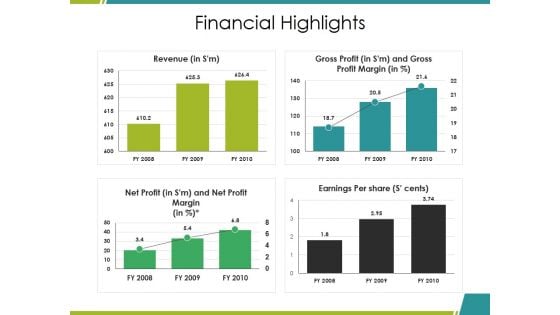
Financial Highlights Ppt PowerPoint Presentation Ideas Graphics Download
This is a financial highlights ppt powerpoint presentation ideas graphics download. This is a four stage process. The stages in this process are revenue, gross profit, net profit, earnings per share, bar graph.
Financial Highlights Ppt PowerPoint Presentation Gallery Graphics Example
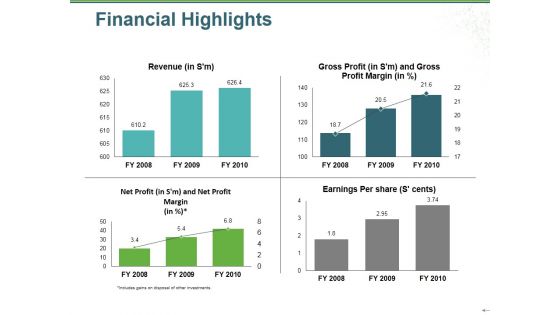
This is a financial highlights ppt powerpoint presentation gallery graphics example. This is a four stage process. The stages in this process are revenue, gross profit, net profit, earnings per share, bar graph.
Quality Cost Report Ppt PowerPoint Presentation Styles Infographic Template
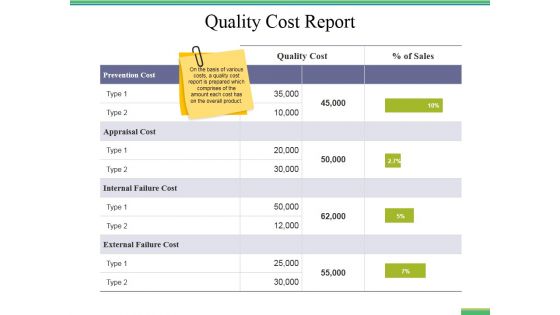
This is a quality cost report ppt powerpoint presentation styles infographic template. This is a five stage process. The stages in this process are business, finance, marketing, strategy, bar graph, analysis.
Competitors Average Price Product Ppt PowerPoint Presentation Inspiration Templates
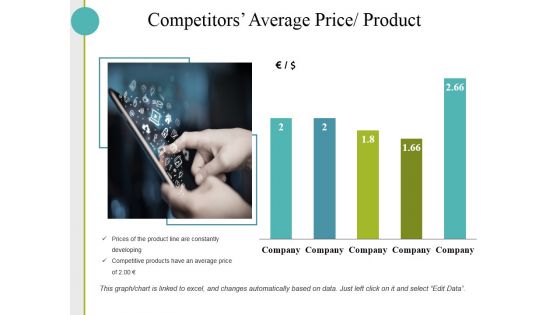
This is a competitors average price product ppt powerpoint presentation inspiration templates. This is a five stage process. The stages in this process are business, finance, analysis, growth, investment, bar graph.
Competitor Revenue And Profit Ppt PowerPoint Presentation Layouts Vector
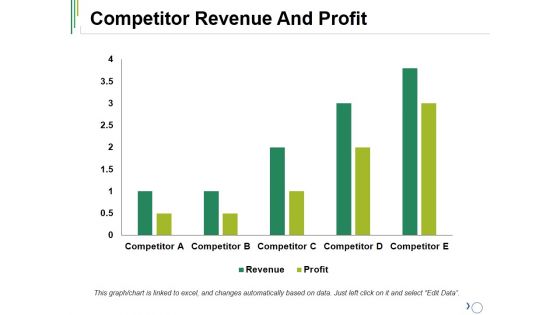
This is a competitor revenue and profit ppt powerpoint presentation layouts vector. This is a five stage process. The stages in this process are competitor, profit, revenue, bar graph, success.
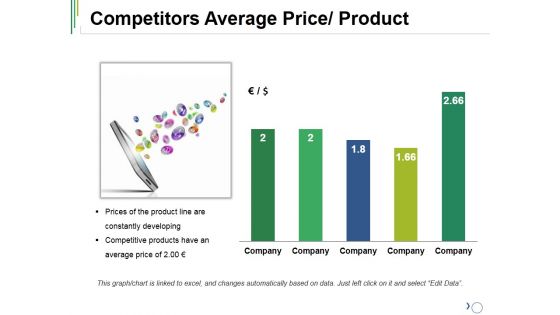
Competitors Average Price Product Ppt PowerPoint Presentation Layouts Infographic Template
This is a competitors average price product ppt powerpoint presentation layouts infographic template. This is a five stage process. The stages in this process are company, bar graph, success, growth, business.
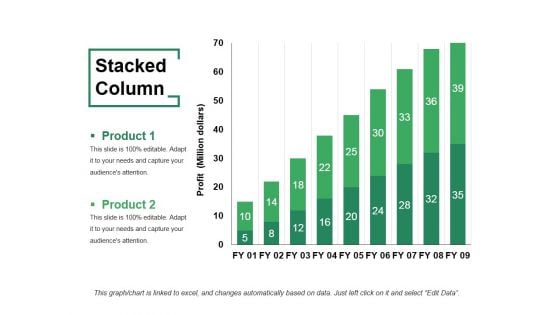
Stacked Column Ppt PowerPoint Presentation Layouts Example
This is a stacked column ppt powerpoint presentation layouts example. This is a two stage process. The stages in this process are product, stacked column, bar graph, growth, success.
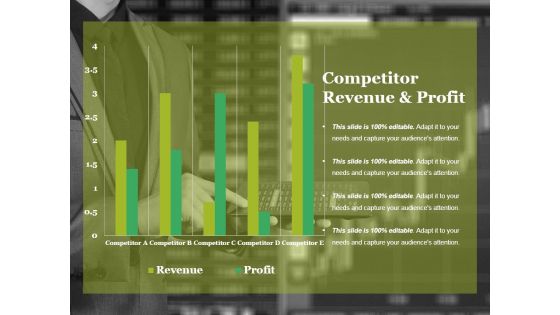
Competitor Revenue And Profit Ppt PowerPoint Presentation Model Templates
This is a competitor revenue and profit ppt powerpoint presentation model templates. This is a five stage process. The stages in this process are revenue, profit, competitor, bar graph, business.
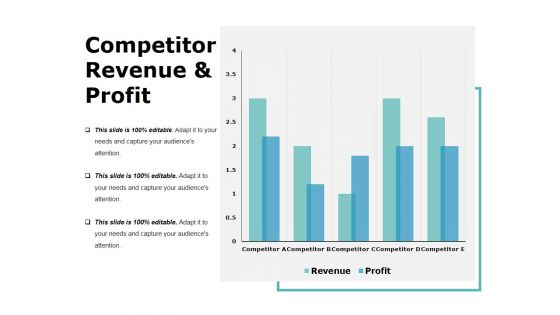
Competitor Revenue And Profit Template 1 Ppt PowerPoint Presentation Layouts Display
This is a competitor revenue and profit template 1 ppt powerpoint presentation layouts display. This is a five stage process. The stages in this process are business, bar graph, finance, marketing, analysis.
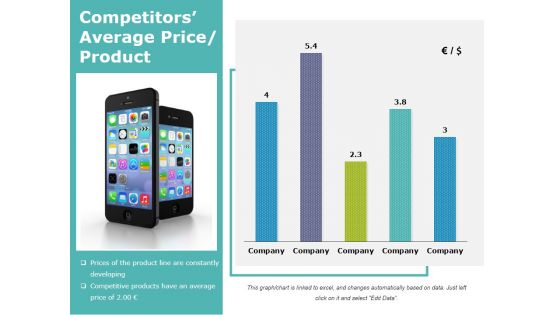
Competitors Average Price Product Ppt PowerPoint Presentation Ideas Layouts
This is a competitors average price product ppt powerpoint presentation ideas layouts. This is a five stage process. The stages in this process are business, bar graph, finance, marketing, analysis.
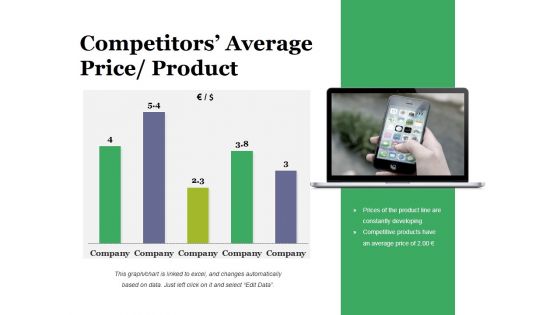
Competitors Average Price Product Ppt PowerPoint Presentation Styles Ideas
This is a competitors average price product ppt powerpoint presentation styles ideas. This is a five stage process. The stages in this process are business, bar graph, finance, marketing, strategy, analysis.
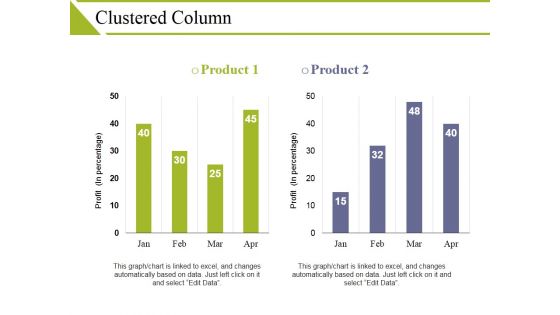
Clustered Column Ppt PowerPoint Presentation Visual Aids Show
This is a clustered column ppt powerpoint presentation visual aids show. This is a two stage process. The stages in this process are product, profit, business, bar graph, finance.
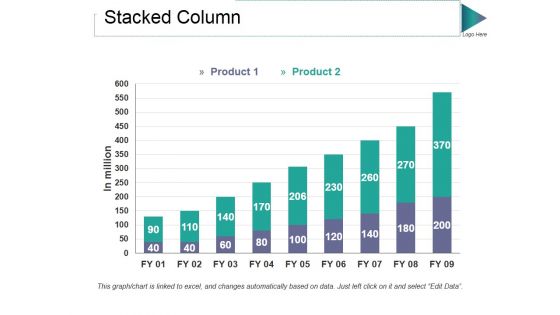
Stacked Column Ppt PowerPoint Presentation Styles Graphic Tips
This is a stacked column ppt powerpoint presentation styles graphic tips. This is a two stage process. The stages in this process are product, in million, bar graph, growth, success.
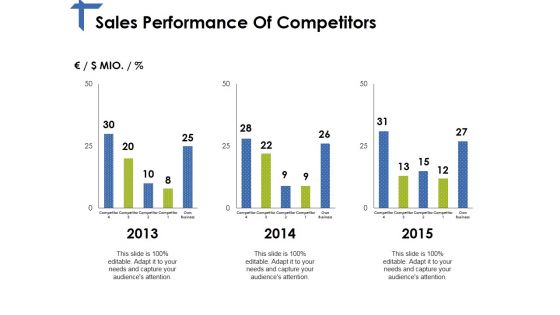
Sales Performance Of Competitors Ppt PowerPoint Presentation Layouts Elements
This is a sales performance of competitors ppt powerpoint presentation layouts elements. This is a three stage process. The stages in this process are years, bar graph, finance, business, marketing.
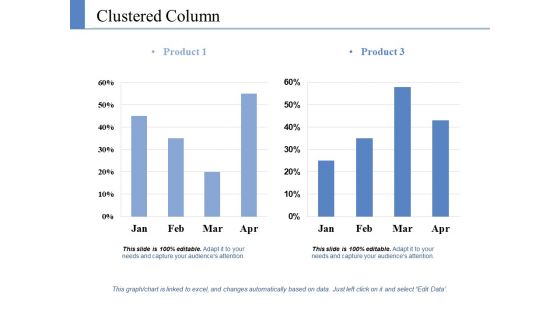
Clustered Column Ppt PowerPoint Presentation Pictures Graphics Template
This is a clustered column ppt powerpoint presentation pictures graphics template. This is a two stage process. The stages in this process are product, growth, success, business, bar graph.
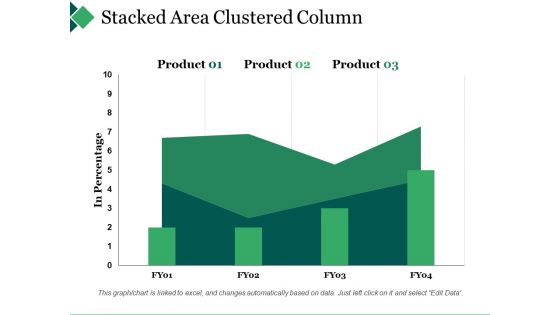
Stacked Area Clustered Column Ppt PowerPoint Presentation Gallery Gridlines
This is a stacked area clustered column ppt powerpoint presentation gallery gridlines. This is a three stage process. The stages in this process are bar graph, product, in percentage.
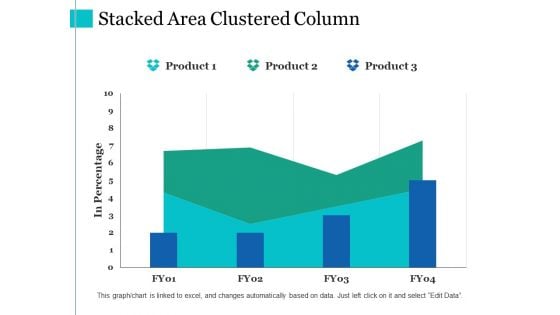
Stacked Area Clustered Column Ppt PowerPoint Presentation Summary Slides
This is a stacked area clustered column ppt powerpoint presentation summary slides. This is a three stage process. The stages in this process are product, in percentage, financial year, bar graph.
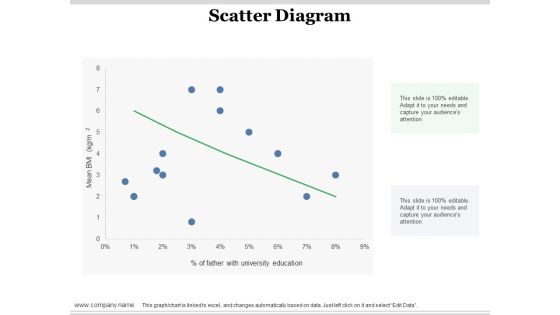
Scatter Diagram Ppt PowerPoint Presentation Infographic Template Design Ideas
This is a scatter diagram ppt powerpoint presentation infographic template design ideas. This is a one stage process. The stages in this process are scatter diagram, finance, in percentage, business, bar graph.
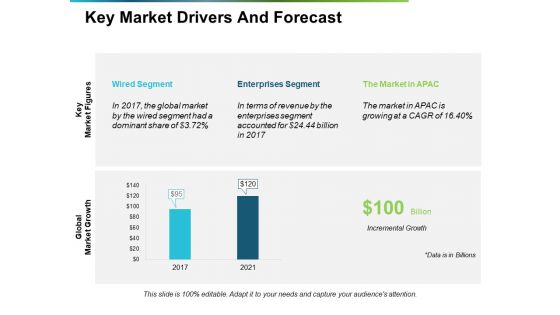
Key Market Drivers And Forecast Ppt PowerPoint Presentation Summary Templates
This is a key market drivers and forecast ppt powerpoint presentation summary templates. This is a two stage process. The stages in this process are key market drivers, forecast, growth, bar graph, business.
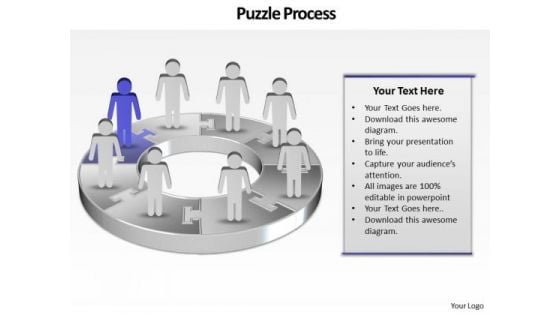
Ppt Group Of People Pie Chart Person Standing Purple Piece PowerPoint Templates
PPT group of people pie chart person standing purple piece PowerPoint Templates-This continual illustration of procedure graphic is a visual representation of your information and ideas. Use this diagram as a method of graphically representing the flow of data as an information processing system.-PPT group of people pie chart person standing purple piece PowerPoint Templates-arrow, bar, business, businessman, candidate, cartoon, character, chart, circle, circular, client, communication, company, concept, diagram, finance, growth, human, illustration, increase, information, marketing, person, presentation, process, profit, sales, stats, success, target Establish your command over the subject. Display your awareness with our Ppt Group Of People Pie Chart Person Standing Purple Piece PowerPoint Templates.
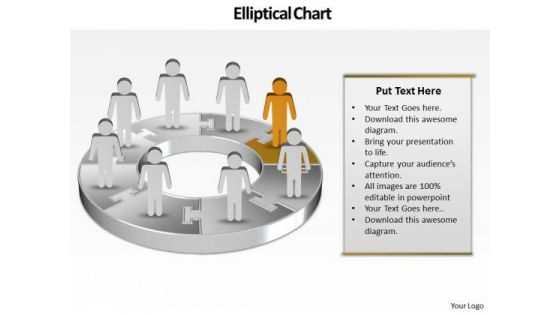
Ppt Team Work Person Presentation Standing Orange Piece Of Chart PowerPoint Templates
PPT team work person presentation standing orange piece of chart PowerPoint Templates-Use this graphical approach to represent global business issues such as financial data, stock market Exchange, increase in sales, corporate presentations and more. Create captivating presentations to deliver comparative and weighted arguments.-PPT team work person presentation standing orange piece of chart PowerPoint Templates-arrow, bar, business, businessman, candidate, cartoon, character, chart, circle, circular, client, communication, company, concept, diagram, finance, financial, flow, growth, human, illustration, increase, information, iteration, man, market, marketing, process, processing, profit, sales, statistics, stats, success, target Bounce back with our Ppt Team Work Person Presentation Standing Orange Piece Of Chart PowerPoint Templates. You will come out on top.

Business Planning Strategy 3d Render Of Butterfly Characters
Deliver The Right Dose With Our Business Planning Strategy 3D Render Of Butterfly Characters Powerpoint Templates. Your Ideas Will Get The Correct Illumination.
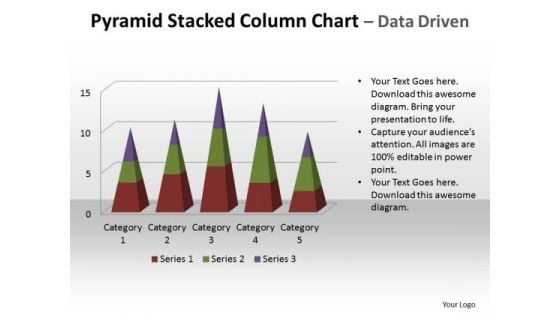
Business Marketing PowerPoint Templates Business Pyramid Stacked Column Chart Ppt Slides
Business Marketing PowerPoint Templates Business pyramid stacked column chart PPT Slides-This PowerPoint slide has a stacked pyramid chart that looks elegant because of the pyramid shape and the unique angle in which it appears. . This graph is data driven. Business Marketing PowerPoint Templates Business pyramid stacked column chart PPT Slides-This ppt can be used for concepts relating to-3d, 3d-Pie, Area, Bar, Block, Business, Chart, Color, Colour, Column, Cone, Decline, Fill, Finance, Financial, Gradient, Graph, etc. Our Business Marketing PowerPoint Templates Business Pyramid Stacked Column Chart Ppt Slides offer an affordable advantage. Get the edge at no extra expense.
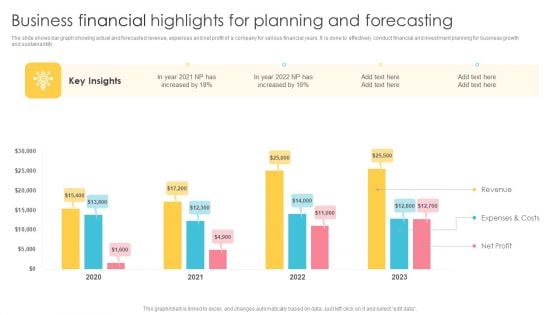
Business Financial Highlights For Planning And Forecasting Background PDF
The slide shows bar graph showing actual and forecasted revenue, expenses and net profit of a company for various financial years. It is done to effectively conduct financial and investment planning for business growth and sustainability. Pitch your topic with ease and precision using this Business Financial Highlights For Planning And Forecasting Background PDF. This layout presents information on Revenue, Expenses And Costs, Net Profit. It is also available for immediate download and adjustment. So, changes can be made in the color, design, graphics or any other component to create a unique layout.
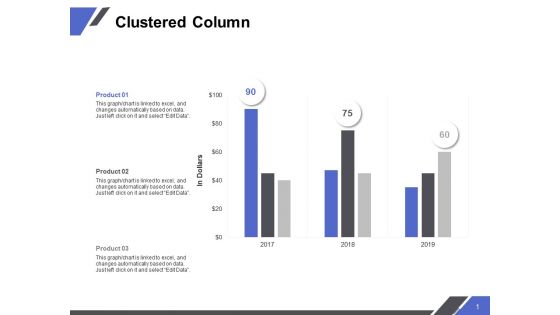
Clustered Column Ppt PowerPoint Presentation Infographic Template Ideas
Presenting this set of slides with name clustered column ppt powerpoint presentation infographic template ideas. The topics discussed in these slide is clustered column line. This is a completely editable PowerPoint presentation and is available for immediate download. Download now and impress your audience.
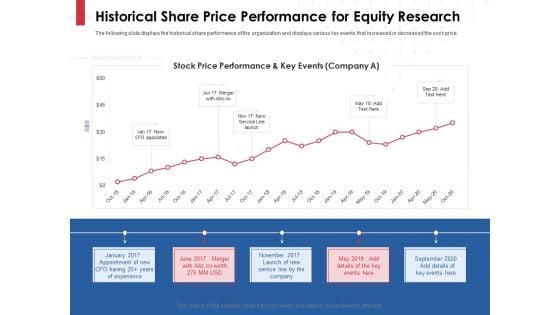
Equity Analysis Project Historical Share Price Performance For Equity Research Ppt PowerPoint Presentation File Slides PDF
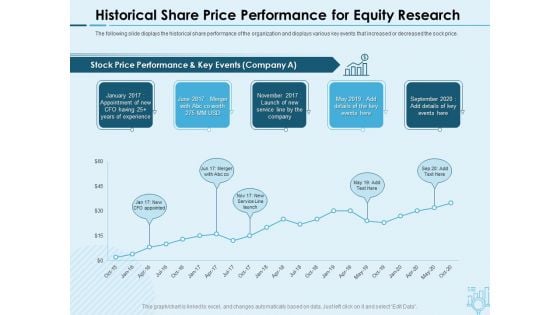
Presenting this set of slides with name equity analysis project historical share price performance for equity research ppt powerpoint presentation file slides pdf. The topics discussed in these slides are stock price performance, key events, service line launch, equity research, cfo appointed. This is a completely editable PowerPoint presentation and is available for immediate download. Download now and impress your audience.
Assessing Stocks In Financial Market Historical Share Price Performance For Equity Research Ppt PowerPoint Presentation Ideas Picture PDF
Presenting this set of slides with name assessing stocks in financial market historical share price performance for equity research ppt powerpoint presentation ideas picture pdf. The topics discussed in these slides are stock price performance, key events, service line launch, equity research, cfo appointed. This is a completely editable PowerPoint presentation and is available for immediate download. Download now and impress your audience.
Inventory Metrics With Cost Of Goods Sold Ppt PowerPoint Presentation Professional Examples PDF
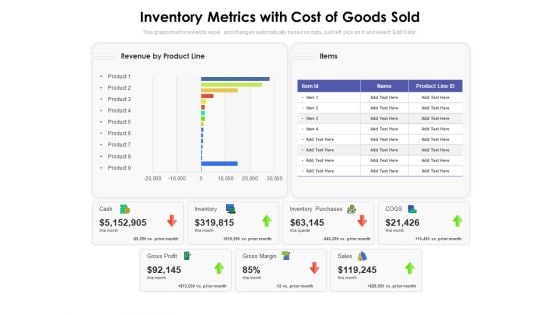
Presenting this set of slides with name inventory metrics with cost of goods sold ppt powerpoint presentation professional examples pdf. The topics discussed in these slides are revenue by product line, items, cash, inventory, inventory purchases, gross profit, prior month, cogs. This is a completely editable PowerPoint presentation and is available for immediate download. Download now and impress your audience.
Mind Map Chart Sales Theme Ppt Business Plan Software PowerPoint Slides
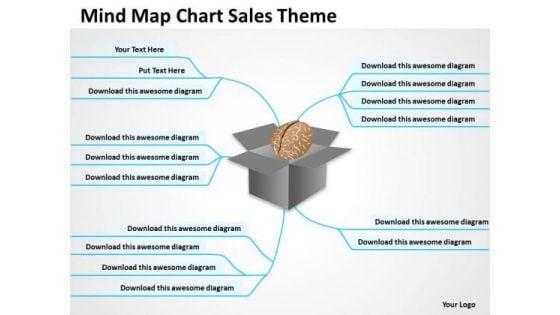
We present our mind map chart sales theme ppt business plan software PowerPoint Slides.Present our Health PowerPoint Templates because You can Bind your ideas with our PowerPoint Templates and Slides. They will add great value to the worth of your package. Download and present our Science PowerPoint Templates because Our PowerPoint Templates and Slides are truly out of this world. Even the MIB duo has been keeping tabs on our team. Present our Boxes PowerPoint Templates because Our PowerPoint Templates and Slides will provide you the cutting edge. Slice through the doubts in the minds of your listeners. Present our Business PowerPoint Templates because You can Create a matrix with our PowerPoint Templates and Slides. Feel the strength of your ideas click into place. Download and present our Mindmaps PowerPoint Templates because our PowerPoint Templates and Slides are the string of your bow. Fire of your ideas and conquer the podium.Use these PowerPoint slides for presentations relating to Mapping, system, planning, who, approach, network, net, twigs, human resources, solving, concept, vector, line, main idea, mind map, diagram, relate, oval, black, idea, manage, illustration, strategy, solution, problem, thinking, sketch, method, organization, connect, link, arrange, information, brainstorm, decision, business plan, branch, analyze, question, structure, action, why, present, effective. The prominent colors used in the PowerPoint template are Gray, Brown, Black. Get on a accelerated career track with our Mind Map Chart Sales Theme Ppt Business Plan Software PowerPoint Slides. They will make you look good.
Sales Steps Process With Gear And Bar Chart Vector Icon Ppt PowerPoint Presentation Infographics Graphics Design PDF
Presenting sales steps process with gear and bar chart vector icon ppt powerpoint presentation infographics graphics design pdf to dispense important information. This template comprises three stages. It also presents valuable insights into the topics including sales steps process with gear and bar chart vector icon. This is a completely customizable PowerPoint theme that can be put to use immediately. So, download it and address the topic impactfully.
Stock Photo Business Graph Of Two Thousand Fifteen PowerPoint Slide
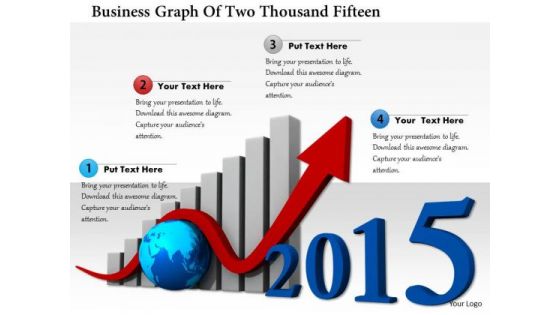
This Business Power Point image template has been designed with graphic of bar graph of 2015 year text. This image template contains the concept of new year planning. This image slide can be used for business and finance related presentations.
Business Graph Success PowerPoint Templates Ppt Backgrounds For Slides 1212
We present our Business Graph Success PowerPoint Templates PPT Backgrounds For Slides 1212.Download our Sales PowerPoint Templates because this slide can help to bullet point your views. Download and present our Business PowerPoint Templates because this template helps you to grab the attention of your listeners. Download and present our Marketing PowerPoint Templates because you are the Champion of your team shall anoint. Present our Finance PowerPoint Templates because this one depicts the popular chart. Download our Success PowerPoint Templates because your quest has taken you well onto the path of success.Use these PowerPoint slides for presentations relating to Business Growth Colorful Bar Diagram, Sales, Business, Marketing, Finance, Success. The prominent colors used in the PowerPoint template are Green, Blue, Red. Professionals tell us our Business Graph Success PowerPoint Templates PPT Backgrounds For Slides 1212 are Radiant. Use our Finance PowerPoint templates and PPT Slides are Lush. We assure you our Business Graph Success PowerPoint Templates PPT Backgrounds For Slides 1212 are Ultra. We assure you our Colorful PowerPoint templates and PPT Slides are Pleasant. Presenters tell us our Business Graph Success PowerPoint Templates PPT Backgrounds For Slides 1212 are the best it can get when it comes to presenting. PowerPoint presentation experts tell us our Diagram PowerPoint templates and PPT Slides are designed by a team of presentation professionals. Have an exhilirating event with our Business Graph Success PowerPoint Templates Ppt Backgrounds For Slides 1212. Feel a surge of excitement in you.
Stakeholder Evaluation Plan Dashboard With Acceptance Level Of New Reforms Background PDF
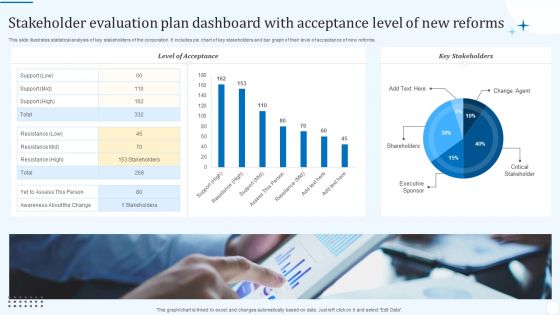
This slide illustrates statistical analysis of key stakeholders of the corporation. It includes pie chart of key stakeholders and bar graph of their level of acceptance of new reforms. Showcasing this set of slides titled Stakeholder Evaluation Plan Dashboard With Acceptance Level Of New Reforms Background PDF. The topics addressed in these templates are Level Acceptance, Key Stakeholders, Critical Stakeholder. All the content presented in this PPT design is completely editable. Download it and make adjustments in color, background, font etc. as per your unique business setting.


 Continue with Email

 Home
Home


