Linear Programming
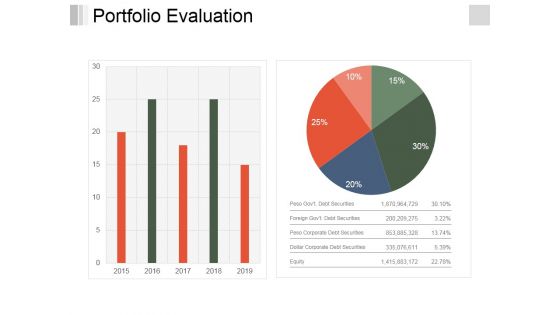
Portfolio Evaluation Ppt PowerPoint Presentation Infographics Objects
This is a portfolio evaluation ppt powerpoint presentation infographics objects. This is a two stage process. The stages in this process are business, finance, bar graph, pie chart, marketing, analysis, investment.
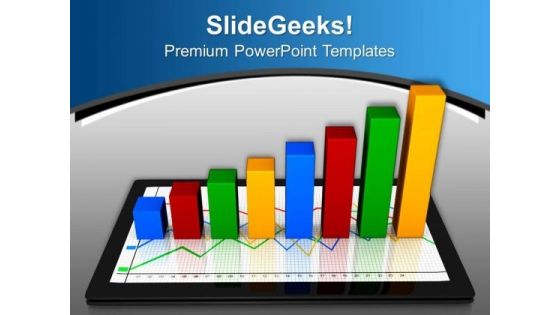
Tablet With Growth Graph Business PowerPoint Templates And PowerPoint Themes 0912
Tablet With Growth Graph Business PowerPoint Templates And PowerPoint Themes 0912-Microsoft Powerpoint Templates and Background with tablets with a bar graph-Tablets with a bar graph, business, technology, success, finance, marketing Our Tablet With Growth Graph Business PowerPoint Templates And PowerPoint Themes 0912 are evidently advantageous. The balance will tilt in your favour.
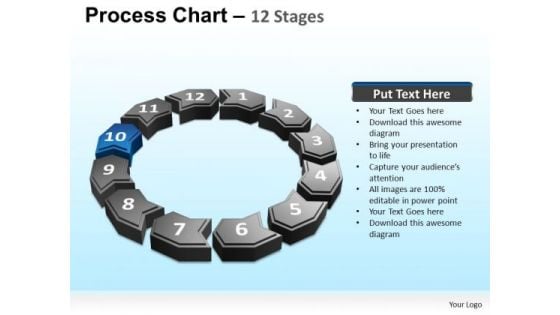
PowerPoint Template Success Cyclical Process Ppt Template
PowerPoint Template Success Cyclical Process PPT Template-The Circle of Life - a concept emmbedded in our minds and hence easy to comprehend. Life and Business is made up of processes comprising stages that flow from one to another. An excellent graphic to attract the attention of and understanding by your audience to improve earnings. Our PowerPoint Template Success Cyclical Process Ppt Template are a great feeder line. They keep the energy coming to you.
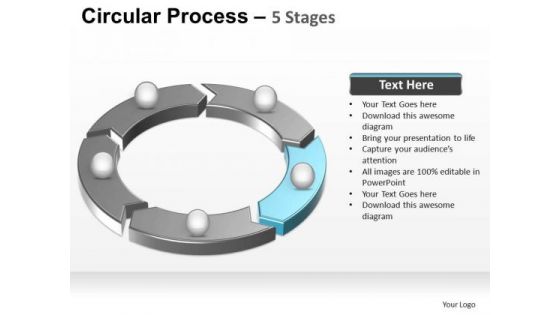
PowerPoint Slide Designs Success Circular Process Ppt Template
PowerPoint Slide Designs Success Circular Process PPT Template-The Circle of Life - a concept embedded in our minds and hence easy to comprehend. Life and Business is made up of processes comprising stages that flow from one to another. An excellent graphic to attract the attention of and understanding by your audience to improve earnings. Build a feeder line of our PowerPoint Slide Designs Success Circular Process Ppt Template. Your thoughts will roll along smoothly.
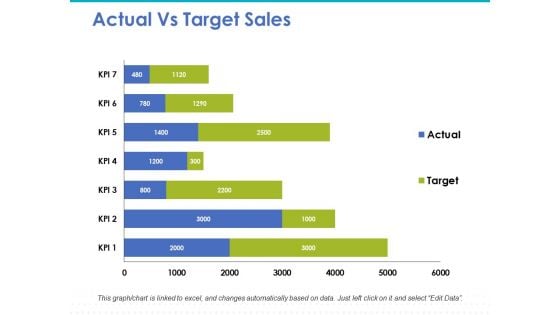
Actual Vs Target Sales Ppt PowerPoint Presentation Slides Template
This is a actual vs target sales ppt powerpoint presentation slides template. This is a seven stage process. The stages in this process are bar chart, marketing, strategy, finance, planning.
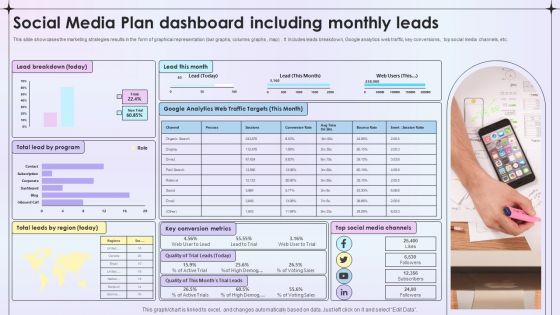
Social Media Plan Dashboard Including Monthly Leads Ppt File Slides PDF
This slide showcases the marketing strategies results in the form of graphical representation bar graphs, columns graphs , map. It includes leads breakdown, Google analytics web traffic, key conversions , top social media channels, etc. Showcasing this set of slides titled Social Media Plan Dashboard Including Monthly Leads Ppt File Slides PDF. The topics addressed in these templates are Lead Breakdown, Key Conversion Metrics, Social Media Channels. All the content presented in this PPT design is completely editable. Download it and make adjustments in color, background, font etc. as per your unique business setting.
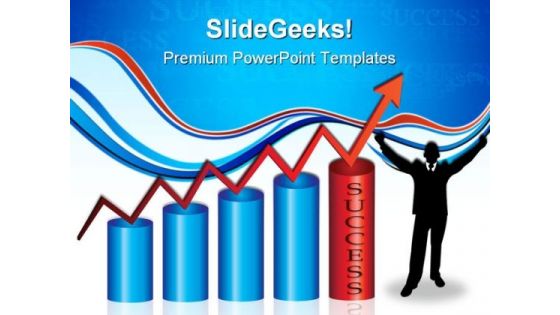
Success Graph Business PowerPoint Templates And PowerPoint Backgrounds 1211
Microsoft PowerPoint Template and Background with bar graph with rising arrow showing success Your presentation will be unparalleled. Design it with our Success Graph Business PowerPoint Templates And PowerPoint Backgrounds 1211. You'll always stay ahead of the game.
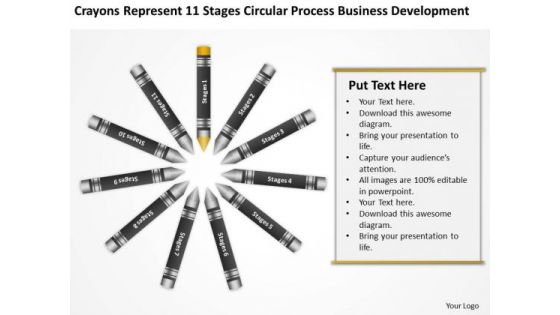
Business Organizational Chart Template Ppt PowerPoint Templates Backgrounds For Slides
We present our business organizational chart template ppt PowerPoint templates backgrounds for slides.Download and present our Communication PowerPoint Templates because Watching this your Audience will Grab their eyeballs, they wont even blink. Present our Finance PowerPoint Templates because Our PowerPoint Templates and Slides will let Your superior ideas hit the target always and everytime. Use our Circle Charts PowerPoint Templates because You are well armed with penetrative ideas. Our PowerPoint Templates and Slides will provide the gunpowder you need. Download our Business PowerPoint Templates because Our PowerPoint Templates and Slides provide you with a vast range of viable options. Select the appropriate ones and just fill in your text. Download our Shapes PowerPoint Templates because Our PowerPoint Templates and Slides will generate and maintain the level of interest you desire. They will create the impression you want to imprint on your audience.Use these PowerPoint slides for presentations relating to pencil, isolated, wallpaper, decoration, vibrant, sketching, row, blank, concept, vector, line, spectrum, bright, template, circle, ring, graphic, pastel, drawing, paint, multicolor, card, assortment, vertical, idea, equipment, multicolored, creative, arrangement, palette, illustration, object, wood, backdrop, design, group, tape, school, pointing, education, draw, art, stripe, wooden, instrument, college, rainbow. The prominent colors used in the PowerPoint template are Yellow, Black, Gray. Set a good example with our Business Organizational Chart Template Ppt PowerPoint Templates Backgrounds For Slides. Be the benchmark for others to follow.
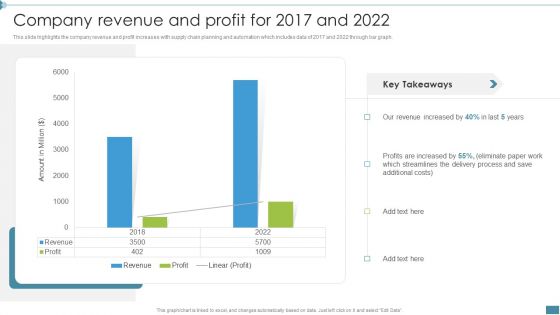
Supply Chain And Logistics Company Profile Company Revenue And Profit For 2017 And 2022 Designs PDF
This slide highlights the company revenue and profit increases with supply chain planning and automation which includes data of 2017 and 2022 through bar graph. Deliver and pitch your topic in the best possible manner with this Supply Chain And Logistics Company Profile Company Revenue And Profit For 2017 And 2022 Designs PDF. Use them to share invaluable insights on Company, Revenue, Profit and impress your audience. This template can be altered and modified as per your expectations. So, grab it now.
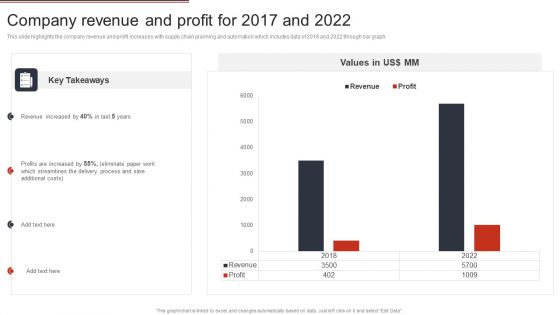
Building Design Firm Details Company Revenue And Profit For 2017 And 2022 Slides PDF
This slide highlights the company revenue and profit increases with supply chain planning and automation which includes data of 2018 and 2022 through bar graph. Deliver an awe inspiring pitch with this creative Building Design Firm Details Company Revenue And Profit For 2017 And 2022 Slides PDF bundle. Topics like Revenue, Profit, 2018 To 2022 can be discussed with this completely editable template. It is available for immediate download depending on the needs and requirements of the user.
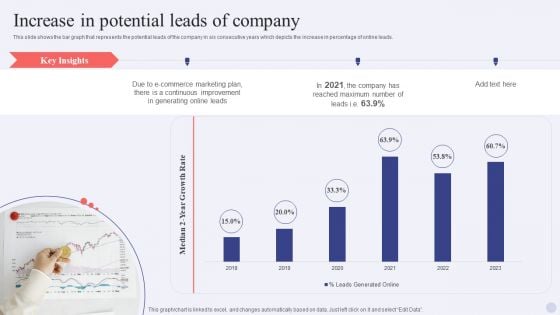
Electronic Commerce Systems Increase In Potential Leads Of Company Graphics PDF
This slide shows the bar graph that represents the potential leads of the company in six consecutive years which depicts the increase in percentage of online leads. Deliver an awe inspiring pitch with this creative Electronic Commerce Systems Increase In Potential Leads Of Company Graphics PDF bundle. Topics like E Commerce Marketing Plan, Generating Online Leads, Continuous Improvement can be discussed with this completely editable template. It is available for immediate download depending on the needs and requirements of the user.
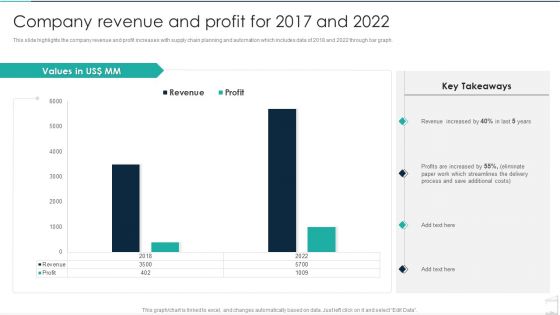
Commercial Construction And Architecture Firm Company Revenue And Profit For 2017 And 2022 Background PDF
This slide highlights the company revenue and profit increases with supply chain planning and automation which includes data of 2018 and 2022 through bar graph. Deliver and pitch your topic in the best possible manner with this Commercial Construction And Architecture Firm Company Revenue And Profit For 2017 And 2022 Background PDF. Use them to share invaluable insights on Revenue, Profits, Costs and impress your audience. This template can be altered and modified as per your expectations. So, grab it now.
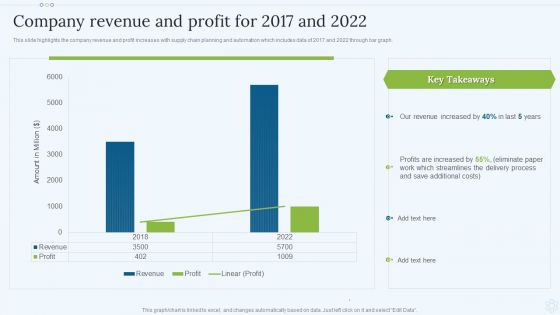
Shipping Services Company Profile Company Revenue And Profit For 2017 And 2022 Background PDF
This slide highlights the company revenue and profit increases with supply chain planning and automation which includes data of 2017 and 2022 through bar graph. Deliver and pitch your topic in the best possible manner with this Shipping Services Company Profile Company Revenue And Profit For 2017 And 2022 Background PDF. Use them to share invaluable insights on Revenue, Additional Costs, Profits and impress your audience. This template can be altered and modified as per your expectations. So, grab it now.
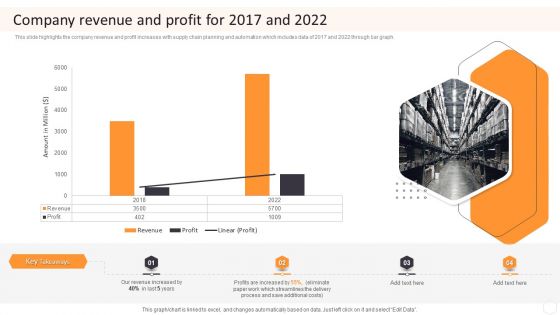
Cargo Logistics Company Profile Company Revenue And Profit For 2017 And 2022 Diagrams PDF
This slide highlights the company revenue and profit increases with supply chain planning and automation which includes data of 2017 and 2022 through bar graph. Deliver an awe inspiring pitch with this creative Cargo Logistics Company Profile Company Revenue And Profit For 2017 And 2022 Diagrams PDF bundle. Topics like Revenue, Profits, Additional Costs can be discussed with this completely editable template. It is available for immediate download depending on the needs and requirements of the user.
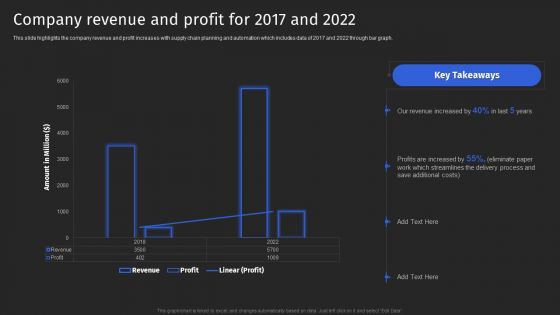
Supply Chain Solutions Business Outline Company Revenue And Profit For 2017 And 2022 Slides PDF
This slide highlights the company revenue and profit increases with supply chain planning and automation which includes data of 2017 and 2022 through bar graph. Deliver and pitch your topic in the best possible manner with this Supply Chain Solutions Business Outline Company Revenue And Profit For 2017 And 2022 Slides PDF. Use them to share invaluable insights on Revenue, Additional Costs, Delivery Process and impress your audience. This template can be altered and modified as per your expectations. So, grab it now.
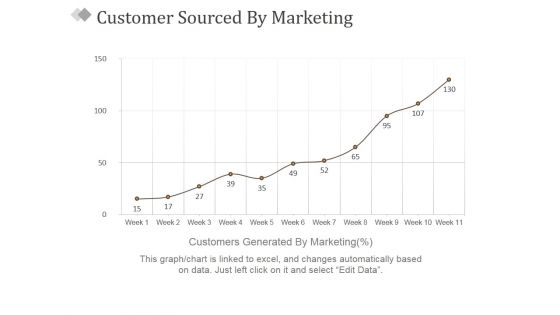
Customer Sourced By Marketing Ppt PowerPoint Presentation Styles Professional
This is a customer sourced by marketing ppt powerpoint presentation styles professional. This is a one stage process. The stages in this process are customers generated by marketing, business, marketing, success, line chart.
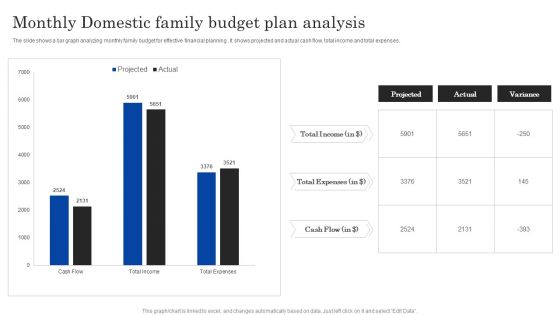
Monthly Domestic Family Budget Plan Analysis Ppt PowerPoint Presentation Portfolio Guide PDF
The slide shows a bar graph analyzing monthly family budget for effective financial planning . It shows projected and actual cash flow, total income and total expenses.Showcasing this set of slides titled Monthly Domestic Family Budget Plan Analysis Ppt PowerPoint Presentation Portfolio Guide PDF. The topics addressed in these templates are Total Income, Total Expenses, Cash Flow. All the content presented in this PPT design is completely editable. Download it and make adjustments in color, background, font etc. as per your unique business setting.
Chart Growth Business PowerPoint Template 0910
Arrow pointing to the higher financial chart bar 3d illustration Enter onto your new path with our Chart Growth Business PowerPoint Template 0910. Your thoughts will make a solid beginning.
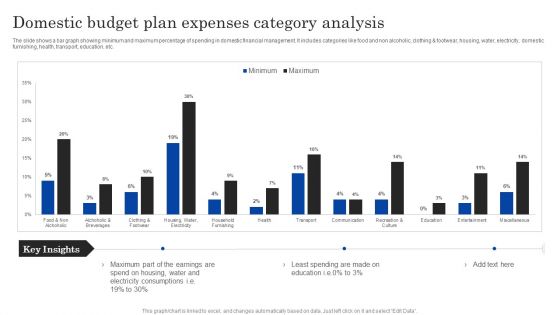
Domestic Budget Plan Expenses Category Analysis Ppt PowerPoint Presentation Layouts Inspiration PDF
The slide shows a bar graph showing minimum and maximum percentage of spending in domestic financial management. It includes categories like food and non alcoholic, clothing and footwear, housing, water, electricity, domestic furnishing, health, transport, education, etc.Showcasing this set of slides titled Domestic Budget Plan Expenses Category Analysis Ppt PowerPoint Presentation Layouts Inspiration PDF. The topics addressed in these templates are Part Earnings, Electricity Consumptions, Least Spending. All the content presented in this PPT design is completely editable. Download it and make adjustments in color, background, font etc. as per your unique business setting.
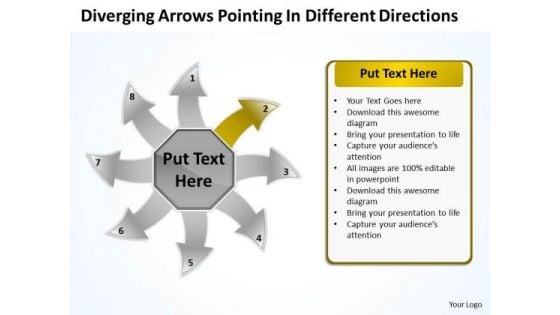
Diverging Arrows Pointing Different Directions Charts And Diagrams PowerPoint Templates
We present our diverging arrows pointing different directions Charts and Diagrams PowerPoint templates.Present our Communication PowerPoint Templates because you can expound on how you plan to gain their confidence and assure them of continued and consistent excellence in quality of service. Present our Arrows PowerPoint Templates because they are Gauranteed to focus the minds of your team. Download our Circle Charts PowerPoint Templates because the ideas and plans are on your finger tips. Download our Business PowerPoint Templates because it helps you to explain your plans in all earnest to your colleagues and raise the bar for all. Use our Shapes PowerPoint Templates because you can illustrate your ideas and imprint them in the minds of your team with this template.Use these PowerPoint slides for presentations relating to Arrow, Bio, Business, Chart, Circle, Concept, Control, Cycle, Design, Development, Diagram, Eco, Ecology, Environmental, Evaluate, Flow, Flowchart, Fresh, Graphic, Green, Idea, Infographic, Iterative, Life, Lifecycle, Management, Method, Model, Natural, Nature, Organic, Process, Quality, Recycle, Research, Schema, Spiral, Step, Strategy, Success, System. The prominent colors used in the PowerPoint template are Yellow, Gray, White. Customers tell us our diverging arrows pointing different directions Charts and Diagrams PowerPoint templates are second to none. Customers tell us our Cycle PowerPoint templates and PPT Slides are Quaint. Presenters tell us our diverging arrows pointing different directions Charts and Diagrams PowerPoint templates are designed by a team of presentation professionals. PowerPoint presentation experts tell us our Control PowerPoint templates and PPT Slides are Reminiscent. Customers tell us our diverging arrows pointing different directions Charts and Diagrams PowerPoint templates are Pleasant. Professionals tell us our Control PowerPoint templates and PPT Slides are Ritzy. Command teams with our Diverging Arrows Pointing Different Directions Charts And Diagrams PowerPoint Templates. Download without worries with our money back guaranteee.
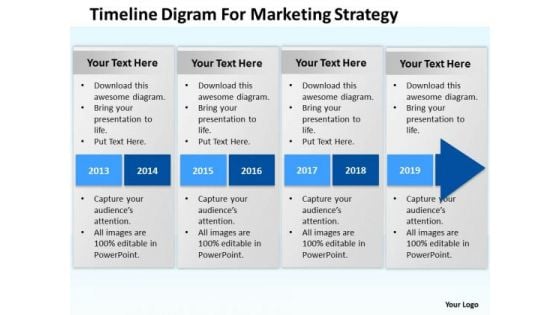
Timeline Digram For Marketing Strategy Ppt Develop Business Plan PowerPoint Slides
We present our timeline digram for marketing strategy ppt develop business plan PowerPoint Slides.Download and present our Advertising PowerPoint Templates because Our PowerPoint Templates and Slides offer you the needful to organise your thoughts. Use them to list out your views in a logical sequence. Download and present our Competition PowerPoint Templates because You are well armed with penetrative ideas. Our PowerPoint Templates and Slides will provide the gunpowder you need. Use our Arrows PowerPoint Templates because It can Leverage your style with our PowerPoint Templates and Slides. Charm your audience with your ability. Download our Process and Flows PowerPoint Templates because You should Ascend the ladder of success with ease. Our PowerPoint Templates and Slides will provide strong and sturdy steps. Download our Business PowerPoint Templates because It will let you Set new benchmarks with our PowerPoint Templates and Slides. They will keep your prospects well above par.Use these PowerPoint slides for presentations relating to Account, acquisition, advance, advantage, background, banking, bar, business, chart, data, diagram, earning, economic, economy, finance, financial, graph, graphic, green, grow, growth, illustration, increase, investment, line, market, marketing, money, number, orange, plan, price, profit, progress, rainbow, red, report, rise, sign, spectrum, statistic, stock, success, symbol, up. The prominent colors used in the PowerPoint template are Blue, Gray, Black. With our Timeline Digram For Marketing Strategy Ppt Develop Business Plan PowerPoint Slides there is no need to exaggerate. They are always brief and accurate.
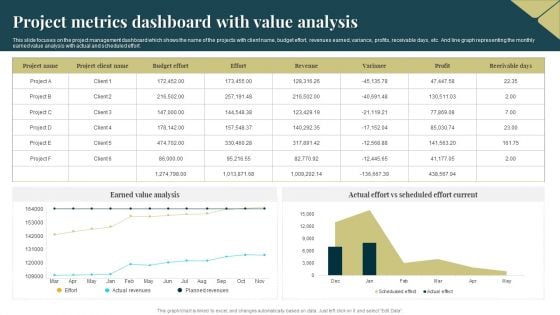
Project Metrics Dashboard With Value Analysis Introduction PDF
This slide focuses on the project management dashboard which shows the name of the projects with client name, budget effort, revenues earned, variance, profits, receivable days, etc. And line graph representing the monthly earned value analysis with actual and scheduled effort. Showcasing this set of slides titled Project Metrics Dashboard With Value Analysis Introduction PDF. The topics addressed in these templates are Budget Effort, Revenues, Earned Value Analysis. All the content presented in this PPT design is completely editable. Download it and make adjustments in color, background, font etc. as per your unique business setting.
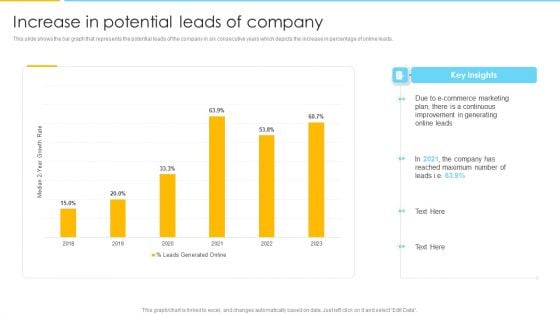
Optimizing Ecommerce Marketing Plan To Improve Sales Increase In Potential Leads Of Company Background PDF
This slide shows the bar graph that represents the potential leads of the company in six consecutive years which depicts the increase in percentage of online leads. Deliver an awe inspiring pitch with this creative Optimizing Ecommerce Marketing Plan To Improve Sales Increase In Potential Leads Of Company Background PDF bundle. Topics like E Commerce Marketing Plan, Potential Leads Of Company can be discussed with this completely editable template. It is available for immediate download depending on the needs and requirements of the user.
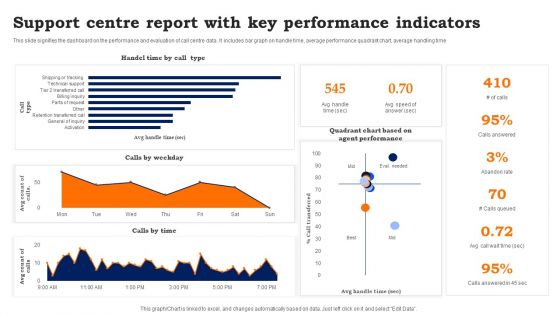
Support Centre Report With Key Performance Indicators Information PDF
This slide signifies the dashboard on the performance and evaluation of call centre data. It includes bar graph on handle time, average performance quadrant chart, average handling time. Showcasing this set of slides titled Support Centre Report With Key Performance Indicators Information PDF. The topics addressed in these templates are Support Centre Report, Key Performance Indicators. All the content presented in this PPT design is completely editable. Download it and make adjustments in color, background, font etc. as per your unique business setting.

Byjus Investor Capital Financing Pitch Deck Byjus Annual Revenue And Growth Rate Background PDF
This slide provides information about the annual revenue and growth rate of Byjus in terms of graph and line chart for 3 years.Deliver an awe inspiring pitch with this creative Byjus Investor Capital Financing Pitch Deck Byjus Annual Revenue And Growth Rate Background PDF bundle. Topics like Annual Revenue, Annual Growth, Previous Period can be discussed with this completely editable template. It is available for immediate download depending on the needs and requirements of the user.
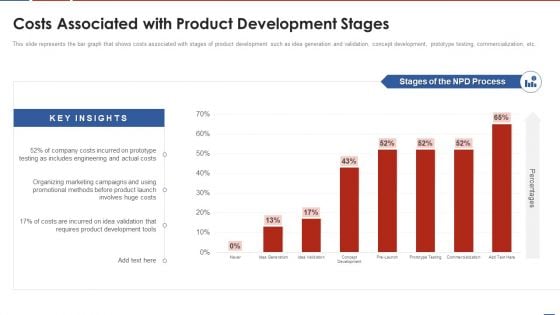
Formulating Product Development Action Plan To Enhance Client Experience Costs Associated With Product Diagrams PDF
This slide represents the bar graph that shows costs associated with stages of product development such as idea generation and validation, concept development, prototype testing, commercialization, etc. Deliver and pitch your topic in the best possible manner with this formulating product development action plan to enhance client experience costs associated with product diagrams pdf. Use them to share invaluable insights on development, costs, organizing, marketing, campaigns and impress your audience. This template can be altered and modified as per your expectations. So, grab it now.
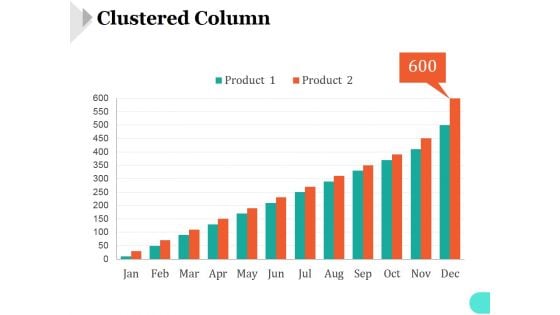
Clustered Column Template 1 Ppt PowerPoint Presentation Inspiration
This is a clustered column template 1 ppt powerpoint presentation inspiration. This is a twelve stage process. The stages in this process are bar graph, marketing, strategy, analysis, business, success.
Clustered Column Template 2 Ppt PowerPoint Presentation Icon
This is a clustered column template 2 ppt powerpoint presentation icon. This is a two stage process. The stages in this process are bar graph, marketing, strategy, analysis, business, success.
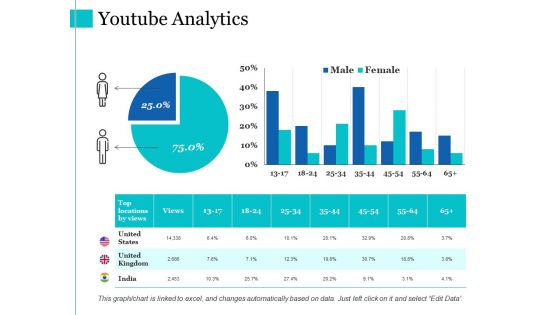
Youtube Analytics Ppt PowerPoint Presentation Layouts Graphic Images
This is a youtube analytics ppt powerpoint presentation layouts graphic images. This is a three stage process. The stages in this process are youtube analytics, finance, percentage, bar graph.
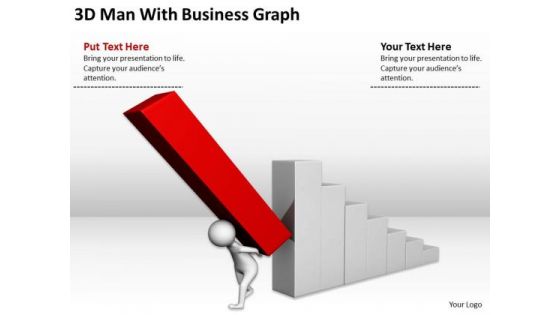
Successful Business People Man With New PowerPoint Presentation Graph Templates
We present our successful business people man with new powerpoint presentation graph templates.Present our People PowerPoint Templates because You can Double your output with our PowerPoint Templates and Slides. They make beating deadlines a piece of cake. Present our Business PowerPoint Templates because You can Score a slam dunk with our PowerPoint Templates and Slides. Watch your audience hang onto your every word. Use our Marketing PowerPoint Templates because Our PowerPoint Templates and Slides will let you meet your Deadlines. Download and present our Success PowerPoint Templates because Our PowerPoint Templates and Slides provide you with a vast range of viable options. Select the appropriate ones and just fill in your text. Download and present our Shapes PowerPoint Templates because You canTake a leap off the starting blocks with our PowerPoint Templates and Slides. They will put you ahead of the competition in quick time.Use these PowerPoint slides for presentations relating to 3d, achievement, background, bar, business, businessman, carrying, character,chart, competition, computer, concept, cute, figure, figurine, graph, graphic, growth,guy, holding, human, icon, idea, illustration, improvement, people, person,progress, puppet, render, rendering, success, support, symbol, tie, white, winning. The prominent colors used in the PowerPoint template are Red, Gray, White. We assure you our successful business people man with new powerpoint presentation graph templates are second to none. You can be sure our bar PowerPoint templates and PPT Slides provide you with a vast range of viable options. Select the appropriate ones and just fill in your text. Use our successful business people man with new powerpoint presentation graph templates will make the presenter look like a pro even if they are not computer savvy. We assure you our businessman PowerPoint templates and PPT Slides are aesthetically designed to attract attention. We guarantee that they will grab all the eyeballs you need. Use our successful business people man with new powerpoint presentation graph templates look good visually. Professionals tell us our background PowerPoint templates and PPT Slides provide great value for your money. Be assured of finding the best projection to highlight your words. Glue your slides together with our Successful Business People Man With New PowerPoint Presentation Graph Templates. Try us out and see what a difference our templates make.
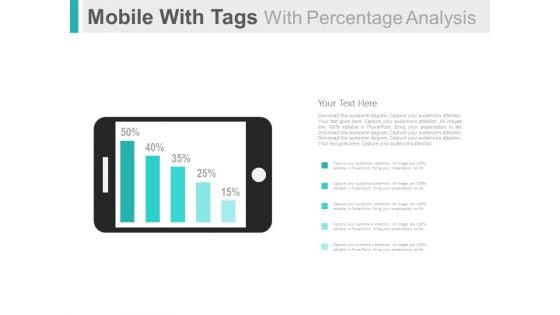
Mobile For Online Survey And Analysis Powerpoint Slides
This PowerPoint template has been designed with graphics of mobile and percentage bar graph. This PPT slide can be used to display online survey and analysis. You can download finance PowerPoint template to prepare awesome presentations.
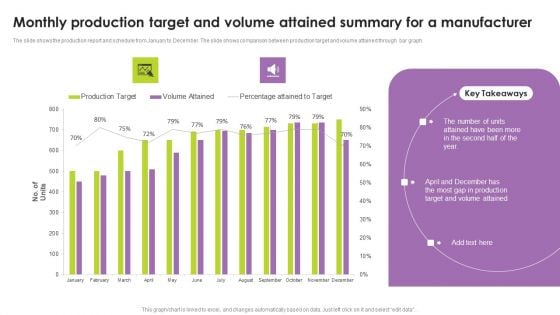
Monthly Production Target And Volume Attained Summary For A Manufacturer Portrait PDF
The slide shows the production report and schedule from January to December. The slide shows comparison between production target and volume attained through bar graph. Pitch your topic with ease and precision using this Monthly Production Target And Volume Attained Summary For A Manufacturer Portrait PDF. This layout presents information on Monthly Production Target, Volume Attained Summary, Manufacturer. It is also available for immediate download and adjustment. So, changes can be made in the color, design, graphics or any other component to create a unique layout.
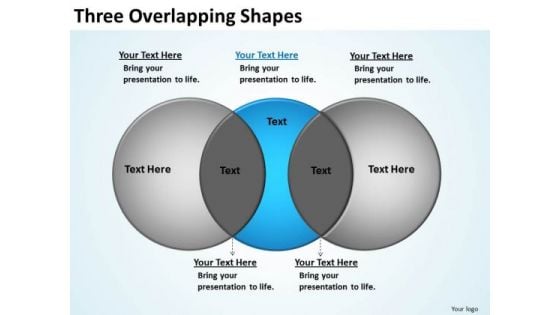
PowerPoint Design Marketing Three Overlapping Ppt Backgrounds
PowerPoint Design Marketing Three Overlapping PPT Backgrounds-The Circle of Life - a concept emmbedded in our minds and hence easy to comprehend. Life and Business is made up of processes comprising stages that flow from one to another. An excellent graphic to attract the attention of and understanding by your audience to improve earnings.-Abstract, Art, Artistic, Background, Color, Curve, Design, Fractal, Geometric, Graphic, Illustration, Image, Line, Lobed, Overlapping, Pattern, Perspective, Rectangle, Repeated, Shape, Silver, Square, Steel, Three, Tri, Triad, Triangular, triple Great presentations happen with our PowerPoint Design Marketing Three Overlapping Ppt Backgrounds. Try us out and see what a difference our templates make.
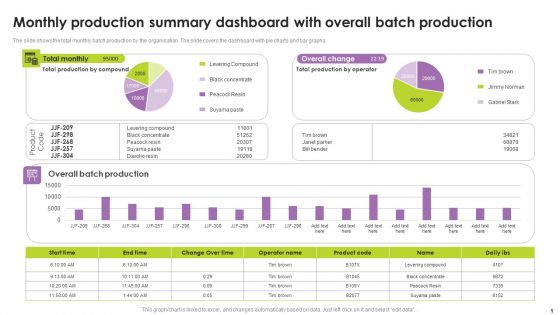
Monthly Production Summary Dashboard With Overall Batch Production Portrait PDF
The slide shows the total monthly batch production by the organisation. The slide covers the dashboard with pie charts and bar graphs. Showcasing this set of slides titled Monthly Production Summary Dashboard With Overall Batch Production Portrait PDF. The topics addressed in these templates are Monthly Production Summary Dashboard, Overall Batch Production. All the content presented in this PPT design is completely editable. Download it and make adjustments in color, background, font etc. as per your unique business setting.
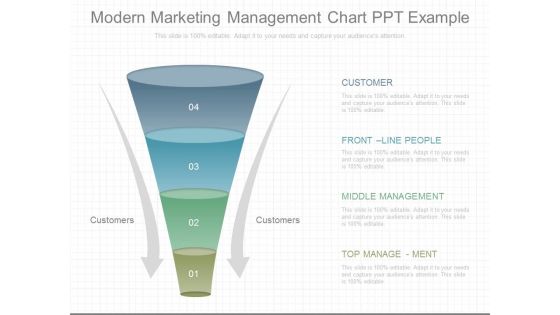
Modern Marketing Management Chart Ppt Example
This is a modern marketing management chart ppt example. This is a four stage process. The stages in this process are customer, customers, front line people, middle management, top management.
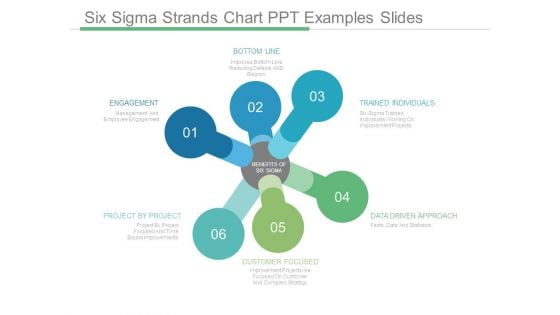
Six Sigma Strands Chart Ppt Examples Slides
This is a six sigma strands chart ppt examples slides. This is a six stage process. The stages in this process are bottom line, trained individuals, data driven approach, customer focused, project by project, engagement, benefits of six sigma.

Six Sigma Circle Chart Powerpoint Slide Information
This is a six sigma circle chart powerpoint slide information. This is a five stage process. The stages in this process are bottom line, trained individuals, engagement, project by project, customer focused.
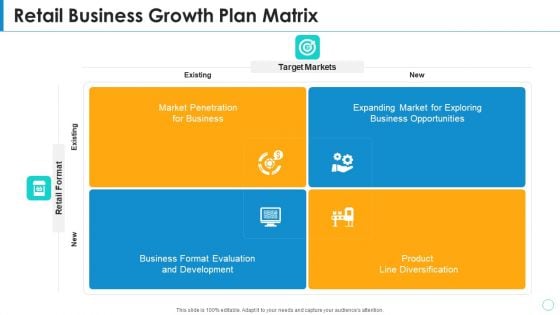
Retail Business Growth Plan Matrix Infographics PDF
Persuade your audience using this retail business growth plan matrix infographics pdf. This PPT design covers four stages, thus making it a great tool to use. It also caters to a variety of topics including market penetration for business, expanding market for exploring business opportunities, business format evaluation and development, product line diversification . Download this PPT design now to present a convincing pitch that not only emphasizes the topic but also showcases your presentation skills.
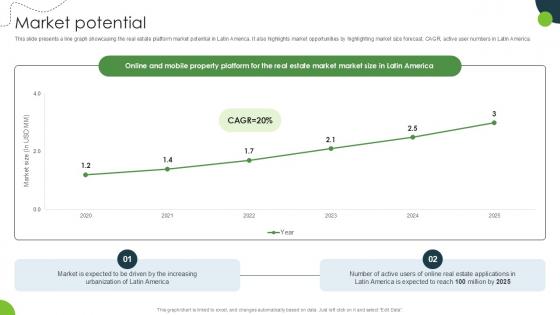
Market Potential Land And Property Marketplace Pitch Deck PPT Sample
This slide presents a line graph showcasing the real estate platform market potential in Latin America. It also highlights market opportunities by highlighting market size forecast, CAGR, active user numbers in Latin America. Are you in need of a template that can accommodate all of your creative concepts This one is crafted professionally and can be altered to fit any style. Use it with Google Slides or PowerPoint. Include striking photographs, symbols, depictions, and other visuals. Fill, move around, or remove text boxes as desired. Test out color palettes and font mixtures. Edit and save your work, or work with colleagues. Download Market Potential Land And Property Marketplace Pitch Deck PPT Sample and observe how to make your presentation outstanding. Give an impeccable presentation to your group and make your presentation unforgettable. This slide presents a line graph showcasing the real estate platform market potential in Latin America. It also highlights market opportunities by highlighting market size forecast, CAGR, active user numbers in Latin America.
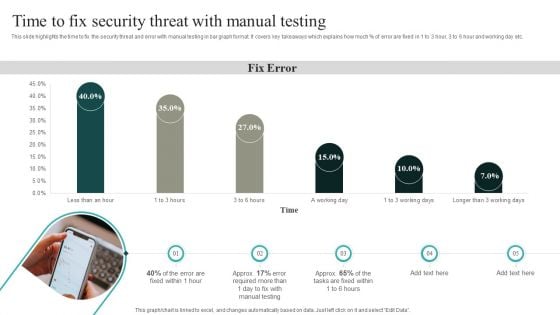
IT Security Automation Systems Guide Time To Fix Security Threat With Manual Testing Topics PDF
This slide highlights the time to fix the security threat and error with manual testing in bar graph format. It covers key takeaways which explains how much percent of error are fixed in 1 to 3 hour, 3 to 6 hour and working day etc. Formulating a presentation can take up a lot of effort and time, so the content and message should always be the primary focus. The visuals of the PowerPoint can enhance the presenters message, so our IT Security Automation Systems Guide Time To Fix Security Threat With Manual Testing Topics PDF was created to help save time. Instead of worrying about the design, the presenter can concentrate on the message while our designers work on creating the ideal templates for whatever situation is needed. Slidegeeks has experts for everything from amazing designs to valuable content, we have put everything into IT Security Automation Systems Guide Time To Fix Security Threat With Manual Testing Topics PDF
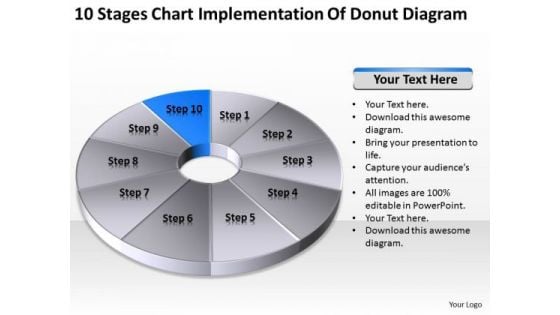
Chart Implementation Of Donut Diagram Ppt Business Plan Outline Template Free PowerPoint Templates
We present our chart implementation of donut diagram ppt business plan outline template free PowerPoint templates.Download our Ring Charts PowerPoint Templates because They will Put the wind in your sails. Skim smoothly over the choppy waters of the market. Present our Process and Flows PowerPoint Templates because They will Put the wind in your sails. Skim smoothly over the choppy waters of the market. Present our Flow Charts PowerPoint Templates because Our PowerPoint Templates and Slides will Embellish your thoughts. They will help you illustrate the brilliance of your ideas. Use our Marketing PowerPoint Templates because Our PowerPoint Templates and Slides come in all colours, shades and hues. They help highlight every nuance of your views. Download and present our Business PowerPoint Templates because It will Strengthen your hand with your thoughts. They have all the aces you need to win the day.Use these PowerPoint slides for presentations relating to Pie, chart, isolated, white, bar, business, concept, sign, render, spectrum, bright, diagram, circle, percentage, light, graphic,element, digital, report, marketing, abstract, graph, modern, creative, illustration, icon, up, web, design, painting, set, art, progress, effect, style, steps,ten,pattern, financial. The prominent colors used in the PowerPoint template are Gray, Blue, White. Access our Chart Implementation Of Donut Diagram Ppt Business Plan Outline Template Free PowerPoint Templates anytime,anywhere. They are available around the clock.
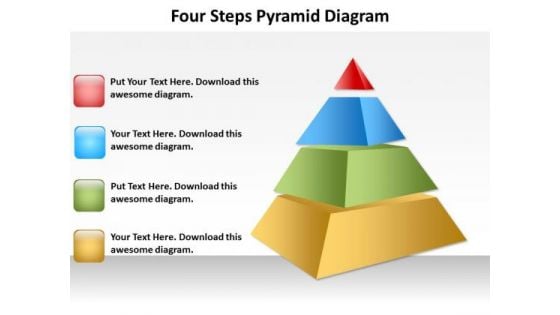
Four Steps Pyramid Diagram Templates PowerPoint Chart
We present our Four steps Pyramid Diagram templates powerpoint Chart.Present our Finance PowerPoint Templates because this template helps you to delve on these thoughts and brief your team on the value of your depth of understanding of the subject. Download our Business PowerPoint Templates because it helps you to explain your plans in all earnest to your colleagues and raise the bar for all. Use our Shapes PowerPoint Templates because to achieve sureshot success you need to come together at the right time, place and manner. Use our Pyramids PowerPoint Templates because pyramids are a symbol of the continuity of life. Download our Signs PowerPoint Templates because this diagram provides trainers a tool to teach the procedure in a highly visual, engaging way.Use these PowerPoint slides for presentations relating to 3d, Abstract, Business, Chart, Color, Colorful, Concept, Conceptual, Diagram, Financial, Four, Graph, Green, Growth, Hierarchy, Illustration, Increase, Isolated, Layer, Level, Multi-Colored, Multicolored, Orange, Part, Performance, Polychrome, Presentation, Progress, Pyramid, Red, Render, Rendered, Report, Results, Section, Shape, Sliced, Stage, Statistics, Status, Step, Success, Triangle. The prominent colors used in the PowerPoint template are Blue, Red, Green. We assure you our Four steps Pyramid Diagram templates powerpoint Chart are Awesome. Customers tell us our Diagram PowerPoint templates and PPT Slides are Radiant. The feedback we get is that our Four steps Pyramid Diagram templates powerpoint Chart are Clever. We assure you our Conceptual PowerPoint templates and PPT Slides are Fashionable. People tell us our Four steps Pyramid Diagram templates powerpoint Chart are incredible easy to use. We assure you our Colorful PowerPoint templates and PPT Slides are specially created by a professional team with vast experience. They diligently strive to come up with the right vehicle for your brilliant Ideas. Achievement deserves admiration. Acquire due accolades with our Four Steps Pyramid Diagram Templates PowerPoint Chart.
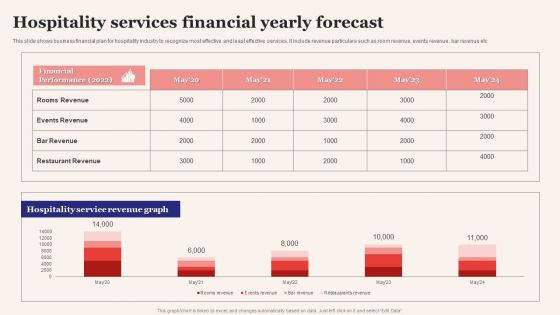
Hospitality Services Financial Yearly Forecast Elements PDF
This slide shows business financial plan for hospitality industry to recognize most effective and least effective services. It include revenue particulars such as room revenue, events revenue, bar revenue etc. Showcasing this set of slides titled Hospitality Services Financial Yearly Forecast Elements PDF. The topics addressed in these templates are Hospitality Services, Financial Yearly Forecast. All the content presented in this PPT design is completely editable. Download it and make adjustments in color, background, font etc. as per your unique business setting.
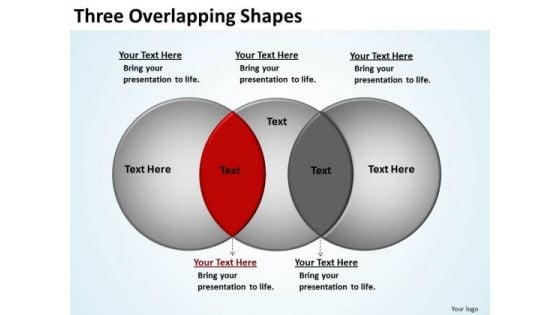
PowerPoint Layout Image Three Overlapping Ppt Template
PowerPoint Layout Image Three Overlapping PPT Template--Abstract, Art, Artistic, Background, Color, Curve, Design, Fractal, Geometric, Graphic, Illustration, Image, Line, Lobed, Overlapping, Pattern, Perspective, Rectangle, Repeated, Shape, Silver, Square, Steel, Three, Tri, Triad, Triangular, triple Laugh in the face of difficulty with our PowerPoint Layout Image Three Overlapping Ppt Template. They help you take on any adversity.
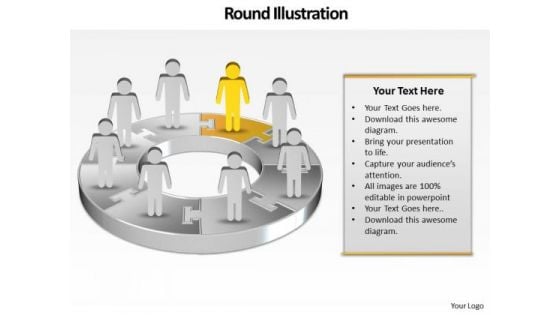
Ppt Team Effort Person Standing Yellow Piece Of Chart PowerPoint Ks2 Templates
PPT team effort person standing yellow piece of chart PowerPoint ks2 Templates-Use this Circular Arrow diagram to show activities that are related to the business plan metrics and monitor the results to determine if the business plan is proceeding as planned. You can apply other 3D Styles and shapes to the slide to enhance your presentations.-PPT team effort person standing yellow piece of chart PowerPoint ks2 Templates-arrow, bar, business, businessman, candidate, cartoon, character, chart, circle, circular, client, communication, company, concept, diagram, finance, financial, flow, growth, human, illustration, increase, information, iteration, man, market, marketing, process, processing, profit, sales, statistics, stats, success, target Feature your views with our Ppt Team Effort Person Standing Yellow Piece Of Chart PowerPoint Ks2 Templates. They will get the desired exposure.

Competitor Market Share And Sales Revenues Ppt PowerPoint Presentation Gallery Gridlines
This is a competitor market share and sales revenues ppt powerpoint presentation gallery gridlines. This is a three stage process. The stages in this process are line, marketing, strategy, planning, finance.
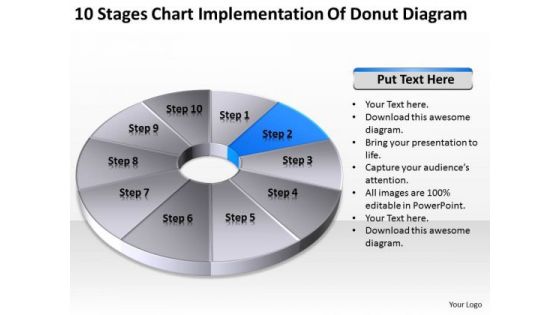
Chart Implementation Of Donut Diagram Ppt How To Wright Business Plan PowerPoint Templates
We present our chart implementation of donut diagram ppt how to wright business plan PowerPoint templates.Download and present our Ring Charts PowerPoint Templates because Our PowerPoint Templates and Slides help you pinpoint your timelines. Highlight the reasons for your deadlines with their use. Download and present our Process and Flows PowerPoint Templates because Your audience will believe you are the cats whiskers. Present our Flow Charts PowerPoint Templates because Our PowerPoint Templates and Slides are effectively colour coded to prioritise your plans They automatically highlight the sequence of events you desire. Use our Marketing PowerPoint Templates because Your ideas provide food for thought. Our PowerPoint Templates and Slides will help you create a dish to tickle the most discerning palate. Present our Business PowerPoint Templates because Our PowerPoint Templates and Slides will provide you a launch platform. Give a lift off to your ideas and send them into orbit.Use these PowerPoint slides for presentations relating to Pie, chart, isolated, white, bar, business, concept, sign, render, spectrum, bright, diagram, circle, percentage, light, graphic,element, digital, report, marketing, abstract, graph, modern, creative, illustration, icon, up, web, design, painting, set, art, progress, effect, style, steps,ten,pattern, financial. The prominent colors used in the PowerPoint template are Blue, Black, Gray. Accept accolades with our Chart Implementation Of Donut Diagram Ppt How To Wright Business Plan PowerPoint Templates. You will come out on top.
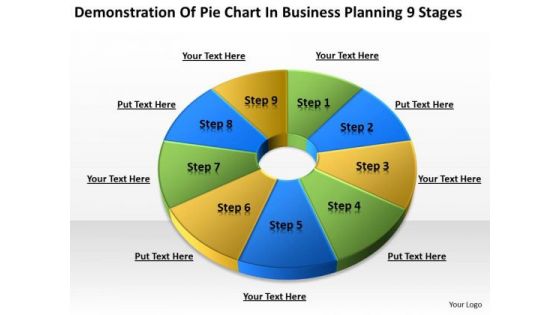
Pie Chart In Business Planning 9 Stages Ppt Service PowerPoint Slides
We present our pie chart in business planning 9 stages ppt service PowerPoint Slides.Present our Ring Charts PowerPoint Templates because Our PowerPoint Templates and Slides will let Your superior ideas hit the target always and everytime. Use our Flow Charts PowerPoint Templates because Our PowerPoint Templates and Slides will give you great value for your money. Be assured of finding the best projection to highlight your words. Download and present our Business PowerPoint Templates because Our PowerPoint Templates and Slides will let you Illuminate the road ahead to Pinpoint the important landmarks along the way. Download our Shapes PowerPoint Templates because Our PowerPoint Templates and Slides will let you Hit the target. Go the full distance with ease and elan. Download our Process and Flows PowerPoint Templates because Our PowerPoint Templates and Slides will embellish your thoughts. See them provide the desired motivation to your team.Use these PowerPoint slides for presentations relating to Wheel, color, pie, chart, isolated, bar, business, concept, sign, render, bright, template, diagram, circle, graphic, report, marketing, abstract, graph, modern, creative, illustration, web, design, blue, painting, progress, pattern, financial. The prominent colors used in the PowerPoint template are Green, Yellow, Blue. Beat mediocrity with our Pie Chart In Business Planning 9 Stages Ppt Service PowerPoint Slides. You will come out on top.
Formulating Product Development Action Plan To Enhance Client Experience Role Of Innovators In Improving Summary PDF
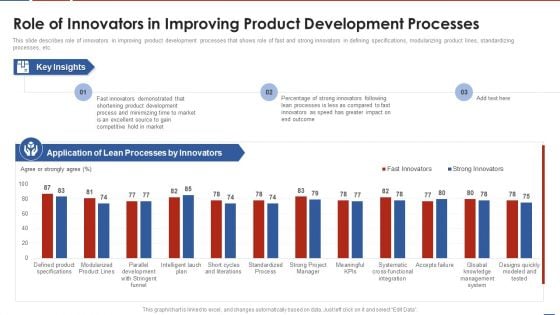
This slide describes role of innovators in improving product development processes that shows role of fast and strong innovators in defining specifications, modularizing product lines, standardizing processes, etc. Deliver and pitch your topic in the best possible manner with this formulating product development action plan to enhance client experience role of innovators in improving summary pdf. Use them to share invaluable insights on innovators, processes, competitive, development and impress your audience. This template can be altered and modified as per your expectations. So, grab it now.
Satisfying Consumers Through Strategic Product Building Plan Role Of Innovators In Improving Background PDF
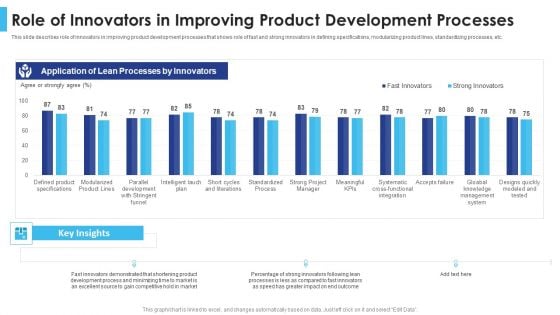
This slide describes role of innovators in improving product development processes that shows role of fast and strong innovators in defining specifications, modularizing product lines, standardizing processes, etc. Deliver an awe inspiring pitch with this creative satisfying consumers through strategic product building plan role of innovators in improving background pdf bundle. Topics like role of innovators in improving product development processes can be discussed with this completely editable template. It is available for immediate download depending on the needs and requirements of the user.
Empowering The Future Electric Vehicle Chargers Dashboard To Optimize Energy IoT SS V
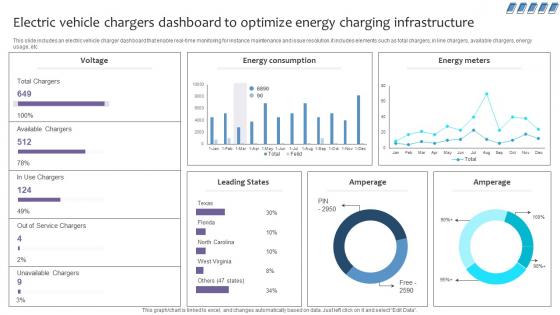
This slide includes an electric vehicle charger dashboard that enable real-time monitoring for instance maintenance and issue resolution.it includes elements such as total chargers, in line chargers, available chargers, energy usage, etc. If you are looking for a format to display your unique thoughts, then the professionally designed Empowering The Future Electric Vehicle Chargers Dashboard To Optimize Energy IoT SS V is the one for you. You can use it as a Google Slides template or a PowerPoint template. Incorporate impressive visuals, symbols, images, and other charts. Modify or reorganize the text boxes as you desire. Experiment with shade schemes and font pairings. Alter, share or cooperate with other people on your work. Download Empowering The Future Electric Vehicle Chargers Dashboard To Optimize Energy IoT SS V and find out how to give a successful presentation. Present a perfect display to your team and make your presentation unforgettable. This slide includes an electric vehicle charger dashboard that enable real-time monitoring for instance maintenance and issue resolution.it includes elements such as total chargers, in line chargers, available chargers, energy usage, etc.
Canned Food Company Profile Gross Profit And Margin Portrait PDF
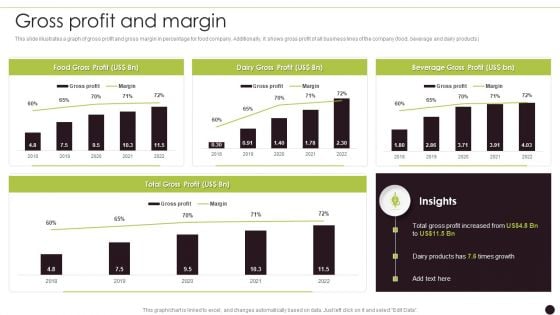
This slide illustrates a graph of gross profit and gross margin in percentage for food company. Additionally, it shows gross profit of all business lines of the company food, beverage and dairy products Deliver an awe inspiring pitch with this creative Canned Food Company Profile Gross Profit And Margin Portrait PDF bundle. Topics like Total Gross, Dairy Profit, Beverage Gross can be discussed with this completely editable template. It is available for immediate download depending on the needs and requirements of the user.
Food Company Overview Gross Profit And Margin Structure PDF
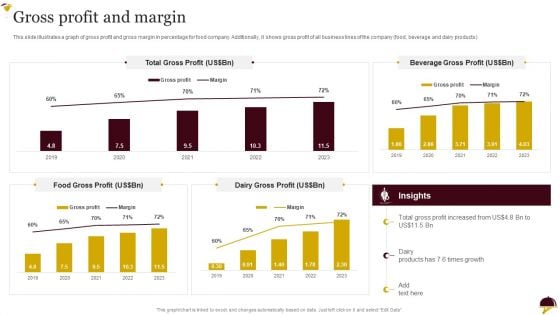
This slide illustrates a graph of gross profit and gross margin in percentage for food company. Additionally, it shows gross profit of all business lines of the company food, beverage and dairy products.Deliver an awe inspiring pitch with this creative Food Company Overview Gross Profit And Margin Structure PDF bundle. Topics like Food Gross, Total Gross, Beverage Gross can be discussed with this completely editable template. It is available for immediate download depending on the needs and requirements of the user.
Food Company Overview Operating Profit And Margin Guidelines PDF
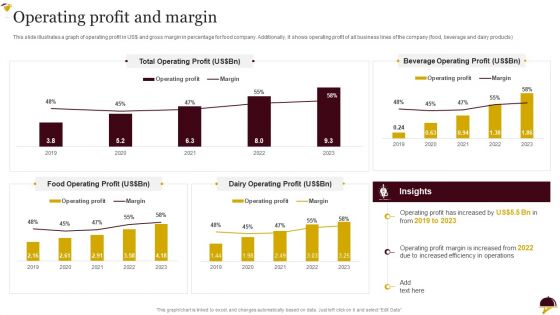
This slide illustrates a graph of operating profit in USdollr and gross margin in percentage for food company. Additionally, it shows operating profit of all business lines of the company food, beverage and dairy products.Deliver an awe inspiring pitch with this creative Food Company Overview Operating Profit And Margin Guidelines PDF bundle. Topics like Total Operating, Beverage Operating, Food Operating can be discussed with this completely editable template. It is available for immediate download depending on the needs and requirements of the user.
Packaged Food Firm Description Gross Profit And Margin Brochure PDF
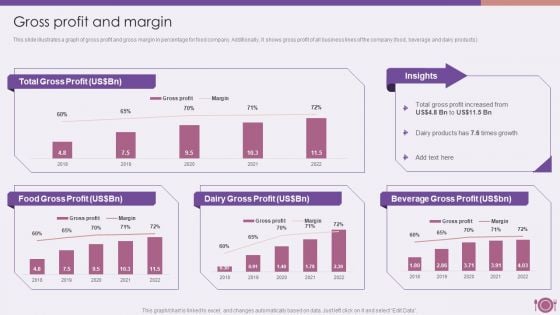
This slide illustrates a graph of gross profit and gross margin in percentage for food company. Additionally, it shows gross profit of all business lines of the company food, beverage and dairy products.Deliver an awe inspiring pitch with this creative Packaged Food Firm Description Gross Profit And Margin Brochure PDF bundle. Topics like Total Gross, Food Gross, Dairy Gross can be discussed with this completely editable template. It is available for immediate download depending on the needs and requirements of the user.
Yearly Staff Engagement Trend Statistics Demonstration PDF
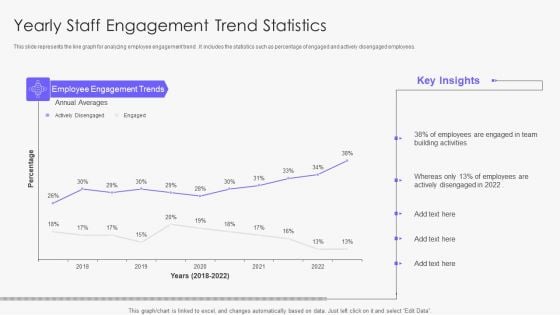
This slide represents the line graph for analyzing employee engagement trend . It includes the statistics such as percentage of engaged and actively disengaged employees. Pitch your topic with ease and precision using this Yearly Staff Engagement Trend Statistics Demonstration PDF. This layout presents information on Team, Employees, Average. It is also available for immediate download and adjustment. So, changes can be made in the color, design, graphics or any other component to create a unique layout.
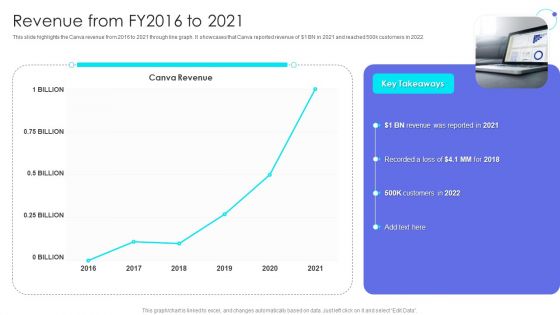
Canva Pro Business Profile Revenue From Fy2016 To 2021 Sample PDF
This slide highlights the Canva revenue from 2016 to 2021 through line graph. It showcases that Canva reported revenue of doller 1 BN in 2021 and reached 500k customers in 2022. Deliver an awe inspiring pitch with this creative Canva Pro Business Profile Revenue From Fy2016 To 2021 Sample PDF bundle. Topics like Customers, Revenue can be discussed with this completely editable template. It is available for immediate download depending on the needs and requirements of the user.
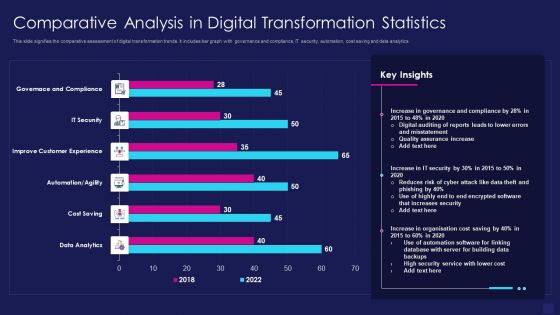
Comparative Analysis In Digital Transformation Statistics Graphics PDF
This slide signifies the comparative assessment of digital transformation trends. It includes bar graph with governance and compliance, IT security, automation, cost saving and data analytics. Showcasing this set of slides titled comparative analysis in digital transformation statistics graphics pdf. The topics addressed in these templates are data analytics, cost saving, improve customer experience. All the content presented in this PPT design is completely editable. Download it and make adjustments in color, background, font etc. as per your unique business setting.
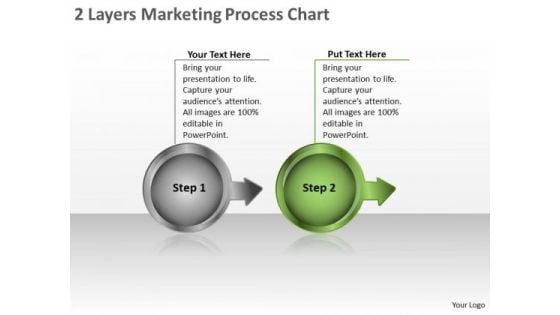
2 Layers Marketing Process Chart Ppt Vision Flowchart Templates PowerPoint
We present our 2 layers marketing process chart ppt vision flowchart templates PowerPoint. Use our Marketing PowerPoint Templates because, Business Process Design:- The template offers an excellent background to build up the various stages of your business process. Use our Semicircles PowerPoint Templates because, Listen to ideas and thoughts. Use our Arrows PowerPoint Templates because; Help them align their arrows to consistently be accurate. Use our Business PowerPoint Templates because, Marketing Strategy Business Template:- Maximizing sales of your product is the intended destination. Use our Shapes PowerPoint Templates because, Illuminate the spiritual brilliance of Jesus and shower the love for mankind he showed even while being crucified. Use these PowerPoint slides for presentations relating to 3d, abstract, analysis, arrow, bright, chart, concept, creative, descend, design, diversion, expand, expanding, finance, financial, flowing, graph, graphic, group, growing, growth, high, illustration, increase, lines, market, pattern, rainbow, report, spread, statistic, stock, symbol. The prominent colors used in the PowerPoint template are Green, Gray, and Black Cut the cloth with our 2 Layers Marketing Process Chart Ppt Vision Flowchart Templates PowerPoint. Make your thoughts the fashion of the day.

Process Flow PowerPoint Presentation Template
Add Some Dramatization To Your Thoughts. Our Process Flow PowerPoint Presentation Template Powerpoint Templates Make Useful Props. Draw Ahead Of Others With Our Business Models Powerpoint Templates. Cross The Line And Win The Race.


 Continue with Email

 Home
Home


