Map Infographics

Product Analysis Ppt Powerpoint Presentation Infographics Example Topics
This is a product analysis ppt powerpoint presentation infographics example topics. This is a seven stage process. The stages in this process are product analysis, function, materials, customer, safety.
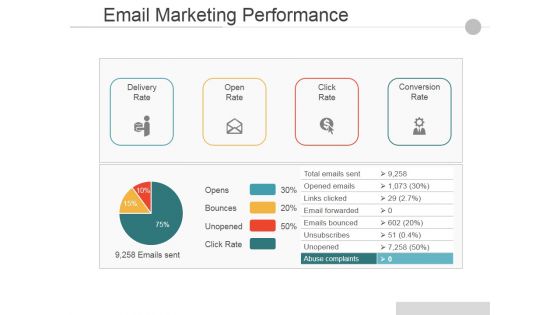
Email Marketing Performance Ppt PowerPoint Presentation Infographics Layout Ideas
This is a email marketing performance ppt powerpoint presentation infographics layout ideas. This is a four stage process. The stages in this process are delivery rate, open rate, click rate, conversion rate.
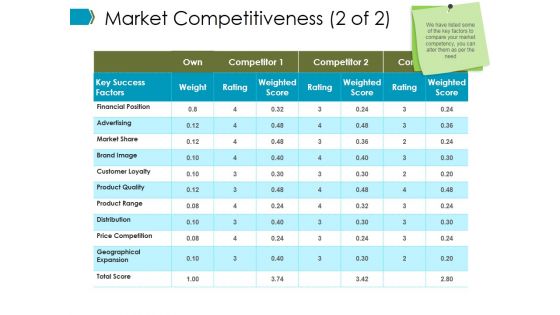
Market Competitiveness Template 1 Ppt PowerPoint Presentation Infographics Vector
This is a market competitiveness template 1 ppt powerpoint presentation infographics vector. This is a three stage process. The stages in this process are key success factors, weight, rating, weighted score.
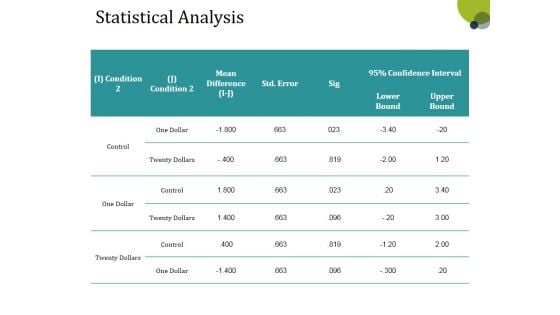
Statistical Analysis Template 1 Ppt PowerPoint Presentation Infographics Show
This is a statistical analysis template 1 ppt powerpoint presentation infographics show. This is a three stage process. The stages in this process are one dollar, control, condition, lower bound, upper bound.
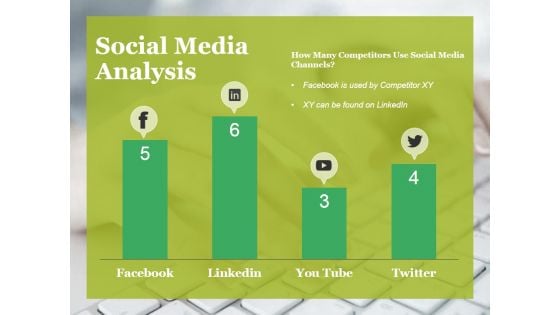
Social Media Analysis Ppt PowerPoint Presentation Infographics Samples
This is a social media analysis ppt powerpoint presentation infographics samples. This is a four stage process. The stages in this process are facebook, linkedin, twitter, you tube, social media.
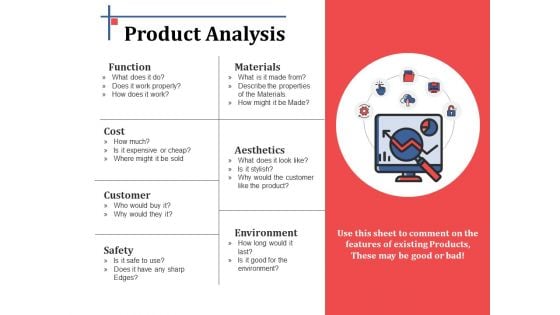
Product Analysis Ppt PowerPoint Presentation Infographics Graphic Images
This is a product analysis ppt powerpoint presentation infographics graphic images. This is a one stage process. The stages in this process are function, materials, cost, aesthetics, customer, environment, safety.
Risk Analysis Vector Icon Ppt Powerpoint Presentation Infographics File Formats
This is a risk analysis vector icon ppt powerpoint presentation infographics file formats. This is a four stage process. The stages in this process are feedback loop icon, evaluation icon, assessment icon.
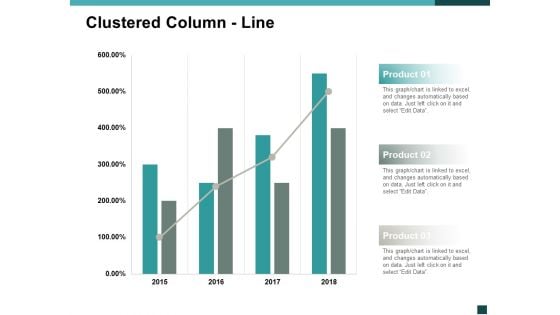
Clustered Column Line Marketing Ppt Powerpoint Presentation Infographics Information
This is a clustered column line marketing ppt powerpoint presentation infographics information. This is a three stage process. The stages in this process are finance, marketing, management, investment, analysis.
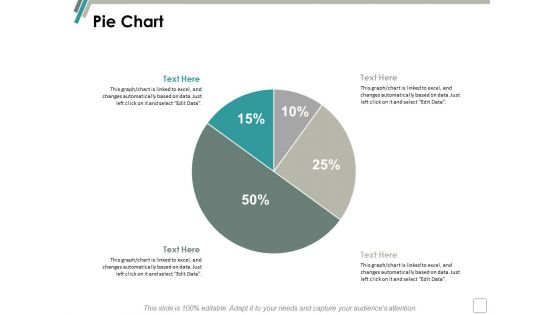
Pie Chart Finance Marketing Ppt Powerpoint Presentation Infographics Background
This is a pie chart finance marketing ppt powerpoint presentation infographics background. This is a two stage process. The stages in this process are finance, marketing, management, investment, analysis.

Pie Of Pie Finance Marketing Ppt Powerpoint Presentation Infographics Demonstration
This is a pie of pie finance marketing ppt powerpoint presentation infographics demonstration. This is a stage process. The stages in this process are finance, marketing, management, investment, analysis.
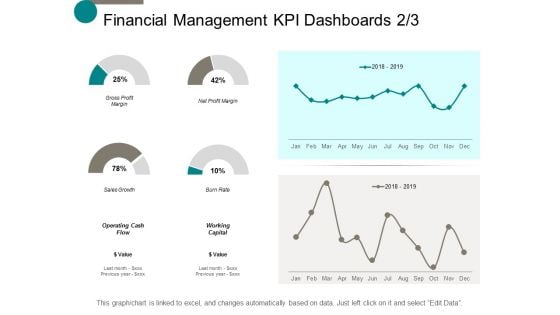
Financial Management Kpi Dashboards Marketing Ppt Powerpoint Presentation Infographics Outline
This is a financial management kpi dashboards marketing ppt powerpoint presentation infographics outline. This is a six stage process. The stages in this process are finance, marketing, management, investment, analysis.
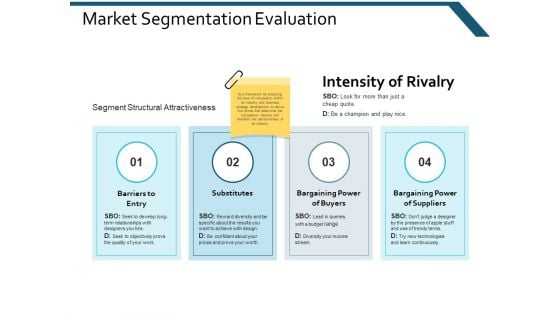
Market Segmentation Evaluation Substitutes Ppt Powerpoint Presentation Infographics Aids
This is a market segmentation evaluation substitutes ppt powerpoint presentation infographics aids. This is a two stage process. The stages in this process are finance, marketing, management, investment, analysis.
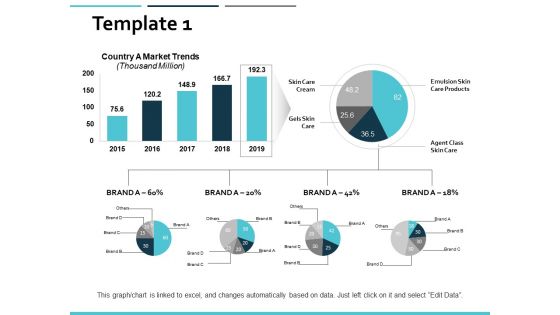
Template Business Marketing Ppt PowerPoint Presentation Infographics Slide Portrait
This is a template business marketing ppt powerpoint presentation infographics slide portrait. This is a three stage process. The stages in this process are finance, marketing, management, investment, analysis.
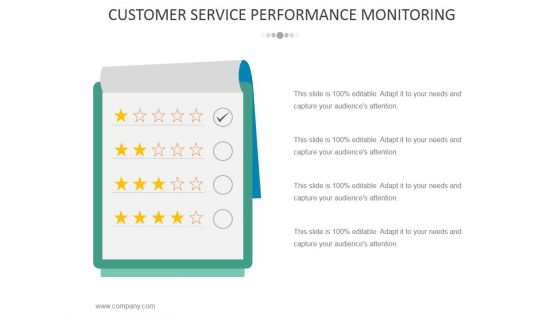
Customer Service Performance Monitoring Ppt PowerPoint Presentation Infographics Format
This is a customer service performance monitoring ppt powerpoint presentation infographics format. This is a four stage process. The stages in this process are business, strategy, marketing, analysis, finance, compare.
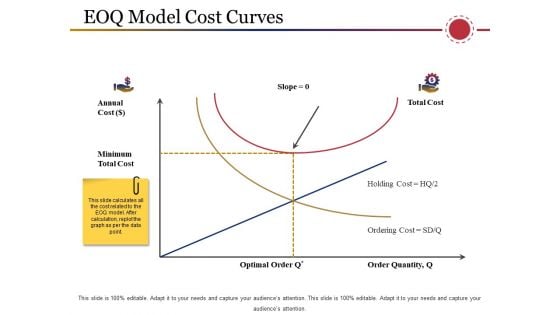
Eoq Model Cost Curves Ppt PowerPoint Presentation Infographics Background Image
This is a eoq model cost curves ppt powerpoint presentation infographics background image. This is a four stage process. The stages in this process are annual cost , minimum, optimal order , order quantity, business, finance.
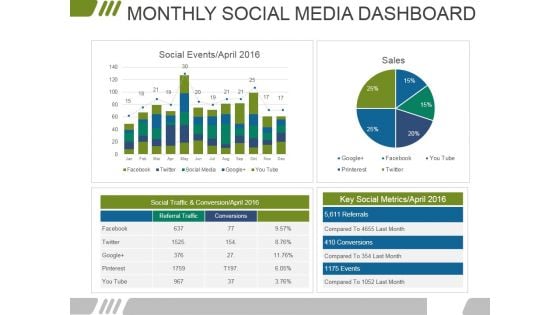
Monthly Social Media Dashboard Ppt PowerPoint Presentation Infographics Files
This is a monthly social media dashboard ppt powerpoint presentation infographics files. This is a four stage process. The stages in this process are marketing, business, financial, data analysis, management.

Table Of Content Template 2 Ppt PowerPoint Presentation Infographics Professional
This is a table of content template 2 ppt powerpoint presentation infographics professional. This is a six stage process. The stages in this process are financial performance, client and project updates, competitors analysis, future roadmap, csr miscellaneous activities.
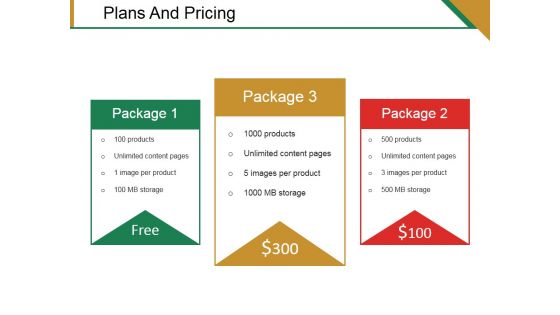
Plans And Pricing Ppt PowerPoint Presentation Infographics Guide
This is a plans and pricing ppt powerpoint presentation infographics guide. This is a three stage process. The stages in this process are business, finance, marketing, strategy, analysis, free, package.
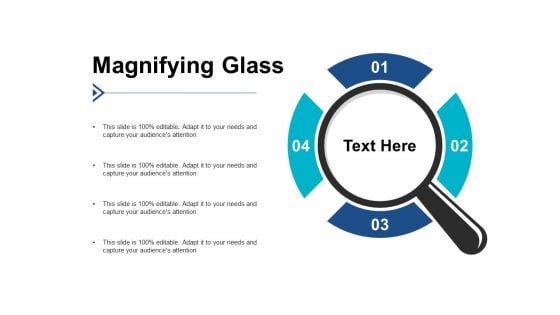
Magnifying Glass Research Ppt PowerPoint Presentation Infographics Example Introduction
This is a magnifying glass research ppt powerpoint presentation infographics example introduction. This is a four stage process. The stages in this process are magnifying glass, research, marketing, strategy, business.
Magnifying Glass Research Ppt PowerPoint Presentation Infographics Good
This is a magnifying glass research ppt powerpoint presentation infographics good. This is a four stage process. The stages in this process are magnifying glass, research, marketing, strategy, business.

Radar Chart Template 1 Ppt PowerPoint Presentation Infographics Designs
This is a radar chart template 1 ppt powerpoint presentation infographics designs. This is a two stage process. The stages in this process are business, strategy, analysis, pretention, radar chart.
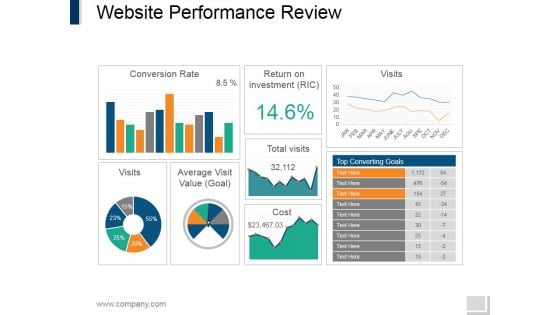
Website Performance Review Template 2 Ppt PowerPoint Presentation Infographics Vector
This is a website performance review template 2 ppt powerpoint presentation infographics vector. This is a three stage process. The stages in this process are conversion rate, return on investment, visits, average visit value, total visits.
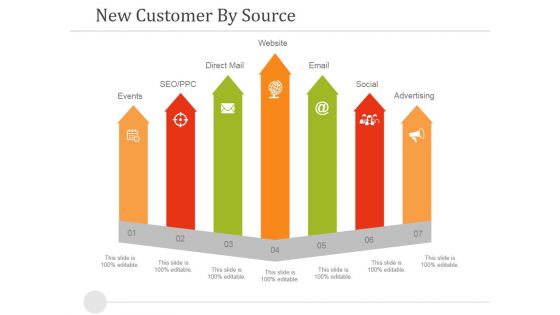
New Customer By Source Ppt PowerPoint Presentation Infographics Outline
This is a new customer by source ppt powerpoint presentation infographics outline. This is a seven stage process. The stages in this process are events, seo ppc, direct mail, website, email, social, advertising.
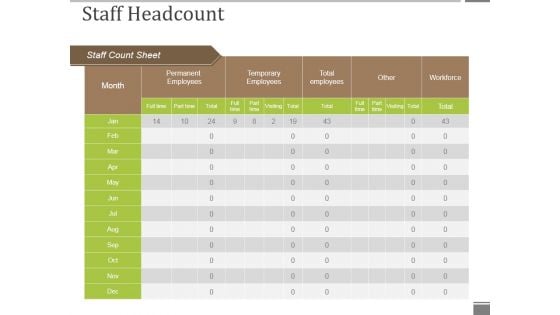
Staff Headcount Ppt PowerPoint Presentation Infographics Example Introduction
This is a staff headcount ppt powerpoint presentation infographics example introduction. This is a five stage process. The stages in this process are permanent employees, month, staff count sheet, other, total employees, temporary employees.
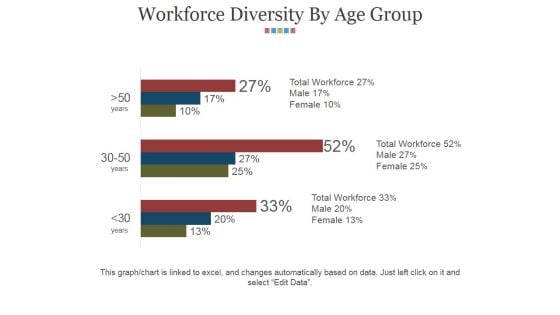
Workforce Diversity By Age Group Ppt PowerPoint Presentation Infographics Slides
This is a workforce diversity by age group ppt powerpoint presentation infographics slides. This is a three stage process. The stages in this process are finance, analysis, success, strategy, business, marketing.
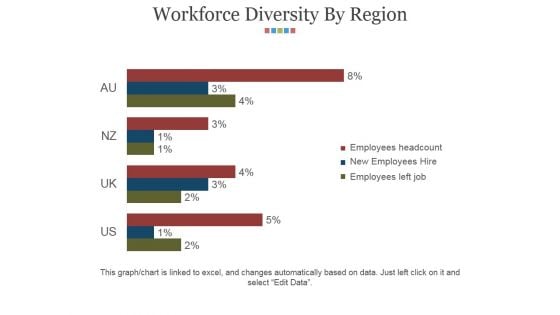
Workforce Diversity By Region Ppt PowerPoint Presentation Infographics Grid
This is a workforce diversity by region ppt powerpoint presentation infographics grid. This is a four stage process. The stages in this process are finance, analysis, success, strategy, business, marketing.

Bulb Or Idea Ppt PowerPoint Presentation Infographics Model
This is a bulb or idea ppt powerpoint presentation infographics model. This is a one stage process. The stages in this process are business, strategy, marketing, analysis, technology, light bulb.
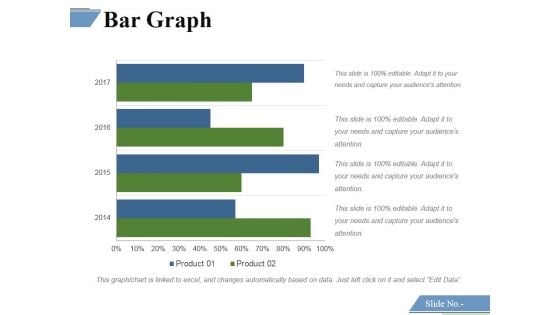
Bar Graph Ppt PowerPoint Presentation Infographics Slide Download
This is a bar graph ppt powerpoint presentation infographics slide download. This is a four stage process. The stages in this process are bar graph, finance, marketing, strategy, analysis.
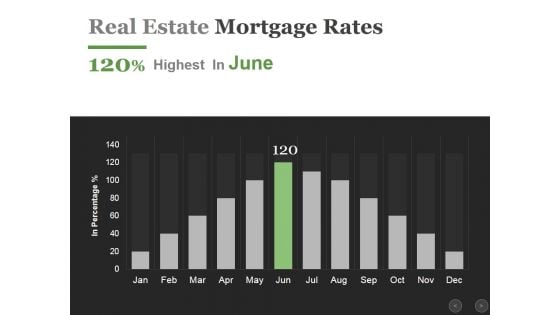
Real Estate Mortgage Rates Ppt PowerPoint Presentation Infographics Influencers
This is a real estate mortgage rates ppt powerpoint presentation infographics influencers. This is a twelve stage process. The stages in this process are business, finance, marketing, analysis, growth.
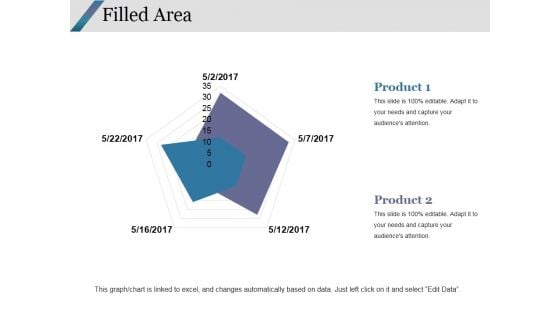
Filled Area Ppt PowerPoint Presentation Infographics Graphics Design
This is a filled area ppt powerpoint presentation infographics graphics design. This is a two stage process. The stages in this process are filled area, finance, marketing, strategy, analysis.
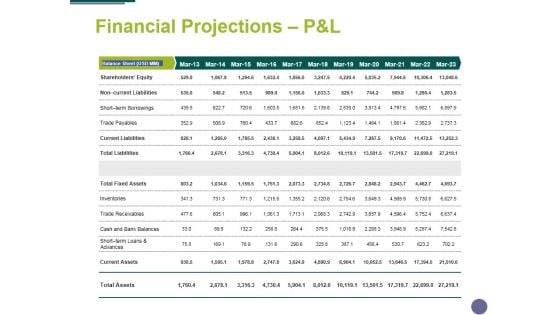
Financial Projections Panel Template 2 Ppt PowerPoint Presentation Infographics Inspiration
This is a financial projections panel template 2 ppt powerpoint presentation infographics inspiration. This is a one stage process. The stages in this process are analysis, finance, business, marketing, strategy.
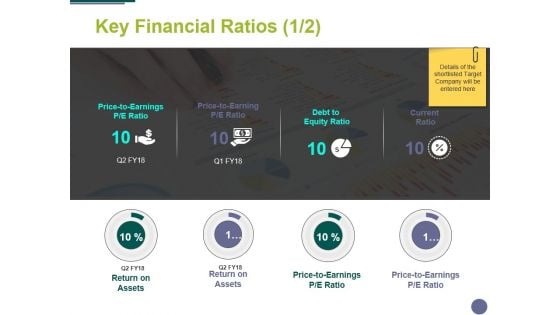
Key Financial Ratios Template 1 Ppt PowerPoint Presentation Infographics Shapes
This is a key financial ratios template 1 ppt powerpoint presentation infographics shapes. This is a four stage process. The stages in this process are business, marketing, analysis, finance, icon.
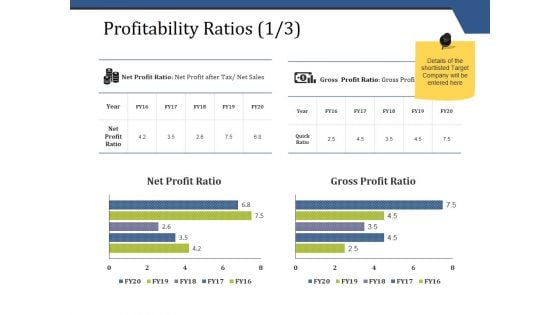
Profitability Ratios Template 1 Ppt PowerPoint Presentation Infographics Mockup
This is a profitability ratios template 1 ppt powerpoint presentation infographics mockup. This is a two stage process. The stages in this process are business, finance, marketing, strategy, analysis.
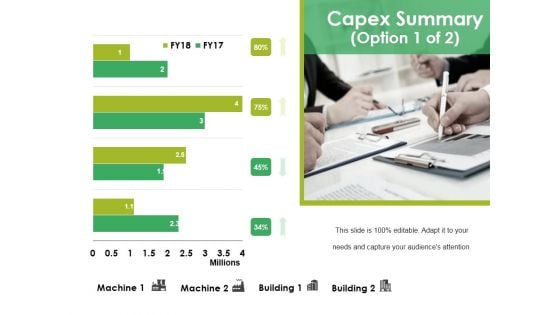
Capex Summary Template 1 Ppt PowerPoint Presentation Infographics Mockup
This is a capex summary template 1 ppt powerpoint presentation infographics mockup. This is a four stage process. The stages in this process are finance, marketing, business, analysis, strategy.
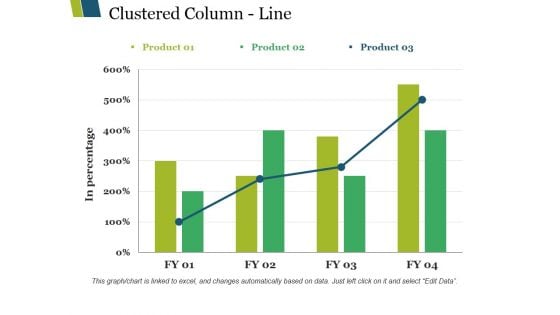
Clustered Column Line Ppt PowerPoint Presentation Infographics Background Images
This is a clustered column line ppt powerpoint presentation infographics background images. This is a three stage process. The stages in this process are clustered column line, finance, analysis, marketing, business.
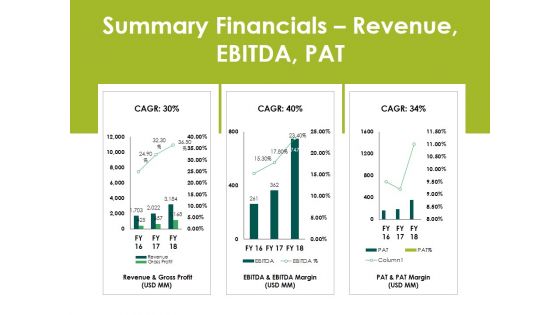
Summary Financials Revenue Ebitda Pat Ppt PowerPoint Presentation Infographics Ideas
This is a summary financials revenue ebitda pat ppt powerpoint presentation infographics ideas. This is a three stage process. The stages in this process are business, finance, analysis, marketing, strategy.
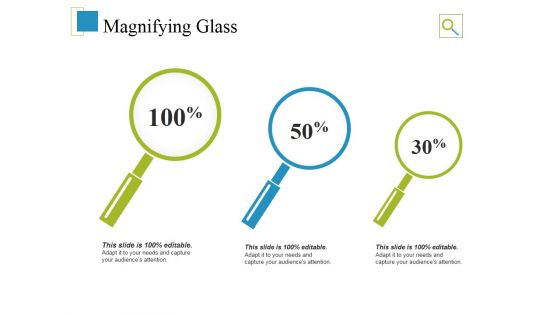
Magnifying Glass Ppt PowerPoint Presentation Infographics Designs Download
This is a magnifying glass ppt powerpoint presentation infographics designs download. This is a three stage process. The stages in this process are magnifying glass, search, marketing, strategy, analysis, business.

Financial Due Diligence Ppt PowerPoint Presentation Infographics Graphics
This is a financial due diligence ppt powerpoint presentation infographics graphics. This is a one stage process. The stages in this process are financial due diligence, marketing, strategy, analysis, business.
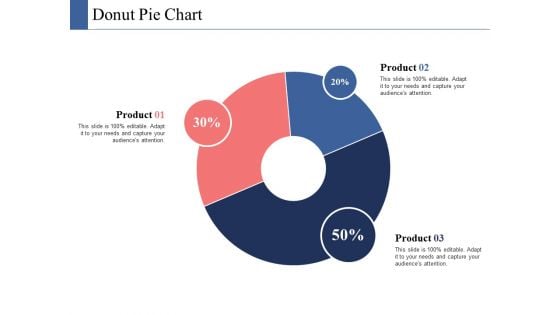
Donut Pie Chart Ppt PowerPoint Presentation Infographics Ideas
This is a donut pie chart ppt powerpoint presentation infographics ideas. This is a three stage process. The stages in this process are donut pie chart, finance, marketing, strategy, analysis.
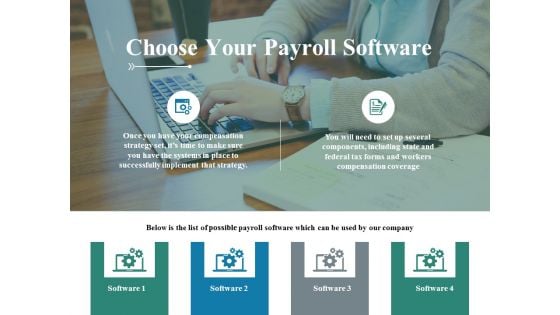
Choose Your Payroll Software Ppt PowerPoint Presentation Infographics Topics
This is a choose your payroll software ppt powerpoint presentation infographics topics. This is a four stage process. The stages in this process are business, icons, marketing, strategy, analysis.
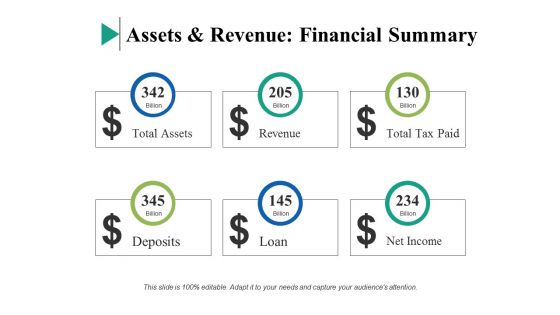
Assets And Revenue Financial Summary Ppt PowerPoint Presentation Infographics Demonstration
This is a assets and revenue financial summary ppt powerpoint presentation infographics demonstration. This is a six stage process. The stages in this process are business, finance, marketing, strategy, analysis, investment.
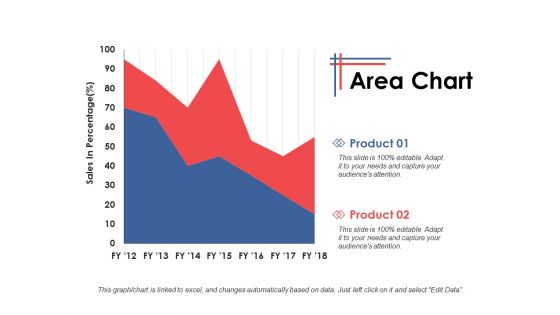
Area Chart Growth Strategy Ppt PowerPoint Presentation Infographics Themes
This is a area chart growth strategy ppt powerpoint presentation infographics themes. This is a two stage process. The stages in this process are finance, marketing, management, investment, analysis.
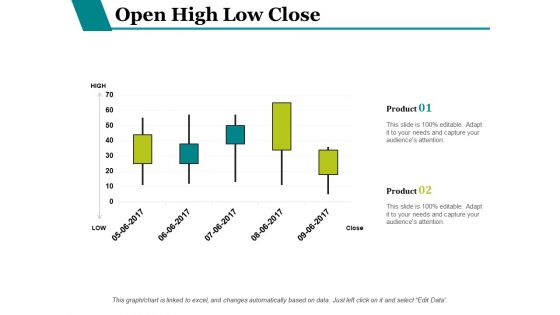
Open High Low Close Ppt PowerPoint Presentation Infographics Inspiration
This is a open high low close ppt powerpoint presentation infographics inspiration. This is a two stage process. The stages in this process are finance, analysis, investment, business, marketing.
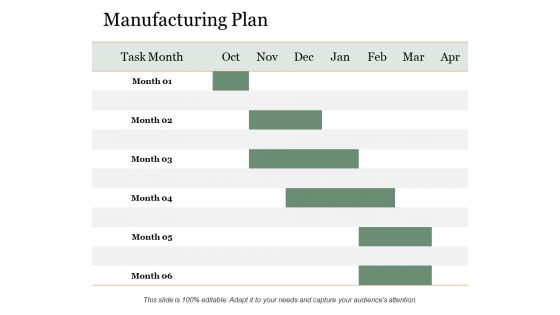
Manufacturing Plan Ppt PowerPoint Presentation Infographics Graphic Tips
This is a manufacturing plan ppt powerpoint presentation infographics graphic tips. This is a six stage process. The stages in this process are manufacturing plan, month, business, marketing, analysis.
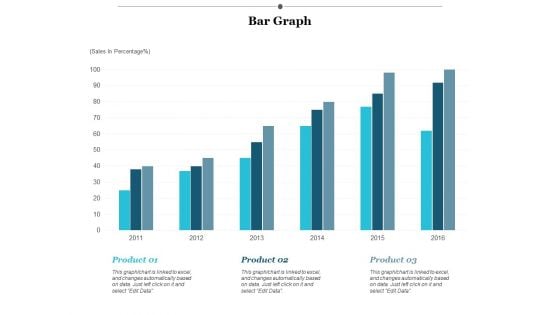
Bar Graph Finance Ppt PowerPoint Presentation Infographics Designs Download
This is a bar graph finance ppt powerpoint presentation infographics designs download. This is a three stage process. The stages in this process are finance, marketing, management, investment, analysis.
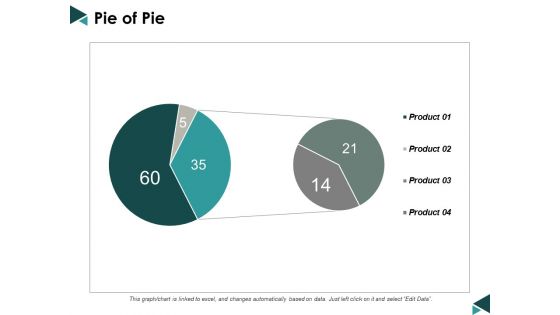
Pie Of Pie Ppt Powerpoint Presentation Infographics Layout Ideas
This is a pie of pie ppt powerpoint presentation infographics layout ideas. This is a four stage process. The stages in this process are pie chart, marketing, business, analysis, management.
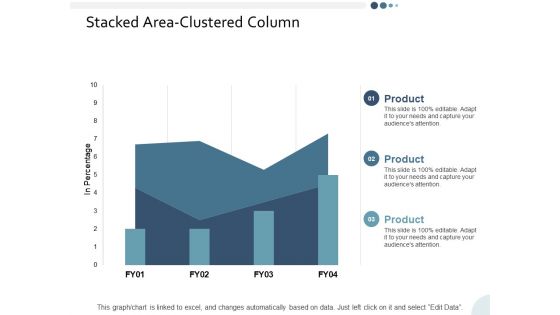
Stacked Area Clustered Column Ppt PowerPoint Presentation Infographics Designs Download
This is a stacked area clustered column ppt powerpoint presentation infographics designs download. This is a three stage process. The stages in this process are business, management, strategy, analysis, marketing.
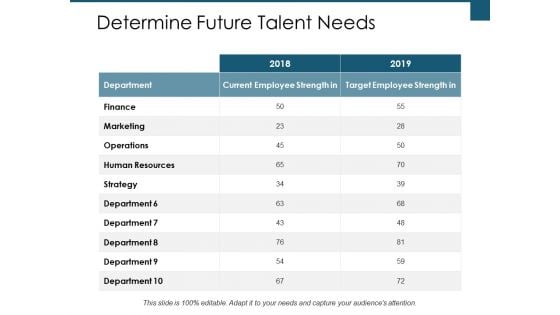
Determine Future Talent Needs Ppt PowerPoint Presentation Infographics Example Introduction
This is a determine future talent needs ppt powerpoint presentation infographics example introduction. This is a three stage process. The stages in this process are finance, analysis, business, investment, marketing.
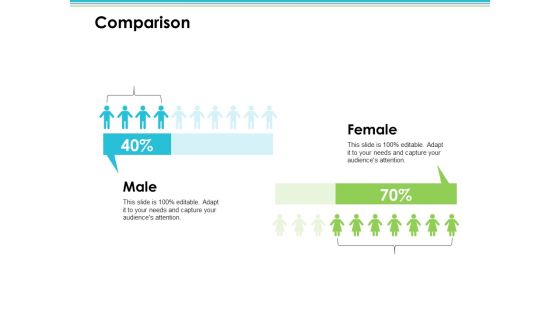
Comparison Employee Value Proposition Ppt PowerPoint Presentation Infographics Master Slide
This is a comparison employee value proposition ppt powerpoint presentation infographics master slide. This is a two stage process. The stages in this process are business, management, strategy, analysis, marketing.
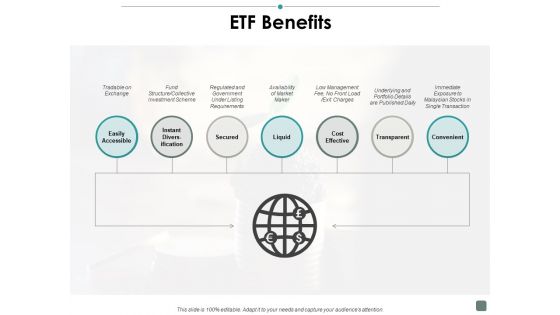
Etf Benefits Contribution Ppt PowerPoint Presentation Infographics Background Images
This is a etf benefits contribution ppt powerpoint presentation infographics background images. This is a seven stage process. The stages in this process are business, management, strategy, analysis, marketing.
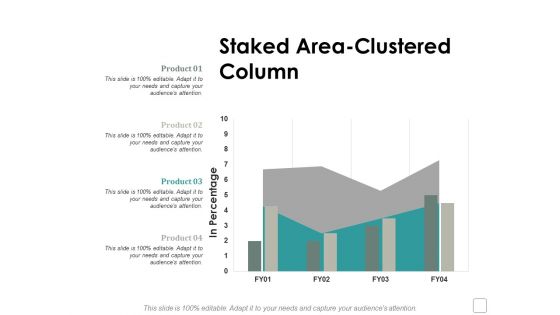
Staked Area Clustered Column Ppt Powerpoint Presentation Infographics Elements
This is a staked area clustered column ppt powerpoint presentation infographics elements. This is a four stage process. The stages in this process are finance, marketing, management, investment, analysis.

Stacked Bar Finance Management Ppt Powerpoint Presentation Infographics Graphics Design
This is a stacked bar finance management ppt powerpoint presentation infographics graphics design. This is a two stage process. The stages in this process are finance, marketing, management, investment, analysis.
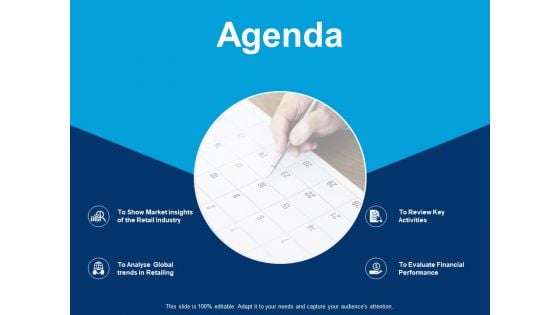
Agenda To Review Key Activities Ppt PowerPoint Presentation Infographics Themes
This is a agenda to review key activities ppt powerpoint presentation infographics themes. This is a four stage process. The stages in this process are business, management, strategy, analysis, marketing.
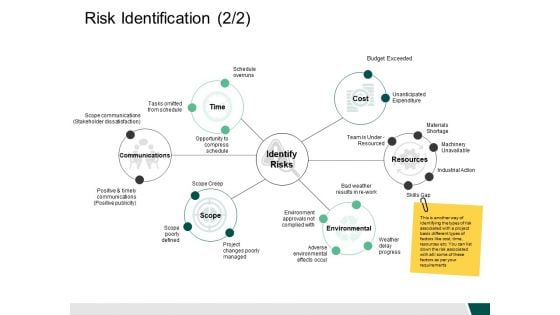
Risk Identification 2 2 Ppt PowerPoint Presentation Infographics Layouts
This is a risk identification 2 2 ppt powerpoint presentation infographics layouts. This is a three stage process. The stages in this process are business, management, strategy, analysis, marketing.
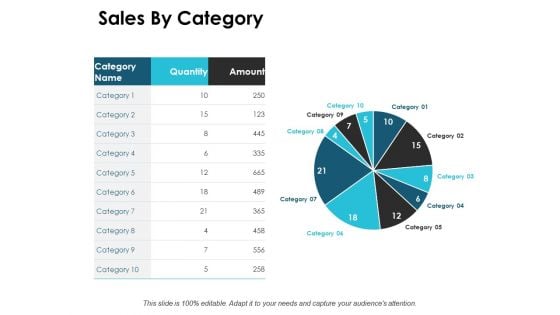
Sales By Category Financial Ppt PowerPoint Presentation Infographics Inspiration
This is a sales by category financial ppt powerpoint presentation infographics inspiration. This is a three stage process. The stages in this process are finance, marketing, management, investment, analysis.
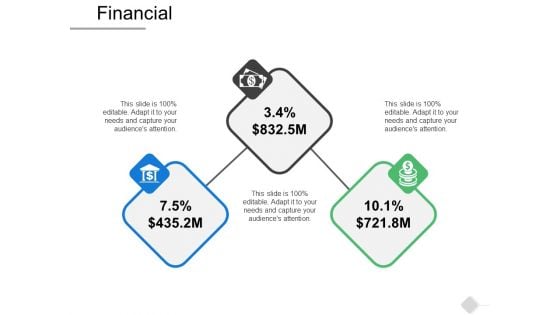
Financial Business Management Ppt PowerPoint Presentation Infographics Layout Ideas
This is a financial business management ppt powerpoint presentation infographics layout ideas. This is a three stage process. The stages in this process are finance, marketing, management, investment, analysis.
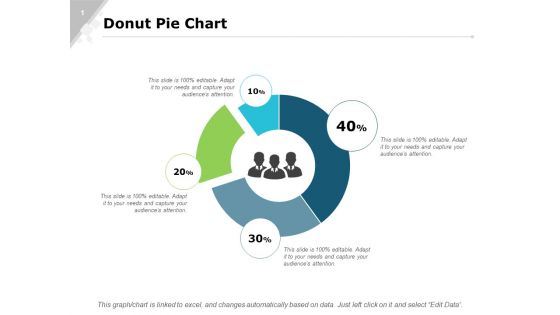
Donut Pie Chart Bar Ppt PowerPoint Presentation Infographics Slide Portrait
This is a donut pie chart bar ppt powerpoint presentation infographics slide portrait. This is a four stage process. The stages in this process are finance, marketing, analysis, investment, million.
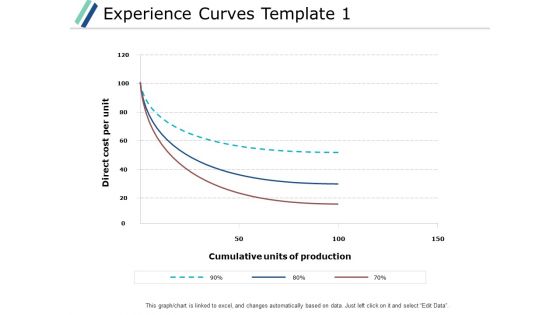
Experience Curves Template Business Ppt PowerPoint Presentation Infographics Design Inspiration
This is a experience curves template business ppt powerpoint presentation infographics design inspiration. This is a three stage process. The stages in this process are finance, marketing, analysis, investment, million.
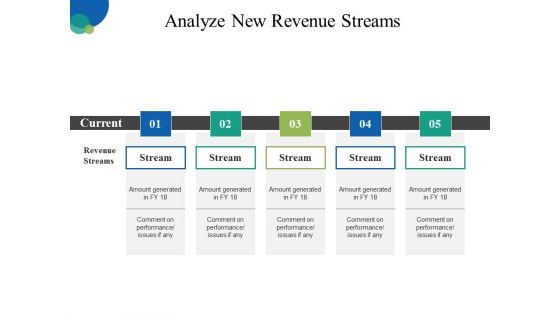
Analyze New Revenue Streams Ppt PowerPoint Presentation Infographics Background Designs
This is a analyze new revenue streams ppt powerpoint presentation infographics background designs. This is a five stage process. The stages in this process are business, management, process, strategy, analysis.
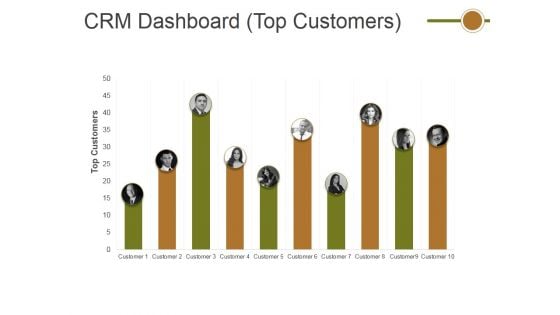
Crm Dashboard Top Customers Ppt PowerPoint Presentation Infographics Format
This is a crm dashboard top customers ppt powerpoint presentation infographics format. This is a ten stage process. The stages in this process are top customers, people, management, business, marketing.


 Continue with Email

 Home
Home


