Map Infographics
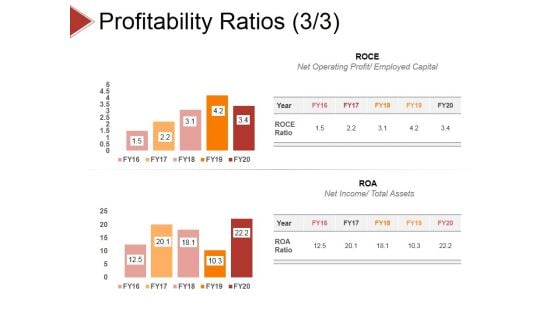
Profitability Ratios Template 2 Ppt PowerPoint Presentation Infographics Layouts
This is a profitability ratios template 2 ppt powerpoint presentation infographics layouts. This is a two stage process. The stages in this process are price to earning ratio, earning per share, market value price per share.
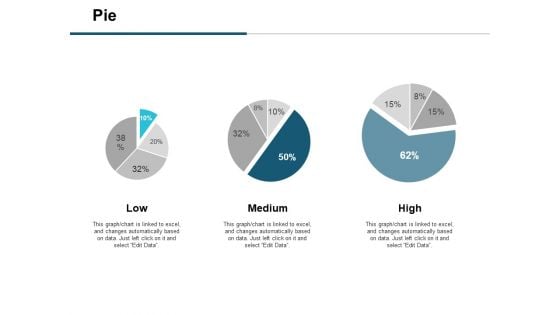
Pie Financial Ppt PowerPoint Presentation Infographics Master Slide
This is a pie financial ppt powerpoint presentation infographics master slide. This is a three stage process. The stages in this process are business strategy, marketing, management, percentage, pie, financial.
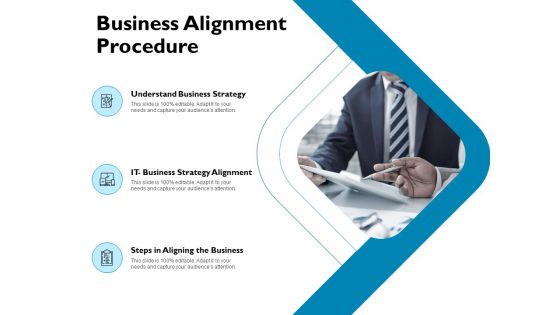
Business Alignment Procedure Ppt PowerPoint Presentation Infographics Example
Presenting this set of slides with name business alignment procedure ppt powerpoint presentation infographics example. This is a three stage process. The stages in this process are understand business strategy, it business strategy alignment, steps aligning business. This is a completely editable PowerPoint presentation and is available for immediate download. Download now and impress your audience.
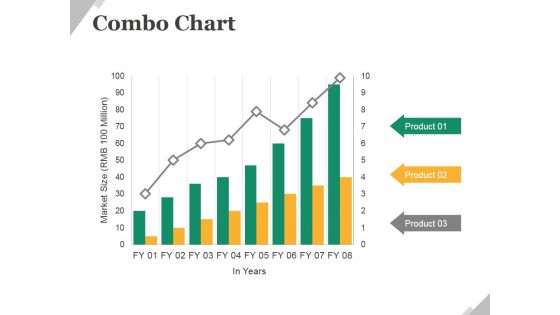
Combo Chart Ppt PowerPoint Presentation Infographics Example Topics
This is a combo chart ppt powerpoint presentation infographics example topics. This is a eight stage process. The stages in this process are business, marketing, growth, combo chart, management.
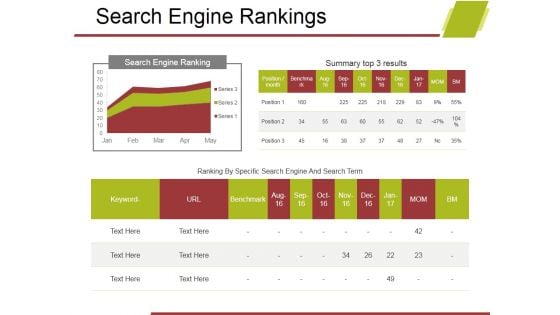
Search Engine Rankings Ppt PowerPoint Presentation Infographics Samples
This is a search engine rankings ppt powerpoint presentation infographics samples. This is a two stage process. The stages in this process are business, management, analysis, strategy, search engine rankings.
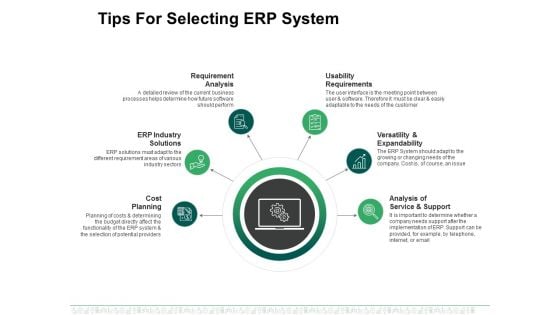
Tips For Selecting Erp System Ppt PowerPoint Presentation Infographics Graphics
This is a tips for selecting erp system ppt powerpoint presentation infographics graphics. This is a six stage process. The stages in this process are cost planning, erp industry solutions, requirement analysis, usability requirements, versatility and expandability.
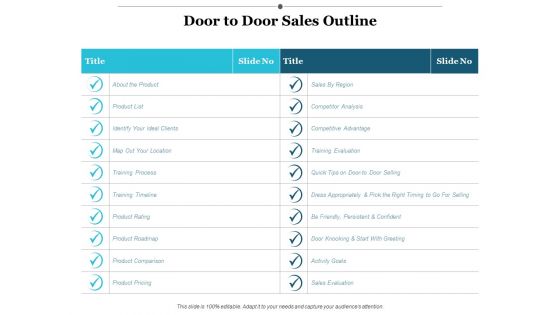
Door To Door Sales Outline Ppt PowerPoint Presentation Infographics Grid
This is a door to door sales outline ppt powerpoint presentation infographics grid. This is a two stage process. The stages in this process are competitive advantage, training evaluation, activity goals, sales evaluation, competitor analysis.
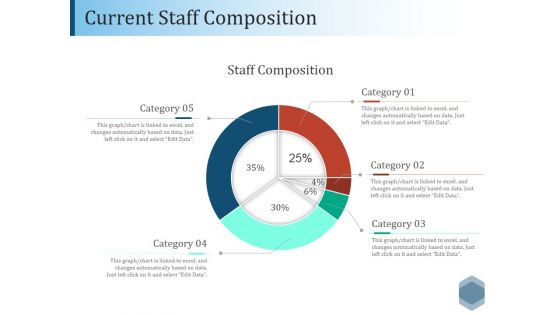
Current Staff Composition Ppt PowerPoint Presentation Infographics Design Inspiration
This is a current staff composition ppt powerpoint presentation infographics design inspiration. This is a five stage process. The stages in this process are staff composition, business, circle, process, planning.
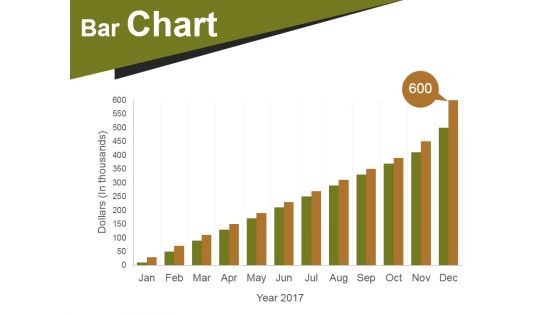
Bar Chart Ppt PowerPoint Presentation Infographics Designs Download
This is a bar chart ppt powerpoint presentation infographics designs download. This is a twelve stage process. The stages in this process are bar chart, business, marketing, strategy, success.
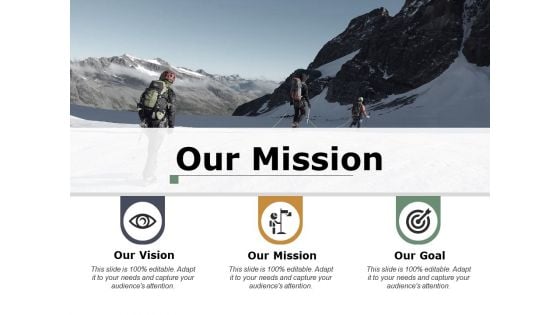
Our Mission Our Vision Ppt PowerPoint Presentation Infographics Rules
This is a our mission our vision ppt powerpoint presentation infographics rules. This is a three stage process. The stages in this process are our mission, our goal, our vision, values, management.
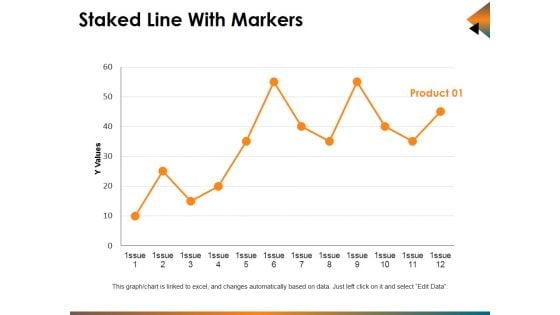
Staked Line With Markers Ppt PowerPoint Presentation Infographics Show
This is a staked line with markers ppt powerpoint presentation infographics show. This is a one stage process. The stages in this process are business, marketing, finance, line, analysis.
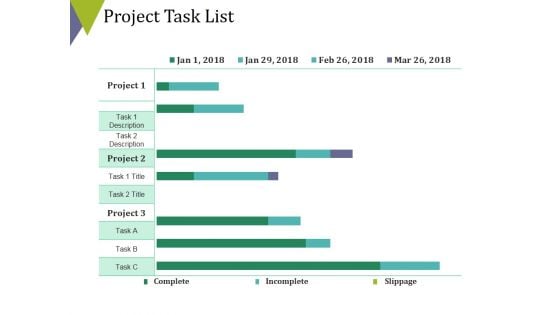
Project Task List Template 2 Ppt PowerPoint Presentation Infographics Brochure
This is a project task list template 2 ppt powerpoint presentation infographics brochure. This is a three stage process. The stages in this process are finance, business, marketing, analysis, strategy.
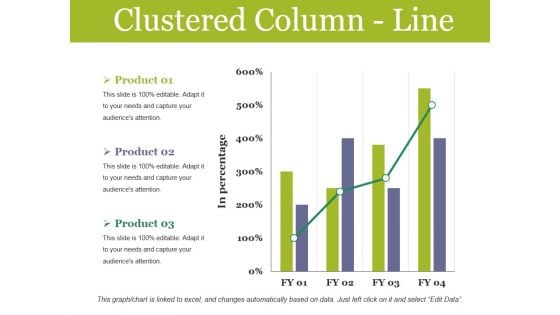
Clustered Column Line Ppt PowerPoint Presentation Infographics Graphics Design
This is a clustered column line ppt powerpoint presentation infographics graphics design. This is a three stage process. The stages in this process are finance, marketing, business, analysis, management.
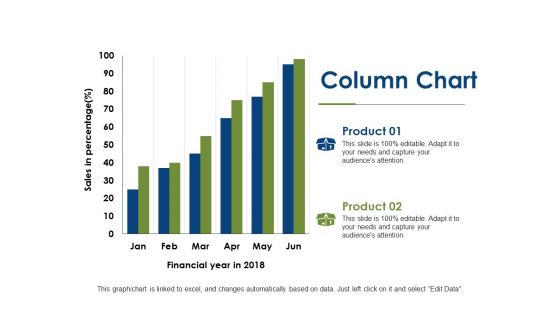
Column Chart Finance Ppt PowerPoint Presentation Infographics Backgrounds
This is a column chart finance ppt powerpoint presentation infographics backgrounds. This is a two stage process. The stages in this process are column chart, investment, marketing, finance, analysis.
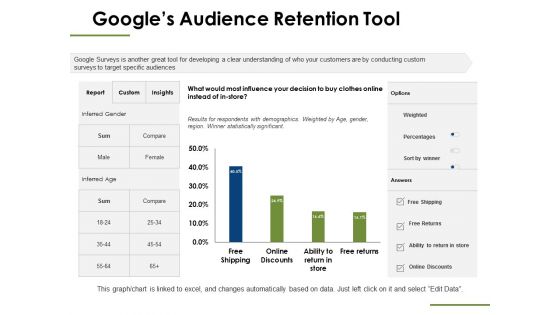
Googles Audience Retention Tool Ppt PowerPoint Presentation Infographics Summary
This is a googles audience retention tool ppt powerpoint presentation infographics summary. This is a four stage process. The stages in this process are business, finance, marketing, investment, analysis.
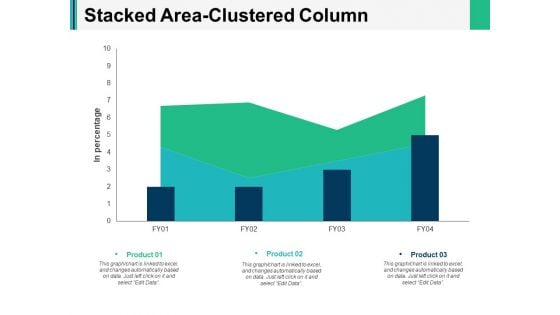
Stacked Area Clustered Column Ppt PowerPoint Presentation Infographics Backgrounds
This is a stacked area clustered column ppt powerpoint presentation infographics backgrounds. This is a three stage process. The stages in this process are finance, marketing, management, investment, analysis.
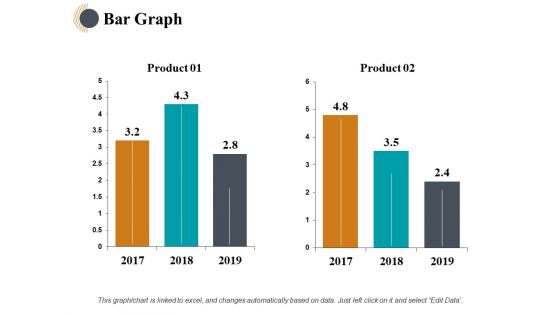
Bar Graph Finance Ppt PowerPoint Presentation Infographics Background Designs
This is a bar graph finance ppt powerpoint presentation infographics background designs. This is a two stage process. The stages in this process are finance, analysis, business, investment, marketing.
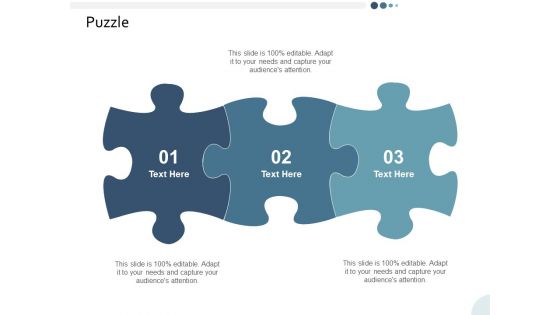
Puzzle Yearly Operating Plan Ppt PowerPoint Presentation Infographics Visual Aids
This is a puzzle yearly operating plan ppt powerpoint presentation infographics visual aids. This is a three stage process. The stages in this process are business, management, strategy, analysis, marketing.
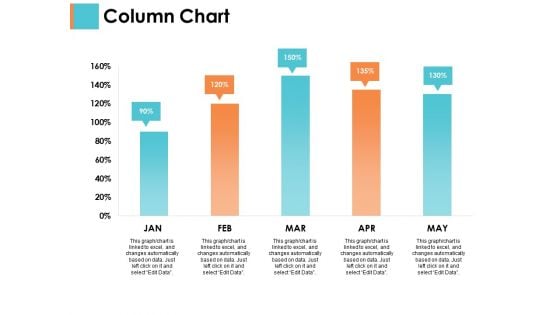
Column Chart Sample Budget Ppt Ppt PowerPoint Presentation Infographics Brochure
This is a column chart sample budget ppt ppt powerpoint presentation infographics brochure. This is a two stage process. The stages in this process are business, management, strategy, analysis, marketing.
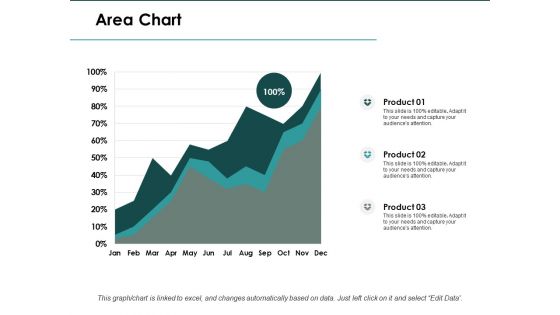
Area Chart Finance Ppt PowerPoint Presentation Infographics Slide
This is a area chart finance ppt powerpoint presentation infographics slide. This is a three stage process. The stages in this process are area chart, finance, marketing, analysis, investment.
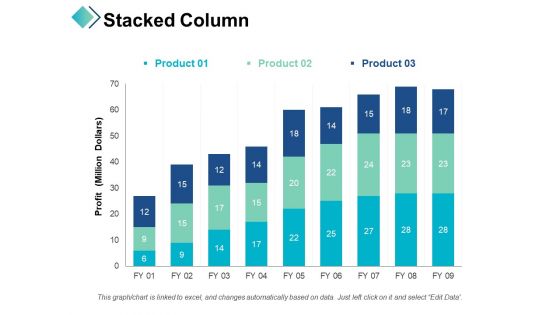
Stacked Column Profit Business Ppt PowerPoint Presentation Infographics Master Slide
This is a stacked column profit business ppt powerpoint presentation infographics master slide. This is a three stage process. The stages in this process are finance, strategy, analysis, business, marketing.
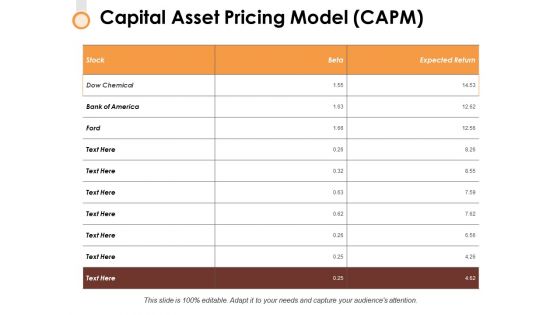
Capital Asset Pricing Model Capm Ppt PowerPoint Presentation Infographics Ideas
This is a capital asset pricing model capm ppt powerpoint presentation infographics ideas. This is a nine stage process. The stages in this process are analysis, strategy, marketing, compare, business.
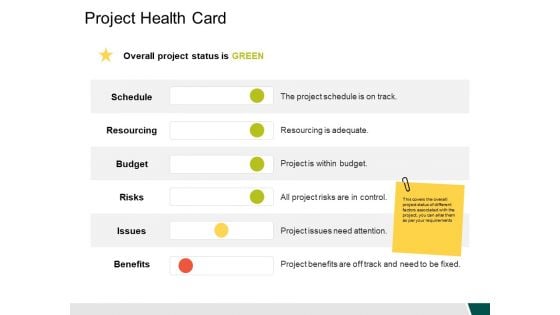
Project Health Card Resourcing Ppt PowerPoint Presentation Infographics Deck
This is a project health card resourcing ppt powerpoint presentation infographics deck. This is a six stage process. The stages in this process are business, management, strategy, analysis, marketing.
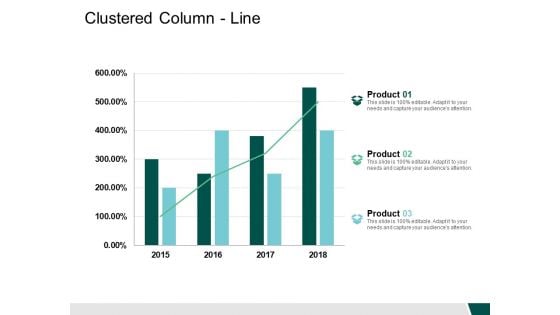
Clustered Column Line Product Financial Ppt PowerPoint Presentation Infographics Guide
This is a clustered column line product financial ppt powerpoint presentation infographics guide. This is a three stage process. The stages in this process are business, finance, strategy, analysis, marketing.

Magnifying Glass Testing Ppt PowerPoint Presentation Infographics Layout Ideas
This is a magnifying glass testing ppt powerpoint presentation infographics layout ideas. This is a five stage process. The stages in this process are technology, icons, strategy, analysis, marketing.
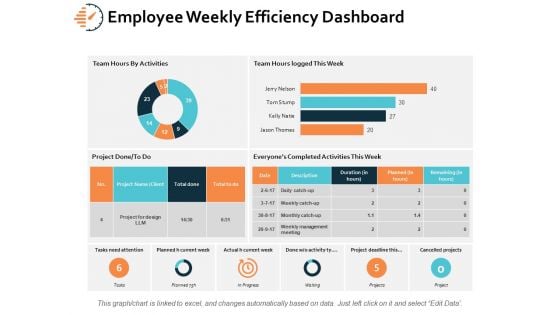
Employee Weekly Efficiency Dashboard Ppt PowerPoint Presentation Infographics Microsoft
This is a employee weekly efficiency dashboard ppt powerpoint presentation infographics microsoft. This is a six stage process. The stages in this process are finance, analysis, business, investment, marketing.
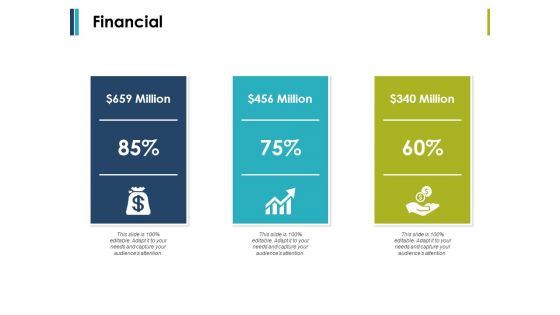
Financial Business Management Ppt PowerPoint Presentation Infographics File Formats
This is a financial business management ppt powerpoint presentation infographics file formats. This is a three stage process. The stages in this process are Finance, Marketing, Management, Investment, Analysis.
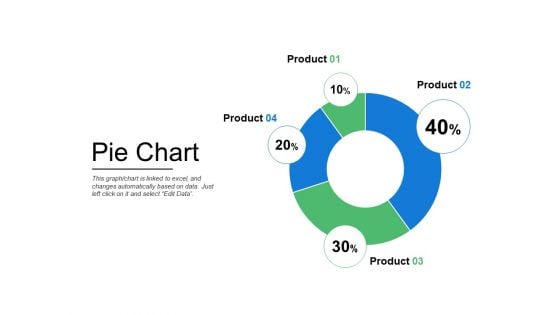
Pie Chart Finance Ppt PowerPoint Presentation Infographics Mockup
This is a pie chart finance ppt powerpoint presentation infographics mockup . This is a four stage process. The stages in this process are finance, marketing, management, investment, analysis.
Enterprise Resource Planning Funnel Ppt PowerPoint Presentation Infographics Icons
This is a enterprise resource planning funnel ppt powerpoint presentation infographics icons. This is a five stage process. The stages in this process are project preparation, situational analysis, software selection, realization and implementation, support from management.

Donut Pie Chart Ppt PowerPoint Presentation Infographics Outfit
This is a donut pie chart ppt powerpoint presentation infographics outfit. This is a three stage process. The stages in this process are business, strategy, analysis, planning, dashboard, finance.
Supplier Evolution Icons Slide Marketing Ppt PowerPoint Presentation Infographics Guidelines
This is a supplier evolution icons slide marketing ppt powerpoint presentation infographics guidelines. This is a one stage process. The stages in this process are business, management, marketing, icons.
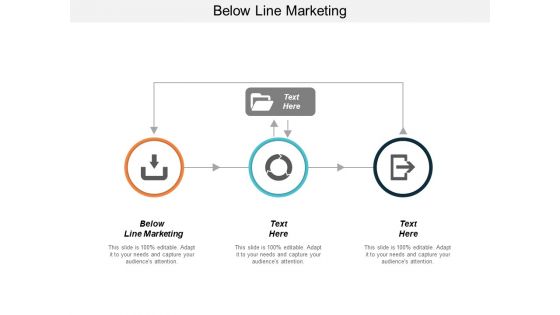
Below Line Marketing Ppt PowerPoint Presentation Infographics Deck Cpb
This is a below line marketing ppt powerpoint presentation infographics deck cpb. The topics discussed in this diagram are below line marketing. This is a completely editable PowerPoint presentation and is available for immediate download.
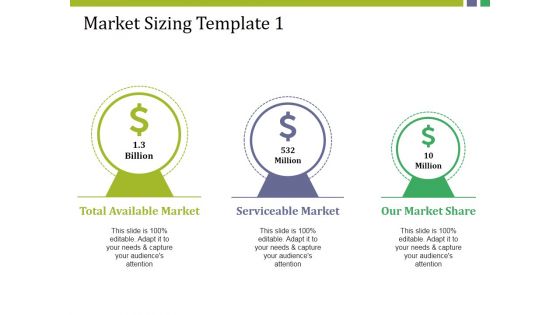
Market Sizing Template 1 Ppt PowerPoint Presentation Infographics Examples
This is a market sizing template 1 ppt powerpoint presentation infographics examples. This is a three stage process. The stages in this process are serviceable market, our market share, total available market, million.

S7 Skills Checklist Questions Ppt PowerPoint Presentation Infographics Clipart
This is a s7 skills checklist questions ppt powerpoint presentation infographics clipart. This is a one stage process. The stages in this process are business, skills checklist questions, management, agenda, success, communication.
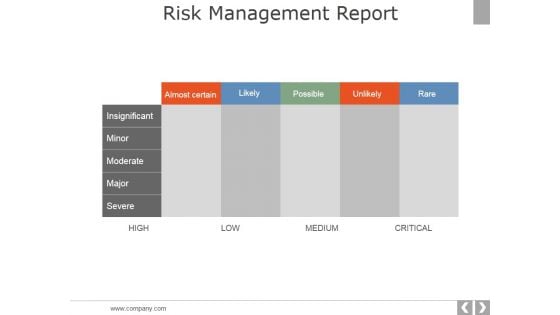
Risk Management Report Template 2 Ppt PowerPoint Presentation Infographics Brochure
This is a risk management report template 2 ppt powerpoint presentation infographics brochure. This is a five stage process. The stages in this process are insignificant, minor, moderate, major, severe.
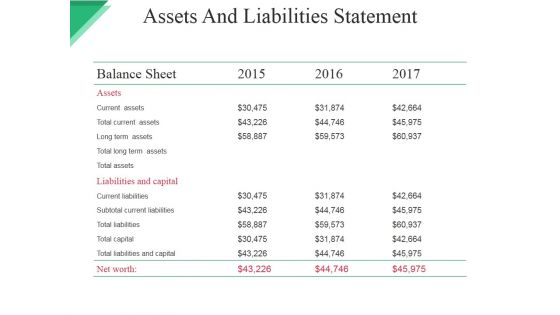
Assets And Liabilities Statement Ppt PowerPoint Presentation Infographics Shapes
This is a assets and liabilities statement ppt powerpoint presentation infographics shapes. This is a three stage process. The stages in this process are balance sheet, current assets, total current assets, long term assets, total long term assets.
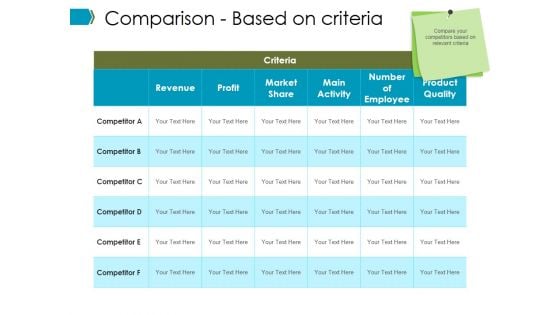
Comparison Based On Criteria Ppt PowerPoint Presentation Infographics Graphics Download
This is a comparison based on criteria ppt powerpoint presentation infographics graphics download. This is a six stage process. The stages in this process are high value, low value, low trust, high trust.
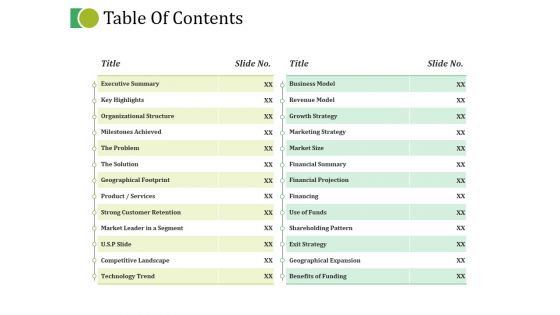
Table Of Contents Ppt PowerPoint Presentation Infographics Mockup
This is a table of contents ppt powerpoint presentation infographics mockup. This is a two stage process. The stages in this process are executive summary, key highlights, organizational structure, milestones achieved, the problem.
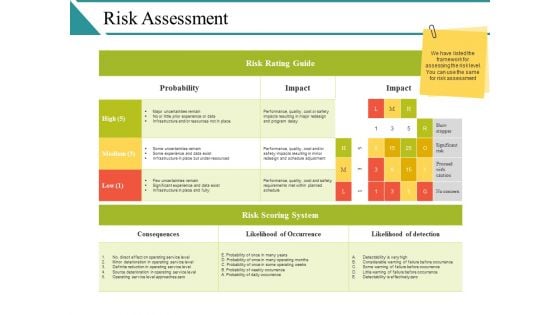
Risk Assessment Ppt PowerPoint Presentation Infographics Background Image
This is a risk assessment ppt powerpoint presentation infographics background image. This is a five stage process. The stages in this process are extreme risk, high risk, moderate risk, low risk, risk scoring results.
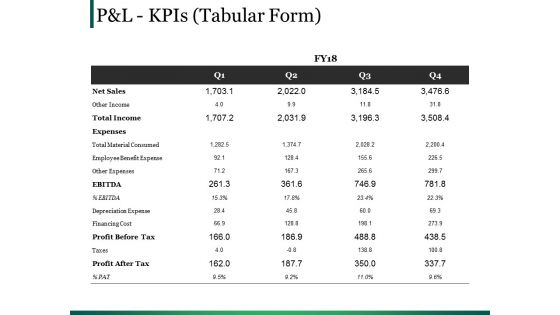
Pandl Kpis Template 1 Ppt PowerPoint Presentation Infographics Tips
This is a pandl kpis template 1 ppt powerpoint presentation infographics tips. This is a four stage process. The stages in this process are ebitda, total income, table, cost, management.
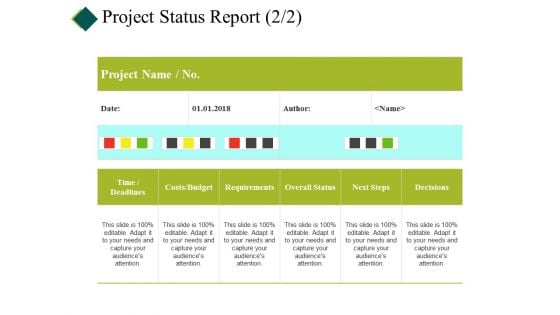
Project Status Report Template Ppt PowerPoint Presentation Infographics Ideas
This is a project status report template ppt powerpoint presentation infographics ideas. This is a five stage process. The stages in this process are cost, planning, table, project report, data management.
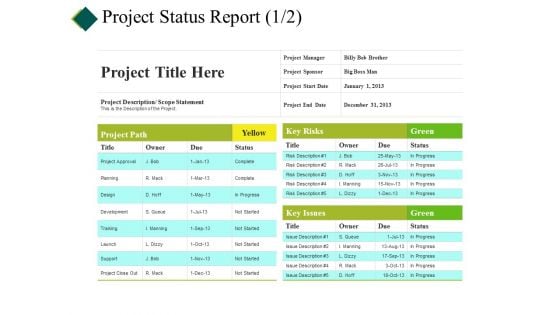
Project Status Report Ppt PowerPoint Presentation Infographics Designs Download
This is a project status report ppt powerpoint presentation infographics designs download. This is a four stage process. The stages in this process are cost, planning, table, project report, data management.

Effective Teamwork In Workplace Ppt PowerPoint Presentation Infographics Show
This is a effective teamwork in workplace ppt powerpoint presentation infographics show. This is a three stage process. The stages in this process are business goals, business objectives, business priorities.
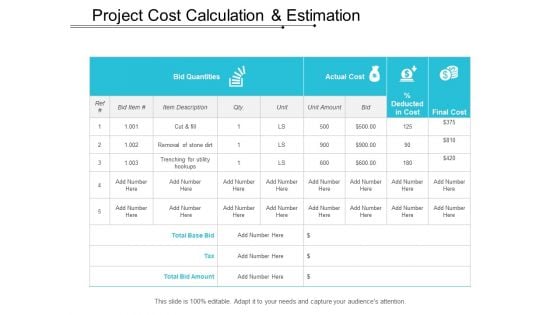
Project Cost Calculation And Estimation Ppt PowerPoint Presentation Infographics Structure
This is a project cost calculation and estimation ppt powerpoint presentation infographics structure. This is a one stage process. The stages in this process are cost control, money control, price control.

Market Drivers And Challenges Ppt PowerPoint Presentation Infographics Guide
This is a market drivers and challenges ppt powerpoint presentation infographics guide. This is a two stage process. The stages in this process are market drivers, drivers, challenges, business, compare.
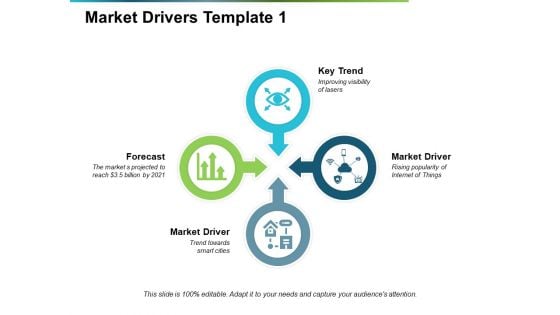
Market Drivers Key Trend Ppt PowerPoint Presentation Infographics Brochure
This is a market drivers key trend ppt powerpoint presentation infographics brochure. This is a four stage process. The stages in this process are key trend, forecast, market driver, icon, strategy.

Omnichannel Ecommerce Marketing Strategies Ppt PowerPoint Presentation Infographics Outline
This is a omnichannel ecommerce marketing strategies ppt powerpoint presentation infographics outline. This is a three stage process. The stages in this process are multi channel marketing, multi channel promotion, multi channel branding.

Design Marketing Collateral Ppt PowerPoint Presentation Infographics Inspiration
This is a design marketing collateral ppt powerpoint presentation infographics inspiration. This is a four stage process. The stages in this process are social media, mobile marketing, website, e mail marketing.
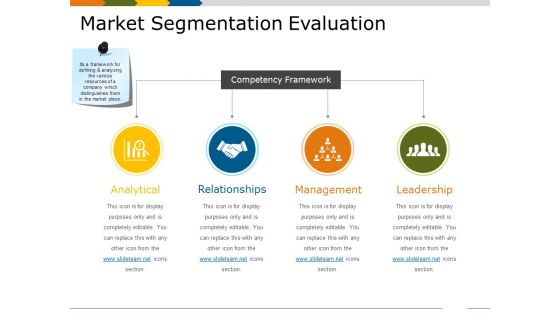
Market Segmentation Evaluation Ppt PowerPoint Presentation Infographics Background
This is a market segmentation evaluation ppt powerpoint presentation infographics background. This is a two stage process. The stages in this process are market sales, net profit, icons, finance, business, marketing.
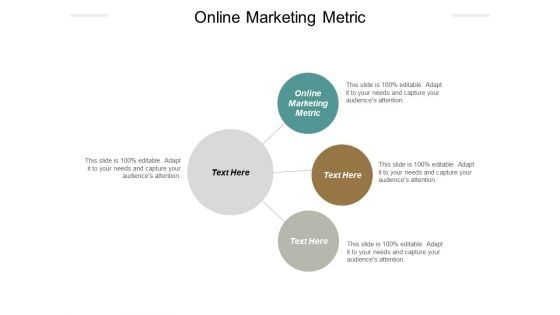
Online Marketing Metric Ppt PowerPoint Presentation Infographics Portrait Cpb
This is a online marketing metric ppt powerpoint presentation infographics portrait cpb. This is a three stage process. The stages in this process are online marketing metric, business, management, marketing.
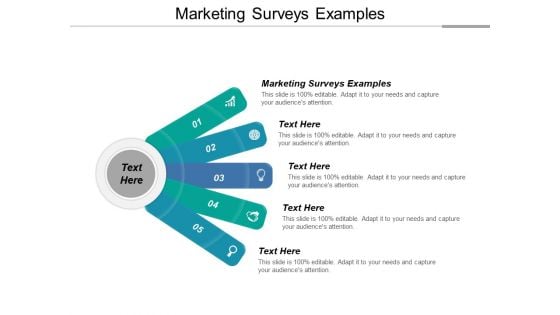
Marketing Surveys Examples Ppt PowerPoint Presentation Infographics Introduction Cpb
This is a marketing surveys examples ppt powerpoint presentation infographics introduction cpb. This is a five stage process. The stages in this process are marketing surveys examples, business, management, marketing.
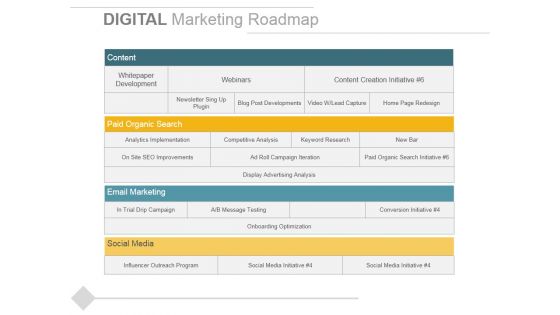
Digital Marketing Roadmap Ppt PowerPoint Presentation Infographics Microsoft
This is a digital marketing roadmap ppt powerpoint presentation infographics microsoft. This is a four stage process. The stages in this process are whitepaper development, webinars, email marketing, social media .
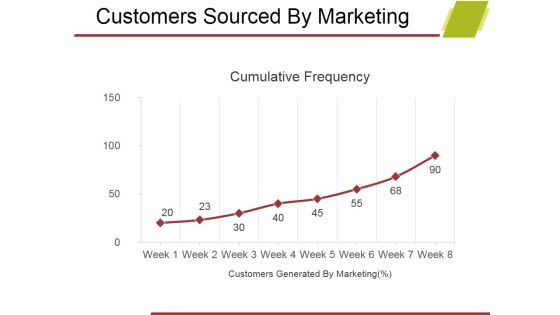
Customers Sourced By Marketing Ppt PowerPoint Presentation Infographics Show
This is a customers sourced by marketing ppt powerpoint presentation infographics show. This is a eight stage process. The stages in this process are business, marketing, finance, growth, management.
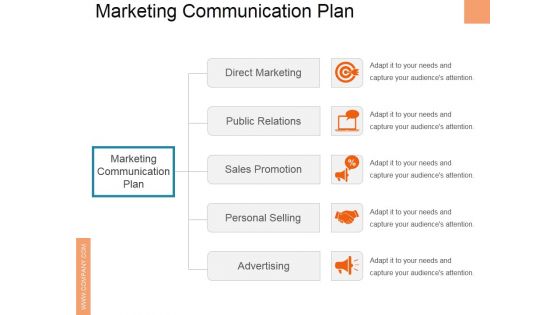
Marketing Communication Plan Ppt PowerPoint Presentation Infographics Mockup
This is a marketing communication plan ppt powerpoint presentation infographics mockup. This is a five stage process. The stages in this process are direct marketing, public relations, sales promotion, personal selling, advertising.
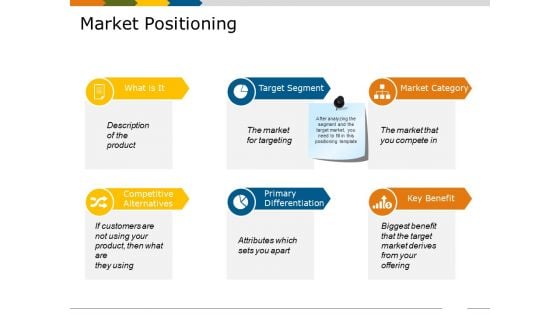
Market Positioning Ppt PowerPoint Presentation Infographics Clipart Images
This is a market positioning ppt powerpoint presentation infographics clipart images. This is a six stage process. The stages in this process are target segment, competitive alternatives, primary differentiation, key benefit, market category.
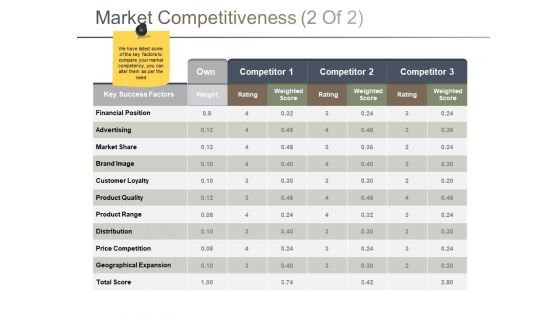
Market Competitiveness Template 2 Ppt PowerPoint Presentation Infographics Influencers
This is a market competitiveness template 2 ppt powerpoint presentation infographics influencers. This is a three stage process. The stages in this process are financial position, advertising, market share, brand image, customer loyalty.
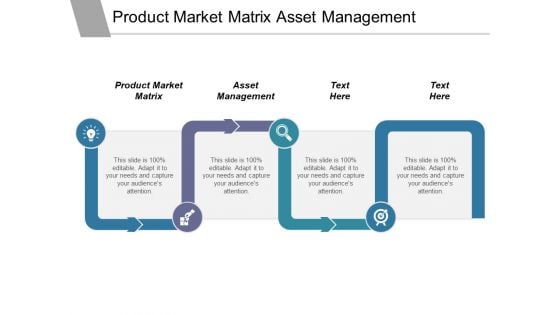
Product Market Matrix Asset Management Ppt PowerPoint Presentation Infographics Examples
This is a product market matrix asset management ppt powerpoint presentation infographics examples. This is a four stage process. The stages in this process are product market matrix, asset management.
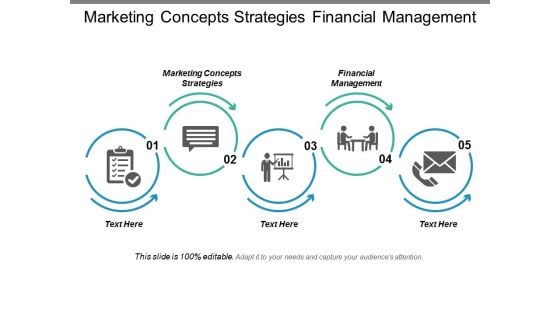
Marketing Concepts Strategies Financial Management Ppt PowerPoint Presentation Infographics Inspiration
This is a marketing concepts strategies financial management ppt powerpoint presentation infographics inspiration. This is a five stage process. The stages in this process are marketing concepts strategies, financial management.
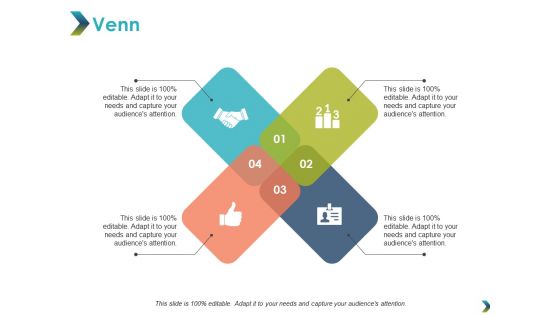
Venn Sales Marketing Ppt Powerpoint Presentation Infographics Graphics Template
This is a venn sales marketing ppt powerpoint presentation infographics graphics template. This is a four stage process. The stages in this process are venn, marketing, sales, strategy, business.

Our Mission Business Marketing Planning Ppt PowerPoint Presentation Infographics Styles
This is a our mission business marketing planning ppt powerpoint presentation infographics styles. This is a one stage process. The stages in this process are our mission, vision, goal, marketing, strategy.


 Continue with Email

 Home
Home


