Market Trends
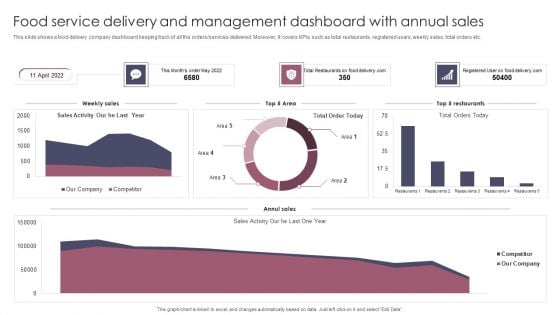
Food Service Delivery And Management Dashboard With Annual Sales Brochure PDF
This slide shows a food delivery company dashboard keeping track of all the orders or services delivered. Moreover, it covers KPIs such as total restaurants, registered users, weekly sales, total orders etc. Showcasing this set of slides titled Food Service Delivery And Management Dashboard With Annual Sales Brochure PDF. The topics addressed in these templates are Food Service Delivery, Management Dashboard, Annual Sales. All the content presented in this PPT design is completely editable. Download it and make adjustments in color, background, font etc. as per your unique business setting.
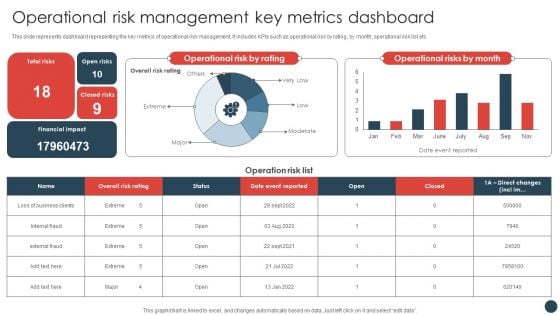
Strategic Risk Management Plan Operational Risk Management Key Metrics Dashboard Structure PDF
This slide represents dashboard representing the key metrics of operational risk management. It includes KPIs such as operational risk by rating, by month, operational risk list etc.Create an editable Strategic Risk Management Plan Operational Risk Management Key Metrics Dashboard Structure PDF that communicates your idea and engages your audience. Whether you are presenting a business or an educational presentation, pre-designed presentation templates help save time. Strategic Risk Management Plan Operational Risk Management Key Metrics Dashboard Structure PDF is highly customizable and very easy to edit, covering many different styles from creative to business presentations. Slidegeeks has creative team members who have crafted amazing templates. So, go and get them without any delay.
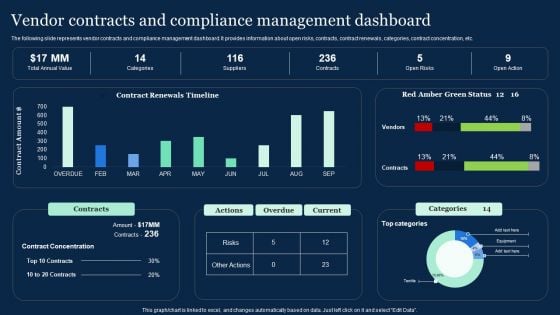
Vendor Contracts And Compliance Management Dashboard Effective Vendor Management For Enhancing Download PDF
The following slide represents vendor contracts and compliance management dashboard. It provides information about open risks, contracts, contract renewals, categories, contract concentration, etc. Get a simple yet stunning designed Vendor Contracts And Compliance Management Dashboard Effective Vendor Management For Enhancing Download PDF. It is the best one to establish the tone in your meetings. It is an excellent way to make your presentations highly effective. So, download this PPT today from Slidegeeks and see the positive impacts. Our easy-to-edit Vendor Contracts And Compliance Management Dashboard Effective Vendor Management For Enhancing Download PDF can be your go-to option for all upcoming conferences and meetings. So, what are you waiting for Grab this template today.
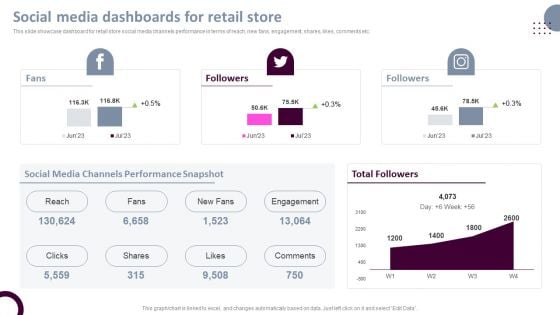
Retail Store Operations Social Media Dashboards For Retail Store Demonstration PDF
This slide showcase dashboard for retail store social media channels performance in terms of reach, new fans, engagement, shares, likes, comments etc. This Retail Store Operations Social Media Dashboards For Retail Store Demonstration PDF is perfect for any presentation, be it in front of clients or colleagues. It is a versatile and stylish solution for organizing your meetings. The Retail Store Operations Social Media Dashboards For Retail Store Demonstration PDF features a modern design for your presentation meetings. The adjustable and customizable slides provide unlimited possibilities for acing up your presentation. Slidegeeks has done all the homework before launching the product for you. So, dont wait, grab the presentation templates today
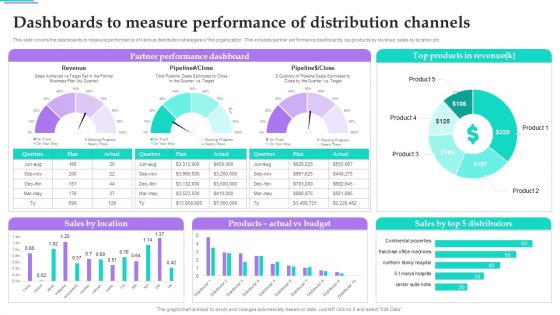
Distribution Strategies For Increasing Dashboards To Measure Performance Of Distribution Summary PDF
This slide covers the dashboards to measure performance of various distribution strategies of the organization. This includes partner performance dashboards, top products by revenue, sales by location etc. Want to ace your presentation in front of a live audience Our Distribution Strategies For Increasing Dashboards To Measure Performance Of Distribution Summary PDF can help you do that by engaging all the users towards you. Slidegeeks experts have put their efforts and expertise into creating these impeccable powerpoint presentations so that you can communicate your ideas clearly. Moreover, all the templates are customizable, and easy-to-edit and downloadable. Use these for both personal and commercial use.
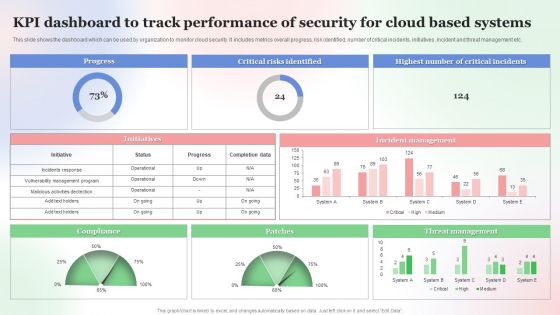
KPI Dashboard To Track Performance Of Security For Cloud Based Systems Clipart PDF
This slide shows the dashboard which can be used by organization to monitor cloud security. It includes metrics overall progress, risk identified, number of critical incidents, initiatives, incident and threat management etc. Showcasing this set of slides titled KPI Dashboard To Track Performance Of Security For Cloud Based Systems Clipart PDF. The topics addressed in these templates are Kpi Dashboard To Track, Performance Of Security, Cloud Based Systems . All the content presented in this PPT design is completely editable. Download it and make adjustments in color, background, font etc. as per your unique business setting.
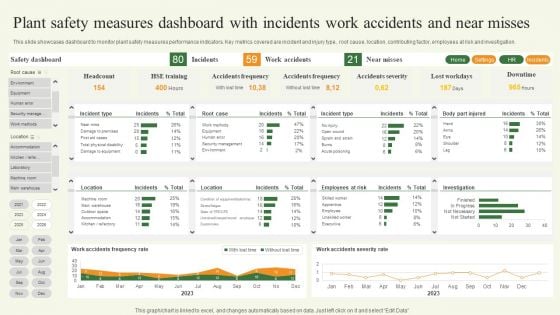
Plant Safety Measures Dashboard With Incidents Work Accidents And Near Misses Template PDF
This slide showcases dashboard to monitor plant safety measures performance indicators. Key metrics covered are incident and injury type, root cause, location, contributing factor, employees at risk and investigation. Pitch your topic with ease and precision using this Plant Safety Measures Dashboard With Incidents Work Accidents And Near Misses Template PDF. This layout presents information on Plant Safety Measures Dashboard, Incidents Work Accidents. It is also available for immediate download and adjustment. So, changes can be made in the color, design, graphics or any other component to create a unique layout.

Inventory Overview Dashboard In Supply Chain Management To Enhance Logistics Operations Summary PDF
This slide showcases the inventory management dashboard. It include KPIs such as inventory value, re-order products, restocking cost, inventory value by vendor, item name, last order date, warehouse, etc. Showcasing this set of slides titled Inventory Overview Dashboard In Supply Chain Management To Enhance Logistics Operations Summary PDF. The topics addressed in these templates are Inventory Overview Dashboard, Supply Chain Management, Enhance Logistics Operations. All the content presented in this PPT design is completely editable. Download it and make adjustments in color, background, font etc. as per your unique business setting.
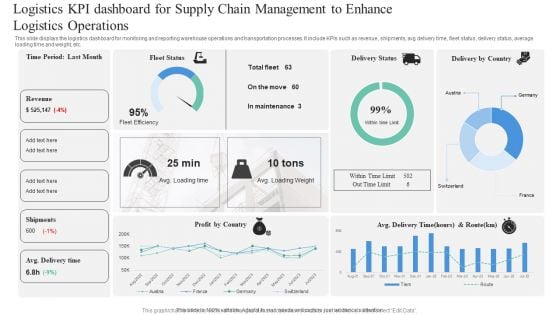
Logistics KPI Dashboard For Supply Chain Management To Enhance Logistics Operations Professional PDF
This slide displays the logistics dashboard for monitoring and reporting warehouse operations and transportation processes. It include KPIs such as revenue, shipments, avg delivery time, fleet status, delivery status, average loading time and weight, etc. Pitch your topic with ease and precision using this Logistics KPI Dashboard For Supply Chain Management To Enhance Logistics Operations Professional PDF. This layout presents information on Logistics KPI, Dashboard For Supply Chain, Management To Enhance, Logistics Operations. It is also available for immediate download and adjustment. So, changes can be made in the color, design, graphics or any other component to create a unique layout.
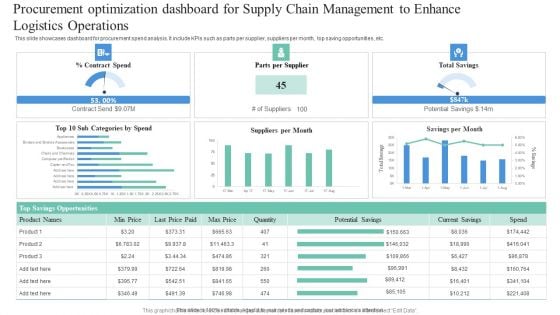
Procurement Optimization Dashboard For Supply Chain Management To Enhance Logistics Operations Elements PDF
This slide showcases dashboard for procurement spend analysis. It include KPIs such as parts per supplier, suppliers per month, top saving opportunities, etc. Pitch your topic with ease and precision using this Procurement Optimization Dashboard For Supply Chain Management To Enhance Logistics Operations Elements PDF. This layout presents information on Procurement Optimization Dashboard, Supply Chain Management, Enhance Logistic Operations. It is also available for immediate download and adjustment. So, changes can be made in the color, design, graphics or any other component to create a unique layout.
Tracking Sales Pipeline And Lead Activity Dashboard Managing Sales Pipeline Health Professional PDF
This slide covers information regarding dashboard associated to tracking lead activity across sales pipeline. Explore a selection of the finest Tracking Sales Pipeline And Lead Activity Dashboard Managing Sales Pipeline Health Professional PDF here. With a plethora of professionally designed and pre-made slide templates, you can quickly and easily find the right one for your upcoming presentation. You can use our Tracking Sales Pipeline And Lead Activity Dashboard Managing Sales Pipeline Health Professional PDF to effectively convey your message to a wider audience. Slidegeeks has done a lot of research before preparing these presentation templates. The content can be personalized and the slides are highly editable. Grab templates today from Slidegeeks.
Dashboard For Tracking Progress Of Media Relations Management Strategies Slides PDF
This slide provides dashboard showcasing impact of media relations plan which helps track campaign performance. It provides information regarding consumer engagement, bounce rate, lead generation, conversion rates and top channels used. Pitch your topic with ease and precision using this Dashboard For Tracking Progress Of Media Relations Management Strategies Slides PDF. This layout presents information on Dashboard For Tracking, Progress Of Media, Relations Management Strategies. It is also available for immediate download and adjustment. So, changes can be made in the color, design, graphics or any other component to create a unique layout.
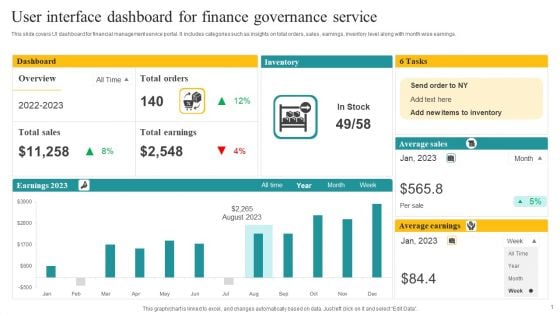
User Interface Dashboard For Finance Governance Service Ppt Outline Graphics Tutorials PDF
This slide covers UI dashboard for financial management service portal. It includes categories such as insights on total orders, sales , earnings, inventory level along with month wise earnings. Showcasing this set of slides titled User Interface Dashboard For Finance Governance Service Ppt Outline Graphics Tutorials PDF. The topics addressed in these templates are Dashboard, Inventory, Average Sales. All the content presented in this PPT design is completely editable. Download it and make adjustments in color, background, font etc. as per your unique business setting.
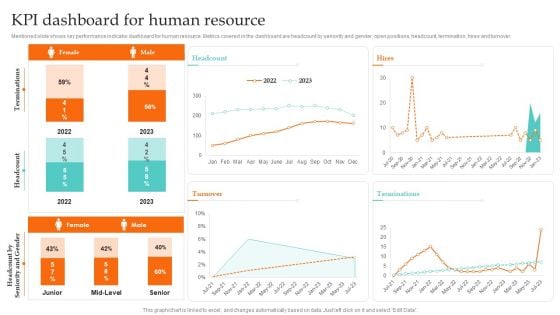
Kpi Dashboard For Human Resource Ultimate Guide To Employee Succession Planning Topics PDF
Mentioned slide shows key performance indicator dashboard for human resource. Metrics covered in the dashboard are headcount by seniority and gender, open positions, headcount, termination, hires and turnover.Present like a pro with Kpi Dashboard For Human Resource Ultimate Guide To Employee Succession Planning Topics PDF Create beautiful presentations together with your team, using our easy-to-use presentation slides. Share your ideas in real-time and make changes on the fly by downloading our templates. So whether you are in the office, on the go, or in a remote location, you can stay in sync with your team and present your ideas with confidence. With Slidegeeks presentation got a whole lot easier. Grab these presentations today.
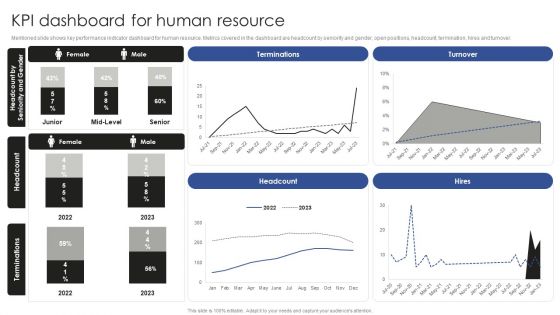
Talent Administration And Succession KPI Dashboard For Human Resource Rules PDF
Mentioned slide shows key performance indicator dashboard for human resource. Metrics covered in the dashboard are headcount by seniority and gender, open positions, headcount, termination, hires and turnover. If your project calls for a presentation, then Slidegeeks is your go-to partner because we have professionally designed, easy-to-edit templates that are perfect for any presentation. After downloading, you can easily edit Talent Administration And Succession KPI Dashboard For Human Resource Rules PDF and make the changes accordingly. You can rearrange slides or fill them with different images. Check out all the handy templates
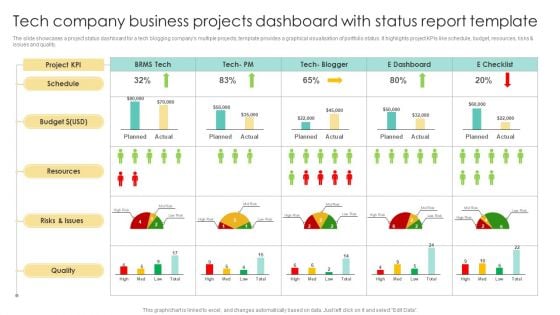
Tech Company Business Projects Dashboard With Status Report Template Brochure PDF
The slide showcases a project status dashboard for a tech blogging companys multiple projects, template provides a graphical visualisation of portfolio status. It highlights project KPIs like schedule, budget, resources, risks and issues and quality. Showcasing this set of slides titled Tech Company Business Projects Dashboard With Status Report Template Brochure PDF. The topics addressed in these templates are Tech Company Business, Projects Dashboard, Status Report Template. All the content presented in this PPT design is completely editable. Download it and make adjustments in color, background, font etc. as per your unique business setting.
KPI Dashboard For Tracking Commercial Banking And Financial Activities Download PDF
This slide depicts a dashboard for tracking the banking and financial activities of a business enterprise to measure the income and expenses. The key performing indicators are business accounts, paid, pending and cancelled transactions etc. Pitch your topic with ease and precision using this KPI Dashboard For Tracking Commercial Banking And Financial Activities Download PDF. This layout presents information on KPI Dashboard, Tracking Commercial Banking, Financial Activities. It is also available for immediate download and adjustment. So, changes can be made in the color, design, graphics or any other component to create a unique layout.
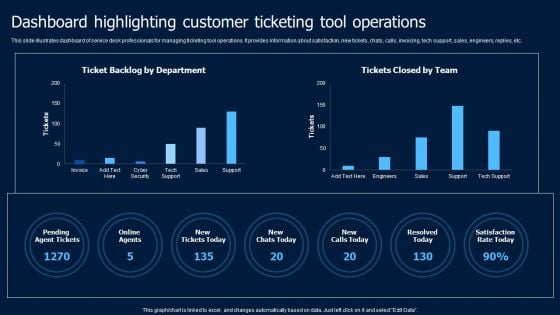
Help Desk Ticketing Dashboard Highlighting Customer Ticketing Tool Operations Introduction PDF
This slide illustrates dashboard of service desk professionals for managing ticketing tool operations. It provides information about satisfaction, new tickets, chats, calls, invoicing, tech support, sales, engineers, replies, etc. Crafting an eye-catching presentation has never been more straightforward. Let your presentation shine with this tasteful yet straightforward Help Desk Ticketing Dashboard Highlighting Customer Ticketing Tool Operations Introduction PDF maining professional. Construct the ideal Help Desk Ticketing Dashboard Highlighting Customer Ticketing Tool Operations Introduction PDF that effortlessly grabs the attention of your audience Begin now and be certain to wow your customers.
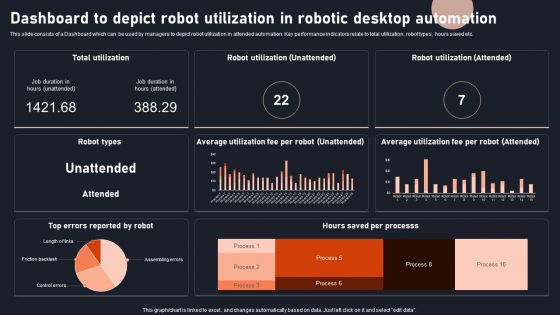
Dashboard To Depict Robot Utilization In Robotic Desktop Automation Download PDF
This slide consists of a Dashboard which can be used by managers to depict robot utilization in attended automation. Key performance indicators relate to total utilization, robot types, hours saved etc. Pitch your topic with ease and precision using this Dashboard To Depict Robot Utilization In Robotic Desktop Automation Download PDF. This layout presents information on Dashboard, Depict Robot Utilization, Robotic Desktop Automation. It is also available for immediate download and adjustment. So, changes can be made in the color, design, graphics or any other component to create a unique layout.
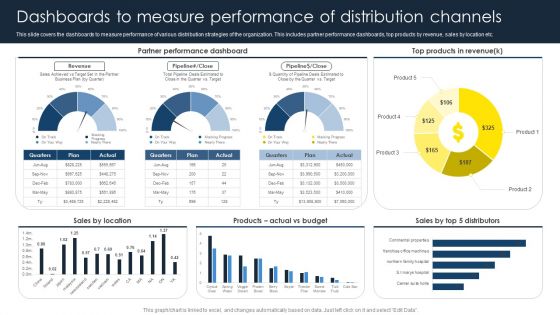
Optimize Business Sales Dashboards To Measure Performance Of Distribution Summary PDF
This slide covers the dashboards to measure performance of various distribution strategies of the organization. This includes partner performance dashboards, top products by revenue, sales by location etc. The best PPT templates are a great way to save time, energy, and resources. Slidegeeks have 100 percent editable powerpoint slides making them incredibly versatile. With these quality presentation templates, you can create a captivating and memorable presentation by combining visually appealing slides and effectively communicating your message. Download Optimize Business Sales Dashboards To Measure Performance Of Distribution Summary PDF from Slidegeeks and deliver a wonderful presentation.
Data Lake Implementation Centralized Repository Data Lake Reporting Dashboard Icons PDF
This slide represents the data lake reporting dashboard by covering the total number of users, total lake size, trusted zone size, conversion rate, and retention. Get a simple yet stunning designed Data Lake Implementation Centralized Repository Data Lake Reporting Dashboard Icons PDF. It is the best one to establish the tone in your meetings. It is an excellent way to make your presentations highly effective. So, download this PPT today from Slidegeeks and see the positive impacts. Our easy-to-edit Data Lake Implementation Centralized Repository Data Lake Reporting Dashboard Icons PDF can be your go-to option for all upcoming conferences and meetings. So, what are you waiting for Grab this template today.
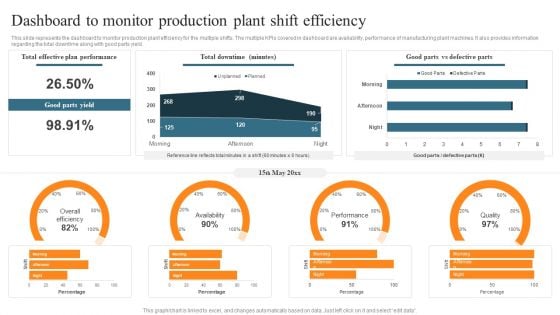
Leveraging Predictive Maintenance To Enhance Production Process Dashboard To Monitor Production Plant Shift Efficiency Structure PDF
This slide represents the dashboard to monitor production plant efficiency for the multiple shifts. The multiple KPIs covered in dashboard are availability, performance of manufacturing plant machines. It also provides information regarding the total downtime along with good parts yield. There are so many reasons you need a Leveraging Predictive Maintenance To Enhance Production Process Dashboard To Monitor Production Plant Shift Efficiency Structure PDF. The first reason is you cant spend time making everything from scratch, Thus, Slidegeeks has made presentation templates for you too. You can easily download these templates from our website easily.
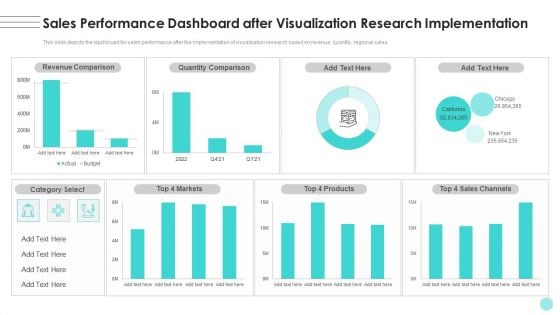
Branches For Visualization Research And Development Sales Performance Dashboard After Infographics PDF
This slide depicts the dashboard for sales performance after the implementation of visualization research based on revenue, quantity, regional sales. Crafting an eye-catching presentation has never been more straightforward. Let your presentation shine with this tasteful yet straightforward Branches For Visualization Research And Development Sales Performance Dashboard After Infographics PDF template. It offers a minimalistic and classy look that is great for making a statement. The colors have been employed intelligently to add a bit of playfulness while still remaining professional. Construct the ideal Branches For Visualization Research And Development Sales Performance Dashboard After Infographics PDF that effortlessly grabs the attention of your audience Begin now and be certain to wow your customers.
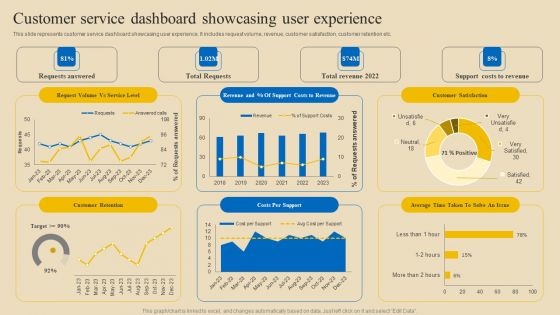
Implementing Digital Customer Service Customer Service Dashboard Showcasing User Portrait PDF
This slide represents customer service dashboard showcasing user experience. It includes request volume, revenue, customer satisfaction, customer retention etc. Get a simple yet stunning designed Implementing Digital Customer Service Customer Service Dashboard Showcasing User Portrait PDF. It is the best one to establish the tone in your meetings. It is an excellent way to make your presentations highly effective. So, download this PPT today from Slidegeeks and see the positive impacts. Our easy-to-edit Implementing Digital Customer Service Customer Service Dashboard Showcasing User Portrait PDF can be your go-to option for all upcoming conferences and meetings. So, what are you waiting for Grab this template today.
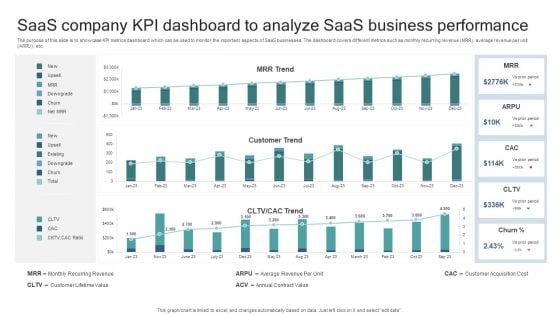
Saas Company KPI Dashboard To Analyze Saas Business Performance Elements PDF
The purpose of this slide is to showcase KPI metrics dashboard which can be used to monitor the important aspects of SaaS businesses. The dashboard covers different metrics such as monthly recurring revenue MRR, average revenue per unit ARPU, etc. Pitch your topic with ease and precision using this Saas Company KPI Dashboard To Analyze Saas Business Performance Elements PDF. This layout presents information on Monthly Recurring Revenue, Customer Lifetime Value, Average Revenue Per Unit, Annual Contract Value, Customer Acquisition Cost. It is also available for immediate download and adjustment. So, changes can be made in the color, design, graphics or any other component to create a unique layout.
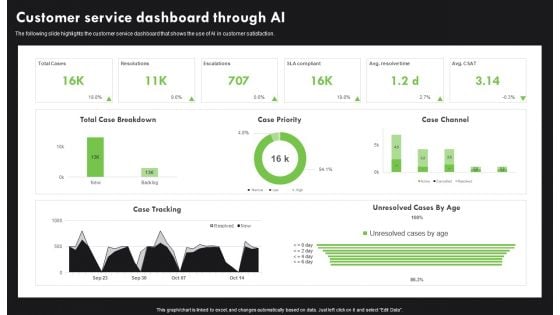
AI Deployment In IT Process Customer Service Dashboard Through AI Infographics PDF
The following slide highlights the customer service dashboard that shows the use of AI in customer satisfaction. Explore a selection of the finest AI Deployment In IT Process Customer Service Dashboard Through AI Infographics PDF here. With a plethora of professionally designed and pre made slide templates, you can quickly and easily find the right one for your upcoming presentation. You can use our AI Deployment In IT Process Customer Service Dashboard Through AI Infographics PDF to effectively convey your message to a wider audience. Slidegeeks has done a lot of research before preparing these presentation templates. The content can be personalized and the slides are highly editable. Grab templates today from Slidegeeks.
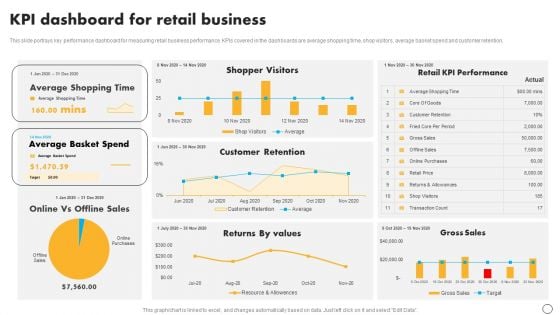
Retail Business Optimization Through Operational Excellence Strategy KPI Dashboard For Retail Business Mockup PDF
This slide portrays key performance dashboard for measuring retail business performance. KPIs covered in the dashboards are average shopping time, shop visitors, average basket spend and customer retention. Boost your pitch with our creative Retail Business Optimization Through Operational Excellence Strategy KPI Dashboard For Retail Business Mockup PDF. Deliver an awe-inspiring pitch that will mesmerize everyone. Using these presentation templates you will surely catch everyones attention. You can browse the ppts collection on our website. We have researchers who are experts at creating the right content for the templates. So you do not have to invest time in any additional work. Just grab the template now and use them.
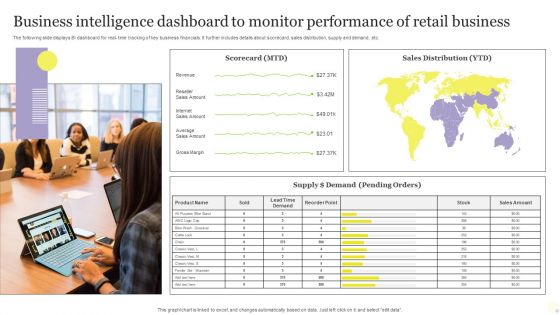
Business Intelligence Dashboard To Monitor Performance Of Retail Business Infographics PDF
The following slide displays BI dashboard for real time tracking of key business financials. It further includes details about scorecard, sales distribution, supply and demand, etc. Pitch your topic with ease and precision using this Business Intelligence Dashboard To Monitor Performance Of Retail Business Infographics PDF. This layout presents information on Business Intelligence Dashboard, Monitor Performance, Retail Business. It is also available for immediate download and adjustment. So, changes can be made in the color, design, graphics or any other component to create a unique layout.
Optimizing Consumer Lead Nurturing Procedure Lead Generation Dashboard For Tracking Introduction PDF
This slide covers the KPI dashboard for tracking lead conversion rates. It includes metrics such as visitors, average session rate, per visit, bounce rate, page views, etc. Create an editable Optimizing Consumer Lead Nurturing Procedure Lead Generation Dashboard For Tracking Introduction PDF that communicates your idea and engages your audience. Whether youre presenting a business or an educational presentation, pre designed presentation templates help save time. Optimizing Consumer Lead Nurturing Procedure Lead Generation Dashboard For Tracking Introduction PDF is highly customizable and very easy to edit, covering many different styles from creative to business presentations. Slidegeeks has creative team members who have crafted amazing templates. So, go and get them without any delay.

KPI Analytics Dashboard With Sourcing Raw Material Cycle Time Inspiration PDF
Following slide shows the key performance indicator KPI dashboard which will assist corporates to effectively monitor procurement process. The metrics are number of suppliers, contract compliance, average procurement cycle time, etc. Showcasing this set of slides titled KPI Analytics Dashboard With Sourcing Raw Material Cycle Time Inspiration PDF. The topics addressed in these templates are Kpi Analytics Dashboard, Sourcing Raw Material, Cycle Time. All the content presented in this PPT design is completely editable. Download it and make adjustments in color, background, font etc. as per your unique business setting.
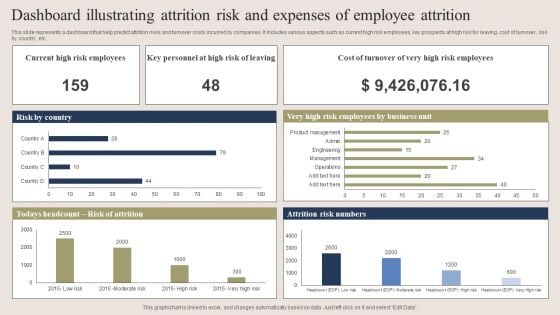
Dashboard Illustrating Attrition Risk And Expenses Of Employee Attrition Clipart PDF
This slide represents a dashboard that help predict attrition risks and turnover costs incurred by companies. It includes various aspects such as current high risk employees, key prospects at high risk for leaving, cost of turnover, risk by country, etc. Pitch your topic with ease and precision using this Dashboard Illustrating Attrition Risk And Expenses Of Employee Attrition Clipart PDF. This layout presents information on Dashboard Illustrating Attrition Risk, Expenses Of Employee Attrition . It is also available for immediate download and adjustment. So, changes can be made in the color, design, graphics or any other component to create a unique layout.
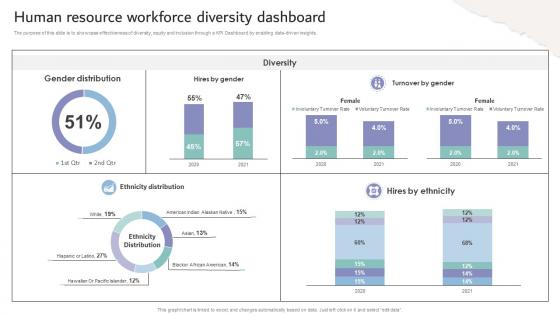
Inclusive Workplace Training Program Human Resource Workforce Diversity Dashboard DTE SS V
The purpose of this slide is to showcase effectiveness of diversity, equity and inclusion through a KPI Dashboard by enabling data-driven insights. Make sure to capture your audiences attention in your business displays with our gratis customizable Inclusive Workplace Training Program Human Resource Workforce Diversity Dashboard DTE SS V. These are great for business strategies, office conferences, capital raising or task suggestions. If you desire to acquire more customers for your tech business and ensure they stay satisfied, create your own sales presentation with these plain slides. The purpose of this slide is to showcase effectiveness of diversity, equity and inclusion through a KPI Dashboard by enabling data-driven insights.
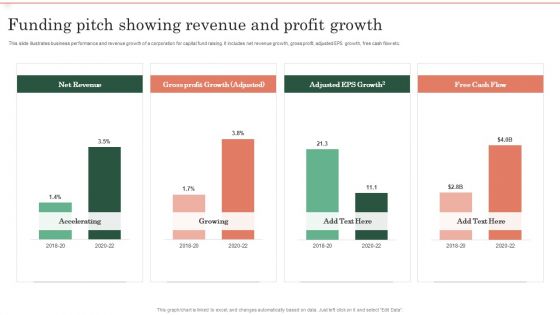
Funding Pitch Showing Revenue And Profit Growth Ppt Gallery Objects PDF
This slide illustrates business performance and revenue growth of a corporation for capital fund raising. It includes net revenue growth, gross profit, adjusted EPS growth, free cash flow etc. Showcasing this set of slides titled Funding Pitch Showing Revenue And Profit Growth Ppt Gallery Objects PDF. The topics addressed in these templates are Net Revenue, Gross profit Growth, Adjusted EPS Growth. All the content presented in this PPT design is completely editable. Download it and make adjustments in color, background, font etc. as per your unique business setting.
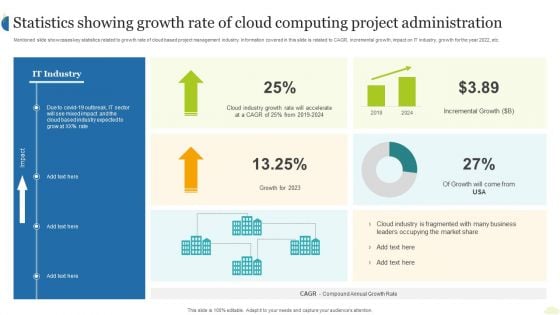
Statistics Showing Growth Rate Of Cloud Computing Project Administration Ppt Ideas Aids PDF
Mentioned slide showcases key statistics related to growth rate of cloud based project management industry. Information covered in this slide is related to CAGR, incremental growth, impact on IT industry, growth for the year 2022, etc. Showcasing this set of slides titled Statistics Showing Growth Rate Of Cloud Computing Project Administration Ppt Ideas Aids PDF. The topics addressed in these templates are IT Industry, Growth 2023, Incremental Growth. All the content presented in this PPT design is completely editable. Download it and make adjustments in color, background, font etc. as per your unique business setting.
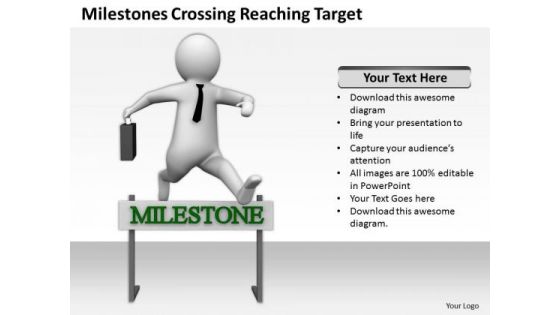
Successful Business People Milestones Crossing Reaching Target PowerPoint Templates
We present our successful business people milestones crossing reaching target PowerPoint templates.Download our People PowerPoint Templates because You are an avid believer in ethical practices. Highlight the benefits that accrue with our PowerPoint Templates and Slides. Download our Competition PowerPoint Templates because our PowerPoint Templates and Slides will give your ideas the shape. Download and present our Sports PowerPoint Templates because Our PowerPoint Templates and Slides will give good value for money. They also have respect for the value of your time. Use our Business PowerPoint Templates because our PowerPoint Templates and Slides are the string of your bow. Fire of your ideas and conquer the podium. Download our Targets PowerPoint Templates because Our PowerPoint Templates and Slides are the chords of your song. String them along and provide the lilt to your views.Use these PowerPoint slides for presentations relating to training, business, icon, human, target, 3d, advantage, courses, guy, preparation, achievement, challenge, race, success, trouble, win, fail, obstacle, character, dynamic, occupation, jump, anonymous, goal, people, different, idea, aspiration, barrier, case, run, problem, person, competition, education, inspiration, work, successful, manager, man, crisis, hurdle, sport, businessman, performance, impediment. The prominent colors used in the PowerPoint template are Green, Gray, Black. Drown doubts with our Successful Business People Milestones Crossing Reaching Target PowerPoint Templates. You will come out on top.
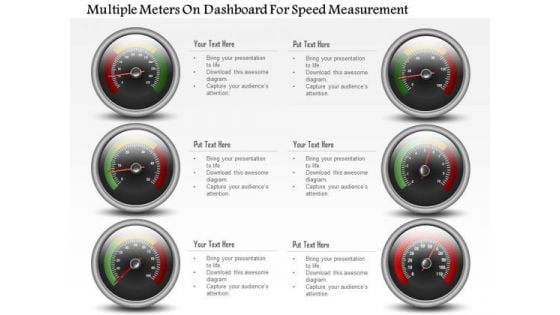
Business Diagram Multiple Meters On Dashboard For Speed Measurement PowerPoint Slide
This business diagram has been designed with multiple meters on dashboard. This slide can be used for business planning and progress. Use this diagram for your business and success milestones related presentations.
Business Diagram Dashboard With Pointer And Text Boxes For Process Control Presentation Template
This business diagram displays graphic of dashboard with pointer and text boxes. This slide helps to depict concept of business process and management. Present your views using this innovative slide and be assured of leaving a lasting impression.
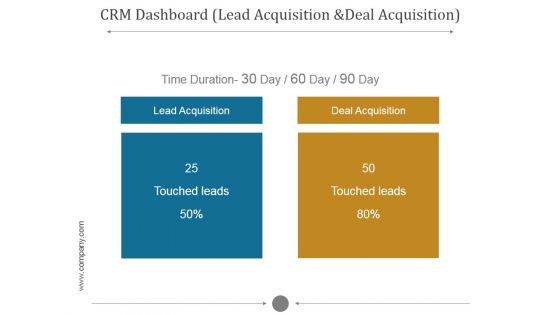
Crm Dashboard Lead Acquisition And Deal Acquisition Ppt PowerPoint Presentation Inspiration
This is a crm dashboard lead acquisition and deal acquisition ppt powerpoint presentation inspiration. This is a five stage process. The stages in this process are touched leads, lead acquisition, deal acquisition, time duration.

Customer Relationship Management Process And Dashboard PPT PowerPoint Presentation Complete Deck With Slides
This is a customer relationship management process and dashboard ppt powerpoint presentation complete deck with slides. This is a one stage process. The stages in this process are sales, service, strategy, revenue, customer service.
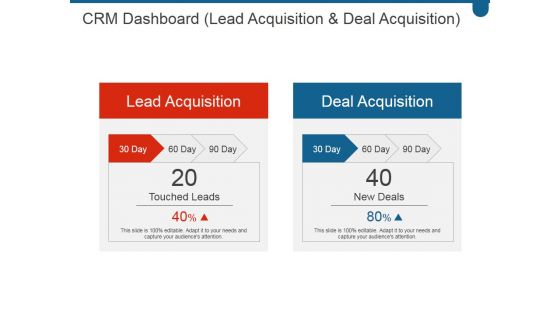
Crm Dashboard Lead Acquisition And Deal Acquisition Ppt PowerPoint Presentation Tips
This is a crm dashboard lead acquisition and deal acquisition ppt powerpoint presentation tips. This is a two stage process. The stages in this process are lead acquisition, deal acquisition, touched leads, new deals.
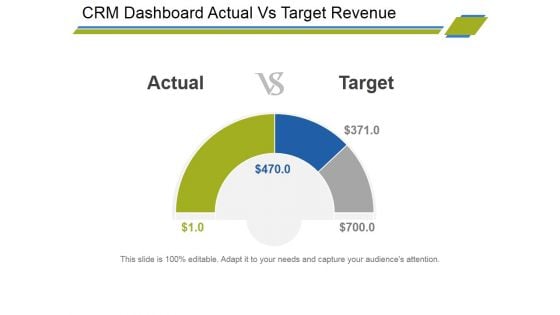
Crm Dashboard Actual Vs Target Revenue Ppt PowerPoint Presentation Outline Example File
This is a crm dashboard actual vs target revenue ppt powerpoint presentation outline example file. This is a three stage process. The stages in this process are actual, target.
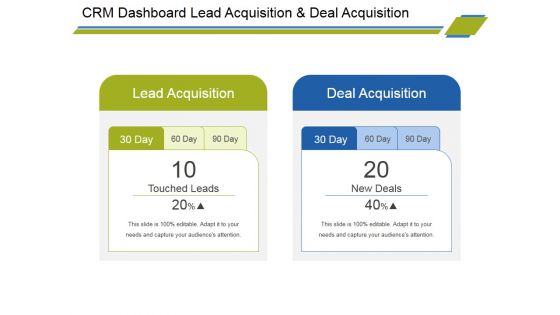
Crm Dashboard Lead Acquisition And Deal Acquisition Ppt PowerPoint Presentation Professional File Formats
This is a crm dashboard lead acquisition and deal acquisition ppt powerpoint presentation professional file formats. This is a two stage process. The stages in this process are lead acquisition, deal acquisition.
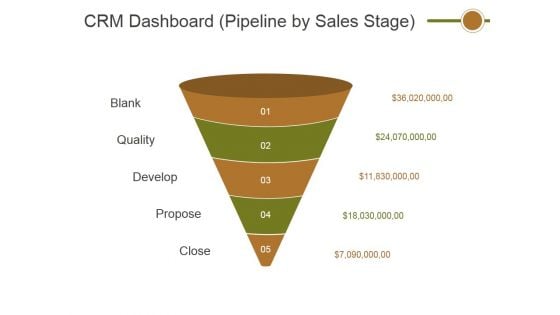
Crm Dashboard Pipeline By Sales Stage Ppt PowerPoint Presentation Outline Outfit
This is a crm dashboard pipeline by sales stage ppt powerpoint presentation outline outfit. This is a five stage process. The stages in this process are blank, quality, develop, propose, close.
Sales Lead Tracking Tools Dashboards And Reports Ppt PowerPoint Presentation Model Format
This is a sales lead tracking tools dashboards and reports ppt powerpoint presentation model format. This is a six stage process. The stages in this process are crm sales, crm leads, crm conversion.

Business Review And Performance Assessment Dashboards Ppt PowerPoint Presentation Infographics Show
This is a business review and performance assessment dashboards ppt powerpoint presentation infographics show. This is a four stage process. The stages in this process are year in review, yearly highlights, countdowns.
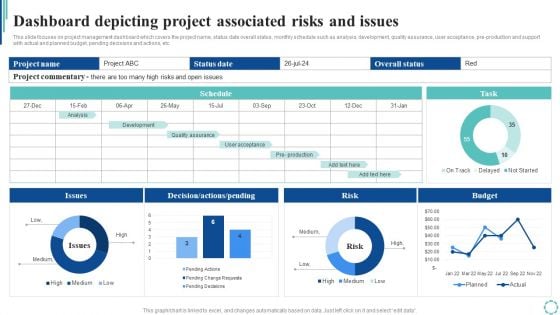
Dashboard Depicting Project Associated Risks And Issues Strategies To Enhance Project Lifecycle Background PDF
This slide focuses on project management dashboard which covers the project name, status date overall status, monthly schedule such as analysis, development, quality assurance, user acceptance, pre-production and support with actual and planned budget, pending decisions and actions, etc.Presenting this PowerPoint presentation, titled Dashboard Depicting Project Associated Risks And Issues Strategies To Enhance Project Lifecycle Background PDF, with topics curated by our researchers after extensive research. This editable presentation is available for immediate download and provides attractive features when used. Download now and captivate your audience. Presenting this Dashboard Depicting Project Associated Risks And Issues Strategies To Enhance Project Lifecycle Background PDF. Our researchers have carefully researched and created these slides with all aspects taken into consideration. This is a completely customizable Dashboard Depicting Project Associated Risks And Issues Strategies To Enhance Project Lifecycle Background PDF that is available for immediate downloading. Download now and make an impact on your audience. Highlight the attractive features available with our PPTs.
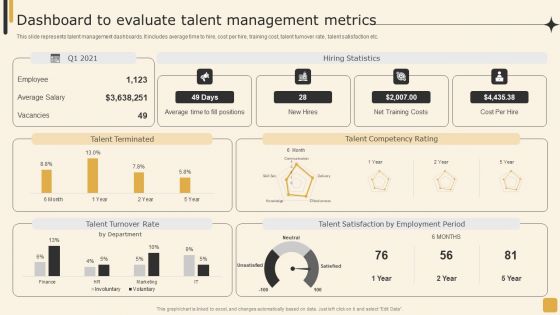
Dashboard To Evaluate Talent Management Metrics Employee Performance Management Tactics Themes PDF
This slide represents talent management dashboards. It includes average time to hire, cost per hire, training cost, talent turnover rate, talent satisfaction etc.Presenting this PowerPoint presentation, titled Dashboard To Evaluate Talent Management Metrics Employee Performance Management Tactics Themes PDF, with topics curated by our researchers after extensive research. This editable presentation is available for immediate download and provides attractive features when used. Download now and captivate your audience. Presenting this Dashboard To Evaluate Talent Management Metrics Employee Performance Management Tactics Themes PDF. Our researchers have carefully researched and created these slides with all aspects taken into consideration. This is a completely customizable Dashboard To Evaluate Talent Management Metrics Employee Performance Management Tactics Themes PDF that is available for immediate downloading. Download now and make an impact on your audience. Highlight the attractive features available with our PPTs.
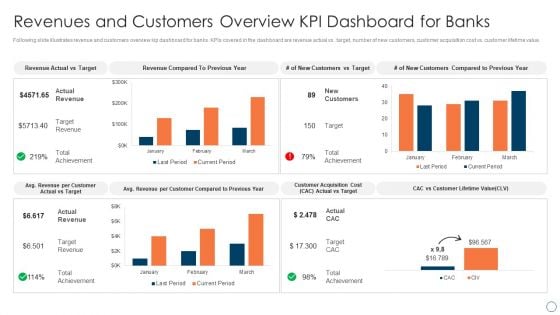
BPM Tools Application To Increase Revenues And Customers Overview KPI Dashboard For Banks Clipart PDF
Following slide illustrates revenue and customers overview kip dashboard for banks. KPIs covered in the dashboard are revenue actual vs. target, number of new customers, customer acquisition cost vs. customer lifetime value. Get a simple yet stunning designed BPM Tools Application To Increase Revenues And Customers Overview KPI Dashboard For Banks Clipart PDF. It is the best one to establish the tone in your meetings. It is an excellent way to make your presentations highly effective. So, download this PPT today from Slidegeeks and see the positive impacts. Our easy-to-edit BPM Tools Application To Increase Revenues And Customers Overview KPI Dashboard For Banks Clipart PDF can be your go-to option for all upcoming conferences and meetings. So, what are you waiting for Grab this template today.
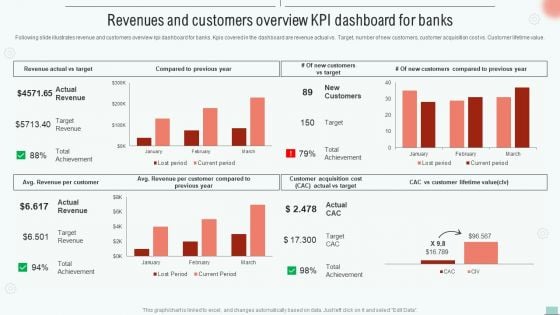
Implementing BPM Tool To Enhance Operational Efficiency Revenues And Customers Overview Kpi Dashboard Rules PDF
Following slide illustrates revenue and customers overview kpi dashboard for banks. Kpis covered in the dashboard are revenue actual vs. Target, number of new customers, customer acquisition cost vs. Customer lifetime value.This Implementing BPM Tool To Enhance Operational Efficiency Revenues And Customers Overview Kpi Dashboard Rules PDF is perfect for any presentation, be it in front of clients or colleagues. It is a versatile and stylish solution for organizing your meetings. The Implementing BPM Tool To Enhance Operational Efficiency Revenues And Customers Overview Kpi Dashboard Rules PDF features a modern design for your presentation meetings. The adjustable and customizable slides provide unlimited possibilities for acing up your presentation. Slidegeeks has done all the homework before launching the product for you. So, do not wait, grab the presentation templates today.
Dashboard For Tracking Downloads In End User Computing Environment Mockup PDF
This slide represents the dashboard for tracking downloads of apps in end user computing environment by covering details of average patch time, quality updates and so on. Presenting this PowerPoint presentation, titled Dashboard For Tracking Downloads In End User Computing Environment Mockup PDF, with topics curated by our researchers after extensive research. This editable presentation is available for immediate download and provides attractive features when used. Download now and captivate your audience. Presenting this Dashboard For Tracking Downloads In End User Computing Environment Mockup PDF. Our researchers have carefully researched and created these slides with all aspects taken into consideration. This is a completely customizable Dashboard For Tracking Downloads In End User Computing Environment Mockup PDF that is available for immediate downloading. Download now and make an impact on your audience. Highlight the attractive features available with our PPTs.

Analyzing And Implementing Effective CMS Customer Acquisition And Conversion Key Metrics Dashboard Professional PDF
This slide represents the dashboard showing the key performance measures to analyze and monitor the customer acquisition and conversion rate. It includes details related to KPIs such as direct traffic, sessions by source, social networks, paid keywords etc. Presenting this PowerPoint presentation, titled Analyzing And Implementing Effective CMS Customer Acquisition And Conversion Key Metrics Dashboard Professional PDF, with topics curated by our researchers after extensive research. This editable presentation is available for immediate download and provides attractive features when used. Download now and captivate your audience. Presenting this Analyzing And Implementing Effective CMS Customer Acquisition And Conversion Key Metrics Dashboard Professional PDF. Our researchers have carefully researched and created these slides with all aspects taken into consideration. This is a completely customizable Analyzing And Implementing Effective CMS Customer Acquisition And Conversion Key Metrics Dashboard Professional PDF that is available for immediate downloading. Download now and make an impact on your audience. Highlight the attractive features available with our PPTs.
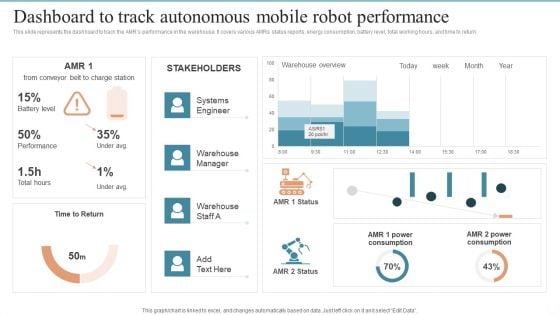
AMR Robot Dashboard To Track Autonomous Mobile Robot Performance Ppt PowerPoint Presentation Diagram Images PDF
This slide represents the dashboard to track the AMRs performance in the warehouse. It covers various AMRs status reports, energy consumption, battery level, total working hours, and time to return. Presenting this PowerPoint presentation, titled AMR Robot Dashboard To Track Autonomous Mobile Robot Performance Ppt PowerPoint Presentation Diagram Images PDF, with topics curated by our researchers after extensive research. This editable presentation is available for immediate download and provides attractive features when used. Download now and captivate your audience. Presenting this AMR Robot Dashboard To Track Autonomous Mobile Robot Performance Ppt PowerPoint Presentation Diagram Images PDF. Our researchers have carefully researched and created these slides with all aspects taken into consideration. This is a completely customizable AMR Robot Dashboard To Track Autonomous Mobile Robot Performance Ppt PowerPoint Presentation Diagram Images PDF that is available for immediate downloading. Download now and make an impact on your audience. Highlight the attractive features available with our PPTs.
Augmented Intelligence Tools And Applications IT Augmented Intelligence Information Tracking Dashboard Introduction PDF
This slide depicts the information tracking dashboard by augmented intelligence model covering the data analysis. Data analysis includes image analysis, storage size, new users on the cloud platform, etc. Presenting this PowerPoint presentation, titled Augmented Intelligence Tools And Applications IT Augmented Intelligence Information Tracking Dashboard Introduction PDF, with topics curated by our researchers after extensive research. This editable presentation is available for immediate download and provides attractive features when used. Download now and captivate your audience. Presenting this Augmented Intelligence Tools And Applications IT Augmented Intelligence Information Tracking Dashboard Introduction PDF. Our researchers have carefully researched and created these slides with all aspects taken into consideration. This is a completely customizable Augmented Intelligence Tools And Applications IT Augmented Intelligence Information Tracking Dashboard Introduction PDF that is available for immediate downloading. Download now and make an impact on your audience. Highlight the attractive features available with our PPTs.
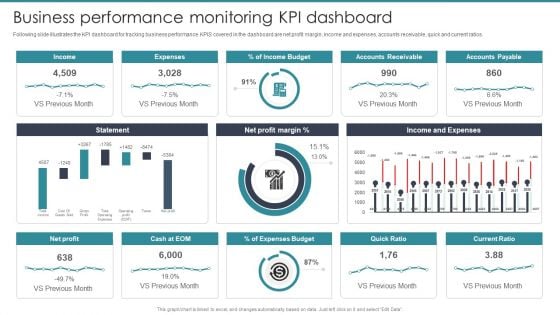
Guide To Mergers And Acquisitions Business Performance Monitoring KPI Dashboard Designs PDF
Following slide illustrates the KPI dashboard for tracking business performance. KPIS covered in the dashboard are net profit margin, income and expenses, accounts receivable, quick and current ratios. Here you can discover an assortment of the finest PowerPoint and Google Slides templates. With these templates, you can create presentations for a variety of purposes while simultaneously providing your audience with an eye catching visual experience. Download Guide To Mergers And Acquisitions Business Performance Monitoring KPI Dashboard Designs PDF to deliver an impeccable presentation. These templates will make your job of preparing presentations much quicker, yet still, maintain a high level of quality. Slidegeeks has experienced researchers who prepare these templates and write high quality content for you. Later on, you can personalize the content by editing the Guide To Mergers And Acquisitions Business Performance Monitoring KPI Dashboard Designs PDF.
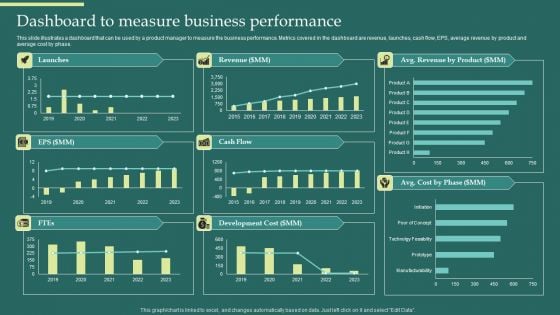
Product Portfolios And Strategic Dashboard To Measure Business Performance Portrait PDF
This slide illustrates a dashboard that can be used by a product manager to measure the business performance. Metrics covered in the dashboard are revenue, launches, cash flow, EPS, average revenue by product and average cost by phase. Do you have an important presentation coming up Are you looking for something that will make your presentation stand out from the rest Look no further than Product Portfolios And Strategic Dashboard To Measure Business Performance Portrait PDF. With our professional designs, you can trust that your presentation will pop and make delivering it a smooth process. And with Slidegeeks, you can trust that your presentation will be unique and memorable. So why wait Grab Product Portfolios And Strategic Dashboard To Measure Business Performance Portrait PDF today and make your presentation stand out from the rest.
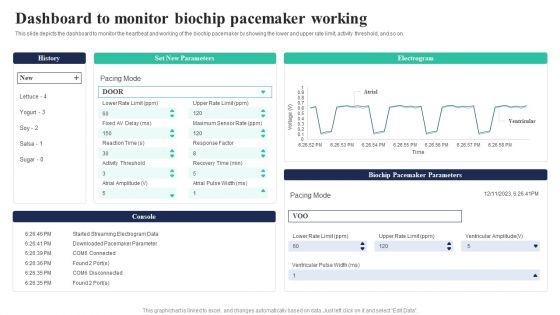
Biochips Use Cases Dashboard To Monitor Biochip Pacemaker Working Mockup PDF
This slide depicts the dashboard to monitor the heartbeat and working of the biochip pacemaker by showing the lower and upper rate limit, activity threshold, and so on. Presenting this PowerPoint presentation, titled Biochips Use Cases Dashboard To Monitor Biochip Pacemaker Working Mockup PDF, with topics curated by our researchers after extensive research. This editable presentation is available for immediate download and provides attractive features when used. Download now and captivate your audience. Presenting this Biochips Use Cases Dashboard To Monitor Biochip Pacemaker Working Mockup PDF. Our researchers have carefully researched and created these slides with all aspects taken into consideration. This is a completely customizable Biochips Use Cases Dashboard To Monitor Biochip Pacemaker Working Mockup PDF that is available for immediate downloading. Download now and make an impact on your audience. Highlight the attractive features available with our PPTs.
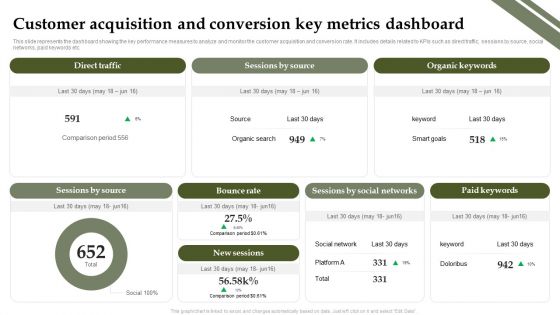
Analyzing And Deploying Effective CMS Customer Acquisition And Conversion Key Metrics Dashboard Infographics PDF
This slide represents the dashboard showing the key performance measures to analyze and monitor the customer acquisition and conversion rate. It includes details related to KPIs such as direct traffic, sessions by source, social networks, paid keywords etc. Presenting this PowerPoint presentation, titled Analyzing And Deploying Effective CMS Customer Acquisition And Conversion Key Metrics Dashboard Infographics PDF, with topics curated by our researchers after extensive research. This editable presentation is available for immediate download and provides attractive features when used. Download now and captivate your audience. Presenting this Analyzing And Deploying Effective CMS Customer Acquisition And Conversion Key Metrics Dashboard Infographics PDF. Our researchers have carefully researched and created these slides with all aspects taken into consideration. This is a completely customizable Analyzing And Deploying Effective CMS Customer Acquisition And Conversion Key Metrics Dashboard Infographics PDF that is available for immediate downloading. Download now and make an impact on your audience. Highlight the attractive features available with our PPTs.
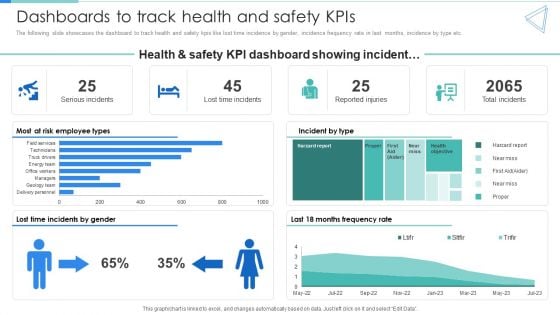
Deployment Of Workplace Safety Management Program Dashboards To Track Health And Safety Kpis Professional PDF
The following slide showcases the dashboard to track health and safety kpis like lost time incidence by gender, incidence frequency rate in last months, incidence by type etc. Presenting this PowerPoint presentation, titled Deployment Of Workplace Safety Management Program Dashboards To Track Health And Safety Kpis Professional PDF, with topics curated by our researchers after extensive research. This editable presentation is available for immediate download and provides attractive features when used. Download now and captivate your audience. Presenting this Deployment Of Workplace Safety Management Program Dashboards To Track Health And Safety Kpis Professional PDF. Our researchers have carefully researched and created these slides with all aspects taken into consideration. This is a completely customizable Deployment Of Workplace Safety Management Program Dashboards To Track Health And Safety Kpis Professional PDF that is available for immediate downloading. Download now and make an impact on your audience. Highlight the attractive features available with our PPTs.
Strategies To Maintain Transportation Shipping And Logistics Tracking Dashboard With Shipments Ppt Infographics Information PDF
This slide covers Key performance indicators to track the automation system of the company. This dashboard includes Logistics Efficiency Status, delivery time accuracy etc. Presenting this PowerPoint presentation, titled Strategies To Maintain Transportation Shipping And Logistics Tracking Dashboard With Shipments Ppt Infographics Information PDF, with topics curated by our researchers after extensive research. This editable presentation is available for immediate download and provides attractive features when used. Download now and captivate your audience. Presenting this Strategies To Maintain Transportation Shipping And Logistics Tracking Dashboard With Shipments Ppt Infographics Information PDF. Our researchers have carefully researched and created these slides with all aspects taken into consideration. This is a completely customizable Strategies To Maintain Transportation Shipping And Logistics Tracking Dashboard With Shipments Ppt Infographics Information PDF that is available for immediate downloading. Download now and make an impact on your audience. Highlight the attractive features available with our PPTs.
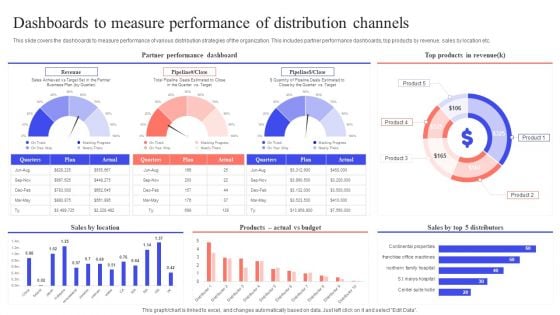
Implementing Effective Distribution Dashboards To Measure Performance Of Distribution Portrait PDF
This slide covers the dashboards to measure performance of various distribution strategies of the organization. This includes partner performance dashboards, top products by revenue, sales by location etc. Crafting an eye-catching presentation has never been more straightforward. Let your presentation shine with this tasteful yet straightforward Implementing Effective Distribution Dashboards To Measure Performance Of Distribution Portrait PDF template. It offers a minimalistic and classy look that is great for making a statement. The colors have been employed intelligently to add a bit of playfulness while still remaining professional. Construct the ideal Implementing Effective Distribution Dashboards To Measure Performance Of Distribution Portrait PDF that effortlessly grabs the attention of your audience Begin now and be certain to wow your customers


 Continue with Email

 Home
Home


