Marketing Dashboard
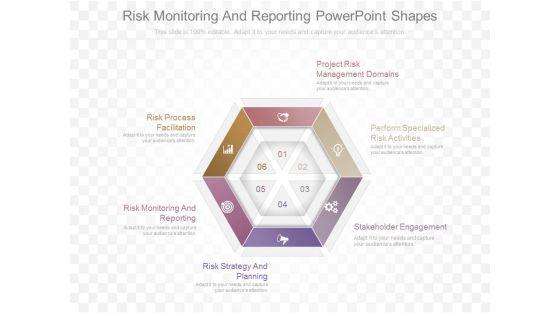
Risk Monitoring And Reporting Powerpoint Shapes
This is a risk monitoring and reporting powerpoint shapes. This is a six stage process. The stages in this process are risk process facilitation, risk monitoring and reporting, risk strategy and planning, project risk management domains, perform specialized risk activities, stakeholder engagement.
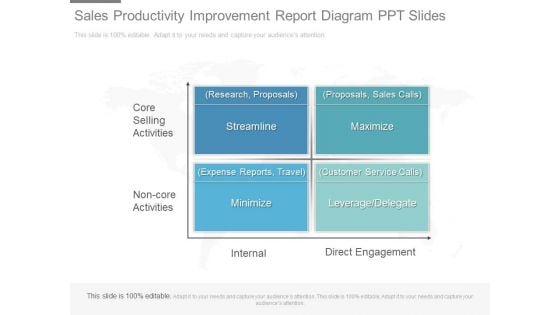
Sales Productivity Improvement Report Diagram Ppt Slides
This is a sales productivity improvement report diagram ppt slides. This is a one stage process. The stages in this process are core selling activities, non core activities, research, proposals, streamline, expense reports, travel, minimize, internal, proposals, sales calls, maximize, customer service calls, leverage delegate, direct engagement.
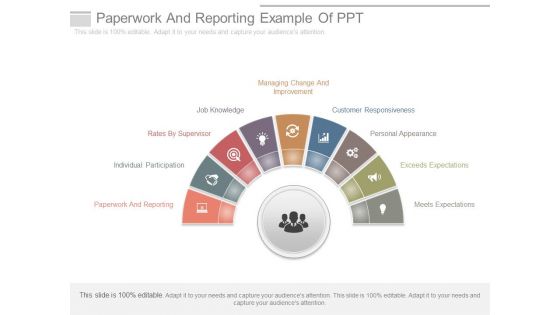
Paperwork And Reporting Example Of Ppt
This is a paperwork and reporting example of ppt. This is a nine stage process. The stages in this process are paperwork and reporting, individual participation, rates by supervisor, job knowledge, managing change and improvement, customer responsiveness, personal appearance, exceeds expectations, meets expectations.
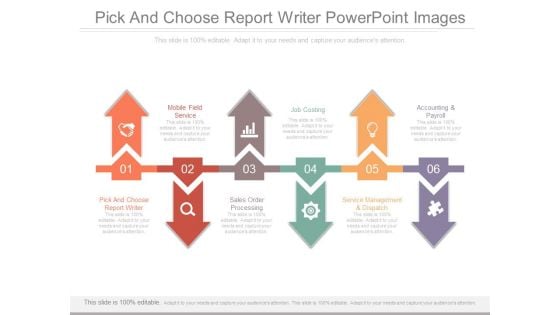
Pick And Choose Report Writer Powerpoint Images
This is a pick and choose report writer powerpoint images. This is a six stage process. The stages in this process are pick and choose report writer, mobile field service, sales order processing, job costing, service management and dispatch, accounting and payroll.
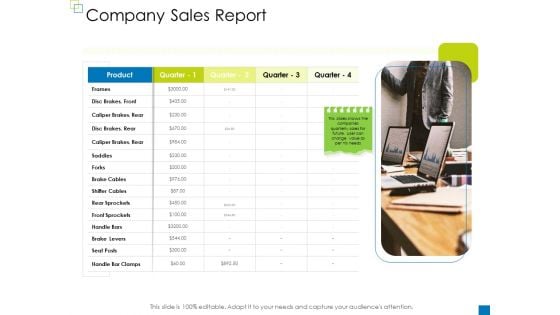
Enterprise Management Company Sales Report Inspiration PDF
Presenting enterprise management company sales report inspiration pdf to provide visual cues and insights. Share and navigate important information on one stage that need your due attention. This template can be used to pitch topics like company sales report. In addition, this PPT design contains high-resolution images, graphics, etc, that are easily editable and available for immediate download.
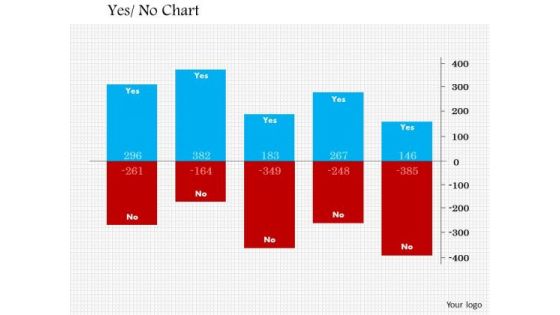
Business Diagram Survey Report PowerPoint Ppt Presentation
Get The Doers Into Action. Activate Them With Our Business Diagram survey report PowerPoint PPT Presentation Powerpoint Templates. Put Your Money On Our Business Powerpoint Templates. Your Ideas Will Rake In The Dollars.

Hexagons For Finance Annual Report Powerpoint Slides
This PowerPoint template has been designed with five hexagons and icons. This PPT slide can be used to display finance annual report. You can download finance PowerPoint template to prepare awesome presentations.
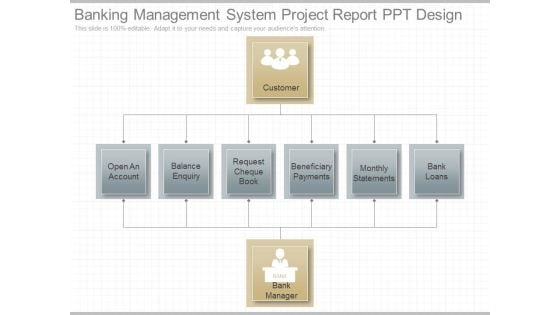
Banking Management System Project Report Ppt Design
This is a banking management system project report ppt design. This is a eight stage process. The stages in this process are customer, open an account, balance enquiry, request cheque book, beneficiary payments, monthly statements, bank loans, bank manager.
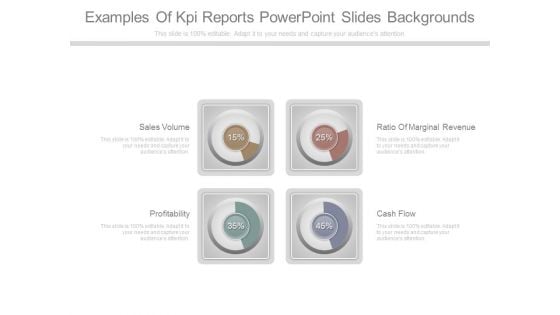
Examples Of Kpi Reports Powerpoint Slides Backgrounds
This is a examples of kpi reports powerpoint slides backgrounds. This is a four stage process. The stages in this process are sales volume, profitability, ratio of marginal revenue, cash flow.
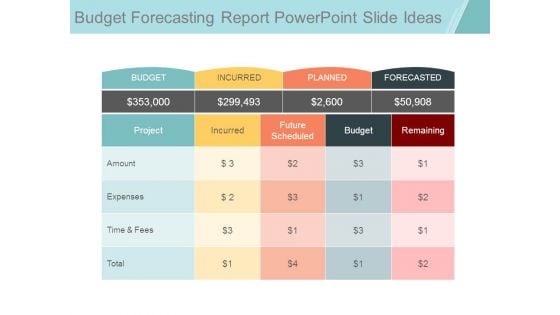
Budget Forecasting Report Powerpoint Slide Ideas
This is a budget forecasting report powerpoint slide ideas. This is a four stage process. The stages in this process are budget, incurred, planned, forecasted, project, future scheduled, remaining, amount, expenses, time and fees, total.
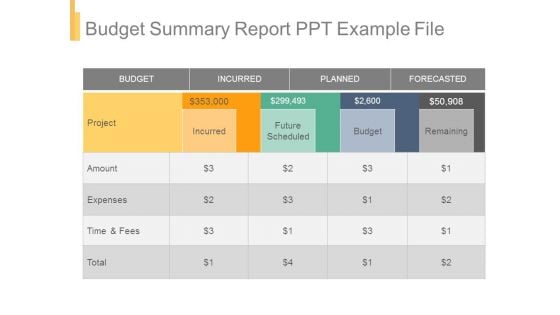
Budget Summary Report Ppt Example File
This is a budget summary report ppt example file. This is a four stage process. The stages in this process are budget, incurred, planned, forecasted, future scheduled, remaining, project, amount, expenses, time and fees, total.
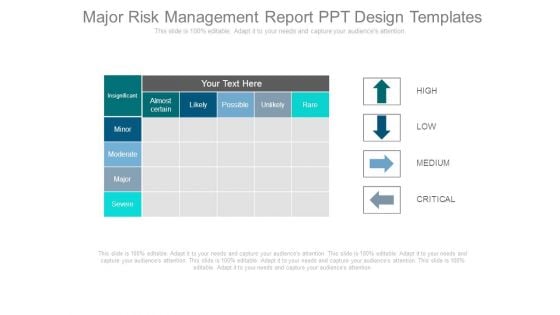
Major Risk Management Report Ppt Design Templates
This is a major risk management report ppt design templates. This is a six stage process. The stages in this process are insignificant, minor, moderate, major, severe, almost certain, likely, possible, unlikely, rare, high, low, medium, critical.
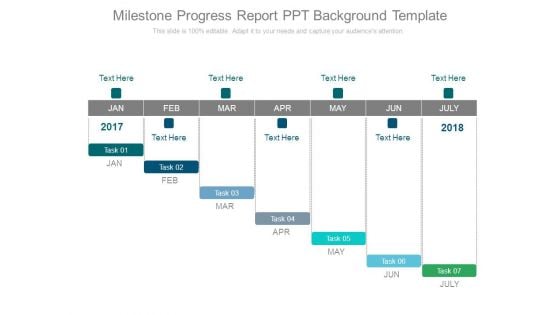
Milestone Progress Report Ppt Background Template
This is a milestone progress report ppt background template. This is a seven stage process. The stages in this process are jan, feb, mar, apr, may, jun, july, task.
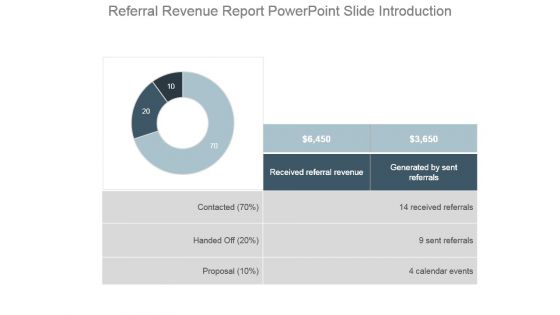
Referral Revenue Report Powerpoint Slide Introduction
This is a referral revenue report powerpoint slide introduction. This is a three stage process. The stages in this process are contacted, handed off, proposal, received referral revenue, generated by sent referrals, received referrals, sent referrals, calendar events.
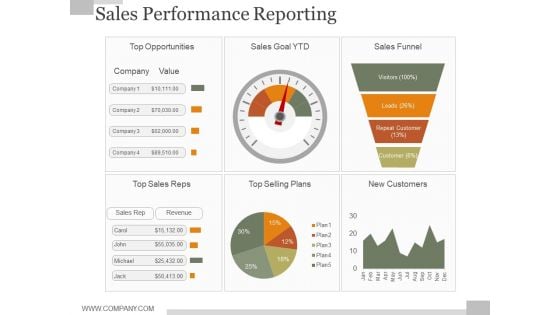
Sales Performance Reporting Ppt PowerPoint Presentation Styles
This is a sales performance reporting ppt powerpoint presentation styles. This is a four stage process. The stages in this process are top opportunities, sales goal ytd, sales funnel, top sales reps, top selling plans, new customers.
Campaign Report Ppt PowerPoint Presentation Icon Visuals
This is a campaign report ppt powerpoint presentation icon visuals. This is a ten stage process. The stages in this process are email name, send date time, recipients, delivered, spam, opt out, revenue.
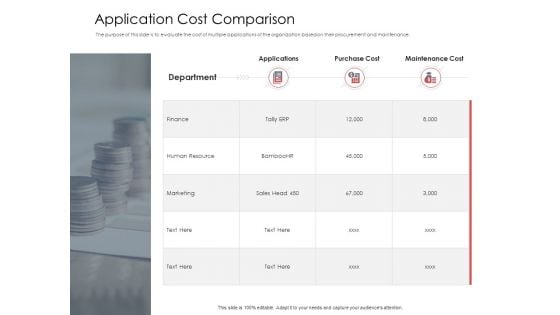
AIM Principles For Data Storage Application Cost Comparison Ppt Gallery Images PDF
This is a aim principles for data storage application cost comparison ppt gallery images pdf template with various stages. Focus and dispense information on three stages using this creative set, that comes with editable features. It contains large content boxes to add your information on topics like finance, human resource, marketing, maintenance, cost. You can also showcase facts, figures, and other relevant content using this PPT layout. Grab it now.
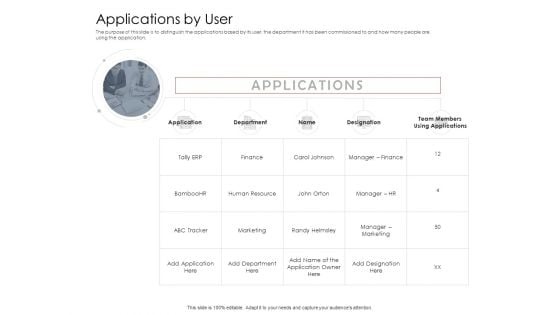
AIM Principles For Data Storage Applications By User Ppt Styles Guidelines PDF
Presenting aim principles for data storage applications by user ppt styles guidelines pdf to provide visual cues and insights. Share and navigate important information on five stages that need your due attention. This template can be used to pitch topics like application, team members, marketing, human resource. In addtion, this PPT design contains high resolution images, graphics, etc, that are easily editable and available for immediate download.
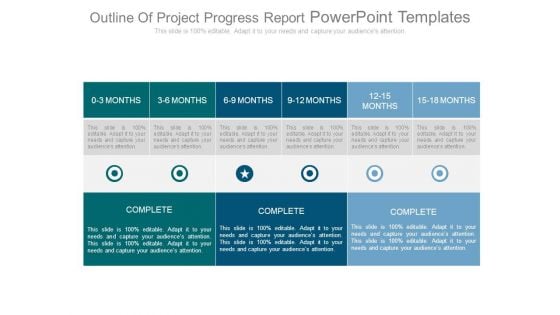
Outline Of Project Progress Report Powerpoint Templates
This is a outline of project progress report powerpoint templates. This is a three stage process. The stages in this process are 0 3 months, 3 6 months, 6 9 months, 9 12 months, 12 15 months, 15 18 months, complete.
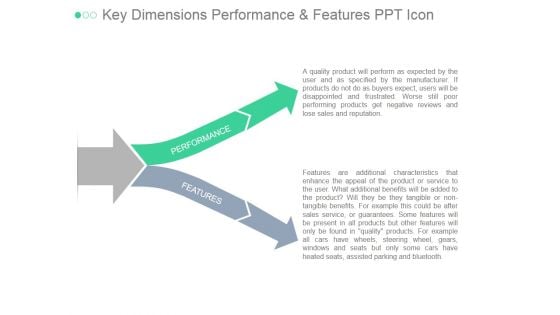
Key Dimensions Performance And Features Ppt PowerPoint Presentation Infographic Template
This is a key dimensions performance and features ppt powerpoint presentation infographic template. This is a two stage process. The stages in this process are performance, features.
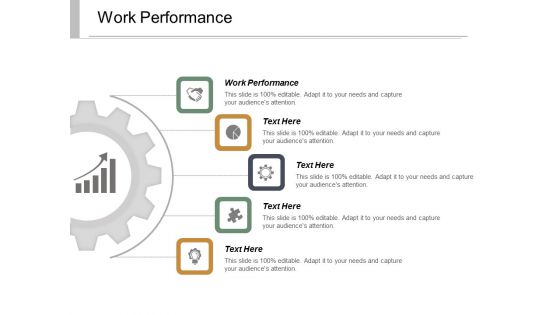
Work Performance Ppt Powerpoint Presentation Pictures Infographic Template Cpb
This is a work performance ppt powerpoint presentation pictures infographic template cpb. This is a five stage process. The stages in this process are work performance.

Technology Performance Management Ppt PowerPoint Presentation Infographic Template Aids Cpb
This is a technology performance management ppt powerpoint presentation infographic template aids cpb. This is a five stage process. The stages in this process are technology performance management.
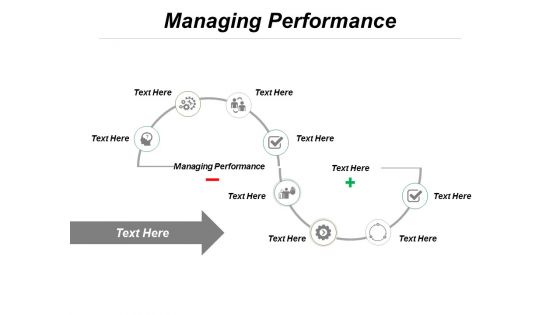
Managing Performance Ppt PowerPoint Presentation Infographics Visuals Cpb
This is a managing performance ppt powerpoint presentation infographics visuals cpb. This is a eight stage process. The stages in this process are managing performance.

Performance Management Ppt PowerPoint Presentation Infographics Master Slide Cpb
This is a performance management ppt powerpoint presentation infographics master slide cpb. This is a four stage process. The stages in this process are performance management.
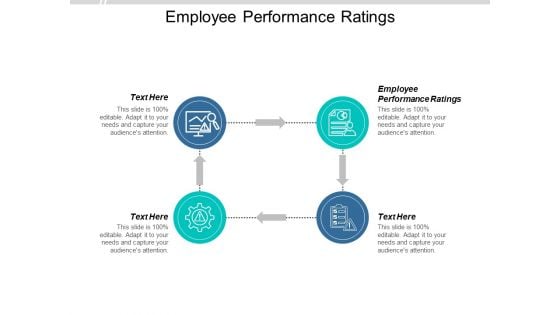
Employee Performance Ratings Ppt PowerPoint Presentation Infographics Brochure Cpb
This is a employee performance ratings ppt powerpoint presentation infographics brochure cpb. This is a four stage process. The stages in this process are employee performance ratings.
Managing Employee Performance Ppt Powerpoint Presentation Infographic Template Brochure Cpb
This is a managing employee performance ppt powerpoint presentation infographic template brochure cpb. This is a four stage process. The stages in this process are managing employee performance.
Insurance Performance Bond Ppt Powerpoint Presentation Infographic Template Graphics Cpb
This is a insurance performance bond ppt powerpoint presentation infographic template graphics cpb. This is a six stage process. The stages in this process are insurance performance bond.
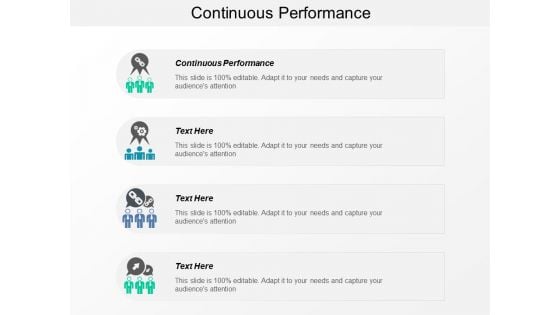
Continuous Performance Ppt PowerPoint Presentation Infographic Template Inspiration
This is a continuous performance ppt powerpoint presentation infographic template inspiration. This is a four stage process. The stages in this process are continuous performance.
High Performance Networking Ppt PowerPoint Presentation Infographic Template Layout Cpb
This is a high performance networking ppt powerpoint presentation infographic template layout cpb. This is a four stage process. The stages in this process are high performance networking.

Financial Performance Metrics Ppt PowerPoint Presentation Infographic Template Influencers Cpb
This is a financial performance metrics ppt powerpoint presentation infographic template influencers cpb. This is a three stage process. The stages in this process are financial performance metrics.

Investment Performance Ppt PowerPoint Presentation Infographics Graphic Images Cpb
This is a investment performance ppt powerpoint presentation infographics graphic images cpb. This is a six stage process. The stages in this process are investment performance.
Project Progress Report Format Ppt Icon
This is a project progress report format ppt icon. This is a five stage process. The stages in this process are deployment 24 feb 2017, we are here, midterm presentation 28 feb 2017, uat 1 28 jan 2017, uat 2 18 feb 2017, uat 3 07 mar 2017, deployment 01 apr 2017, final presentation 14 apr 2017, dec, jan, feb, mar, apr, iteration, vacation, scheduling absences profile management programme management, advanced scheduling enrolment, advanced scheduling enrolment, notification business analytics.
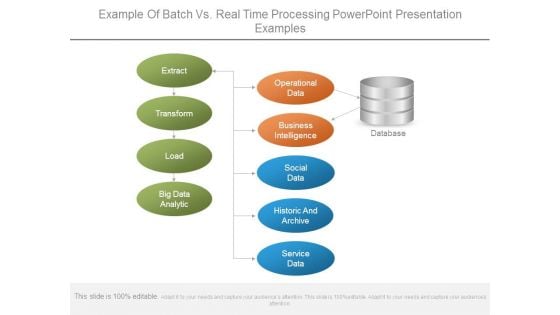
Example Of Batch Vs Real Time Processing Powerpoint Presentation Examples
This is a example of batch vs real time processing powerpoint presentation examples. This is a nine stage process. The stages in this process are extract, transform, load, big data analytic, operational data, business intelligence, social data, historic and archive, service data, database.
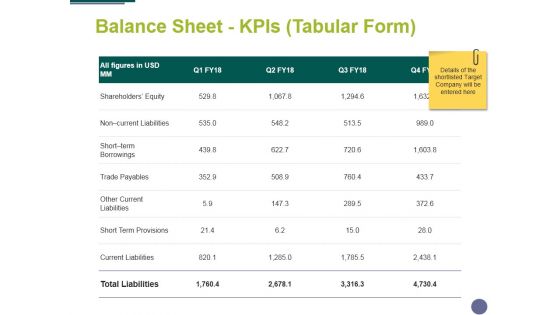
Balance Sheet Kpis Tabular Form Template 1 Ppt PowerPoint Presentation File Visual Aids
This is a balance sheet kpis tabular form template 1 ppt powerpoint presentation file visual aids. This is a four stage process balance sheet kpis tabular form template 1 ppt powerpoint presentation file visual aids. The stages in this process are business, management, compere, strategy, table.
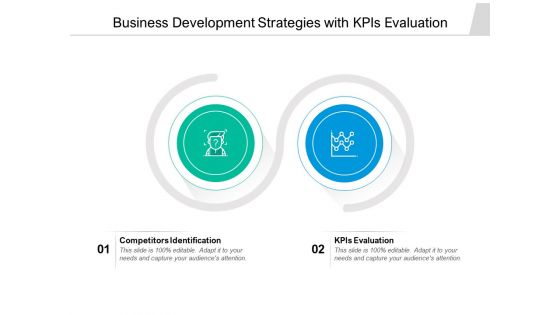
Business Development Strategies With Kpis Evaluation Ppt PowerPoint Presentation Layouts Example PDF
Presenting this set of slides with name business development strategies with kpis evaluation ppt powerpoint presentation layouts example pdf. This is a two stage process. The stages in this process are competitors identification, kpis evaluation. This is a completely editable PowerPoint presentation and is available for immediate download. Download now and impress your audience.
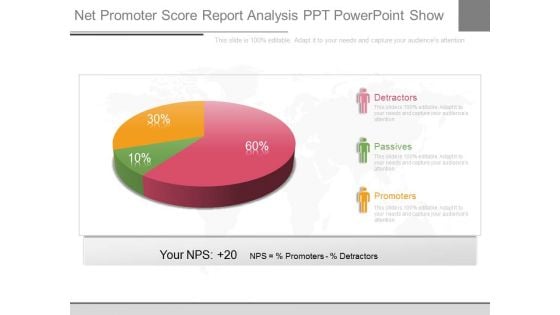
Net Promoter Score Report Analysis Ppt Powerpoint Show
This is a net promoter score report analysis ppt powerpoint show. This is a three stage process. The stages in this process are detractors, passives, promoters, your nps, nps, percentage promoters, percentage detractors.
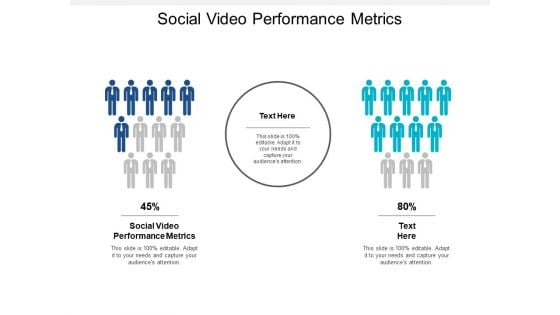
Social Video Performance Metrics Ppt PowerPoint Presentation Infographics Brochure Cpb
This is a social video performance metrics ppt powerpoint presentation infographics brochure cpb. This is a two stage process. The stages in this process are social video performance metrics.
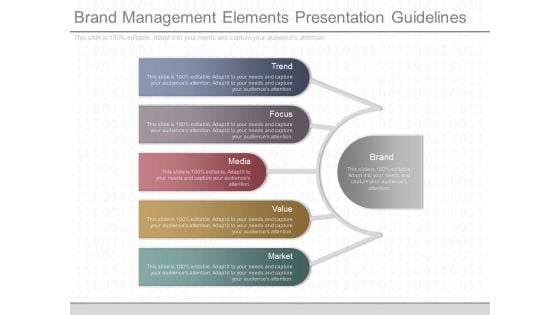
Brand Management Elements Presentation Guidelines
This is a brand management elements presentation guidelines. This is a five stage process. The stages in this process are trend, focus, media, value, market, brand.
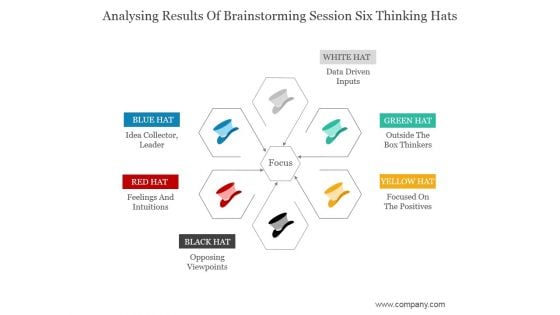
Analysing Results Of Brainstorming Session Six Thinking Hats Ppt PowerPoint Presentation Show
This is a analysing results of brainstorming session six thinking hats ppt powerpoint presentation show. This is a six stage process. The stages in this process are data driven inputs, outside the box thinkers, focused on the positives, opposing viewpoints, feelings and intuitions.
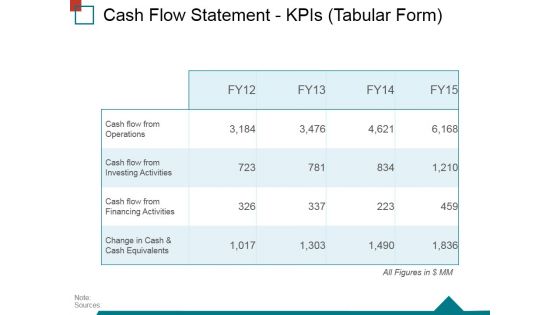
Cash Flow Statement Kpis Tabular Form Ppt PowerPoint Presentation Gallery Good
This is a cash flow statement kpis tabular form ppt powerpoint presentation gallery good. This is a four stage process. The stages in this process are operations, financing activities, investing activities, net increase in cash.
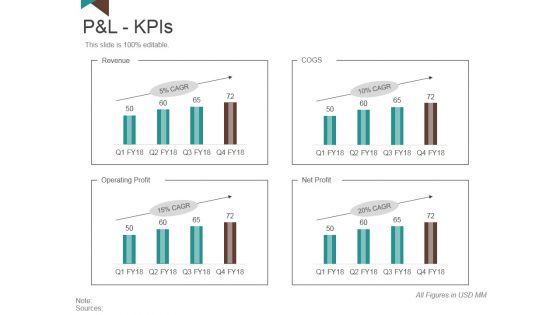
P And L Kpis Template 1 Ppt PowerPoint Presentation Slides Model
This is a p and l kpis template 1 ppt powerpoint presentation slides model. This is a four stage process. The stages in this process are revenue, operating profit, net profit, cogs.
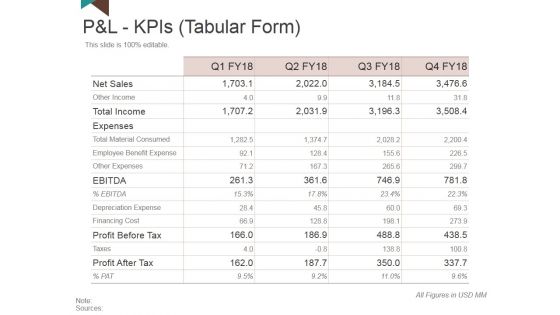
P And L Kpis Template 2 Ppt PowerPoint Presentation Outline Clipart
This is a p and l kpis template 2 ppt powerpoint presentation outline clipart. This is a four stage process. The stages in this process are net sales, total income, expenses, profit before tax, profit after tax.

Cash Flow Statement Kpis Tabular Form Ppt PowerPoint Presentation Infographics File Formats
This is a cash flow statement kpis tabular form ppt powerpoint presentation infographics file formats. This is a four stage process. The stages in this process are operations, investing activities, financing activities, net increase in cash.
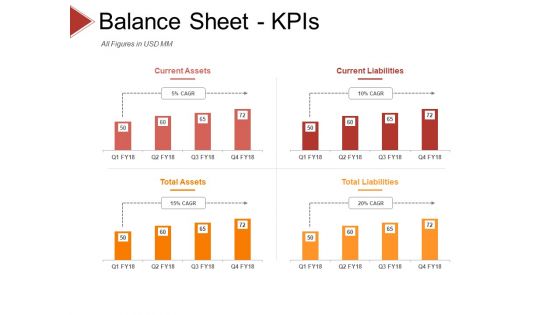
Balance Sheet Kpis Template 3 Ppt PowerPoint Presentation Professional Graphics Design
This is a balance sheet kpis template 3 ppt powerpoint presentation professional graphics design. This is a four stage process. The stages in this process are current assets, current liabilities, total assets, total liabilities.
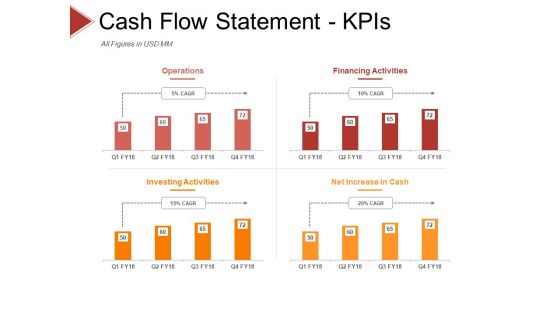
Cash Flow Statement Kpis Template 1 Ppt PowerPoint Presentation Pictures Microsoft
This is a cash flow statement kpis template 1 ppt powerpoint presentation pictures microsoft. This is a four stage process. The stages in this process are operations, financing activities, investing activities, net increase in cash.
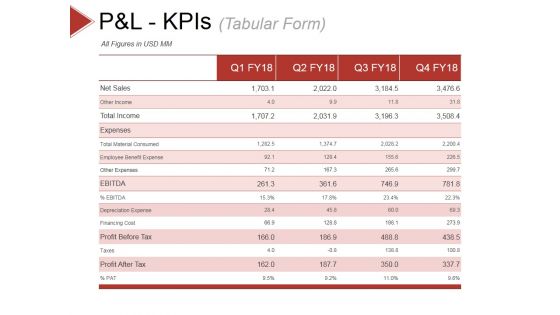
P And L Kpis Template 1 Ppt PowerPoint Presentation Slides Show
This is a p and l kpis template 1 ppt powerpoint presentation slides show. This is a four stage process. The stages in this process are other income, total income, expenses, other expenses, depreciation expense.
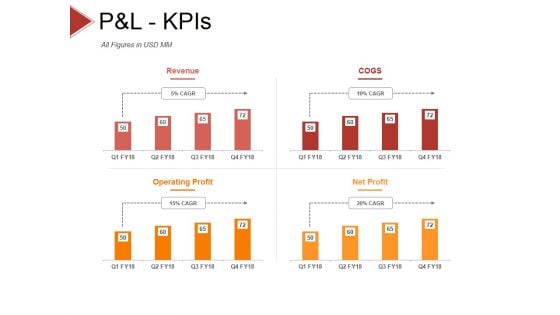
P And L Kpis Template 2 Ppt PowerPoint Presentation Styles Objects
This is a p and l kpis template 2 ppt powerpoint presentation styles objects. This is a four stage process. The stages in this process are revenue, cogs, operating profit, net profit.
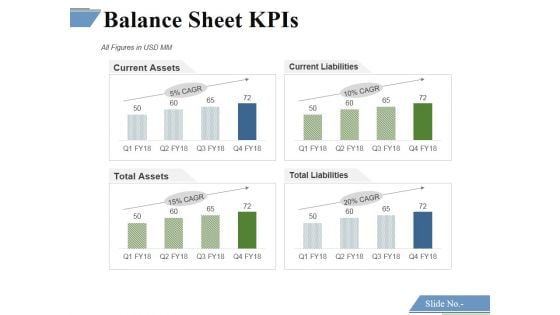
Balance Sheet Kpis Template 1 Ppt PowerPoint Presentation Styles Layout Ideas
This is a balance sheet kpis template 1 ppt powerpoint presentation styles layout ideas. This is a four stage process. The stages in this process are current assets, current liabilities, total assets, total liabilities.
Cash Flow Statement Kpis Template 1 Ppt PowerPoint Presentation Icon Elements
This is a cash flow statement kpis template 1 ppt powerpoint presentation icon elements. This is a four stage process. The stages in this process are operations, financing activities, investing activities, net increase in cash.

P And L Kpis Template 1 Ppt PowerPoint Presentation Model Inspiration
This is a p and l kpis template 1 ppt powerpoint presentation model inspiration. This is a four stage process. The stages in this process are revenue, cogs, operating profit, net profit.
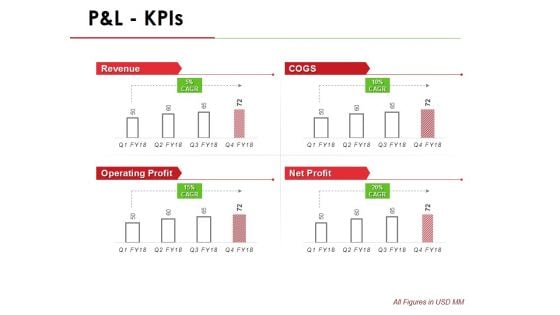
P And L Kpis Template 1 Ppt PowerPoint Presentation Infographic Template Outline
This is a p and l kpis template 1 ppt powerpoint presentation infographic template outline. This is a four stage process. The stages in this process are revenue, operating profit, cogs, net profit.
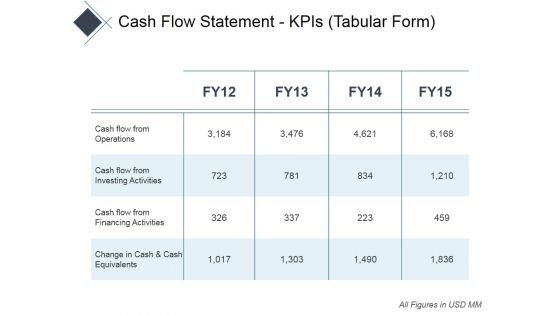
Cash Flow Statement Kpis Tabular Form Ppt PowerPoint Presentation Infographics Professional
This is a cash flow statement kpis tabular form ppt powerpoint presentation infographics professional. This is a four stage process. The stages in this process are operations, financing activities, investing activities, net increase in cash.
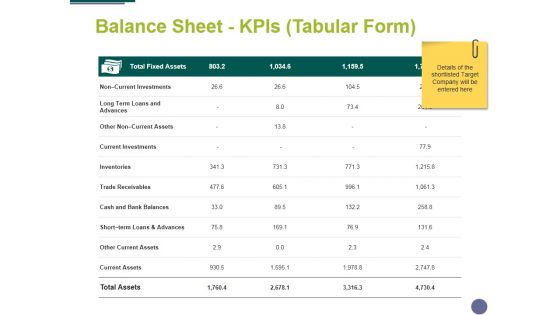
Balance Sheet Kpis Tabular Form Template 2 Ppt PowerPoint Presentation Inspiration Portfolio
This is a balance sheet kpis tabular form template 2 ppt powerpoint presentation inspiration portfolio. This is a four stage process. The stages in this process are business, management, compere, strategy, table.
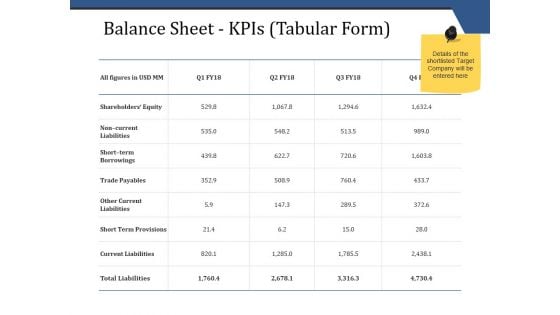
Balance Sheet Kpis Tabular Form Template 1 Ppt PowerPoint Presentation Infographics Picture
This is a balance sheet kpis tabular form template 1 ppt powerpoint presentation infographics picture. This is a four stage process. The stages in this process are business, finance, analysis, investment, strategy.
Balance Sheet Kpis Tabular Form Template 2 Ppt PowerPoint Presentation Icon Clipart
This is a balance sheet kpis tabular form template 2 ppt powerpoint presentation icon clipart. This is a four stage process. The stages in this process are business, finance, analysis, investment, strategy.
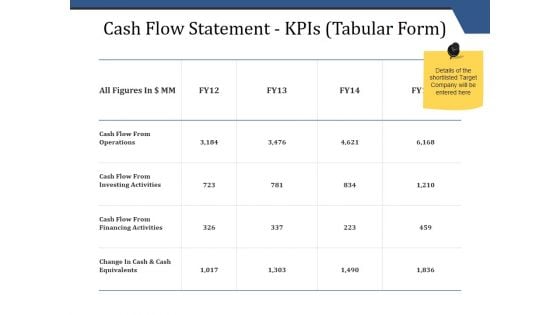
Cash Flow Statement Kpis Tabular Form Ppt PowerPoint Presentation Inspiration Master Slide
This is a cash flow statement kpis tabular form ppt powerpoint presentation inspiration master slide. This is a four stage process. The stages in this process are operations, financing activities, investing activities, net increase in cash.
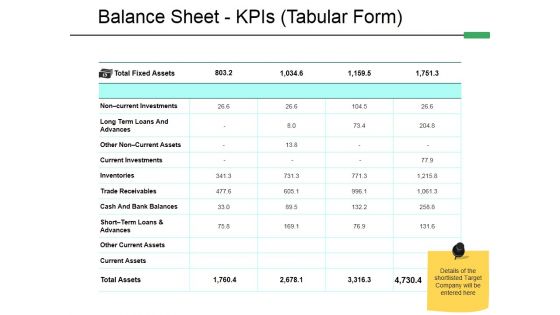
Balance Sheet Kpis Tabular Form Template 2 Ppt PowerPoint Presentation Styles Model
This is a balance sheet kpis tabular form template 2 ppt powerpoint presentation styles model. This is a four stage process. The stages in this process are advances, inventories, trade receivables, current investments, current assets, other current assets.

P And L Kpis Tabular Form Ppt PowerPoint Presentation Ideas Infographics
This is a p and l kpis tabular form ppt powerpoint presentation ideas infographics. This is a four stage process. The stages in this process are other income, expenses, other expenses, depreciation expense, financing cost.
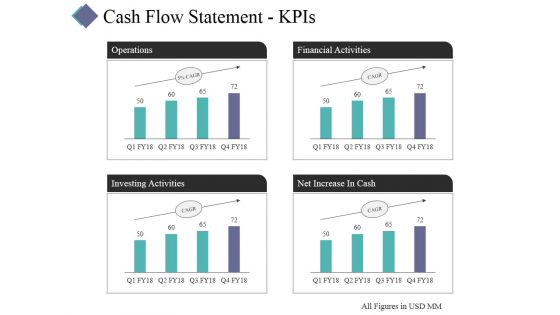
Cash Flow Statement Kpis Template 2 Ppt PowerPoint Presentation Layouts Visuals
This is a cash flow statement kpis template 2 ppt powerpoint presentation layouts visuals. This is a four stage process. The stages in this process are operations, financial activities, investing activities, net increase in cash.
P And L Kpis Template 2 Ppt PowerPoint Presentation Summary Icon
This is a p and l kpis template 2 ppt powerpoint presentation summary icon. This is a four stage process. The stages in this process are revenue, cogs, operating profit, net profit.


 Continue with Email

 Home
Home


