Marketing Dashboard
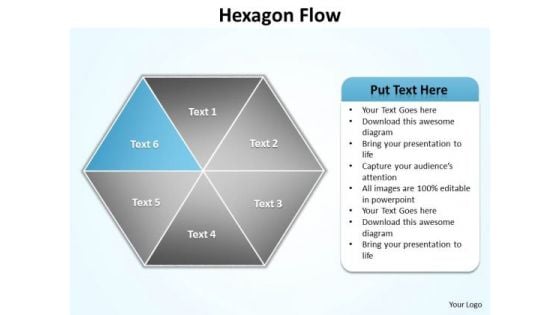
Ppt Blue Factor Hexagon Angles Spider Diagram PowerPoint Template Editable Templates
PPT blue factor hexagon angles spider diagram PowerPoint template editable Templates-You can easily collaborate this PowerPoint diagram with colleagues to create detailed process diagrams and use them as a key element in streamlining your processes. Use this graphical approach to represent global business issues such as financial data, stock market Exchange, increase in sales, corporate presentations and more. -PPT blue factor hexagon angles spider diagram PowerPoint template editable Templates-attached, backgrounds, blue, cell, color, component, connect, connection, diagram, elements, geometric, graphic, group, hexagon, honeycomb, icon, illustration, intricacy, lines, link, map, mesh, model, network, science, shape, shiny, strategy, structure, symbol, teamwork, technology Out Ppt Blue Factor Hexagon Angles Spider Diagram PowerPoint Template Editable Templates embody the contemporary. They are always at the forefront of fashion.
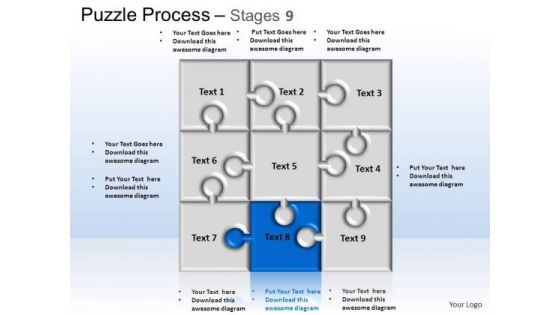
PowerPoint Themes Business Puzzle Process Ppt Layouts
PowerPoint Themes Business Puzzle Process PPT Layouts-Puzzles PowerPoint templates being the perennial educational tool. Emphasize the process of your business/corporate growth. Highlight your ideas broad- based on strong fundamentals and illustrate how they step by step achieve the set growth factor.-These amazing PowerPoint pre-designed slides and PowerPoint templates have been carefully created by our team of experts to help you impress your audience. Our stunning collection of Powerpoint slides are 100% editable and can easily fit in any PowerPoint presentations. By using these animations and graphics in PowerPoint and you can easily make professional presentations. Any text can be entered at any point in the PowerPoint template or slide. Just DOWNLOAD our awesome PowerPoint templates and you are ready to go. Figure out the market with our PowerPoint Themes Business Puzzle Process Ppt Layouts. Analyse the data accurately for the audience.
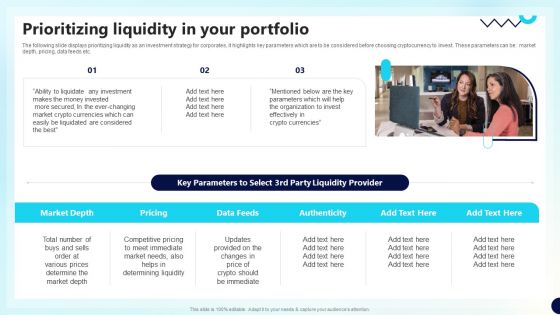
Prioritizing Liquidity In Your Portfolio Decentralized Fund Investment Playbook Brochure PDF
The following slide displays prioritizing liquidity as an investment strategy for corporates, it highlights key parameters which are to be considered before choosing cryptocurrency to invest. These parameters can be market depth, pricing, data feeds etc. Do you have an important presentation coming up Are you looking for something that will make your presentation stand out from the rest Look no further than Prioritizing Liquidity In Your Portfolio Decentralized Fund Investment Playbook Brochure PDF. With our professional designs, you can trust that your presentation will pop and make delivering it a smooth process. And with Slidegeeks, you can trust that your presentation will be unique and memorable. So why wait Grab Prioritizing Liquidity In Your Portfolio Decentralized Fund Investment Playbook Brochure PDF today and make your presentation stand out from the rest.
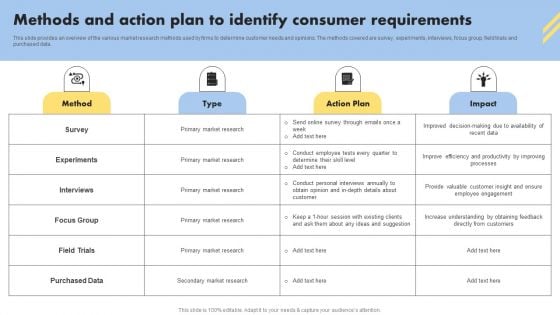
Consumer Buying Behavior Methods And Action Plan To Identify Consumer Requirements Clipart PDF
This slide provides an overview of the various market research methods used by firms to determine customer needs and opinions. The methods covered are survey, experiments, interviews, focus group, field trials and purchased data. Explore a selection of the finest Consumer Buying Behavior Methods And Action Plan To Identify Consumer Requirements Clipart PDF here. With a plethora of professionally designed and pre made slide templates, you can quickly and easily find the right one for your upcoming presentation. You can use our Consumer Buying Behavior Methods And Action Plan To Identify Consumer Requirements Clipart PDF to effectively convey your message to a wider audience. Slidegeeks has done a lot of research before preparing these presentation templates. The content can be personalized and the slides are highly editable. Grab templates today from Slidegeeks.
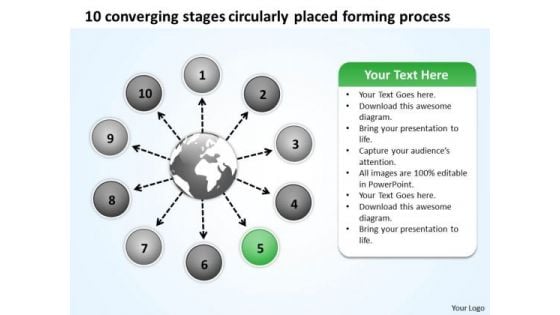
10 Converging Stages Circularly Placed Forming Process Cycle PowerPoint Templates
We present our 10 converging stages circularly placed forming process Cycle PowerPoint templates.Use our Flow charts PowerPoint Templates because with the help of our Slides you can Illustrate your plans to your listeners with the same accuracy. Use our Arrows PowerPoint Templates because spreading the light of knowledge around you will clear the doubts and enlighten the questioning minds with your brilliance and ability. Download and present our Ring charts PowerPoint Templates because there are different paths to gain the necessary knowledge to acheive it. Download our Circle charts PowerPoint Templates because there are so many different pieces to the puzzle. Download and present our Business PowerPoint Templates because you can see clearly through to the bigger bowl ahead. Time your jump to perfection and hit the nail on the head.Use these PowerPoint slides for presentations relating to Arrow, blank, business, chart, circle, concept, connection, cycle, development, diagram, direction, element, environment, exchange, finance, financial, flow, graph, graphic, graphic presentation, group, icon, illustration, investment, isolated, isometric, market, motion, movement, organization, passive income, perspective, process, process chart, recycle, report, ring, sign, step, stock, success, symbol. The prominent colors used in the PowerPoint template are Blue , Black, White. You can be sure our 10 converging stages circularly placed forming process Cycle PowerPoint templates are Luxurious. Presenters tell us our circle PowerPoint templates and PPT Slides are Zippy. We assure you our 10 converging stages circularly placed forming process Cycle PowerPoint templates are Flirty. Customers tell us our circle PowerPoint templates and PPT Slides are Awesome. Presenters tell us our 10 converging stages circularly placed forming process Cycle PowerPoint templates are Striking. You can be sure our development PowerPoint templates and PPT Slides effectively help you save your valuable time. Do competitive market positioning with our 10 Converging Stages Circularly Placed Forming Process Cycle PowerPoint Templates. They will make you look good.
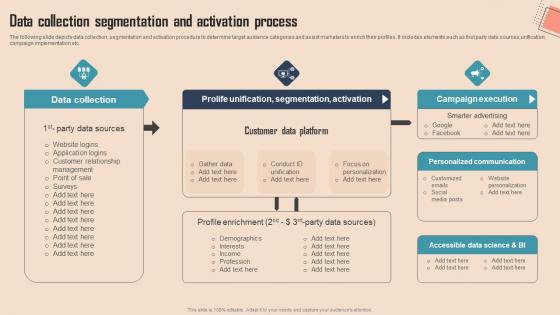
Data Collection Segmentation And Comprehensive CDP Guide For Promoters Structure Pdf
The following slide depicts data collection, segmentation and activation procedure to determine target audience categories and assist marketers to enrich their profiles. It includes elements such as first party data sources,unification, campaign implementation etc.Do you have an important presentation coming up Are you looking for something that will make your presentation stand out from the rest Look no further than Data Collection Segmentation And Comprehensive CDP Guide For Promoters Structure Pdf. With our professional designs, you can trust that your presentation will pop and make delivering it a smooth process. And with Slidegeeks, you can trust that your presentation will be unique and memorable. So why wait Grab XXXXXXXXXXXXXX today and make your presentation stand out from the rest. The following slide depicts data collection, segmentation and activation procedure to determine target audience categories and assist marketers to enrich their profiles. It includes elements such as first party data sources,unification, campaign implementation etc.

Post It Ppt PowerPoint Presentation Portfolio Shapes
This is a post it ppt powerpoint presentation portfolio shapes. This is a four stage process. The stages in this process are business, strategy, analysis, marketing, post it.

Global Data Security Industry Report Strategies And Recommendations For Cybersecurity Industry IR SS V
The purpose of the slide is to provide valuable recommendations and effective strategies for cybersecurity industry players to succeed in a dynamic and competitive market. It covers strategies such as. The Global Data Security Industry Report Strategies And Recommendations For Cybersecurity Industry IR SS V is a compilation of the most recent design trends as a series of slides. It is suitable for any subject or industry presentation, containing attractive visuals and photo spots for businesses to clearly express their messages. This template contains a variety of slides for the user to input data, such as structures to contrast two elements, bullet points, and slides for written information. Slidegeeks is prepared to create an impression. The purpose of the slide is to provide valuable recommendations and effective strategies for cybersecurity industry players to succeed in a dynamic and competitive market. It covers strategies such as.
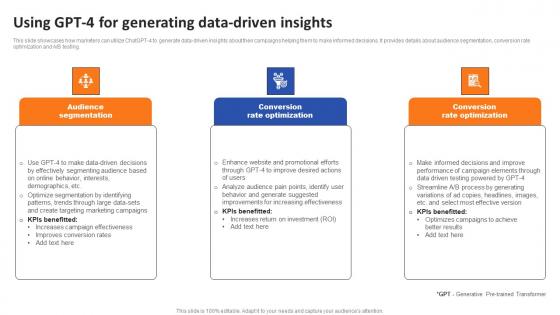
Using GPT 4 For Generating Data Driven Insights Ppt Infographic Template Slide Portrait Pdf
This slide showcases how marketers can utilize ChatGPT-4 to generate data-driven insights about their campaigns helping them to make informed decisions. It provides details about audience segmentation, conversion rate optimization and A OR B testing. Boost your pitch with our creative Using GPT 4 For Generating Data Driven Insights Ppt Infographic Template Slide Portrait Pdf. Deliver an awe-inspiring pitch that will mesmerize everyone. Using these presentation templates you will surely catch everyones attention. You can browse the ppts collection on our website. We have researchers who are experts at creating the right content for the templates. So you do not have to invest time in any additional work. Just grab the template now and use them. This slide showcases how marketers can utilize ChatGPT-4 to generate data-driven insights about their campaigns helping them to make informed decisions. It provides details about audience segmentation, conversion rate optimization and A OR B testing.
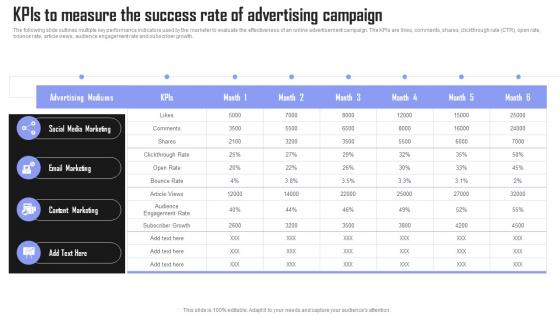
KPIs To Measure Success Rate Brand Building Techniques To Gain Competitive Edge Background Pdf
The following slide outlines multiple key performance indicators used by the marketer to evaluate the effectiveness of an online advertisement campaign. The KPIs are likes, comments, shares, clickthrough rate CTR, open rate, bounce rate, article views, audience engagement rate and subscriber growth. The best PPT templates are a great way to save time, energy, and resources. Slidegeeks have 100 percent editable powerpoint slides making them incredibly versatile. With these quality presentation templates, you can create a captivating and memorable presentation by combining visually appealing slides and effectively communicating your message. Download KPIs To Measure Success Rate Brand Building Techniques To Gain Competitive Edge Background Pdf from Slidegeeks and deliver a wonderful presentation. The following slide outlines multiple key performance indicators used by the marketer to evaluate the effectiveness of an online advertisement campaign. The KPIs are likes, comments, shares, clickthrough rate CTR, open rate, bounce rate, article views, audience engagement rate and subscriber growth.

How To Create Cost Effective Kpis To Measure Effectiveness Of Facebook Strategy SS V
The following slide outlines key performance indicators KPI through which marketers can analyze impact of Facebook ads. The key metrics mentioned in slide are likes, shares, comments, click-through rate CTR, cost per conversion CPV, conversion rate, new followers, reach, and brand impressions. Find a pre-designed and impeccable How To Create Cost Effective Kpis To Measure Effectiveness Of Facebook Strategy SS V. The templates can ace your presentation without additional effort. You can download these easy-to-edit presentation templates to make your presentation stand out from others. So, what are you waiting for Download the template from Slidegeeks today and give a unique touch to your presentation. The following slide outlines key performance indicators KPI through which marketers can analyze impact of Facebook ads. The key metrics mentioned in slide are likes, shares, comments, click-through rate CTR, cost per conversion CPV, conversion rate, new followers, reach, and brand impressions.
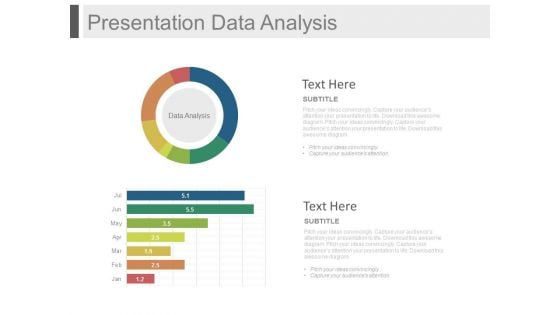
Presentation Data Analysis Ppt Slides
This is a presentation data analysis ppt slides. This is a two stage process. The stages in this process are business, finance, marketing.
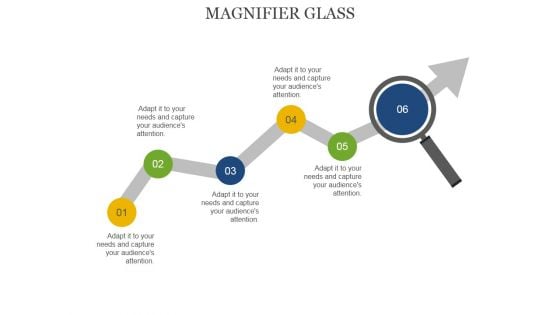
Magnifier Glass Ppt PowerPoint Presentation Summary Microsoft
This is a magnifier glass ppt powerpoint presentation summary microsoft. This is a five stage process. The stages in this process are magnifying glass, arrows, marketing, technology, business.
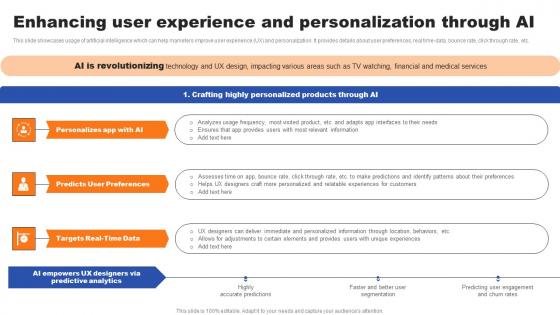
Enhancing User Experience And Personalization Through AI Ppt Gallery Styles Pdf
This slide showcases usage of artificial intelligence which can help marketers improve user experience UX and personalization. It provides details about user preferences, real time-data, bounce rate, click through rate, etc. There are so many reasons you need a EEnhancing User Experience And Personalization Through AI Ppt Gallery Styles Pdf. The first reason is you can not spend time making everything from scratch, Thus, Slidegeeks has made presentation templates for you too. You can easily download these templates from our website easily. This slide showcases usage of artificial intelligence which can help marketers improve user experience UX and personalization. It provides details about user preferences, real time-data, bounce rate, click through rate, etc.
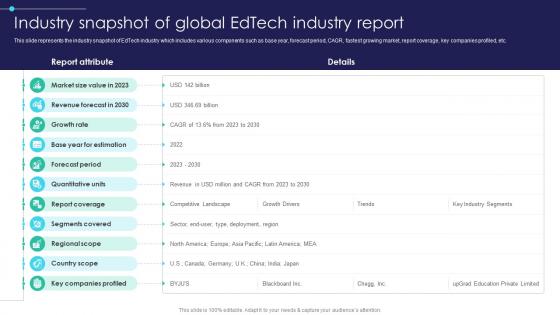
Global Digital Education Industry Snapshot Of Global Edtech Industry Report IR SS V
This slide represents the industry snapshot of EdTech industry which includes various components such as base year, forecast period, CAGR, fastest growing market, report coverage, key companies profiled, etc. Welcome to our selection of the Global Digital Education Industry Snapshot Of Global Edtech Industry Report IR SS V. These are designed to help you showcase your creativity and bring your sphere to life. Planning and Innovation are essential for any business that is just starting out. This collection contains the designs that you need for your everyday presentations. All of our PowerPoints are 100Percent editable, so you can customize them to suit your needs. This multi-purpose template can be used in various situations. Grab these presentation templates today. This slide represents the industry snapshot of EdTech industry which includes various components such as base year, forecast period, CAGR, fastest growing market, report coverage, key companies profiled, etc.
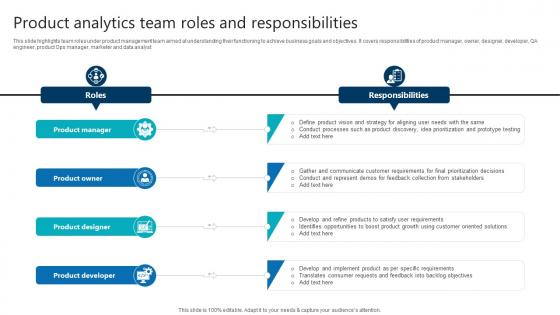
Product Analytics Team Roles And Responsibilities Product Analytics Implementation Data Analytics V
This slide highlights team roles under product management team aimed at understanding their functioning to achieve business goals and objectives. It covers responsibilities of product manager, owner, designer, developer, QA engineer, product Ops manager, marketer and data analyst From laying roadmaps to briefing everything in detail, our templates are perfect for you. You can set the stage with your presentation slides. All you have to do is download these easy-to-edit and customizable templates. Product Analytics Team Roles And Responsibilities Product Analytics Implementation Data Analytics V will help you deliver an outstanding performance that everyone would remember and praise you for. Do download this presentation today. This slide highlights team roles under product management team aimed at understanding their functioning to achieve business goals and objectives. It covers responsibilities of product manager, owner, designer, developer, QA engineer, product Ops manager, marketer and data analyst
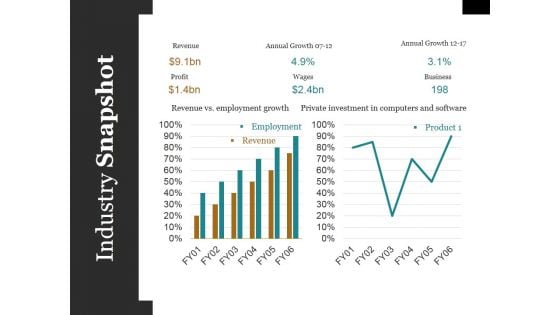
Industry Snapshot Ppt PowerPoint Presentation Styles Microsoft
This is a industry snapshot ppt powerpoint presentation styles microsoft. This is a two stage process. The stages in this process are employment, revenue, bar, marketing, success.
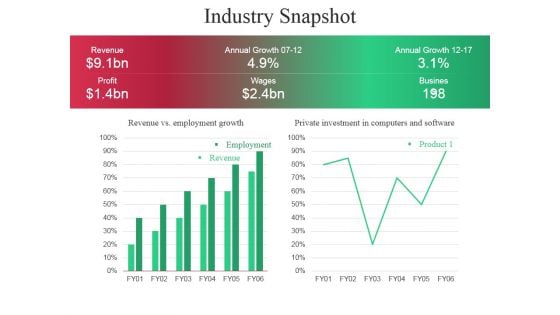
Industry Snapshot Ppt PowerPoint Presentation Model Elements
This is a industry snapshot ppt powerpoint presentation model elements. This is a four stage process. The stages in this process are business, marketing, strategy, industry, planning.
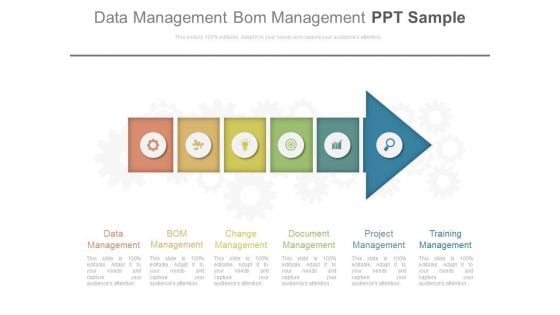
Data Management Bom Management Ppt Sample
This is a data management bom management ppt sample. This is a six stage process. The stages in this process are arrows, business, marketing.
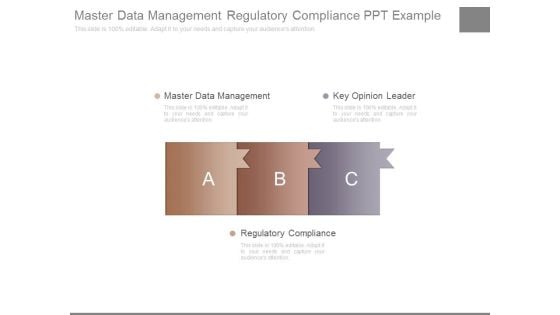
Master Data Management Regulatory Compliance Ppt Example
This is a master data management regulatory compliance ppt example. This is a three stage process. The stages in this process are business, marketing.
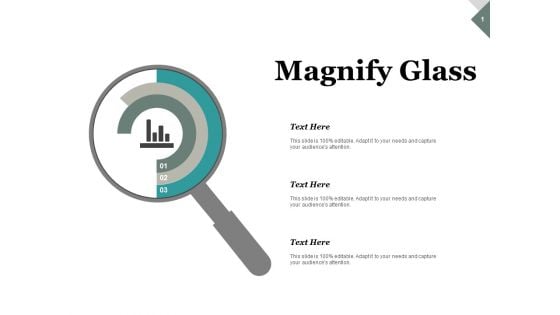
Magnify Glass Research Ppt PowerPoint Presentation Styles Gallery
This is a magnify glass research ppt powerpoint presentation styles gallery. This is a three stage process. The stages in this process are magnifying glass, research, marketing, strategy, business.
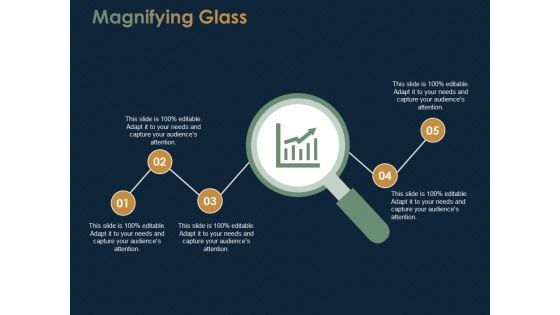
Magnifying Glass Research Ppt PowerPoint Presentation Gallery Clipart Images
This is a magnifying glass research ppt powerpoint presentation gallery clipart images. This is a five stage process. The stages in this process are magnifying glass, research, marketing, strategy, business.
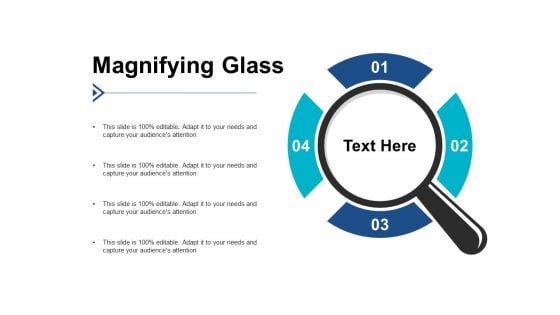
Magnifying Glass Research Ppt PowerPoint Presentation Infographics Example Introduction
This is a magnifying glass research ppt powerpoint presentation infographics example introduction. This is a four stage process. The stages in this process are magnifying glass, research, marketing, strategy, business.
Magnifying Glass Research Ppt PowerPoint Presentation Infographics Good
This is a magnifying glass research ppt powerpoint presentation infographics good. This is a four stage process. The stages in this process are magnifying glass, research, marketing, strategy, business.
Magnifying Glass Ppt PowerPoint Presentation Gallery
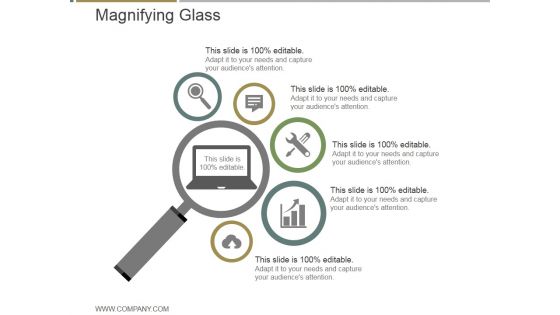
This is a magnifying glass ppt powerpoint presentation gallery. This is a five stage process. The stages in this process are magnifying glass, business, marketing, icons, technology.
Magnifying Glass Ppt PowerPoint Presentation Clipart
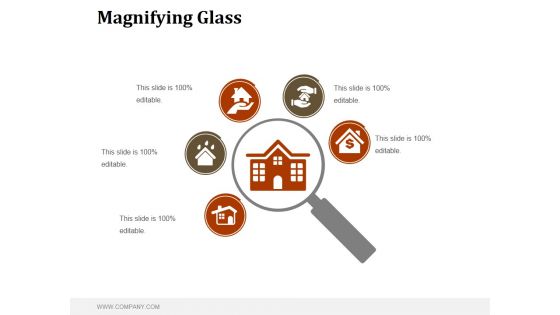
This is a magnifying glass ppt powerpoint presentation clipart. This is a five stage process. The stages in this process are magnifying glass, business, marketing, success, management.
Magnifying Glass Ppt PowerPoint Presentation Icon Inspiration
This is a magnifying glass ppt powerpoint presentation icon inspiration. This is a six stage process. The stages in this process are magnifying glass, technology, business, marketing, process.
Magnify Glass Ppt PowerPoint Presentation Pictures Example
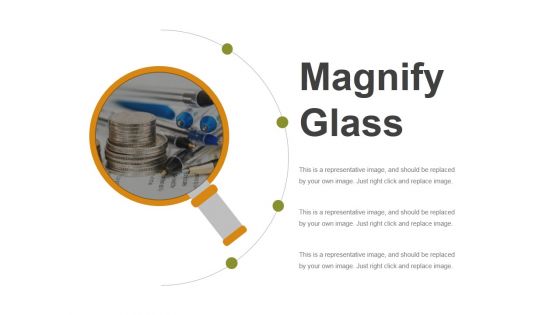
This is a magnify glass ppt powerpoint presentation pictures example. This is a one stage process. The stages in this process are magnify glass, business, marketing, success, technology.
Magnifying Ppt PowerPoint Presentation Icon Layout Ideas
This is a magnifying ppt powerpoint presentation icon layout ideas. This is a five stage process. The stages in this process are magnifying, business, marketing, icons, process.

Customer Focus Ppt PowerPoint Presentation Infographics Samples
This is a customer focus ppt powerpoint presentation infographics samples. This is a one stage process. The stages in this process are customer focus, business, marketing, management, technology.
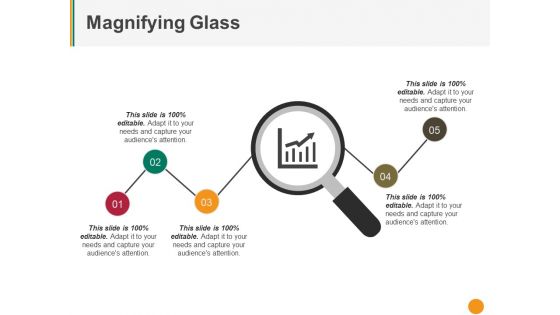
Magnifying Glass Ppt PowerPoint Presentation Ideas Graphics Design
This is a magnifying glass ppt powerpoint presentation ideas graphics design. This is a five stage process. The stages in this process are magnifying glass, business, marketing, management.
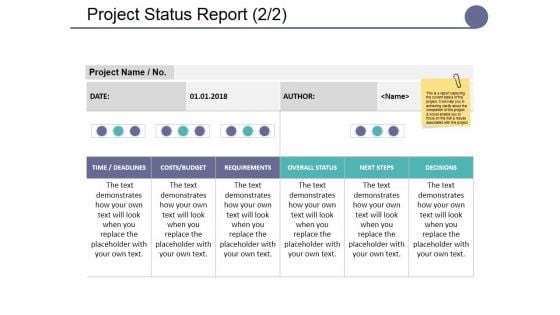
Project Status Report Template Ppt PowerPoint Presentation Model Background Designs
This is a project status report template ppt powerpoint presentation model background designs. This is a three stage process. The stages in this process are business, marketing, strategy, table, data.
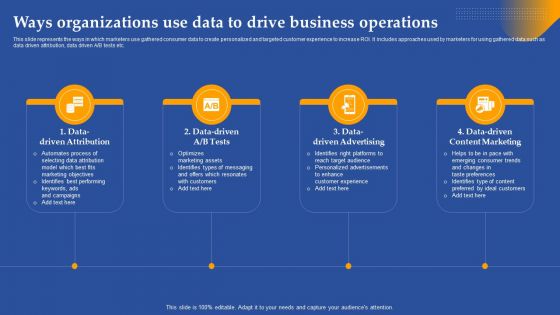
Ways Organizations Use Data To Drive Business Operations Ppt Pictures Inspiration PDF
This slide represents the ways in which marketers use gathered consumer data to create personalized and targeted customer experience to increase ROI. It includes approaches used by marketers for using gathered data such as data driven attribution, data driven A or B tests etc. There are so many reasons you need a Ways Organizations Use Data To Drive Business Operations Ppt Pictures Inspiration PDF. The first reason is you can not spend time making everything from scratch, Thus, Slidegeeks has made presentation templates for you too. You can easily download these templates from our website easily.
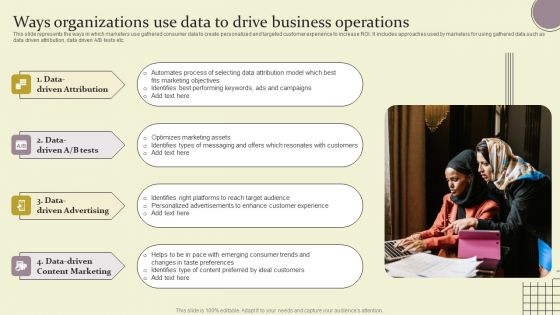
Ways Organizations Use Data To Drive Business Operations Ppt Model Backgrounds PDF
This slide represents the ways in which marketers use gathered consumer data to create personalized and targeted customer experience to increase ROI. It includes approaches used by marketers for using gathered data such as data driven attribution, data driven A or B tests etc. There are so many reasons you need a Ways Organizations Use Data To Drive Business Operations Ppt Model Backgrounds PDF. The first reason is you can not spend time making everything from scratch, Thus, Slidegeeks has made presentation templates for you too. You can easily download these templates from our website easily.

Project Conclusion Report Performance Analysis Ppt PowerPoint Presentation Slides Design Templates
This is a project conclusion report performance analysis ppt powerpoint presentation slides design templates. This is a three stage process. The stages in this process are business, marketing, table, compare, analysis.
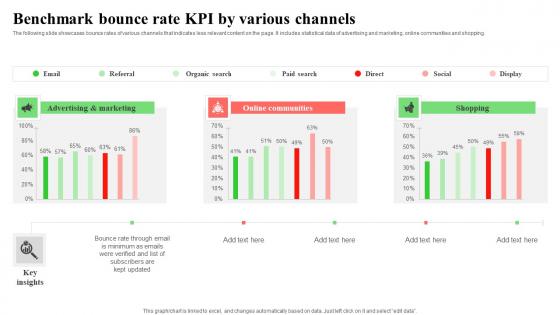
Benchmark Bounce Rate KPI By Various Channels Infographics Pdf
The following slide showcases bounce rates of various channels that indicates less relevant content on the page. It includes statistical data of advertising and marketing, online communities and shopping. Pitch your topic with ease and precision using this Benchmark Bounce Rate KPI By Various Channels Infographics Pdf. This layout presents information on Advertising,Marketing, Online Communities. It is also available for immediate download and adjustment. So, changes can be made in the color, design, graphics or any other component to create a unique layout. The following slide showcases bounce rates of various channels that indicates less relevant content on the page. It includes statistical data of advertising and marketing, online communities and shopping.
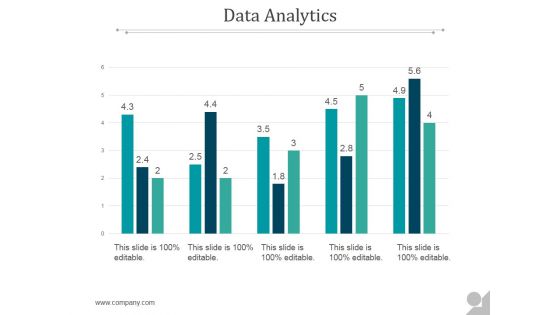
Data Analytics Ppt PowerPoint Presentation Themes
This is a data analytics ppt powerpoint presentation themes. This is a five stage process. The stages in this process are business, marketing, presentation, data analyst, management.
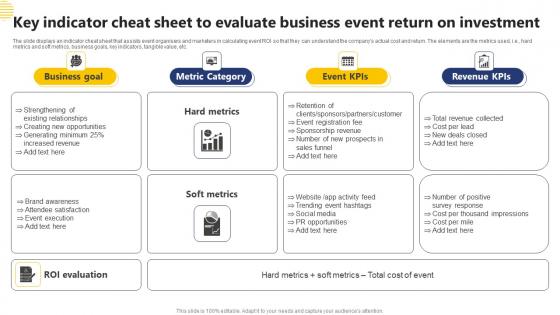
Key Indicator Cheat Sheet To Evaluate Business Event Return On Investment Template Pdf
The slide displays an indicator cheat sheet that assists event organisers and marketers in calculating event ROI so that they can understand the companys actual cost and return. The elements are the metrics used, i.e., hard metrics and soft metrics, business goals, key indicators, tangible value, etc. Showcasing this set of slides titled Key Indicator Cheat Sheet To Evaluate Business Event Return On Investment Template Pdf The topics addressed in these templates are Business Goal, Metric Category, Revenue KPIS All the content presented in this PPT design is completely editable. Download it and make adjustments in color, background, font etc. as per your unique business setting. The slide displays an indicator cheat sheet that assists event organisers and marketers in calculating event ROI so that they can understand the companys actual cost and return. The elements are the metrics used, i.e., hard metrics and soft metrics, business goals, key indicators, tangible value, etc.
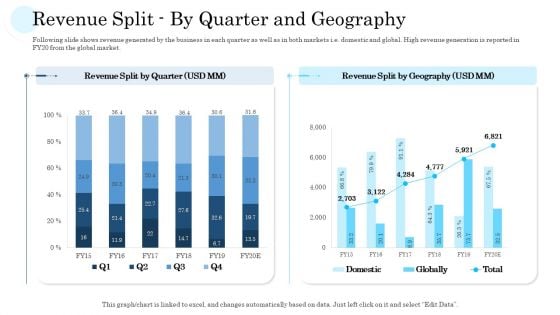
Revenue Split By Quarter And Geography Ppt PowerPoint Presentation File Guidelines PDF
Following slide shows revenue generated by the business in each quarter as well as in both markets i.e. domestic and global. High revenue generation is reported in FY20 from the global market.Deliver an awe-inspiring pitch with this creative revenue split by quarter and geography ppt powerpoint presentation file guidelines pdf. bundle. Topics like revenue split by quarter, revenue split by geography can be discussed with this completely editable template. It is available for immediate download depending on the needs and requirements of the user.
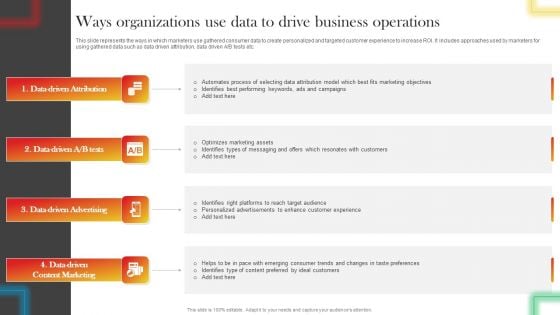
Ways Organizations Use Data To Drive Business Operations Brochure PDF
This slide represents the ways in which marketers use gathered consumer data to create personalized and targeted customer experience to increase ROI. It includes approaches used by marketers for using gathered data such as data driven attribution, data driven A OR B tests etc. Find highly impressive Ways Organizations Use Data To Drive Business Operations Brochure PDF on Slidegeeks to deliver a meaningful presentation. You can save an ample amount of time using these presentation templates. No need to worry to prepare everything from scratch because Slidegeeks experts have already done a huge research and work for you. You need to download Ways Organizations Use Data To Drive Business Operations Brochure PDF for your upcoming presentation. All the presentation templates are 100 percent editable and you can change the color and personalize the content accordingly. Download now
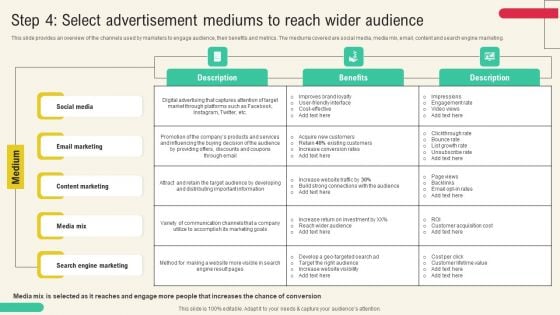
Step 4 Select Advertisement Mediums To Reach Wider Audience Sample PDF
This slide provides an overview of the channels used by marketers to engage audience, their benefits and metrics. The mediums covered are social media, media mix, email, content and search engine marketing. The Step 4 Select Advertisement Mediums To Reach Wider Audience Sample PDF is a compilation of the most recent design trends as a series of slides. It is suitable for any subject or industry presentation, containing attractive visuals and photo spots for businesses to clearly express their messages. This template contains a variety of slides for the user to input data, such as structures to contrast two elements, bullet points, and slides for written information. Slidegeeks is prepared to create an impression.
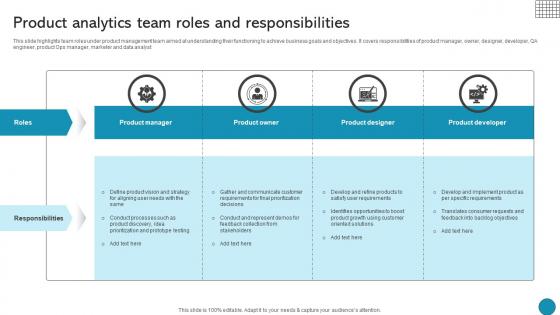
Product Analytics Team Roles And Responsibilities Driving Business Success Integrating Product
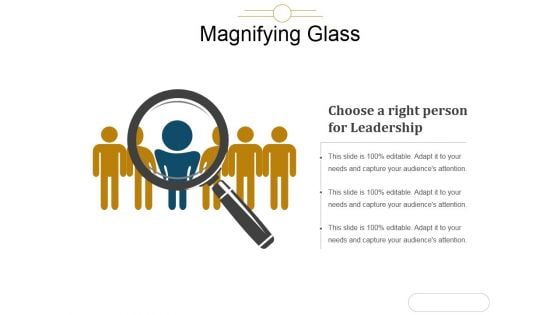
Magnifying Glass Ppt PowerPoint Presentation Ideas
This is a magnifying glass ppt powerpoint presentation ideas. This is a one stage process. The stages in this process are choose a right person for leadership, business, big data, marketing, technology.
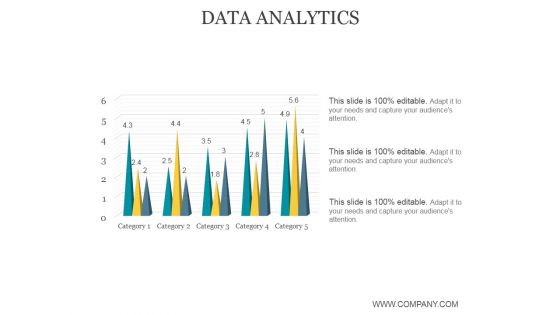
Data Analytics Ppt PowerPoint Presentation Guide
This is a data analytics ppt powerpoint presentation guide. This is a five stage process. The stages in this process are data analysis, business, marketing, success, graph.
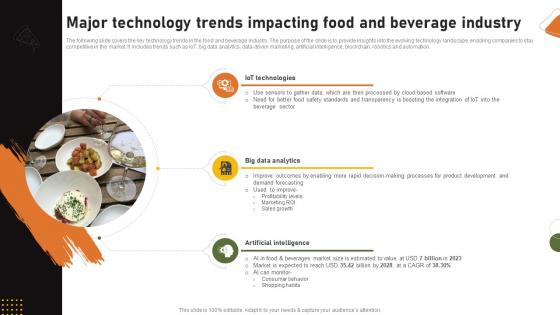
Food And Drink Industry Report Major Technology Trends Impacting Food And Beverage Industry IR SS V
The following slide covers the key technology trends in the food and beverage industry. The purpose of the slide is to provide insights into the evolving technology landscape, enabling companies to stay competitive in the market. It includes trends such as IoT, big data analytics, data-driven marketing, artificial intelligence, blockchain, robotics and automation. Coming up with a presentation necessitates that the majority of the effort goes into the content and the message you intend to convey. The visuals of a PowerPoint presentation can only be effective if it supplements and supports the story that is being told. Keeping this in mind our experts created Food And Drink Industry Report Major Technology Trends Impacting Food And Beverage Industry IR SS V to reduce the time that goes into designing the presentation. This way, you can concentrate on the message while our designers take care of providing you with the right template for the situation. The following slide covers the key technology trends in the food and beverage industry. The purpose of the slide is to provide insights into the evolving technology landscape, enabling companies to stay competitive in the market. It includes trends such as IoT, big data analytics, data-driven marketing, artificial intelligence, blockchain, robotics and automation.
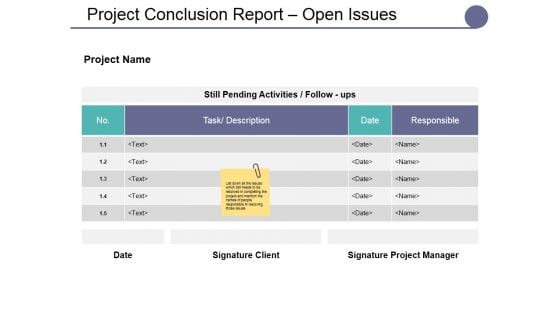
Project Conclusion Report Open Issues Ppt PowerPoint Presentation Styles Background Images
This is a project conclusion report open issues ppt powerpoint presentation styles background images. This is a four stage process. The stages in this process are business, marketing, table, compare, analysis.
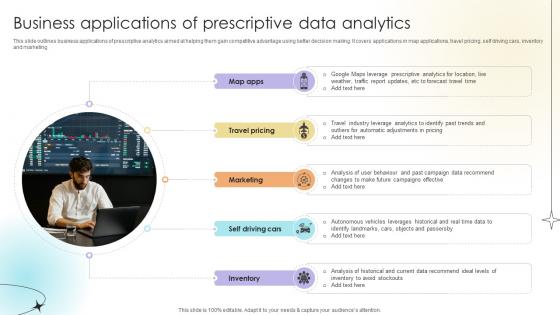
Business Applications Of Prescriptive Data Analytics Data Analytics SS V
This slide outlines business applications of prescriptive analytics aimed at helping them gain competitive advantage using better decision making. It covers applications in map applications, travel pricing, self driving cars, inventory and marketing.The best PPT templates are a great way to save time, energy, and resources. Slidegeeks have 100 percent editable powerpoint slides making them incredibly versatile. With these quality presentation templates, you can create a captivating and memorable presentation by combining visually appealing slides and effectively communicating your message. Download Business Applications Of Prescriptive Data Analytics Data Analytics SS V from Slidegeeks and deliver a wonderful presentation. This slide outlines business applications of prescriptive analytics aimed at helping them gain competitive advantage using better decision making. It covers applications in map applications, travel pricing, self driving cars, inventory and marketing.
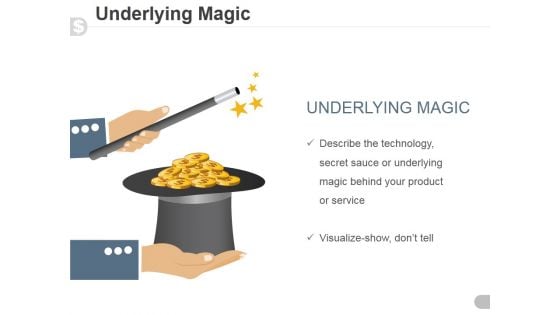
Underlying Magic Ppt PowerPoint Presentation Inspiration
This is a underlying magic ppt powerpoint presentation inspiration. This is a one stage process. The stages in this process are business, marketing, magic, technology, product.
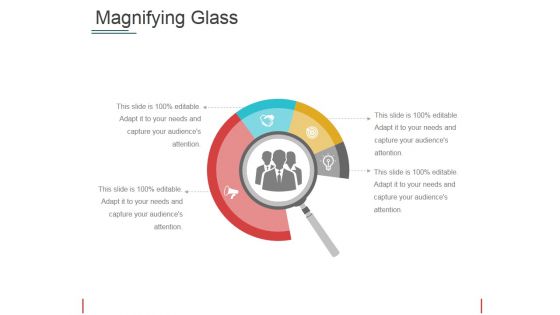
Magnifying Glass Ppt PowerPoint Presentation File Grid
This is a magnifying glass ppt powerpoint presentation file grid. This is a four stage process. The stages in this process are magnifying glass, icons, marketing, business, management.
Magnifying Glass Ppt PowerPoint Presentation Icon Good
This is a magnifying glass ppt powerpoint presentation icon good. This is a five stage process. The stages in this process are magnifying glass, process, icons, marketing, business.

Magnifying Glass Ppt PowerPoint Presentation Layouts Guide
This is a magnifying glass ppt powerpoint presentation layouts guide. This is a six stage process. The stages in this process are magnifying glass, process, business, marketing, technology.

Performance Review Powerpoint Presentation Slides
Increase your chances of writing a winning business proposal and grabbing your prospects attention with this well-crafted, innovative Performance Review Powerpoint Presentation Slides. This Employee Evaluation, Productivity Assessment, Performance Metrics, Post Performance Survey, Performance Analysis, Evaluation Criteria-slide presentation template comes with in-built content to help you outline a presentation that can serve as an industry benchmark. The complete deck also makes use of an impressive color scheme to create a visual impact and hook the audience. Use this PPT to plan how your business can be the Numero uno in its segment within no time at all. Download now to showcase your brand USP and offerings to engage your client. Boost your market performance by sing our comprehensive and professionally designed PowerPoint presentation Performance Review Process Powerpoint Presentation Slides that includes key features such as tools for employee assessments, promotions, appraisals, cost accounting, and confidential record management, ensuring a holistic approach to performance improvement. This PPT offers data driven insights to streamline overall performance strategy. The performance coaching presentation template helps you to review the productivity and profitability of your organization.Download this performance management presentation deck and achieve your business target in an effective manner.
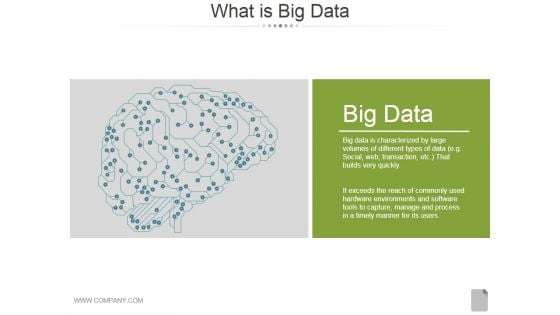
What Is Big Data Ppt PowerPoint Presentation Diagrams
This is a what is big data ppt powerpoint presentation diagrams. This is a one stage process. The stages in this process are big data, business, analysis, management, marketing.
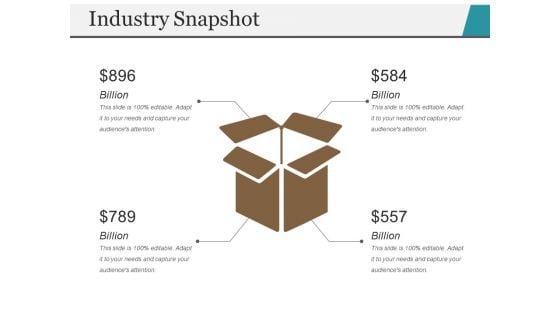
Industry Snapshot Template 2 Ppt PowerPoint Presentation File Display
This is a industry snapshot template 2 ppt powerpoint presentation file display. This is a four stage process. The stages in this process are billion, business, marketing, management.

Plan And Frame Problem Collect The Data Ppt Sample
This is a plan and frame problem collect the data ppt sample. This is a four stage process. The stages in this process are business, marketing, success.
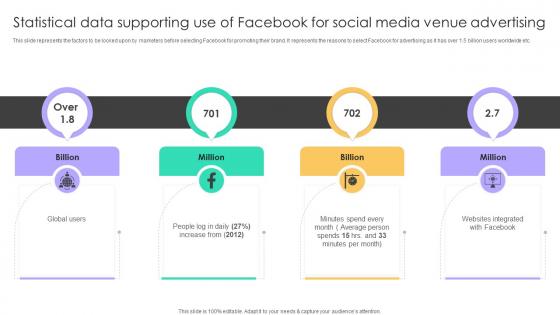
Online Venue Advertising Plan Statistical Data Supporting Use Of Facebook For Social Media Strategy SS V
This slide represents the factors to be looked upon by marketers before selecting Facebook for promoting their brand. It represents the reasons to select Facebook for advertising as it has over 1.5 billion users worldwide etc. The Online Venue Advertising Plan Statistical Data Supporting Use Of Facebook For Social Media Strategy SS V is a compilation of the most recent design trends as a series of slides. It is suitable for any subject or industry presentation, containing attractive visuals and photo spots for businesses to clearly express their messages. This template contains a variety of slides for the user to input data, such as structures to contrast two elements, bullet points, and slides for written information. Slidegeeks is prepared to create an impression. This slide represents the factors to be looked upon by marketers before selecting Facebook for promoting their brand. It represents the reasons to select Facebook for advertising as it has over 1.5 billion users worldwide etc.
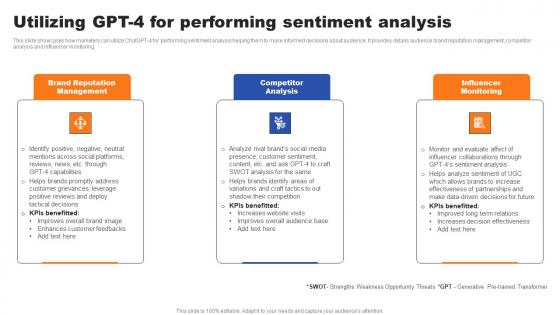
Utilizing GPT 4 For Performing Sentiment Analysis Ppt Gallery Infographic Template Pdf
This slide showcases how marketers can utilize ChatGPT-4 for performing sentiment analysis helping them to make informed decisions about audience. It provides details audience brand reputation management, competitor analysis and influencer monitoring. Create an editable Utilizing GPT 4 For Performing Sentiment Analysis Ppt Gallery Infographic Template Pdf that communicates your idea and engages your audience. Whether you are presenting a business or an educational presentation, pre-designed presentation templates help save time. Utilizing GPT 4 For Performing Sentiment Analysis Ppt Gallery Infographic Template Pdf is highly customizable and very easy to edit, covering many different styles from creative to business presentations. Slidegeeks has creative team members who have crafted amazing templates. So, go and get them without any delay. This slide showcases how marketers can utilize ChatGPT-4 for performing sentiment analysis helping them to make informed decisions about audience. It provides details audience brand reputation management, competitor analysis and influencer monitoring.
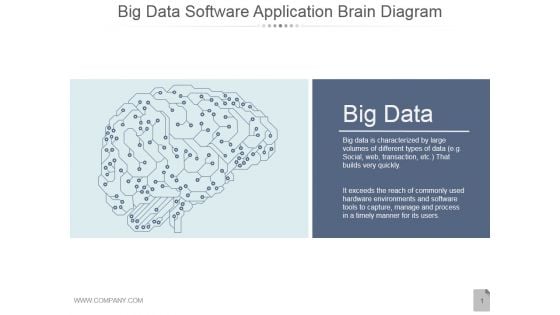
Big Data Software Application Brain Diagram Ppt PowerPoint Presentation Slides
This is a big data software application brain diagram ppt powerpoint presentation slides. This is a one stage process. The stages in this process are big data, communication, business, marketing, idea.

Digital Advertising Using Twitter Snapshot Of Twitter Ads Campaigns Portrait Pdf
This slide provides snapshot of multiple twitter ads campaigns such as tweet engagement, website clicks, app installs etc. It also provides details regarding each campaigns objective and target customer desired action. This modern and well arranged Digital Advertising Using Twitter Snapshot Of Twitter Ads Campaigns Portrait Pdf provides lots of creative possibilities. It is very simple to customize and edit with the Powerpoint Software. Just drag and drop your pictures into the shapes. All facets of this template can be edited with Powerpoint, no extra software is necessary. Add your own material, put your images in the places assigned for them, adjust the colors, and then you can show your slides to the world, with an animated slide included. This slide provides snapshot of multiple twitter ads campaigns such as tweet engagement, website clicks, app installs etc. It also provides details regarding each campaigns objective and target customer desired action.
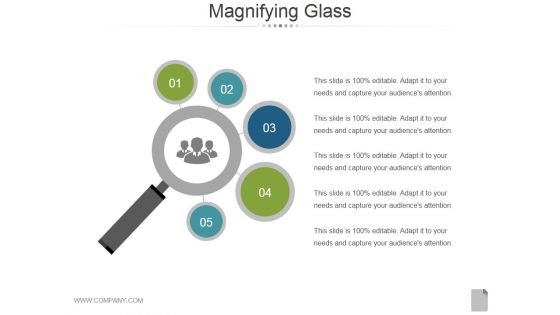
Magnifying Glass Ppt PowerPoint Presentation Rules
This is a magnifying glass ppt powerpoint presentation rules. This is a five stage process. The stages in this process are magnifier glass, search, analysis, marketing, success.


 Continue with Email

 Home
Home


