Marketing Metrics
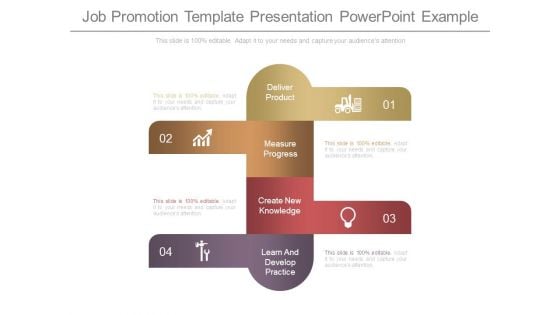
Job Promotion Template Presentation Powerpoint Example
This is a job promotion template presentation powerpoint example. This is a four stage process. The stages in this process are deliver product, measure progress, create new knowledge, learn and develop practice.
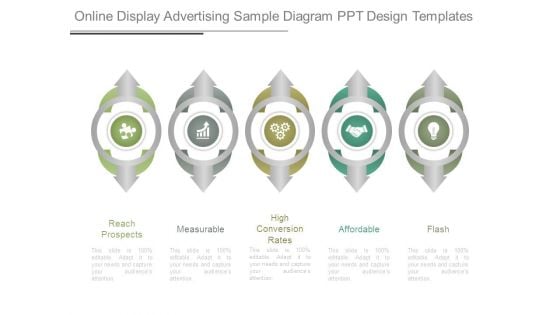
Online Display Advertising Sample Diagram Ppt Design Templates
This is a online display advertising sample diagram ppt design templates. This is a five stage process. The stages in this process are reach prospects, measurable, high conversion rates, affordable, flash.
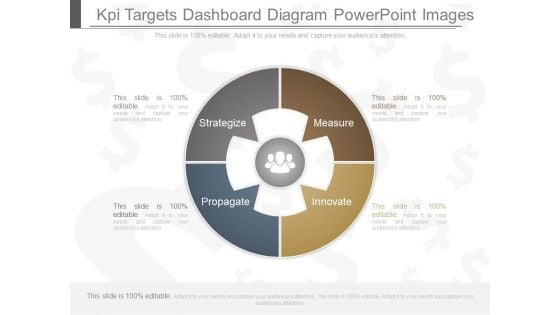
Kpi Targets Dashboard Diagram Powerpoint Images
This is a kpi targets dashboard diagram powerpoint images. This is a four stage process. The stages in this process are strategize, measure, propagate, innovate.
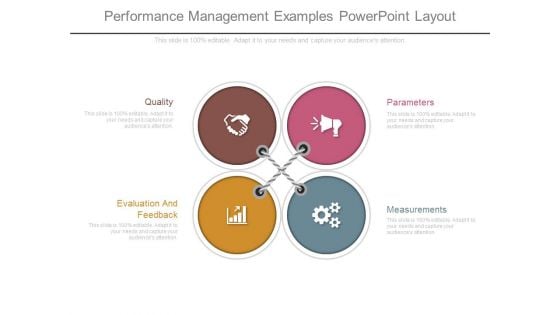
Performance Management Examples Powerpoint Layout
This is a performance management examples powerpoint layout. This is a four stage process. The stages in this process are quality, evaluation and feedback, measurements, parameters.
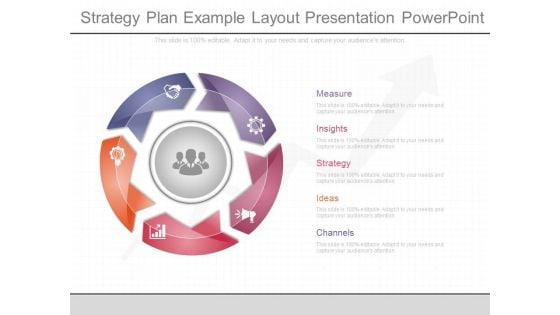
Strategy Plan Example Layout Presentation Powerpoint
This is a strategy plan example layout presentation powerpoint. This is a five stage process. The stages in this process are measure, insights, strategy, ideas, channels.
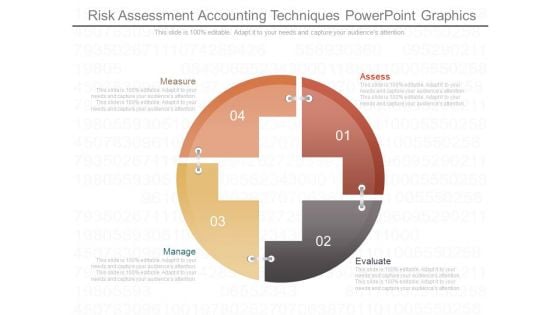
Risk Assessment Accounting Techniques Powerpoint Graphics
This is a risk assessment accounting techniques powerpoint graphics. This is a four stage process. The stages in this process are assess, evaluate, measure, manage.
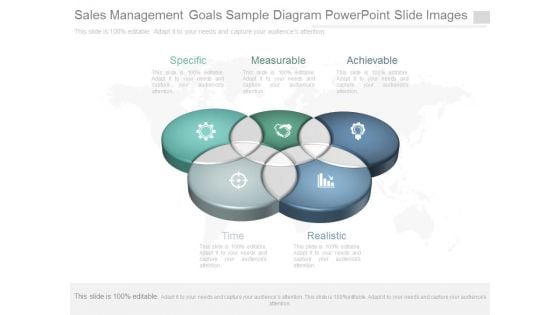
Sales Management Goals Sample Diagram Powerpoint Slide Images
This is a sales management goals sample diagram powerpoint slide images. This is a five stage process. The stages in this process are specific, measurable, achievable, time, realistic.
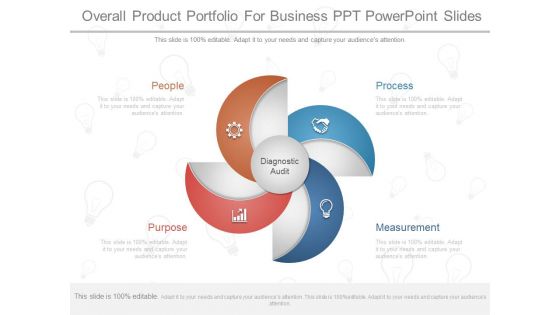
Overall Product Portfolio For Business Ppt Powerpoint Slides
This is a overall product portfolio for business ppt powerpoint slides. This is a four stage process. The stages in this process are people, purpose, measurement, process.
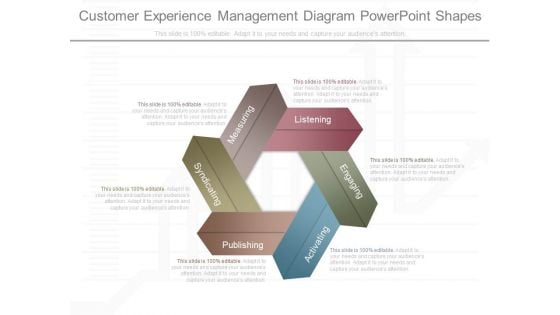
Customer Experience Management Diagram Powerpoint Shapes
This is a customer experience management diagram powerpoint shapes. This is a six stage process. The stages in this process are listening, engaging, activating, publishing, syndicating, measuring.
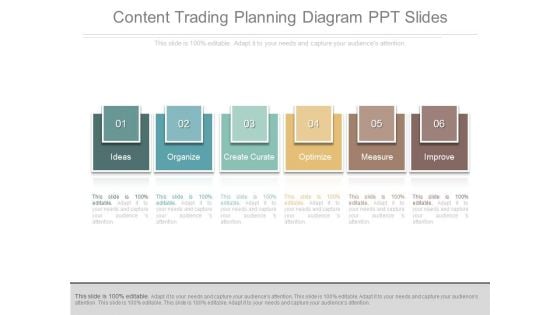
Content Trading Planning Diagram Ppt Slides
This is a content trading planning diagram ppt slides. This is a six stage process. The stages in this process are ideas, organize, create curate, optimize, measure, improve.

Business Performance Dashboard Analysis Diagram Powerpoint Slides
This is a business performance dashboard analysis diagram powerpoint slides. This is a three stage process. The stages in this process are measure, business, management, presentation, process.
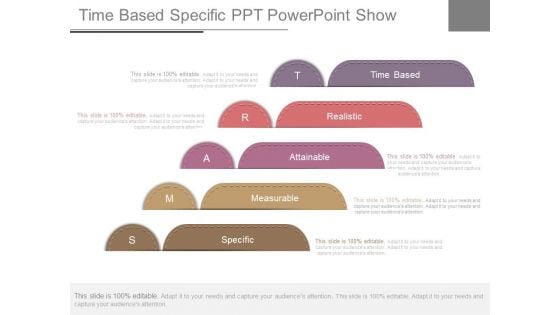
Time Based Specific Ppt Powerpoint Show
This is a time based specific ppt powerpoint show. This is a five stage process. The stages in this process are time based, realistic, attainable, measurable, specific.
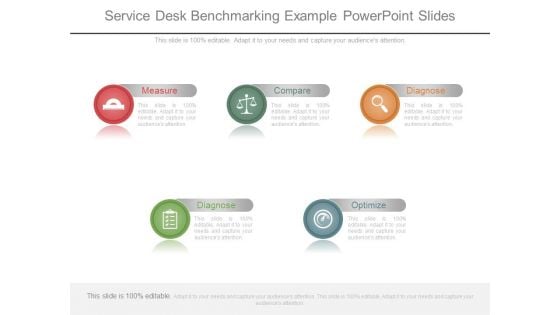
Service Desk Benchmarking Example Powerpoint Slides
This is a service desk benchmarking example powerpoint slides. This is a five stage process. The stages in this process are measure, compare, diagnose, optimize.
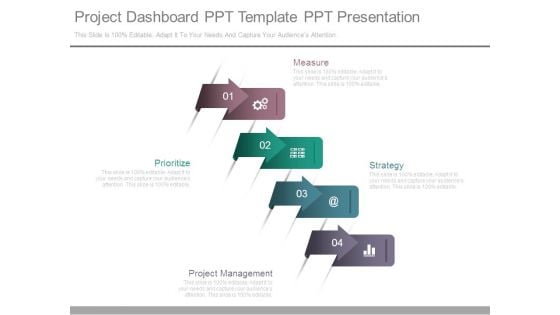
Project Dashboard Ppt Template Ppt Presentation
This is a project dashboard ppt template ppt presentation. This is a four stage process. The stages in this process are measure, strategy, project management, prioritize.
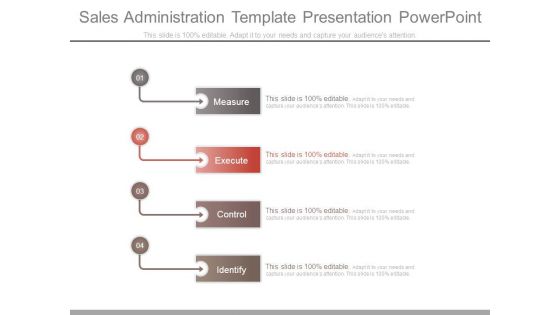
Sales Administration Template Presentation Powerpoint
This is a sales administration template presentation powerpoint. This is a four stage process. The stages in this process are measure, execute, control, identify.
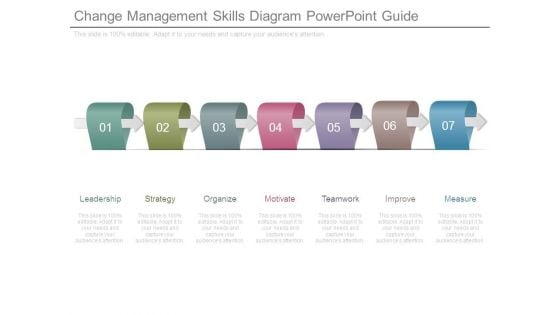
Change Management Skills Diagram Powerpoint Guide
This is a change management skills diagram powerpoint guide. This is a seven stage process. The stages in this process are leadership, strategy, organize, motivate, teamwork, improve, measure.
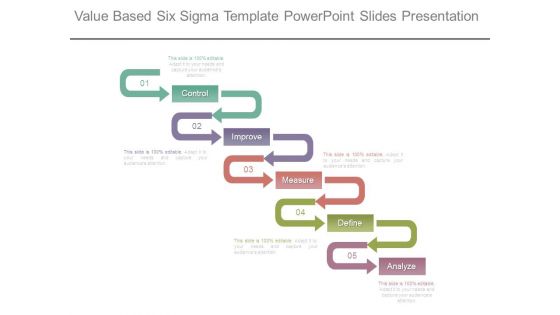
Value Based Six Sigma Template Powerpoint Slides Presentation
This is a value based six sigma template powerpoint slides presentation. This is a five stage process. The stages in this process are control, improve, measure, define, analyze.

B2b Payments Framework Diagram Ppt Slides Download
This is a b2b payments framework diagram ppt slides download. This is a five stage process. The stages in this process are account selection, activation, measurement, geography, benefits.
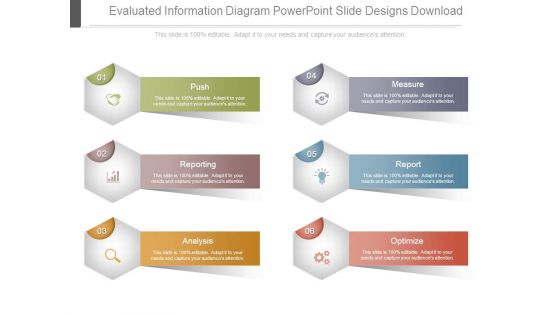
Evaluated Information Diagram Powerpoint Slide Designs Download
This is a evaluated information diagram powerpoint slide designs download. This is a six stage process. The stages in this process are push, measure, reporting, report, analysis, optimize.
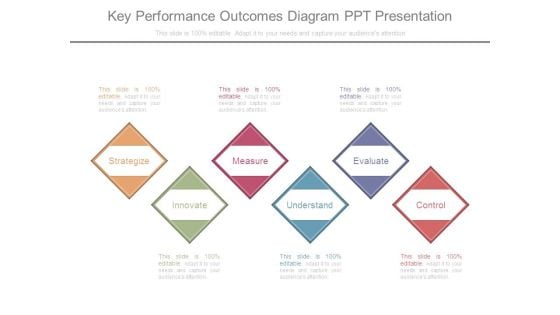
Key Performance Outcomes Diagram Ppt Presentation
This is a key performance outcomes diagram ppt presentation. This is a six stage process. The stages in this process are strategize, innovate, measure, evaluate, control, understand.
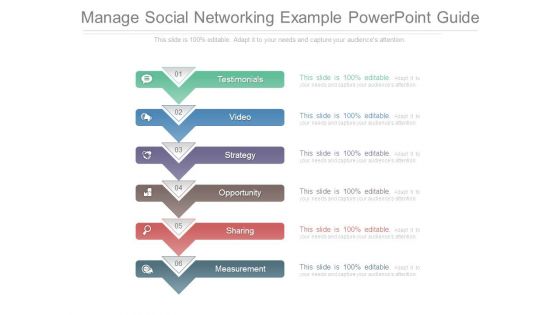
Manage Social Networking Example Powerpoint Guide
This is a manage social networking example powerpoint guide. This is a six stage process. The stages in this process are testimonials, video, strategy, opportunity, sharing, measurement.
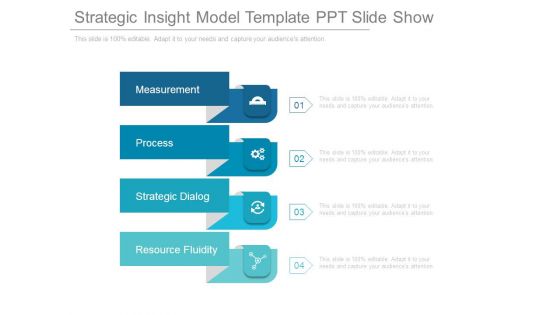
Strategic Insight Model Template Ppt Slide Show
This is a strategic insight model template ppt slide show. This is a four stage process. The stages in this process are measurement, process, strategic dialog, resource fluidity.
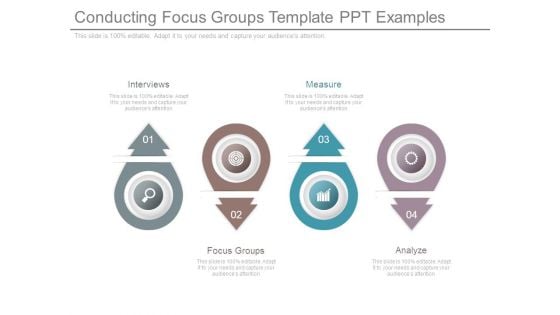
Conducting Focus Groups Template Ppt Examples
This is a conducting focus groups template ppt examples. This is a four stage process. The stages in this process are interviews, focus groups, measure, analyze.

Operational Performance Management Powerpoint Layout
This is a operational performance management powerpoint layout. This is a one stage process. The stages in this process are dashboard, measure, business.
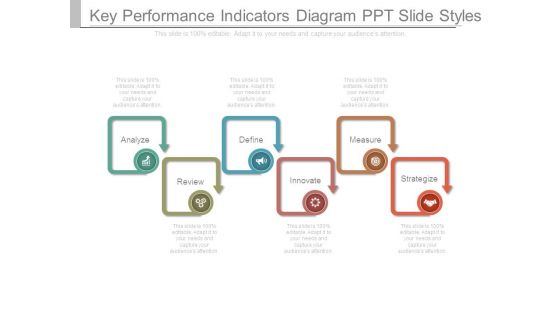
Key Performance Indicators Diagram Ppt Slide Styles
This is a key performance indicators diagram ppt slide styles. This is a six stage process. The stages in this process are analyze, define, measure, review, innovate, strategize.
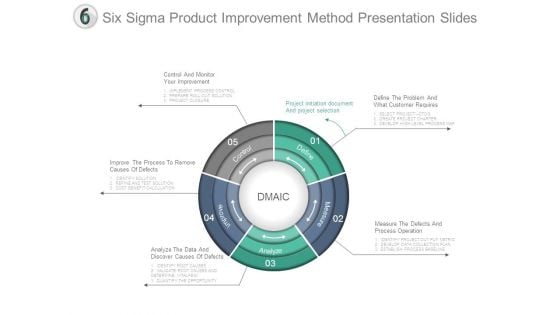
Six Sigma Product Improvement Method Presentation Slides
This is a six sigma product improvement method presentation slides. This is a five stage process. The stages in this process are control, define, measure, analyze, improve.

Process Improvement Using Six Sigma Process Powerpoint Show
This is a process improvement using six sigma process powerpoint show. This is a five stage process. The stages in this process are define, measure, analyze, improve, control.
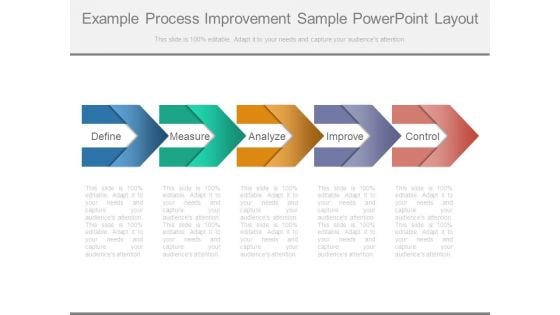
Example Process Improvement Sample Powerpoint Layout
This is a example process improvement sample powerpoint layout. This is a five stage process. The stages in this process are define, measure, analyze, improve, control.

Balanced Scorecard Learning And Growth Slide Examples Of Ppt
This is a balanced scorecard learning and growth slide examples of ppt. This is a four stage process. The stages in this process are objectives, measures, initiatives, targets.
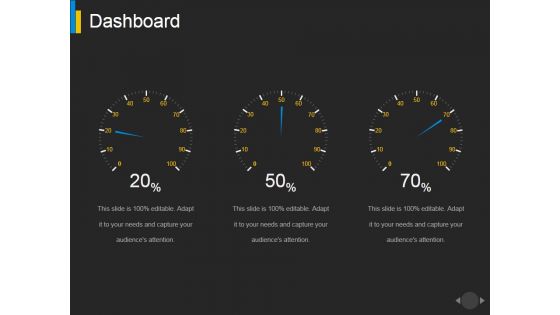
Dashboard Ppt PowerPoint Presentation Portfolio Maker
This is a dashboard ppt powerpoint presentation portfolio maker. This is a three stage process. The stages in this process are dashboard, measurement, finance, business.
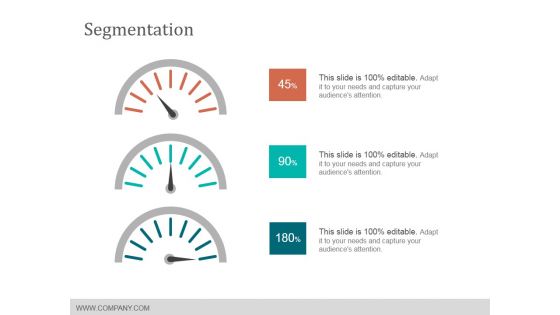
Segmentation Ppt PowerPoint Presentation Pictures Templates
This is a segmentation ppt powerpoint presentation pictures templates. This is a three stage process. The stages in this process are dashboard, business, measurement, finance.
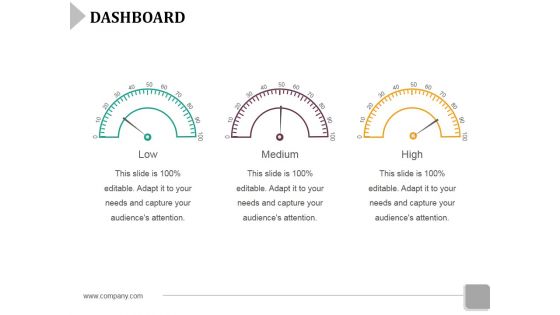
Dashboard Ppt PowerPoint Presentation Gallery Graphics Template
This is a dashboard ppt powerpoint presentation gallery graphics template. This is a three stage process. The stages in this process are low, medium, high, measurement.
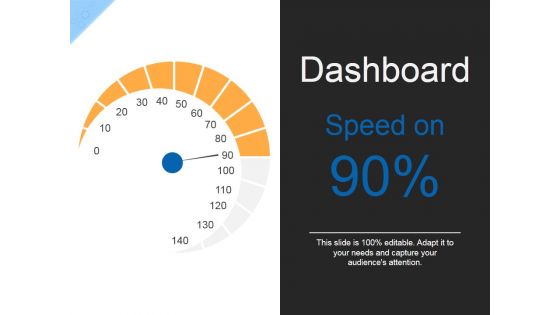
Dashboard Ppt PowerPoint Presentation Infographics Outfit
This is a dashboard ppt powerpoint presentation infographics outfit. This is a one stage process. The stages in this process are dashboard, measurement, finance, business.
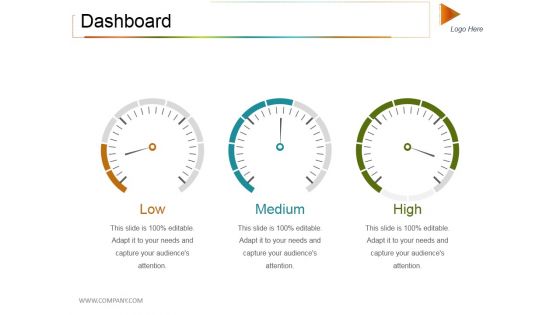
Dashboard Ppt PowerPoint Presentation Inspiration Backgrounds
This is a dashboard ppt powerpoint presentation inspiration backgrounds. This is a three stage process. The stages in this process are low, medium, high, dashboard, measurement.
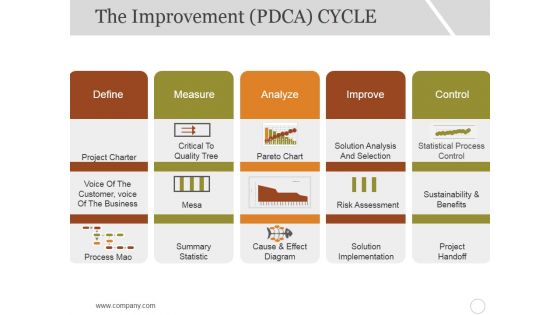
The Improvement Cycle Ppt PowerPoint Presentation Show Example
This is a the improvement cycle ppt powerpoint presentation show example. This is a five stage process. The stages in this process are define, measure, analyze, improve, control.
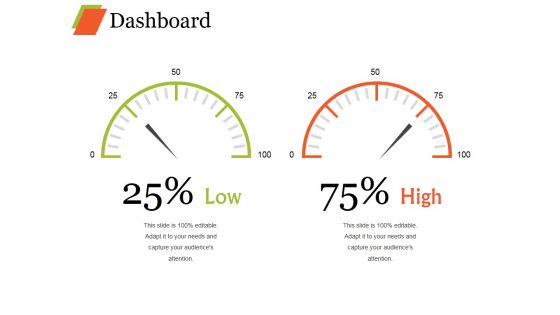
Dashboard Ppt PowerPoint Presentation Styles Templates
This is a dashboard ppt powerpoint presentation styles templates. This is a two stage process. The stages in this process are low, medium, high, dashboard, measurement.
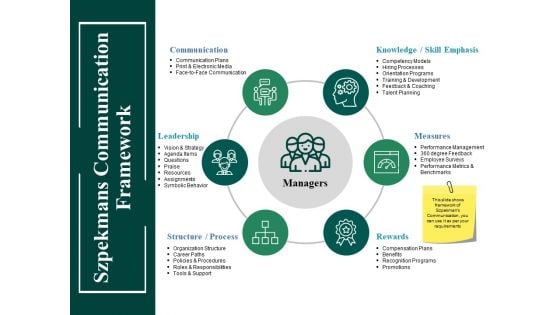
Szpekmans Communication Framework Ppt PowerPoint Presentation Show Visuals
This is a szpekmans communication framework ppt powerpoint presentation show visuals. This is a six stage process. The stages in this process are communication, leadership, rewards, measures, structure.
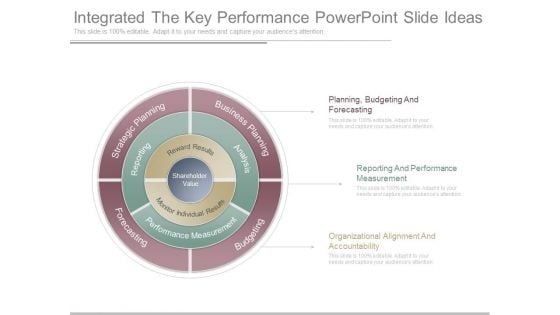
Integrated The Key Performance Powerpoint Slide Ideas
This is a integrated the key performance powerpoint slide ideas. This is a three stage process. The stages in this process are shareholder value, reward results, monitor individual results, analysis, performance measurement, reporting, business planning, budgeting, forecasting, strategic planning, planning, budgeting and forecasting, reporting and performance measurement, organizational alignment and accountability.
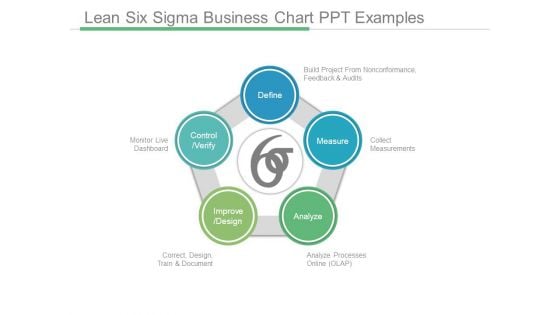
Lean Six Sigma Business Chart Ppt Examples
This is a lean six sigma business chart ppt examples. This is a five stage process. The stages in this process are define build project from nonconformance feedback and audits, measure collect measurements, analyze processes online olap, improve design correct design train and document, control verify monitor live dashboard.
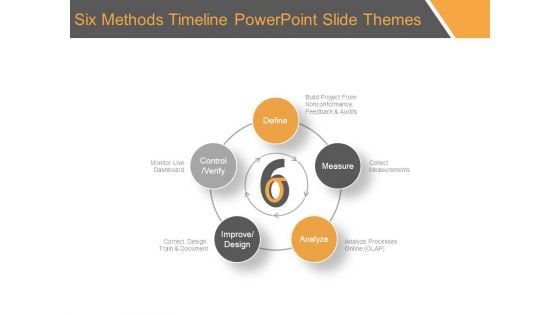
Six Methods Timeline Powerpoint Slide Themes
This is a six methods timeline powerpoint slide themes. This is a five stage process. The stages in this process are define, measure, analyze, improve design, control verify, build project from nonconformance, feedback and audits, collect measurements, analyze processes online, correct, design, train and document, monitor live dashboard.
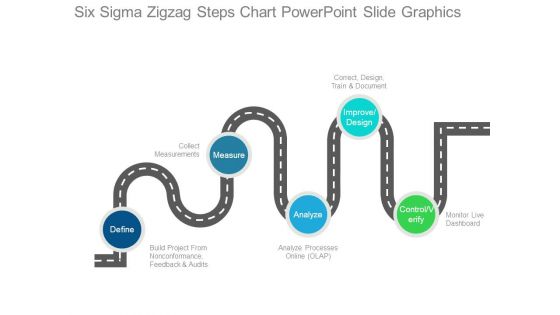
Six Sigma Zigzag Steps Chart Powerpoint Slide Graphics
This is a six sigma zigzag steps chart powerpoint slide graphics. This is a five stage process. The stages in this process are define, build project from nonconformance feedback and audits, collect measurements, measure, analyze, analyze processes online olap, improve design, correct design train and document, monitor live dashboard, control verify.
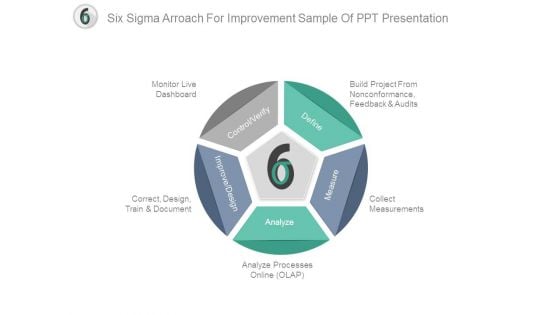
Six Sigma Arroach For Improvement Sample Of Ppt Presentation
This is a six sigma arroach for improvement sample of ppt presentation. This is a five stage process. The stages in this process are control verify, define, measure, analyze, improve design, monitor live dashboard, correct, design, train and document, build project from nonconformance, feedback and audits, collect measurements, analyze processes online olap.
PowerPoint Arrow Shapes Comparison Process Ppt Templates Backgrounds For Slides
3d, accounting, arrow, art, bar, blue, business, calculation, chart, collection, company, design elements, diagram, directive, expense, finance, firm, forecast, future, gain, graph, grow, growth, icon, illustration, income, line, market, measure, objects, office, profit, progress, rate, set, statistic, stock, success, two, up, vector, yellow Get on the list of audience favourites. Experience adulation with our PowerPoint Arrow Shapes Comparison Process Ppt Templates Backgrounds For Slides.
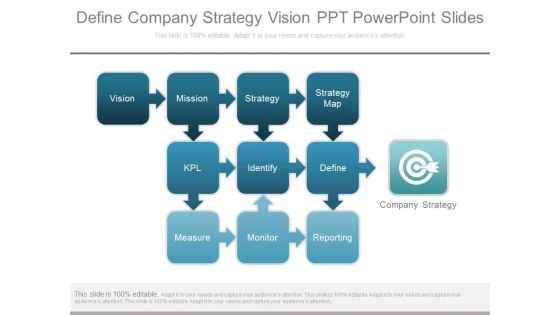
Define Company Strategy Vision Ppt Powerpoint Slides
This is a define company strategy vision ppt powerpoint slides. This is a three stage process. The stages in this process are vision, mission, strategy, strategy map, kpl, identify, define, measure, monitor, reporting, company strategy.
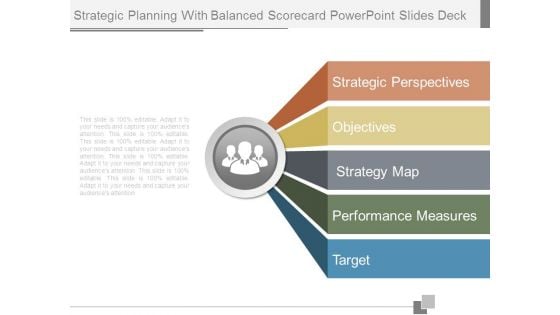
Strategic Planning With Balanced Scorecard Powerpoint Slides Deck
This is a strategic planning with balanced scorecard powerpoint slides deck. This is a five stage process. The stages in this process are strategic perspectives, objectives, strategy map, performance measures, target.

Customer Engagement Model For Continuous Improvement Ppt Ideas
This is a customer engagement model for continuous improvement ppt ideas. This is a three stage process. The stages in this process are process, best particle, performance engineering, cost, technology, people, productivity, efficiency, scalability, customer satisfaction, optimization, continuous improvement.

Business Interrelationship Graphic Design Powerpoint Presentation Examples
This is a business interrelationship graphic design powerpoint presentation examples. This is a six stage process. The stages in this process are data integration, performance management, sales, accounting, assemble product, decision support systems.
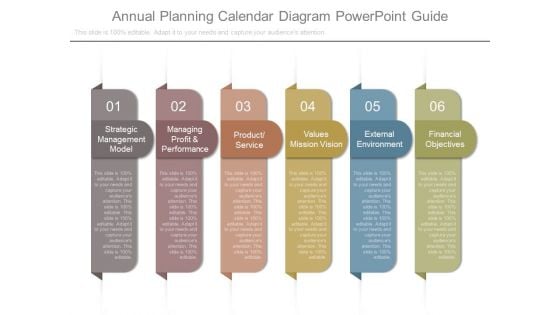
Annual Planning Calendar Diagram Powerpoint Guide
This is a annual planning calendar diagram powerpoint guide. This is a six stage process. The stages in this process are strategic management model, managing profit and performance, product service, values mission vision, external environment, financial objectives.
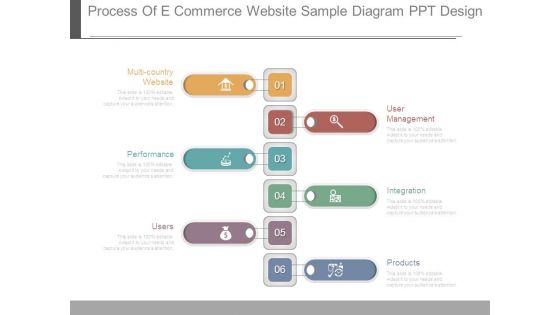
Process Of E Commerce Website Sample Diagram Ppt Design
This is a process of e commerce website sample diagram ppt design. This is a six stage process. The stages in this process are multi country website, performance, users, user management, integration, products.
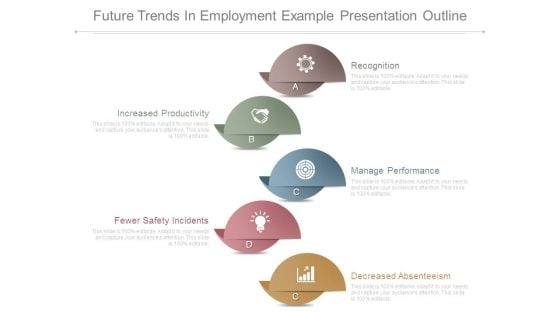
Future Trends In Employment Example Presentation Outline
This is a future trends in employment example presentation outline. This is a five stage process. The stages in this process are recognition, increased productivity, manage performance, decreased absenteeism, fewer safety incidents.
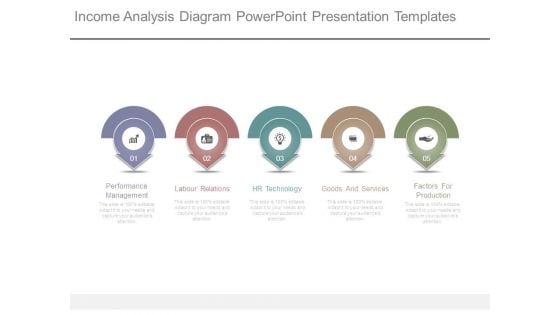
Income Analysis Diagram Powerpoint Presentation Templates
This is a income analysis diagram powerpoint presentation templates. This is a five stage process. The stages in this process are performance management, labour relations, hr technology, goods and services, factors for production.
Future Of Business Technology Template Ppt Icon
This is a future of business technology template ppt icon. This is a six stage process. The stages in this process are research, technologies, product performance, business process, creativity, analysis.
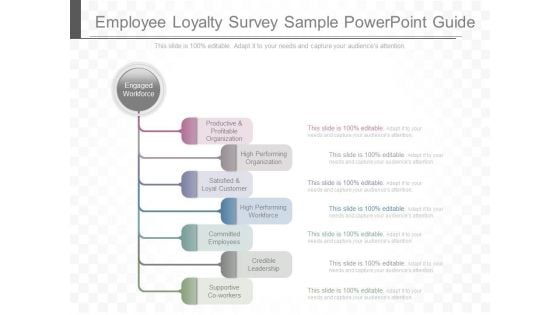
Employee Loyalty Survey Sample Powerpoint Guide
This is a employee loyalty survey sample powerpoint guide. This is a seven stage process. The stages in this process are engaged workforce, productive and profitable organization, high performing organization, satisfied and loyal customer, high performing workforce, committed employees, credible leadership, supportive co workers.
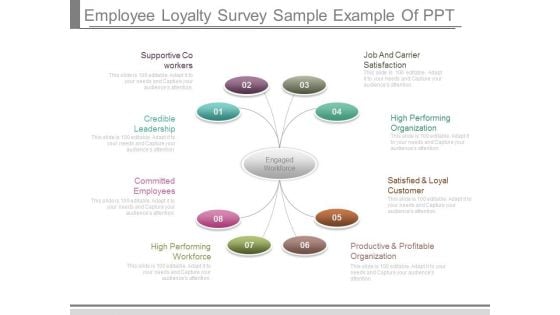
Employee Loyalty Survey Sample Example Of Ppt
This is a employee loyalty survey sample example of ppt. This is a eight stage process. The stages in this process are supportive co workers, credible leadership, committed employees, high performing workforce, productive and profitable organization, satisfied and loyal customer, high performing organization, job and carrier satisfaction, engaged workforce.
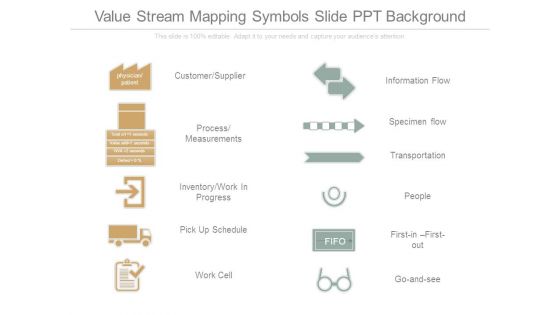
Value Stream Mapping Symbols Slide Ppt Background
This is a value stream mapping symbols slide ppt background. This is a eleven stage process. The stages in this process are customer supplier, process measurements, inventory work in progress, pick up schedule, work cell, information flow, specimen flow, transportation, people, first in first out, go and see.
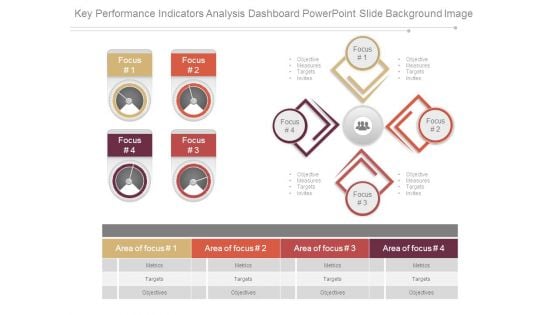
Key Performance Indicators Analysis Dashboard Powerpoint Slide Background Image
This is a key performance indicators analysis dashboard powerpoint slide background image. This is a four stage process. The stages in this process are focus, objective measures targets invites, area of focus, metrics, targets, objectives.
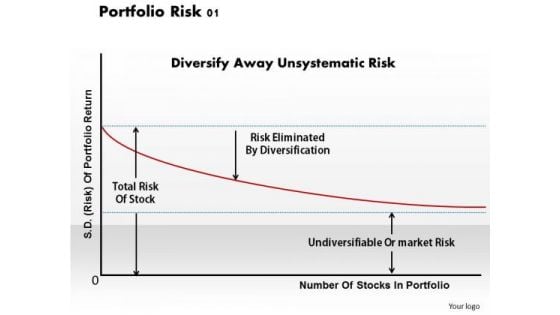
Business Framework Portfolio Risk 01 PowerPoint Presentation
This business framework image slide displays portfolio risk graph PowerPoint template. Use this image slide, in your presentations to depict portfolio risk measures like number of stocks and returns. Make your presentations outshine using this image slide.
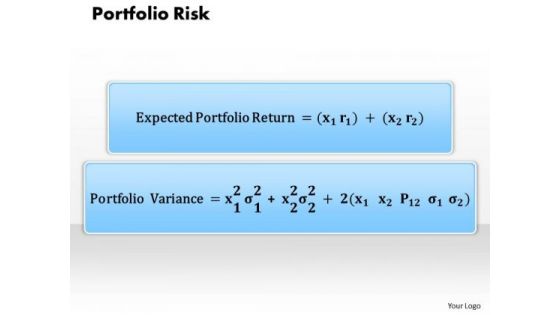
Business Framework Portfolio Risk 2 PowerPoint Presentation
This business framework image slide displays portfolio risk PowerPoint template. Use this image slide to depict portfolio risk measures like returns and variance of asset or unit in your presentations. Make your presentations outshine using this image slide.
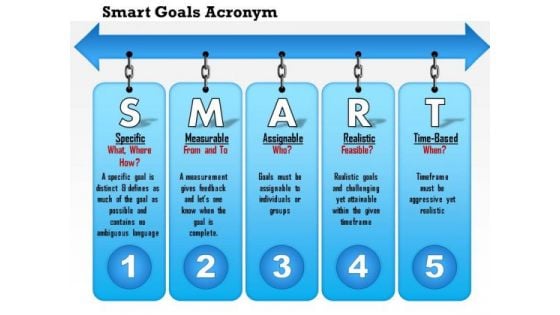
Business Diagram Smart Goals Acronym PowerPoint Ppt Presentation
This slide displays smart goals acronym. This diagram provides details explanation of smart goals. Smart goals are specific, measurable, assignable, and realistic and time based. This template helps you to grab the attention of your listener.
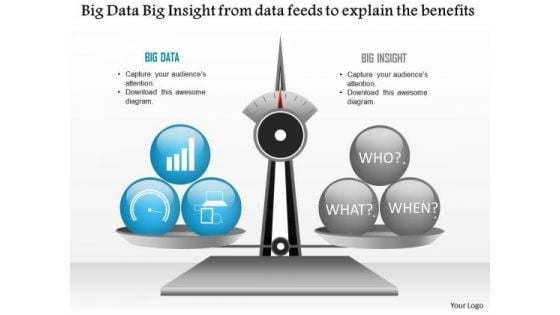
Business Diagram Big Data Big Insight From Data Feeds To Explain The Benefits Ppt Slide
Explain the benefits of big data analysis and data feeds with this technology diagram. This slide contains the graphic of scale with big data and big insight. Use this slide your data information and measurement related presentations.


 Continue with Email

 Home
Home


