Marketing Metrics
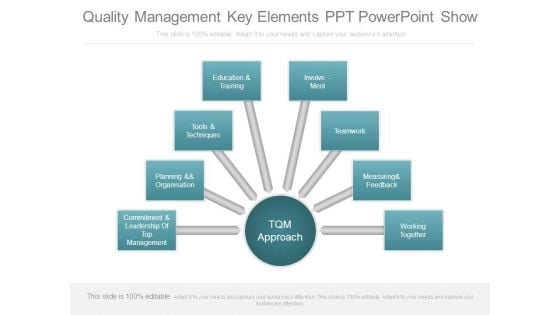
Quality Management Key Elements Ppt Powerpoint Show
This is a quality management key elements ppt powerpoint show. This is a eight stage process. The stages in this process are tqm approach, commitment and leadership of top management, planning and organisation, tools and techniques, education and training, involvement, teamwork, measuring and feedback, working together.
Working Capital Computation Icons Slide Growth Social Ppt PowerPoint Presentation Infographics Themes
Presenting this set of slides with name working capital computation icons slide growth social ppt powerpoint presentation infographics themes. The topics discussed in these slides are growth, measure, technology, business, management. This is a completely editable PowerPoint presentation and is available for immediate download. Download now and impress your audience.
Net Working Capital Analysis Icons Slide Technology Finance Ppt PowerPoint Presentation Diagram Images
Presenting this set of slides with name net working capital analysis icons slide technology finance ppt powerpoint presentation diagram images. The topics discussed in these slides are growth, measure, technology, business, management. This is a completely editable PowerPoint presentation and is available for immediate download. Download now and impress your audience.
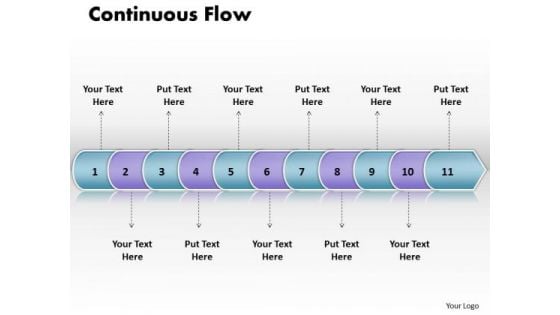
Ppt Linear Arrow 11 Stages PowerPoint Templates
PPT linear arrow 11 stages PowerPoint Templates-Use this PowerPoint diagram to define basic work and data flow and quality management processes to increase efficiency of your business.-PPT linear arrow 11 stages PowerPoint Templates-Arrow, Background, Collection, Completed, Concept, Confirmation, Design, Flow, Graph, Graphic, Illustration, Indication, Indicator, Information, Instruction, Interface, Internet, Layout, Measurement, Order, Phase, Pointer, Process, Progress, Reflection, Scale, Shape, Sign Use our Ppt Linear Arrow 11 Stages PowerPoint Templates and be carefree. They will bear the brunt for you.
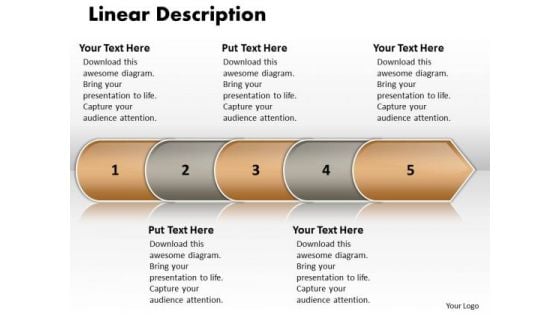
Ppt Linear Arrow 5 Stages PowerPoint Templates
PPT linear arrow 5 stages PowerPoint Templates-This linear arrow process diagram is a graphic representation of all the major steps of a process.-PPT linear arrow 5 stages PowerPoint Templates-Arrow, Background, Collection, Completed, Concept, Confirmation, Design, Flow, Graph, Graphic, Illustration, Indication, Indicator, Information, Instruction, Interface, Internet, Layout, Measurement, Order, Phase, Pointer, Process, Progress, Reflection, Scale, Shape, Sign Encourage teams with our Ppt Linear Arrow 5 Stages PowerPoint Templates. Download without worries with our money back guaranteee.
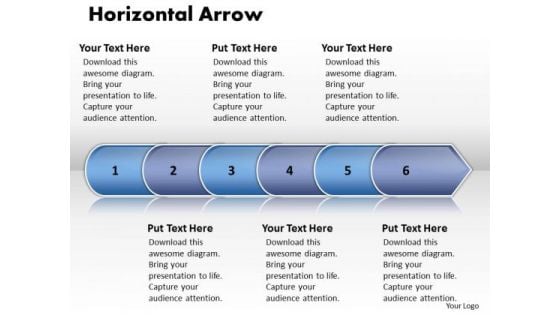
Ppt Linear Arrow 6 Stages PowerPoint Templates
PPT linear arrow 6 stages PowerPoint Templates-This linear arrow process diagram is a graphic representation of all the major steps of a process.-PPT linear arrow 6 stages PowerPoint Templates-Arrow, Background, Collection, Completed, Concept, Confirmation, Design, Flow, Graph, Graphic, Illustration, Indication, Indicator, Information, Instruction, Interface, Internet, Layout, Measurement, Order, Phase, Pointer, Process, Progress, Reflection, Scale, Shape, Sign Boost your chances with our Ppt Linear Arrow 6 Stages PowerPoint Templates. They will help further your plans.
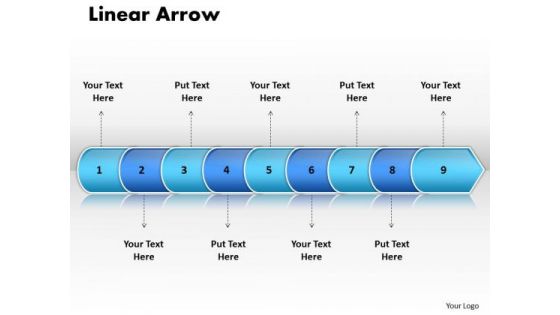
Ppt Linear Arrow 9 State Diagram PowerPoint Templates
PPT linear arrow 9 state diagram PowerPoint Templates-Use this PowerPoint diagram to define basic work and data flow and quality management processes to increase efficiency of your business.-PPT linear arrow 9 state diagram PowerPoint Templates-Arrow, Background, Collection, Completed, Concept, Confirmation, Design, Flow, Graph, Graphic, Illustration, Indication, Indicator, Information, Instruction, Interface, Internet, Layout, Measurement, Order, Phase, Pointer, Process, Progress, Reflection, Scale, Shape, Sign Fill out your thoughts with our Ppt Linear Arrow 9 State Diagram PowerPoint Templates. They will get bigger and better.
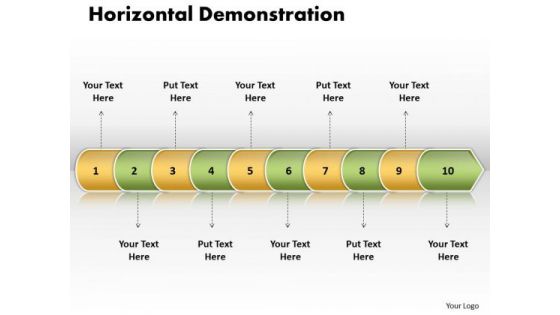
Ppt Linear Arrow 10 Phase Diagram PowerPoint Templates
PPT linear arrow 10 phase diagram PowerPoint Templates-Use this PowerPoint diagram to define basic work and data flow and quality management processes to increase efficiency of your business.-PPT linear arrow 10 phase diagram PowerPoint Templates-Arrow, Background, Collection, Completed, Concept, Confirmation, Design, Flow, Graph, Graphic, Illustration, Indication, Indicator, Information, Instruction, Interface, Internet, Layout, Measurement, Order, Phase, Pointer, Process, Progress, Reflection, Scale, Shape, Sign Start a company with our Ppt Linear Arrow 10 Phase Diagram PowerPoint Templates. Just download, type and present.

Give The Wishes Of 2013 PowerPoint Templates Ppt Backgrounds For Slides 0513
Highlight your drive with our Give The Wishes Of 2013 PowerPoint Templates PPT Backgrounds For Slides. Prove the fact that you have control. Go the distance with our New year PowerPoint Templates. Maintain the pace till the end. Draw on the energy of our Holidays PowerPoint Templates. Your thoughts will perk up. Measure your team's success with our Give The Wishes Of 2013 PowerPoint Templates Ppt Backgrounds For Slides 0513. You will be at the top of your game.

Beautiful Play And Slide Area For Kids PowerPoint Templates Ppt Backgrounds For Slides 0713
Your ideas will do the trick. Wave the wand with our Beautiful Play And Slide Area For Kids PowerPoint Templates PPT Backgrounds For Slides. Our Business PowerPoint Templates team are a dogged lot. They keep at it till they get it right. Dole it out with our Success PowerPoint Templates. Your thoughts will get the right proportions. Measure success with our Beautiful Play And Slide Area For Kids PowerPoint Templates Ppt Backgrounds For Slides 0713. Download without worries with our money back guaranteee.
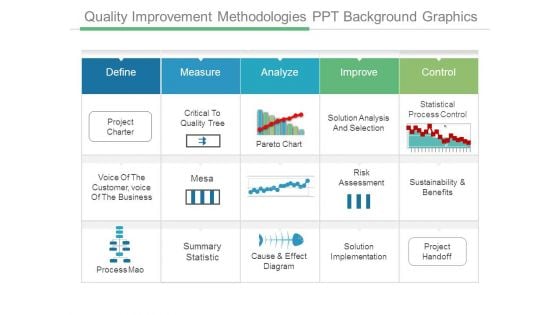
Quality Improvement Methodologies Ppt Background Graphics
This is a quality improvement methodologies ppt background graphics. This is a five stage process. The stages in this process are define, measure, analyze, improve, control, project charter, critical to quality tree, pareto chart, solution analysis and selection, statistical process control, voice of the customer, voice of the business, mesa, risk assessment, sustainability and benefits, process mao, summary statistic, cause and effect diagram, solution implementation, project handoff.
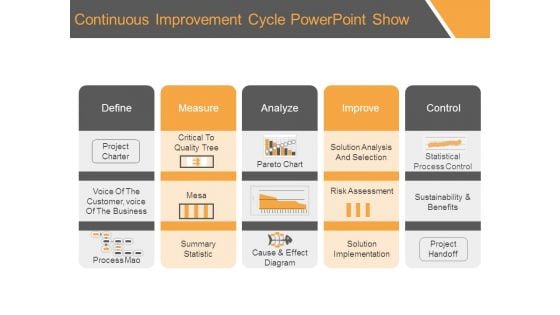
Continuous Improvement Cycle Powerpoint Show
This is a continuous improvement cycle powerpoint show. This is a five stage process. The stages in this process are define, measure, analyze, improve, control, project charter, critical to quality tree, pareto chart, solution analysis and selection, statistical process control, voice of the customer voice of the business, mesa, risk assessment, sustainability and benefits, process mao, summary statistic, cause and effect diagram, solution implementation, project handoff.
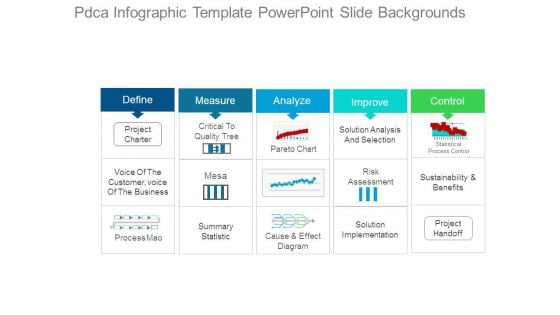
Pdca Infographic Template Powerpoint Slide Backgrounds
This is a pdca infographic template powerpoint slide backgrounds. This is a five stage process. The stages in this process are define, measure, analyze, improve, control, project charter, critical to quality tree, pareto chart, solution analysis and selection, statistical process control, voice of the customer voice of the business, mesa, risk assessment, sustainability and benefits, process mao, summary statistic, cause and effect diagram, solution implementation, project handoff.
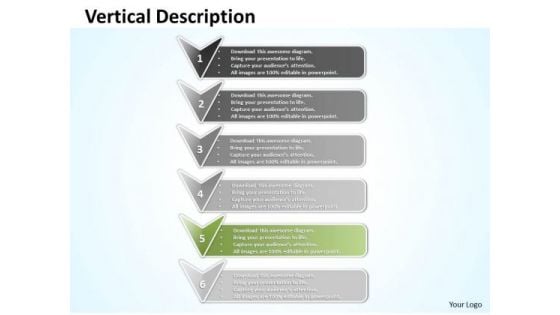
Ppt Erectile Illustration Using Bullet Points PowerPoint Templates
PPT erectile illustration using bullet points PowerPoint Templates-Use this 3d Arrow PPT slide to show the sequence of events in a story or describe the steps to be taken in a process. This Diagram can present a simple, high-level view of the operations that a system performs, in the order in which they are performed, or a more detailed view.-PPT erectile illustration using bullet points PowerPoint Templates-abstract, background, banner, blue, brochure, card, choice, circle, compare, content, corporate, creative, description, design, green, icon, illustration, label, layout, modern, number, one, option, pointer, product, special, step, symbol, template, trendy, vector, version, vertical, web, webdesign, website Load your gun with our Ppt Erectile Illustration Using Bullet Points PowerPoint Templates. You will come out on top.
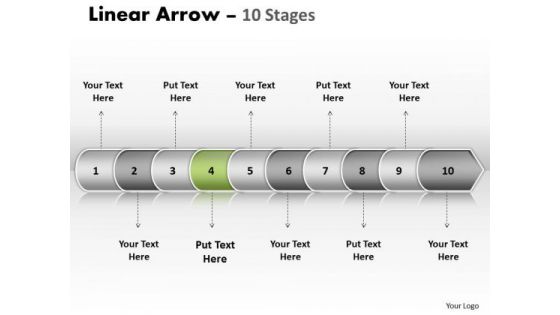
Usa Ppt Background Linear Arrow 10 State PowerPoint Project Diagram 5 Image
USA PPT Background linear arrow 10 state powerpoint project diagram 5 Image-Use this diagram to emphasize the process of your corporate growth. Highlight your ideas broad- based on strong fundamentals and illustrate how they step by step achieve the set growth factor.-USA PPT Background linear arrow 10 state powerpoint project diagram 5 Image-Arrow, Background, Collection, Completed, Concept, Confirmation, Design, Flow, Graph, Graphic, Illustration, Indication, Indicator, Information, Instruction, Interface, Internet, Layout, Measurement, Order, Phase, Pointer, Process, Progress, Reflection, Scale, Shape, Sign When in doubt fall back on our Usa Ppt Background Linear Arrow 10 State PowerPoint Project Diagram 5 Image. All your apprehensions will fall away.
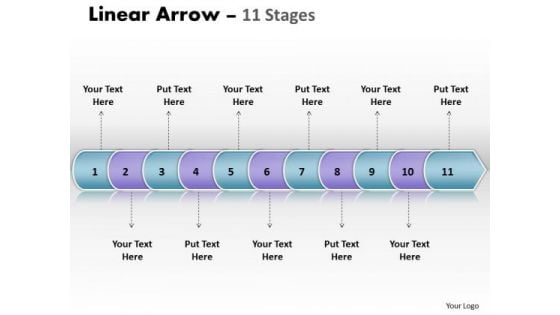
Usa Ppt Linear Arrow 11 Phase Diagram Business Management PowerPoint Image
USA PPT linear arrow 11 phase diagram business management powerpoint Image-This Linear Diagram is simple but nice enough to illustrate your thoughts and experiences to your staff. Explain in detail you assessment of the need for care to ensure continued smooth progress.-USA PPT linear arrow 11 phase diagram business management powerpoint Image-Arrow, Background, Collection, Completed, Concept, Confirmation, Design, Flow, Graph, Graphic, Illustration, Indication, Indicator, Information, Instruction, Interface, Internet, Layout, Measurement, Order, Phase, Pointer, Process, Progress, Reflection, Scale, Shape, Sign Deliberate on the evidence with our Usa Ppt Linear Arrow 11 Phase Diagram Business Management PowerPoint Image. Draw conclusions from the bare facts.
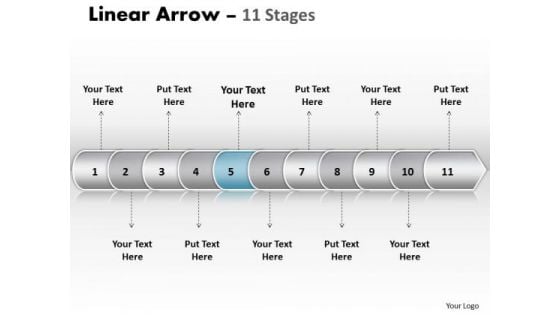
Usa Ppt Template Linear Arrow 11 Phase Diagram Time Management PowerPoint 6 Design
USA PPT template linear arrow 11 phase diagram time management powerpoint 6 design-This linear arrow chart makes information accessible throughout the organization with a collective, visible view of critical data from different perspectives and providing the tools to upcoming business scenarios and plan for change.-USA PPT template linear arrow 11 phase diagram time management powerpoint 6 design-Arrow, Background, Collection, Completed, Concept, Confirmation, Design, Flow, Graph, Graphic, Illustration, Indication, Indicator, Information, Instruction, Interface, Internet, Layout, Measurement, Order, Phase, Pointer, Process, Progress, Reflection, Scale, Shape, Sign Integrate teams with our Usa Ppt Template Linear Arrow 11 Phase Diagram Time Management PowerPoint 6 Design. Download without worries with our money back guaranteee.
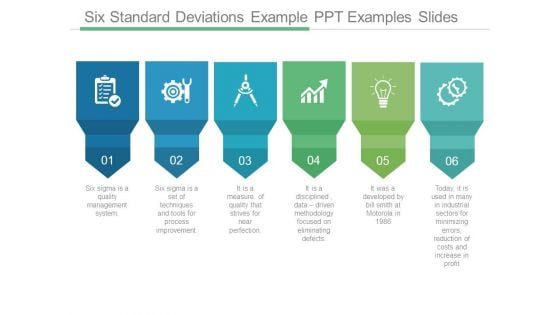
Six Standard Deviations Example Ppt Examples Slides
This is a six standard deviations example ppt examples slides. This is a six stage process. The stages in this process are six sigma is a quality management system, six sigma is a set of techniques and tools for process improvement, it is a measure of quality that strives for near perfection, it is a disciplined data driven methodology focused on eliminating defects, it was a developed by bill smith at motorola in 1986, today it is used in many in industrial sectors for minimizing errors reduction of costs and increase in profit.
Process Of Six Sigma Powerpoint Slide Deck Samples
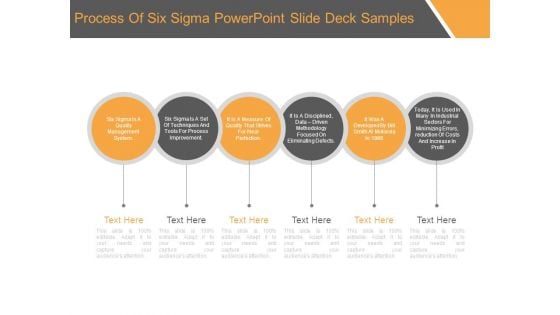
This is a process of six sigma powerpoint slide deck samples. This is a six stage process. The stages in this process are six sigma is a quality management system, six sigma is a set of techniques and tools for process improvement, it is a measure of quality that strives for near perfection, it is a disciplined, data driven methodology focused on eliminating defects, it was a developed by bill smith at motorola in 1986, today, it is used in many in industrial sectors for minimizing errors, reduction of costs and increase in profit.
Six Sigma Infographic Layout Presentation Visuals
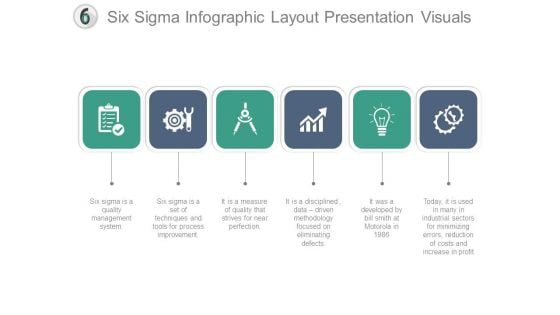
This is a six sigma infographic layout presentation visuals. This is a six stage process. The stages in this process are six sigma is a quality management system, six sigma is a set of techniques and tools for process improvement, it is a measure of quality that strives for near perfection, it is a disciplined, data driven methodology focused on eliminating defects, it was a developed by bill smith at motorola in 1986, today, it is used in many in industrial sectors for minimizing errors, reduction of costs and increase in profit.
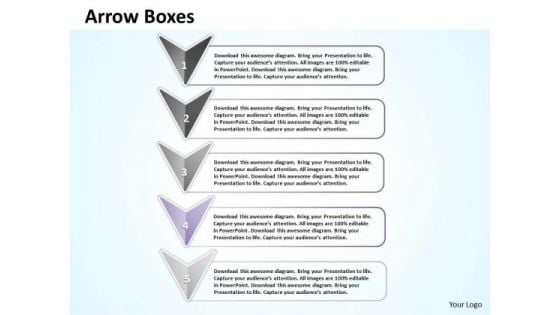
Ppt Fourth Stage Description Using PowerPoint Graphics Arrows Templates
PPT fourth stage description using powerpoint graphics arrows Templates-A management technique that scrutinizes the processes that a company goes through to perform certain tasks. The intention is to create a more efficient way of working, thereby saving time and money. This image represents the concept of Defining five different points of view on the same topic using Arrows. Deliver amazing presentations to mesmerize your audience using this Diagram.-PPT fourth stage description using powerpoint graphics arrows Templates-arrow, background, banner, bar, blank, box, bubble, business, colorful, communication, cubes, curve, decorative, design, glowing, graphic, icon, label, message, number, pattern, product, sale, shape, shiny, sign, sticker, symbol, tag, template, text, title, vector, web Get ambitions burning with your thoughts. Fan the flames with our Ppt Fourth Stage Description Using PowerPoint Graphics Arrows Templates.
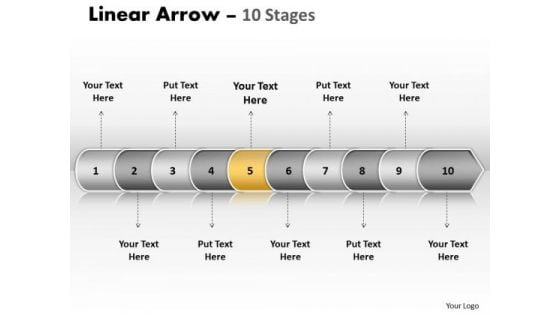
Usa Ppt Background Linear Arrow 10 State PowerPoint Project Diagram 6 Image
USA PPT Background linear arrow 10 state powerpoint project diagram 6 Image-Use this diagram to display your ideas and highlight their ability to accelerate the growth of your company and you. Impress upon the audience how your strategy will carry all to the top of the corporate heap.-USA PPT Background linear arrow 10 state powerpoint project diagram 6 Image-Arrow, Background, Collection, Completed, Concept, Confirmation, Design, Flow, Graph, Graphic, Illustration, Indication, Indicator, Information, Instruction, Interface, Internet, Layout, Measurement, Order, Phase, Pointer, Process, Progress, Reflection, Scale, Shape, Sign Our Usa Ppt Background Linear Arrow 10 State PowerPoint Project Diagram 6 Image will go on till blue in the face. They will keep at it till you achieve your aim.
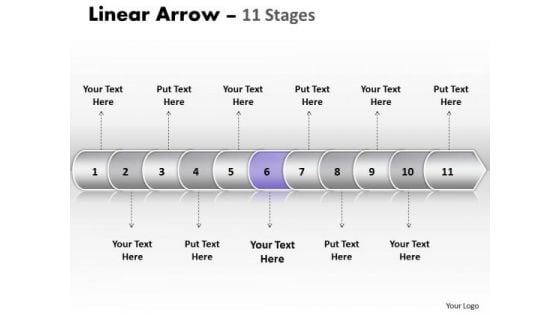
Usa Ppt Template Linear Arrow 11 Phase Diagram Time Management PowerPoint 7 Design
USA PPT template linear arrow 11 phase diagram time management powerpoint 7 design-This diagram is capable of conveying the important characteristics more plainly than what words are capable of doing. Feel the buzz as they comprehend your plan to get the entire act together.-USA PPT template linear arrow 11 phase diagram time management powerpoint 7 design-Arrow, Background, Collection, Completed, Concept, Confirmation, Design, Flow, Graph, Graphic, Illustration, Indication, Indicator, Information, Instruction, Interface, Internet, Layout, Measurement, Order, Phase, Pointer, Process, Progress, Reflection, Scale, Shape, Sign The impact of your ideas will take time to fade. The images of our Usa Ppt Template Linear Arrow 11 Phase Diagram Time Management PowerPoint 7 Design will help their recall.
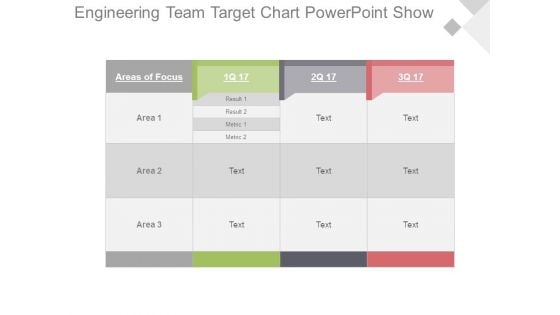
Engineering Team Target Chart Powerpoint Show
This is a engineering team target chart powerpoint show. This is a four stage process. The stages in this process are areas of focus, result, metric, area.
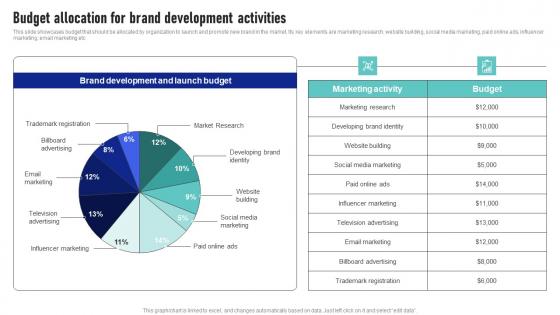
Budget Allocation For Brand Development Activities Launching New Product Brand Microsoft Pdf
This slide showcases budget that should be allocated by organization to launch and promote new brand in the market. Its key elements are marketing research, website building, social media marketing, paid online ads, influencer marketing, email marketing etc From laying roadmaps to briefing everything in detail, our templates are perfect for you. You can set the stage with your presentation slides. All you have to do is download these easy-to-edit and customizable templates. Budget Allocation For Brand Development Activities Launching New Product Brand Microsoft Pdf will help you deliver an outstanding performance that everyone would remember and praise you for. Do download this presentation today. This slide showcases budget that should be allocated by organization to launch and promote new brand in the market. Its key elements are marketing research, website building, social media marketing, paid online ads, influencer marketing, email marketing etc
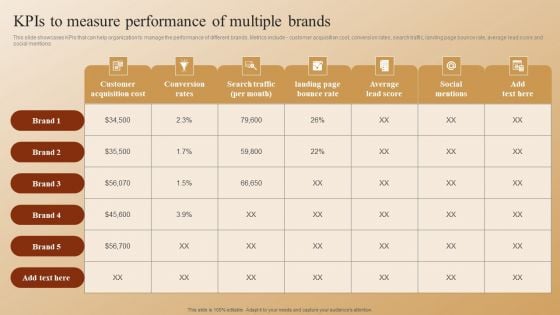
Establishing A Brand Identity For Organizations With Several Brands Kpis To Measure Performance Of Multiple Brands Demonstration PDF
This slide showcases KPIs that can help organization to manage the performance of different brands. Metrics include - customer acquisition cost, conversion rates, search traffic, landing page bounce rate, average lead score and social mentions. Presenting this PowerPoint presentation, titled Establishing A Brand Identity For Organizations With Several Brands Kpis To Measure Performance Of Multiple Brands Demonstration PDF, with topics curated by our researchers after extensive research. This editable presentation is available for immediate download and provides attractive features when used. Download now and captivate your audience. Presenting this Establishing A Brand Identity For Organizations With Several Brands Kpis To Measure Performance Of Multiple Brands Demonstration PDF. Our researchers have carefully researched and created these slides with all aspects taken into consideration. This is a completely customizable Establishing A Brand Identity For Organizations With Several Brands Kpis To Measure Performance Of Multiple Brands Demonstration PDF that is available for immediate downloading. Download now and make an impact on your audience. Highlight the attractive features available with our PPTs.
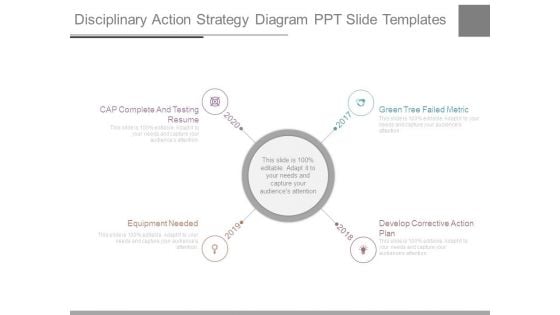
Disciplinary Action Strategy Diagram Ppt Slide Templates
This is a disciplinary action strategy diagram ppt slide templates. This is a four stage process. The stages in this process are cap complete and testing resume, equipment needed, green tree failed metric, develop corrective action plan.
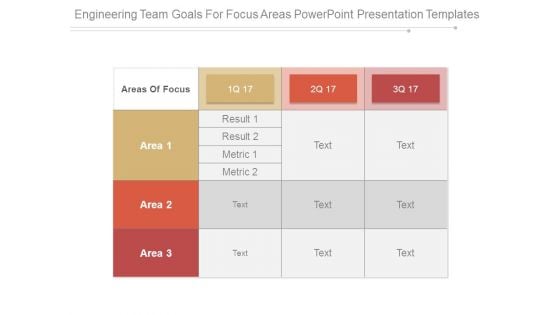
Engineering Team Goals For Focus Areas Powerpoint Presentation Templates
This is a engineering team goals for focus areas powerpoint presentation templates. This is a three stage process. The stages in this process are areas of focus, area, result, metric.
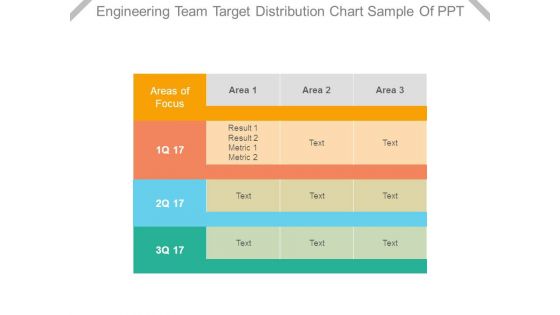
Engineering Team Target Distribution Chart Sample Of Ppt
This is a engineering team target distribution chart sample of ppt. This is a three stage process. The stages in this process are areas of focus, area, result, metric.
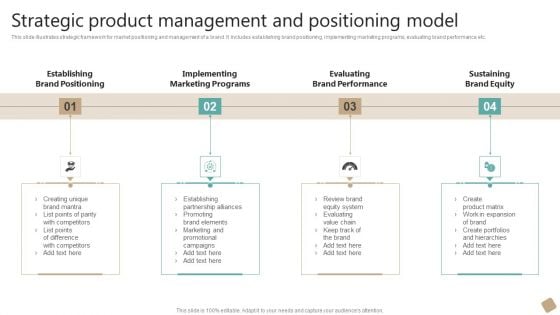
Strategic Product Management And Positioning Model Professional PDF
This slide illustrates strategic framework for market positioning and management of a brand. It includes establishing brand positioning, implementing marketing programs, evaluating brand performance etc. Presenting Strategic Product Management And Positioning Model Professional PDF to dispense important information. This template comprises four stages. It also presents valuable insights into the topics including Implementing Marketing Programs, Evaluating Brand Performance, Sustaining Brand Equity. This is a completely customizable PowerPoint theme that can be put to use immediately. So, download it and address the topic impactfully.
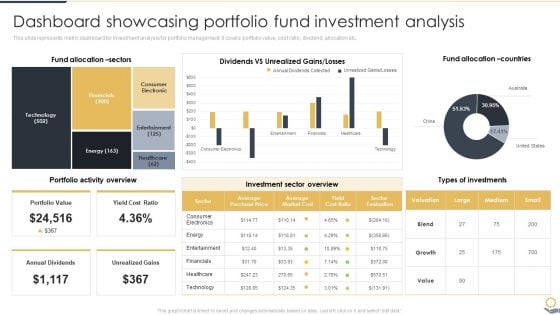
Dashboard Showcasing Portfolio Fund Investment Analysis Portfolio Investment Analysis Designs PDF
This slide represents metric dashboard for investment analysis for portfolio management. It covers portfolio value, cost ratio, dividend, allocation etc.Slidegeeks is one of the best resources for PowerPoint templates. You can download easily and regulate Dashboard Showcasing Portfolio Fund Investment Analysis Portfolio Investment Analysis Designs PDF for your personal presentations from our wonderful collection. A few clicks is all it takes to discover and get the most relevant and appropriate templates. Use our Templates to add a unique zing and appeal to your presentation and meetings. All the slides are easy to edit and you can use them even for advertisement purposes.
E Commerce Operations In B2b B2b Sales Performance Tracking Dashboard Icons PDF
This slide represents metric dashboard to track sales performance on e-commerce website. It cover performance indicators such as sales breakdown, order breakdown, recurring sales etc. Slidegeeks is one of the best resources for PowerPoint templates. You can download easily and regulate E Commerce Operations In B2b B2b Sales Performance Tracking Dashboard Icons PDF for your personal presentations from our wonderful collection. A few clicks is all it takes to discover and get the most relevant and appropriate templates. Use our Templates to add a unique zing and appeal to your presentation and meetings. All the slides are easy to edit and you can use them even for advertisement purposes.
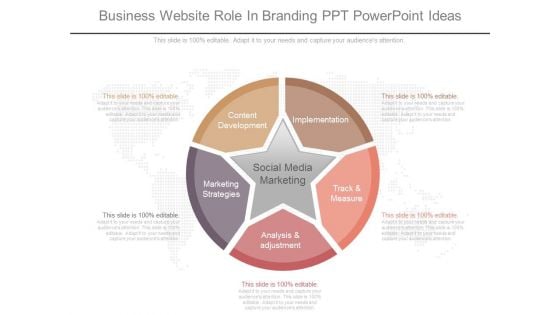
Business Website Role In Branding Ppt Powerpoint Ideas
This is a business website role in branding ppt powerpoint ideas. This is a five stage process. The stages in this process are content development, marketing strategies, analysis and adjustment, track and measure, implementation, social media marketing.
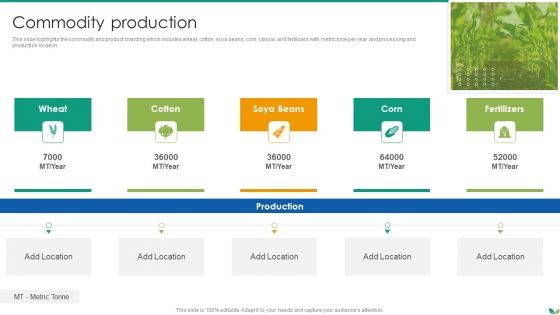
Agricultural Business Company Profile Commodity Production Introduction PDF
This slide highlights the commodity and product branding which includes wheat, cotton, soya beans, corn, canola, and fertilizers with metric tone per year and processing and production location.Presenting Agricultural Business Company Profile Commodity Production Introduction PDF to provide visual cues and insights. Share and navigate important information on five stages that need your due attention. This template can be used to pitch topics like Commodity Production In addtion, this PPT design contains high resolution images, graphics, etc, that are easily editable and available for immediate download.
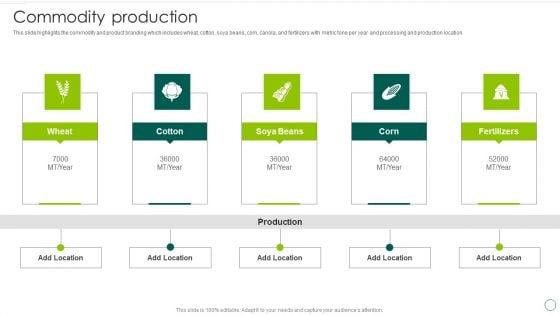
Food And Agro Company Outline Commodity Production Ppt Portfolio Shapes PDF
This slide highlights the commodity and product branding which includes wheat, cotton, soya beans, corn, canola, and fertilizers with metric tone per year and processing and production location. Presenting Food And Agro Company Outline Commodity Production Ppt Portfolio Shapes PDF to provide visual cues and insights. Share and navigate important information on five stages that need your due attention. This template can be used to pitch topics like Wheat, Cotton, Soya Beans, Corn, Fertilizers. In addtion, this PPT design contains high resolution images, graphics, etc, that are easily editable and available for immediate download.
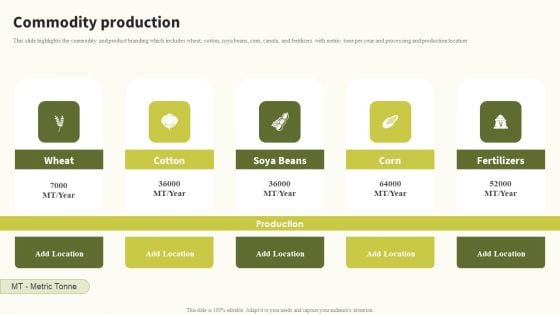
Commodity Production Global Food Products Company Profile Demonstration PDF
This slide highlights the commodity and product branding which includes wheat, cotton, soya beans, corn, canola, and fertilizers with metric tone per year and processing and production location.Welcome to our selection of the Commodity Production Global Food Products Company Profile Demonstration PDF. These are designed to help you showcase your creativity and bring your sphere to life. Planning and Innovation are essential for any business that is just starting out. This collection contains the designs that you need for your everyday presentations. All of our PowerPoints are 100precent editable, so you can customize them to suit your needs. This multi-purpose template can be used in various situations. Grab these presentation templates today.
Business To Business Digital Channel Management B2B Sales Performance Tracking Dashboard Template PDF
This slide represents metric dashboard to track sales performance on e-commerce website. It cover performance indicators such as sales breakdown, order breakdown, recurring sales etc. Take your projects to the next level with our ultimate collection of Business To Business Digital Channel Management B2B Sales Performance Tracking Dashboard Template PDF. Slidegeeks has designed a range of layouts that are perfect for representing task or activity duration, keeping track of all your deadlines at a glance. Tailor these designs to your exact needs and give them a truly corporate look with your own brand colors they will make your projects stand out from the rest.
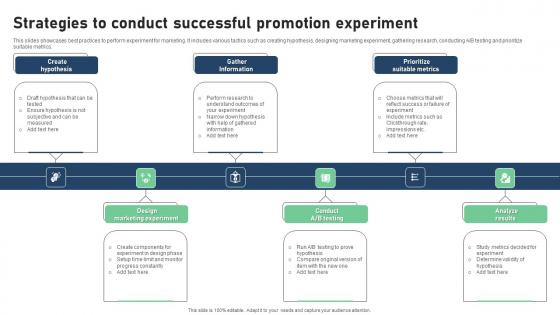
Strategies To Conduct Successful Promotion Experiment Themes Pdf
This slides showcases best practices to perform experiment for marketing. It includes various tactics such as creating hypothesis, designing marketing experiment, gathering research, conducting A or B testing and prioritize suitable metrics. Showcasing this set of slides titled Strategies To Conduct Successful Promotion Experiment Themes Pdf. The topics addressed in these templates are Prioritize Suitable Metrics, Strategies, Promotion Experiment. All the content presented in this PPT design is completely editable. Download it and make adjustments in color, background, font etc. as per your unique business setting. This slides showcases best practices to perform experiment for marketing. It includes various tactics such as creating hypothesis, designing marketing experiment, gathering research, conducting A or B testing and prioritize suitable metrics.
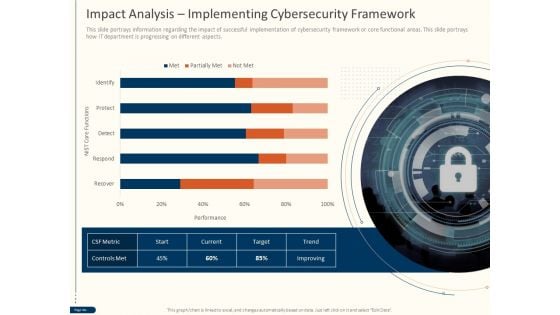
Cyber Security For Your Organization Impact Analysis Implementing Cybersecurity Framework Ppt Model Background PDF
Presenting this set of slides with name cyber security for your organization impact analysis implementing cybersecurity framework ppt model background pdf. This is a one stage process. The stages in this process are csf metric, controls met, trend, target, current, state, performance . This is a completely editable PowerPoint presentation and is available for immediate download. Download now and impress your audience.

Strategies To Mitigate Cyber Security Risks Impact Analysis Implementing Cybersecurity Framework Mockup PDF
Presenting this set of slides with name strategies to mitigate cyber security risks impact analysis implementing cybersecurity framework mockup pdf. This is a one stage process. The stages in this process are controls met, csf metric, recover, respond, detect, protect, identify. This is a completely editable PowerPoint presentation and is available for immediate download. Download now and impress your audience.
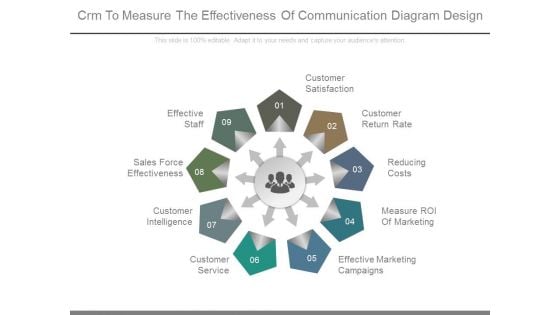
Crm To Measure The Effectiveness Of Communication Diagram Design
This is a crm to measure the effectiveness of communication diagram design. This is a nine stage process. The stages in this process are customer satisfaction, customer return rate, reducing costs, measure roi of marketing, effective marketing campaigns, customer service, customer intelligence, sales force effectiveness, effective staff.
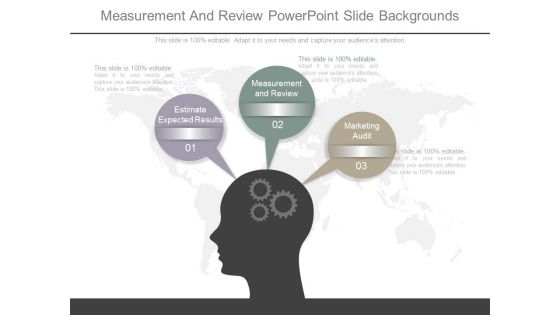
Measurement And Review Powerpoint Slide Backgrounds
This is a measurement and review powerpoint slide backgrounds. This is a three stage process. The stages in this process are estimate expected results, measurement and review, marketing audit.
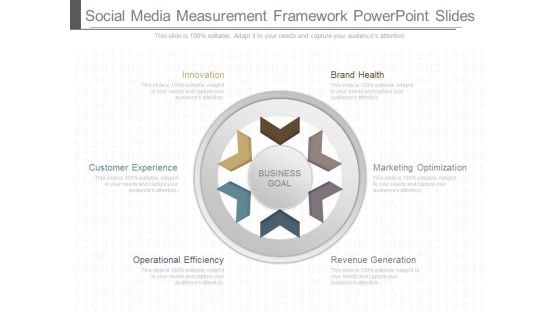
Social Media Measurement Framework Powerpoint Slides
This is a social media measurement framework powerpoint slides. This is a six stage process. The stages in this process are innovation, brand health, customer experience, marketing optimization, business goal, revenue generation.\n\n\n\n\n\n
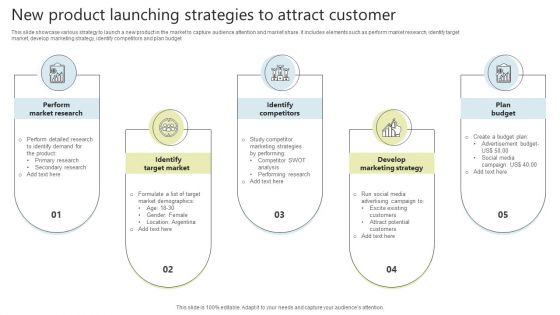
New Product Launching Strategies To Attract Customer Inspiration PDF
This slide showcase various strategy to launch a new product in the market to capture audience attention and market share. It includes elements such as perform market research, identify target market, develop marketing strategy, identify competitors and plan budget. Presenting New Product Launching Strategies To Attract Customer Inspiration PDF to dispense important information. This template comprises five stages. It also presents valuable insights into the topics including Perform Market Research, Identify Target Market, Identify Competitors . This is a completely customizable PowerPoint theme that can be put to use immediately. So, download it and address the topic impactfully.
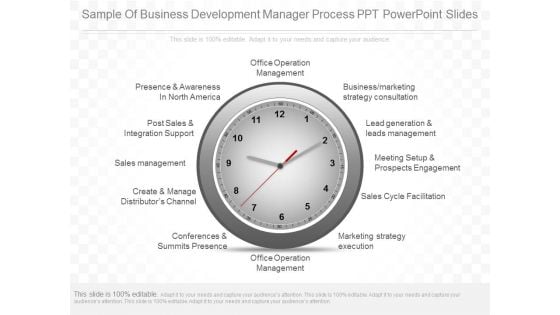
Sample Of Business Development Manager Process Ppt Powerpoint Slides
This is a sample of business development manager process ppt powerpoint slides. This is a one stage process. The stages in this process are presence and awareness in north america, post sales and integration support, sales management, create and manage distributor channel, conferences and summits presence, office operation management, marketing strategy execution, sales cycle facilitation, meeting setup and prospects engagement, lead generation and leads management, business marketing strategy consultation, office operation management.
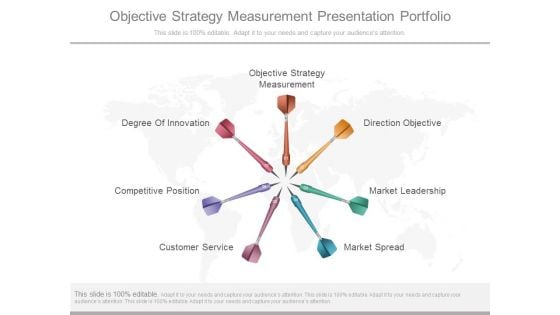
Objective Strategy Measurement Presentation Portfolio
This is a objective strategy measurement presentation portfolio. This is a seven stage process. The stages in this process are objective strategy measurement, direction objective, market leadership, market spread, customer service, competitive position, degree of innovation.
Sales Performance Analysis Diagram Ppt Icon
This is a sales performance analysis diagram ppt icon. This is a eight stage process. The stages in this process are incentive packages, sales process, personnel factors, management support, competitor activities, price structure, marketing position, product and quality.
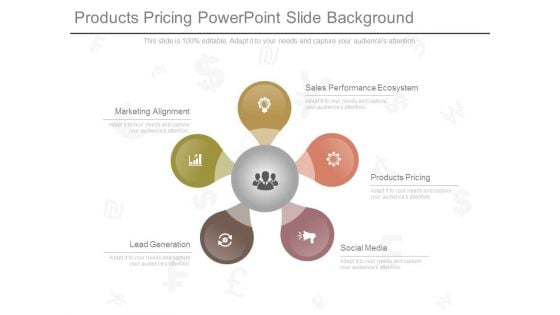
Products Pricing Powerpoint Slide Background
This is a products pricing powerpoint slide background. This is a five stage process. The stages in this process are marketing alignment, sales performance ecosystem, products pricing, social media, lead generation.

Sample Of Measurement Of Process For Roi Enhancement Ppt Summary
This is a sample of measurement of process for roi enhancement ppt summary. This is a seven stage process. The stages in this process are analyze market, review and revise, understand client, define marketing mix, research distribution, analyze competition, financial analysis.
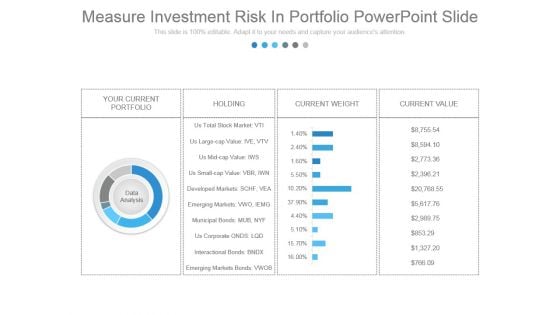
Measure Investment Risk In Portfolio Powerpoint Slide
This is a measure investment risk in portfolio powerpoint slide. This is a four stage process. The stages in this process are your current portfolio, holding, current weight, current value, data analysis, us total stock market vti, us large cap value ive vtv, us mid cap value iws, us small cap value vbr iwn, developed markets schf, vea, emerging markets vwo, iemg, municipal bonds mub, nyf, us corporate onds lqd, interactional bonds bndx, emerging markets bonds vwob.
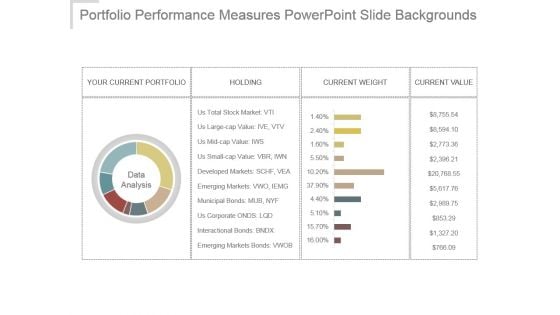
Portfolio Performance Measures Powerpoint Slide Backgrounds
This is a portfolio performance measures powerpoint slide backgrounds. This is a seven stage process. The stages in this process are your current portfolio, holding, current weight, current value, data analysis, us total stock market vti, us large cap value ive vtv, us mid cap value iws, us small cap value vbr iwn, developed markets schf vea, emerging markets vwo iemg, municipal bonds mub nyf, us corporate onds lqd, interactional bonds bndx, emerging markets bonds vwob.
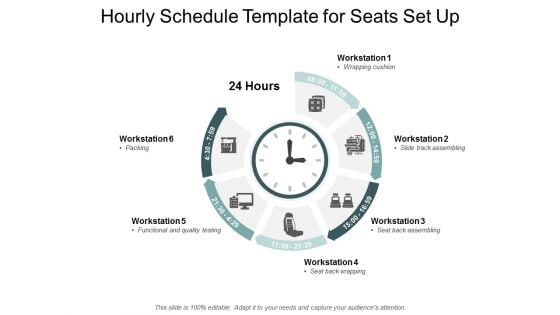
Hourly Schedule Template For Seats Set Up Ppt PowerPoint Presentation Infographic Template Infographic Template
Presenting this set of slides with name hourly schedule template for seats set up ppt powerpoint presentation infographic template infographic template. This is a six stage process. The stages in this process are 24 hour timeline, digital marketing plan, business management. This is a completely editable PowerPoint presentation and is available for immediate download. Download now and impress your audience.
Supplier Scorecard Kpis Ppt PowerPoint Presentation Professional Slide Cpb
Presenting this set of slides with name supplier scorecard kpis ppt powerpoint presentation professional slide cpb. This is an editable Powerpoint three stages graphic that deals with topics like supplier scorecard kpis to help convey your message better graphically. This product is a premium product available for immediate download and is 100 percent editable in Powerpoint. Download this now and use it in your presentations to impress your audience.
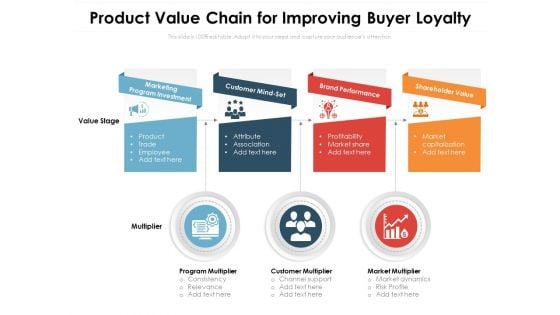
Product Value Chain For Improving Buyer Loyalty Ppt PowerPoint Presentation Portfolio Demonstration PDF
Presenting this set of slides with name product value chain for improving buyer loyalty ppt powerpoint presentation portfolio demonstration pdf. This is a three stage process. The stages in this process are marketing program investment, customer mind set, brand performance, shareholder value, program multiplier, customer multiplier, market multiplier. This is a completely editable PowerPoint presentation and is available for immediate download. Download now and impress your audience.
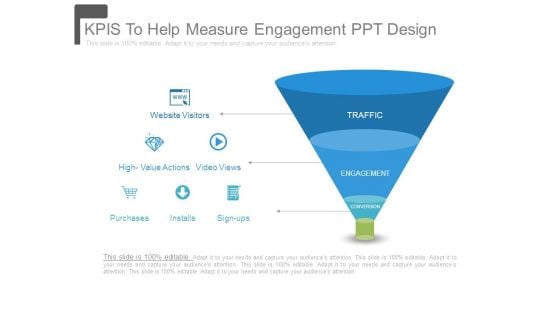
Kpis To Help Measure Engagement Ppt Design
This is a kpis to help measure engagement ppt design. This is a three stage process. The stages in this process are traffic, engagement, conversion, website visitors, high value actions, video views, purchases, installs, sign ups.

New Product Process Development Ppt Samples
This is a new product process development ppt samples. This is a eight stage process. The stages in this process are idea generation, idea screening, concept testing, business analysis, product development, test marketing, commercialization, review of market performance.
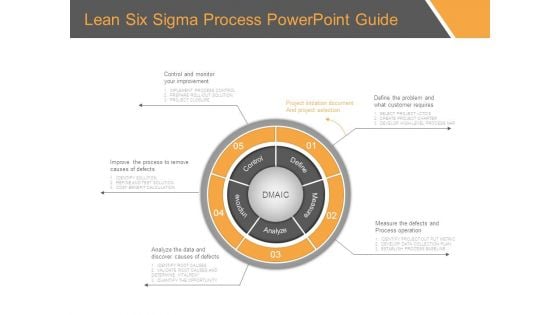
Lean Six Sigma Process Powerpoint Guide
This is a lean six sigma process powerpoint guide. This is a five stage process. The stages in this process are control, improve, analyze, measure, define, control and monitor your improvement, project initiation document and project selection, define the problem and what customer requires, improve the process to remove causes of defects, analyze the data and discover causes of defects, measure the defects and process operation, implement process control, prepare roll out solution, project closure, select project ctos, create project charter, develop high level process map, identify solution, refine and test solution, cost benefit calculation, identify root causes, validate root causes and determine vitalfew, quantify the opportunity, identify project out put metric, develop data collection plan, establish process baseline.
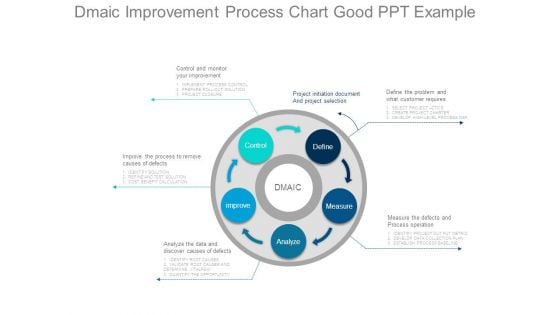
Dmaic Improvement Process Chart Good Ppt Example
This is a dmaic improvement process chart good ppt example. This is a five stage process. The stages in this process are dmaic, control, improve, analyze, measure, define, control and monitor your improvement, project initiation document and project selection, define the problem and what customer requires, improve the process to remove causes of defects, analyze the data and discover causes of defects, measure the defects and process operation, implement process control, prepare roll out solution, project closure, select project ctos, create project charter, develop high level process map, identify solution, refine and test solution, cost benefit calculation, identify root causes, validate root causes and determine vitalfew, quantify the opportunity, identify project out put metric, develop data collection plan, establish process baseline.
Measures Balanced Scorecard Ppt PowerPoint Presentation Portfolio Guide Cpb
Presenting this set of slides with name measures balanced scorecard ppt powerpoint presentation portfolio guide cpb. This is an editable Powerpoint six stages graphic that deals with topics like measures balanced scorecard to help convey your message better graphically. This product is a premium product available for immediate download and is 100 percent editable in Powerpoint. Download this now and use it in your presentations to impress your audience.
HR Balanced Scorecard Measures Ppt PowerPoint Presentation Model Influencers Cpb
Presenting this set of slides with name hr balanced scorecard measures ppt powerpoint presentation model influencers cpb. This is an editable Powerpoint four stages graphic that deals with topics like hr balanced scorecard measures to help convey your message better graphically. This product is a premium product available for immediate download and is 100 percent editable in Powerpoint. Download this now and use it in your presentations to impress your audience.


 Continue with Email

 Home
Home


