Meter Chart
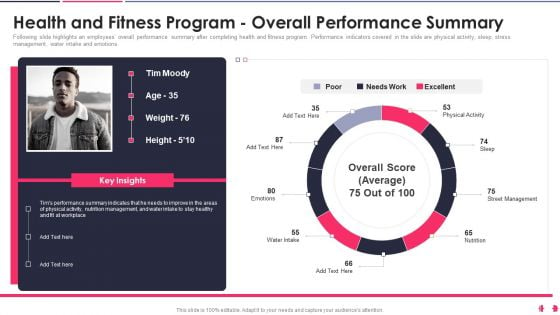
Health And Wellbeing Playbook Health And Fitness Program Overall Performance Summary Guidelines PDF
Following slide highlights an employees overall performance summary after completing health and fitness program. Performance indicators covered in the slide are physical activity, sleep, stress management, water intake and emotions. Deliver an awe inspiring pitch with this creative health and wellbeing playbook health and fitness program overall performance summary guidelines pdf bundle. Topics like health and fitness program overall performance summary can be discussed with this completely editable template. It is available for immediate download depending on the needs and requirements of the user.
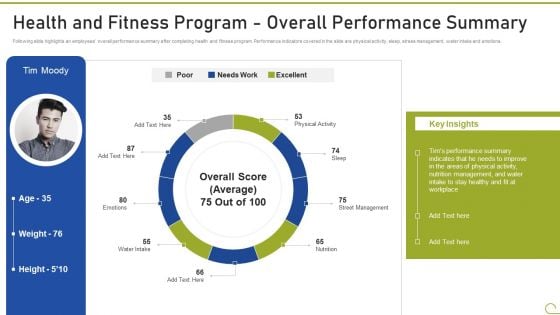
Health And Fitness Playbook Health And Fitness Program Overall Performance Summary Brochure PDF
Following slide highlights an employees overall performance summary after completing health and fitness program. Performance indicators covered in the slide are physical activity, sleep, stress management, water intake and emotions. Deliver and pitch your topic in the best possible manner with this health and fitness playbook health and fitness program overall performance summary brochure pdf. Use them to share invaluable insights on excellent needs work, tims performance summary, physical activity, nutrition management and impress your audience. This template can be altered and modified as per your expectations. So, grab it now.
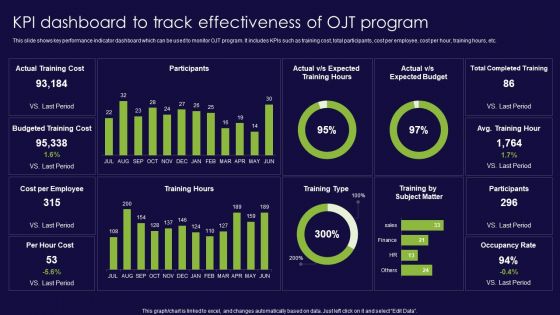
KPI Dashboard To Track Effectiveness Of OJT Program Ppt Gallery Sample PDF
This slide shows key performance indicator dashboard which can be used to monitor OJT program. It includes KPIs such as training cost, total participants, cost per employee, cost per hour, training hours, etc. Showcasing this set of slides titled KPI Dashboard To Track Effectiveness Of OJT Program Ppt Gallery Sample PDF. The topics addressed in these templates are Actual Training Cost, Budgeted Training Cost, Cost per Employee. All the content presented in this PPT design is completely editable. Download it and make adjustments in color, background, font etc. as per your unique business setting.
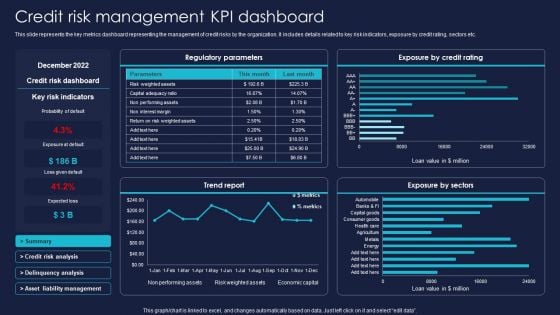
Enterprise Risk Management And Mitigation Program Credit Risk Management KPI Dashboard Introduction PDF
This slide represents the key metrics dashboard representing the management of credit risks by the organization. It includes details related to key risk indicators, exposure by credit rating, sectors etc. Want to ace your presentation in front of a live audience Our Enterprise Risk Management And Mitigation Program Credit Risk Management KPI Dashboard Introduction PDF can help you do that by engaging all the users towards you. Slidegeeks experts have put their efforts and expertise into creating these impeccable powerpoint presentations so that you can communicate your ideas clearly. Moreover, all the templates are customizable, and easy to edit and downloadable. Use these for both personal and commercial use.
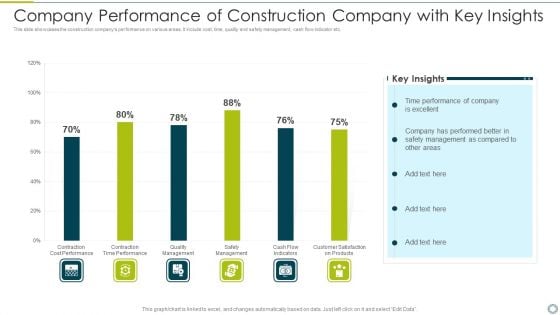
Company Performance Of Construction Company With Key Insights Portrait PDF
This slide showcases the construction companys performance on various areas. It include cost, time, quality and safety management, cash flow indicator etc. Pitch your topic with ease and precision using this company performance of construction company with key insights portrait pdf. This layout presents information on performance, management. It is also available for immediate download and adjustment. So, changes can be made in the color, design, graphics or any other component to create a unique layout.
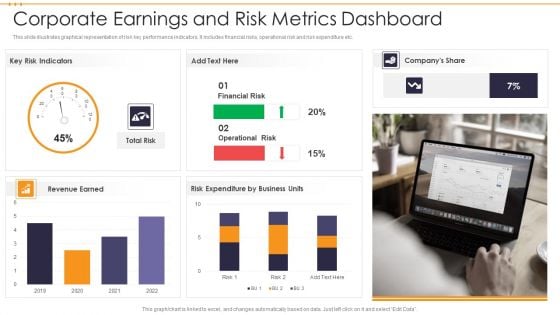
Corporate Earnings And Risk Metrics Dashboard Guidelines PDF
This slide illustrates graphical representation of risk key performance indicators. It includes financial risks, operational risk and risk expenditure etc. Pitch your topic with ease and precision using this Corporate Earnings And Risk Metrics Dashboard Guidelines PDF. This layout presents information on Financial Risk, Operational Risk Expenditure. It is also available for immediate download and adjustment. So, changes can be made in the color, design, graphics or any other component to create a unique layout.
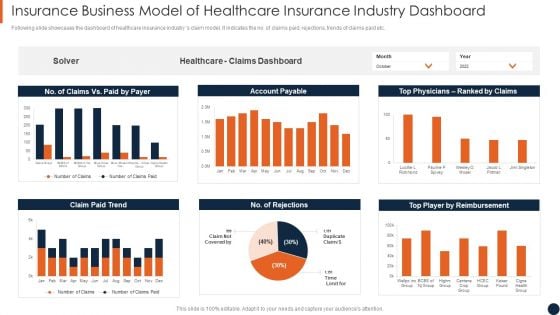
Insurance Business Model Of Healthcare Insurance Industry Dashboard Slides PDF
Following slide showcases the dashboard of healthcare insurance industrys claim model. It indicates the no. of claims paid, rejections, trends of claims paid etc.Pitch your topic with ease and precision using this Insurance Business Model Of Healthcare Insurance Industry Dashboard Slides PDF This layout presents information on Rejections, Reimbursement, Account Payable It is also available for immediate download and adjustment. So, changes can be made in the color, design, graphics or any other component to create a unique layout.
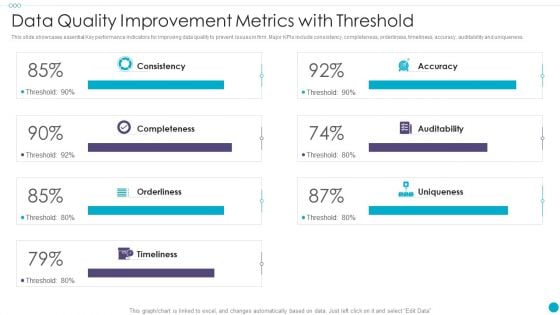
Data Quality Improvement Metrics With Threshold Formats PDF
This slide showcases essential Key performance indicators for improving data quality to prevent issues in firm. Major KPIs include consistency, completeness, orderliness, timeliness, accuracy, auditability and uniqueness. Pitch your topic with ease and precision using this Data Quality Improvement Metrics With Threshold Formats PDF This layout presents information on Auditability, Completeness, Consistency It is also available for immediate download and adjustment. So, changes can be made in the color, design, graphics or any other component to create a unique layout.

Communication Barriers Manager Dashboard For Analyzing Ppt PowerPoint Presentation Inspiration Grid PDF
This slide represents the dashboard of communication manager. It includes KPIs such as current conversation, performance, customers and opportunities.Pitch your topic with ease and precision using this Communication Barriers Manager Dashboard For Analyzing Ppt PowerPoint Presentation Inspiration Grid PDF. This layout presents information on Current Conversation, Economic Indicator, Conversation Calls. It is also available for immediate download and adjustment. So, changes can be made in the color, design, graphics or any other component to create a unique layout.
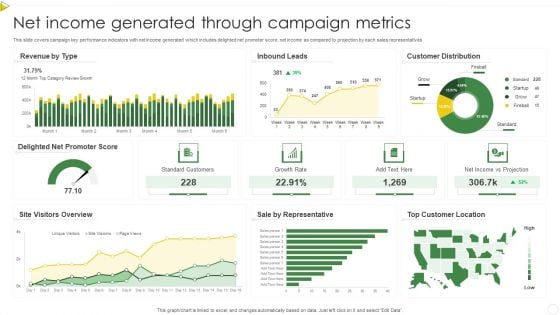
Net Income Generated Through Campaign Metrics Summary PDF
This slide covers campaign key performance indicators with net income generated which includes delighted net promoter score, net income as compared to projection by each sales representatives. Pitch your topic with ease and precision using this Net Income Generated Through Campaign Metrics Summary PDF. This layout presents information on Standard Customers, Growth Rate, Net Income. It is also available for immediate download and adjustment. So, changes can be made in the color, design, graphics or any other component to create a unique layout.
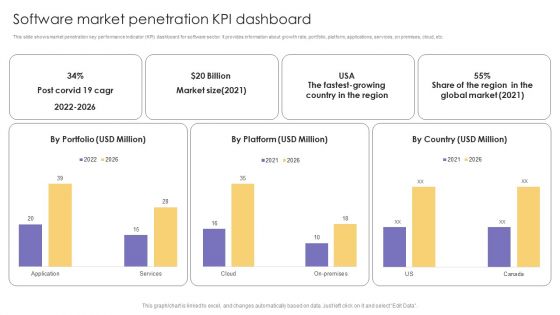
Software Market Penetration KPI Dashboard Ppt Outline Aids PDF
This slide shows market penetration key performance indicator KPI dashboard for software sector. It provides information about growth rate, portfolio, platform, applications, services, on premises, cloud, etc. Pitch your topic with ease and precision using this Software Market Penetration KPI Dashboard Ppt Outline Aids PDF. This layout presents information on Market Size, Global Market, Cloud. It is also available for immediate download and adjustment. So, changes can be made in the color, design, graphics or any other component to create a unique layout.
Email Marketing Campaign Kpis Tracking Dashboard Graphics PDF
This slide shows key performance indicators KPI dashboard for measuring effectiveness of email campaigns. It provides information about sent, delivered, opens, clicks, unsubscribed, bounces, complaints, etc. Pitch your topic with ease and precision using this Email Marketing Campaign Kpis Tracking Dashboard Graphics PDF. This layout presents information on Email Marketing Campaign, Tracking Dashboard. It is also available for immediate download and adjustment. So, changes can be made in the color, design, graphics or any other component to create a unique layout.
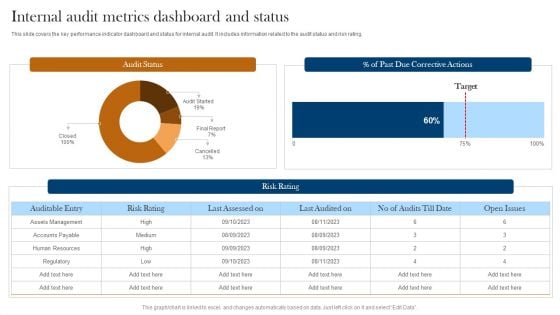
Internal Audit Metrics Dashboard And Status Ppt Layouts Graphic Images PDF
This slide covers the key performance indicator dashboard and status for internal audit. It includes information related to the audit status and risk rating. Pitch your topic with ease and precision using this Internal Audit Metrics Dashboard And Status Ppt Layouts Graphic Images PDF. This layout presents information on Audit Status, Risk Rating, Auditable Entry. It is also available for immediate download and adjustment. So, changes can be made in the color, design, graphics or any other component to create a unique layout.
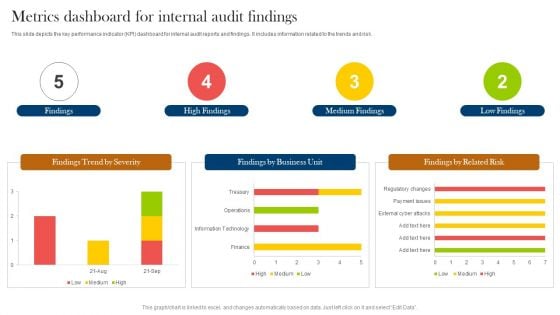
Metrics Dashboard For Internal Audit Findings Ppt Styles Gallery PDF
This slide depicts the key performance indicator KPI dashboard for internal audit reports and findings. It includes information related to the trends and risk. Pitch your topic with ease and precision using this Metrics Dashboard For Internal Audit Findings Ppt Styles Gallery PDF. This layout presents information on Findings, High Findings, Medium Findings, Low Findings. It is also available for immediate download and adjustment. So, changes can be made in the color, design, graphics or any other component to create a unique layout.
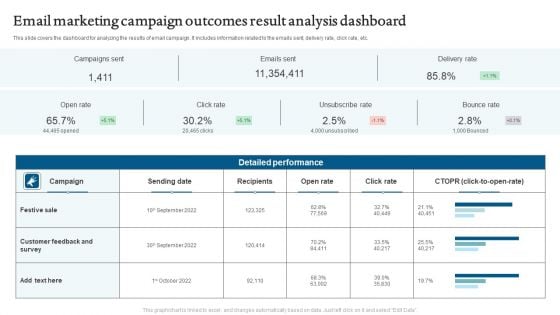
Email Marketing Campaign Outcomes Result Analysis Dashboard Mockup PDF
This slide covers the dashboard for analyzing the email campaign metrics. It includes information related to engagement a key performance indicator KPIs. Pitch your topic with ease and precision using this Email Marketing Campaign Outcomes Result Analysis Dashboard Mockup PDF. This layout presents information on Campaigns Sent, Emails Sent, Delivery Rate. It is also available for immediate download and adjustment. So, changes can be made in the color, design, graphics or any other component to create a unique layout.
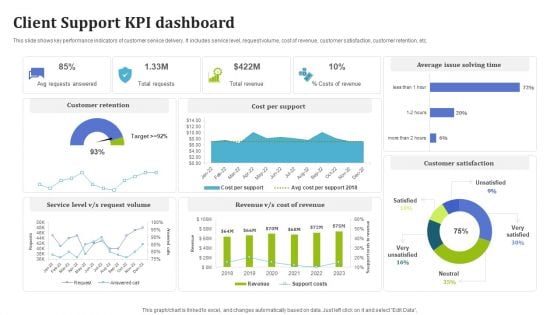
Client Support KPI Dashboard Rules PDF
This slide shows key performance indicators of customer service delivery. It includes service level, request volume, cost of revenue, customer satisfaction, customer retention, etc. Pitch your topic with ease and precision using this Client Support KPI Dashboard Rules PDF. This layout presents information on Customer Retention, Cost Per Support, Average Issue Solving Time. It is also available for immediate download and adjustment. So, changes can be made in the color, design, graphics or any other component to create a unique layout.
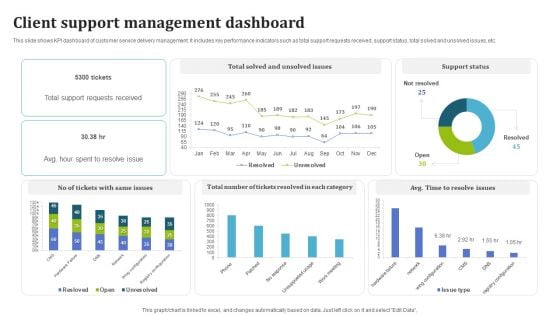
Client Support Management Dashboard Designs PDF
This slide shows KPI dashboard of customer service delivery management. It includes key performance indicators such as total support requests received, support status, total solved and unsolved issues, etc. Pitch your topic with ease and precision using this Client Support Management Dashboard Designs PDF. This layout presents information on Client Support, Management Dashboard. It is also available for immediate download and adjustment. So, changes can be made in the color, design, graphics or any other component to create a unique layout.
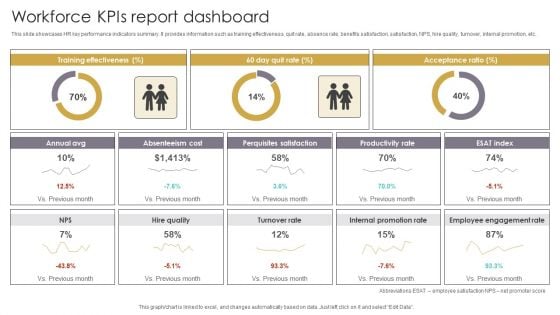
Workforce Kpis Report Dashboard Slides PDF
This slide showcases HR key performance indicators summary. It provides information such as training effectiveness, quit rate, absence rate, benefits satisfaction, satisfaction, NPS, hire quality, turnover, internal promotion, etc. Pitch your topic with ease and precision using this Workforce Kpis Report Dashboard Slides PDF. This layout presents information on Acceptance Ratio, Absenteeism Cost, Perquisites Satisfaction. It is also available for immediate download and adjustment. So, changes can be made in the color, design, graphics or any other component to create a unique layout.
Project Management Tracking Dashboard To Review Decision Download PDF
The below slide depicts the key performing indicators in project decision making. It includes elements such as overall status, progress, progress, time, cost and work volume. Pitch your topic with ease and precision using this Project Management Tracking Dashboard To Review Decision Download PDF. This layout presents information on Progress, Activity Status, Overall Status. It is also available for immediate download and adjustment. So, changes can be made in the color, design, graphics or any other component to create a unique layout.
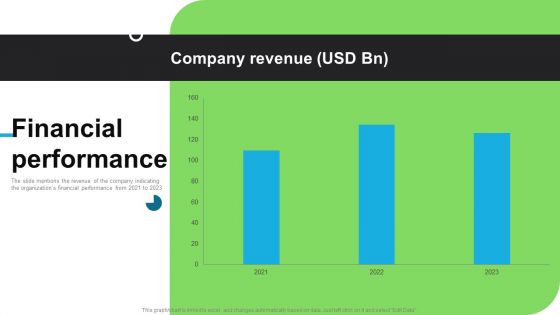
E Commerce Company Investor Funding Elevator Pitch Deck Financial Performance Microsoft PDF
The slide mentions the revenue of the company indicating the organizations financial performance from 2021 to 2023. Make sure to capture your audiences attention in your business displays with our gratis customizable E Commerce Company Investor Funding Elevator Pitch Deck Financial Performance Microsoft PDF. These are great for business strategies, office conferences, capital raising or task suggestions. If you desire to acquire more customers for your tech business and ensure they stay satisfied, create your own sales presentation with these plain slides.
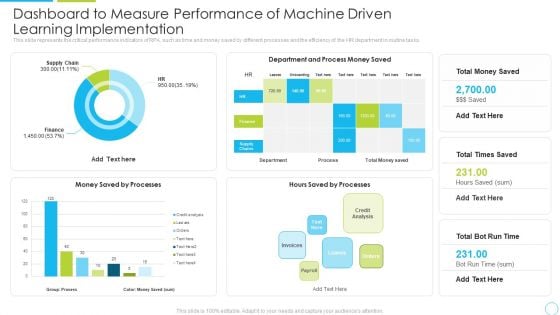
Dashboard To Measure Performance Of Machine Driven Learning Implementation Ppt Gallery Gridlines PDF
This slide represents the critical performance indicators of RPA, such as time and money saved by different processes and the efficiency of the HR department in routine tasks. Deliver an awe inspiring pitch with this creative dashboard to measure performance of machine driven learning implementation ppt gallery gridlines pdf bundle. Topics like dashboard to measure performance of machine driven learning implementation can be discussed with this completely editable template. It is available for immediate download depending on the needs and requirements of the user.
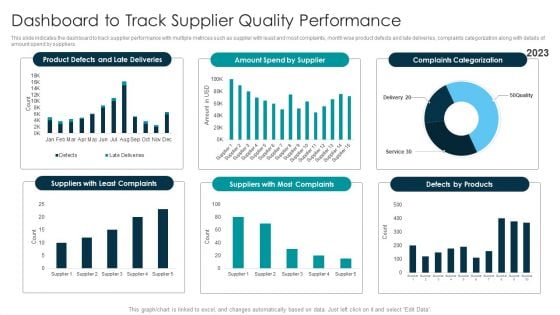
Tactical Approach For Vendor Reskilling Dashboard To Track Supplier Quality Performance Template PDF
This slide indicates the dashboard to track supplier performance with multiple metrices such as supplier with least and most complaints, month wise product defects and late deliveries, complaints categorization along with details of amount spend by suppliers. Make sure to capture your audiences attention in your business displays with our gratis customizable Tactical Approach For Vendor Reskilling Dashboard To Track Supplier Quality Performance Template PDF. These are great for business strategies, office conferences, capital raising or task suggestions. If you desire to acquire more customers for your tech business and ensure they stay satisfied, create your own sales presentation with these plain slides.
Inculcating Supplier Operation Improvement Plan Classification Of Supplier Based On Performance Icons PDF
This slide explains suppliers classification into defined groups based on their score. It indicates that vendor 1 will get placed into group A and vendor 2 into group B. Deliver and pitch your topic in the best possible manner with this inculcating supplier operation improvement plan classification of supplier based on performance icons pdf. Use them to share invaluable insights on outstanding performance, average performance, re qualification required, satisfactory performance and impress your audience. This template can be altered and modified as per your expectations. So, grab it now.
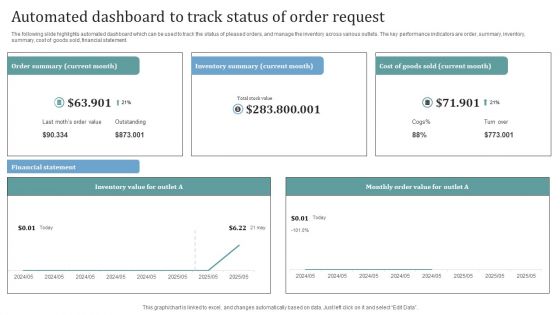
Automated Dashboard To Track Status Of Order Request Themes PDF
The following slide highlights automated dashboard which can be used to track the status of pleased orders, and manage the inventory across various outlets. The key performance indicators are order, summary, inventory, summary, cost of goods sold, financial statement. Showcasing this set of slides titled Automated Dashboard To Track Status Of Order Request Themes PDF. The topics addressed in these templates are Inventory Value, Inventory Summary, Cost. All the content presented in this PPT design is completely editable. Download it and make adjustments in color, background, font etc. as per your unique business setting.
Dashboard For Tracking Green Financing Activities Themes PDF
This slide presents a finance dashboard to track the progress of sustainability activities based on finance allocations. The key performing indicators are overall progress, energy usage by month, budget allocation and application etc. Showcasing this set of slides titled Dashboard For Tracking Green Financing Activities Themes PDF. The topics addressed in these templates are Activities, Application, Dashboard. All the content presented in this PPT design is completely editable. Download it and make adjustments in color, background, font etc. as per your unique business setting.

Restaurant Employees Training Analysis Dashboard Diagrams PDF
This slide shows dashboard that monitor and provide training employee information and actionable insights. It contains various indicators such as number of participants, hours of training, subject, occupancy rate, budget and cost of training. Showcasing this set of slides titled Restaurant Employees Training Analysis Dashboard Diagrams PDF. The topics addressed in these templates are Participant Training Type, Training Subject Matter, Hours Of Training Target. All the content presented in this PPT design is completely editable. Download it and make adjustments in color, background, font etc. as per your unique business setting.
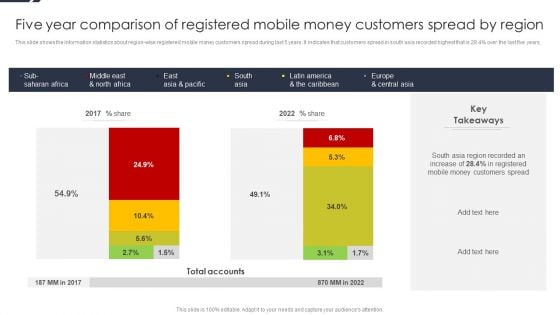
Five Year Comparison Of Registered Mobile Money Customers Spread By Region Introduction PDF
This slide shows the information statistics about region wise registered mobile money customers spread during last 5 years. It indicates that customers spread in south asia recorded highest that is 28.4persent over the last five years.Deliver and pitch your topic in the best possible manner with this Five Year Comparison Of Registered Mobile Money Customers Spread By Region Introduction PDF. Use them to share invaluable insights on Region Recorded, Mobile Money, Customers Spread and impress your audience. This template can be altered and modified as per your expectations. So, grab it now.

Healthcare Big Data Assessment Dashboard Slide2 Introduction PDF
This slide covers the records about the patients used to describe massive volumes of information created by the adoption of digital technologies that collect patients records and help in managing hospital performance. Showcasing this set of slides titled Healthcare Big Data Assessment Dashboard Slide2 Introduction PDF. The topics addressed in these templates are Forecasted Patient Turnover, Service Indicators, Occupancy. All the content presented in this PPT design is completely editable. Download it and make adjustments in color, background, font etc. as per your unique business setting.
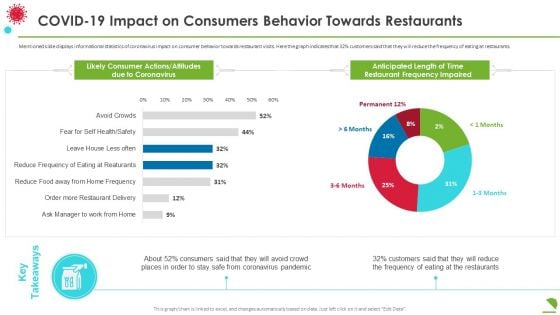
Covid19 Impact On Consumers Behavior Towards Restaurants Diagrams PDF
Mentioned slide displays informational statistics of coronavirus impact on consumer behavior towards restaurant visits. Here the graph indicates that 32 percentage customers said that they will reduce the frequency of eating at restaurants. Deliver an awe inspiring pitch with this creative covid19 impact on consumers behavior towards restaurants diagrams pdf bundle. Topics like covid 19 impact on consumers behavior towards restaurants can be discussed with this completely editable template. It is available for immediate download depending on the needs and requirements of the user.
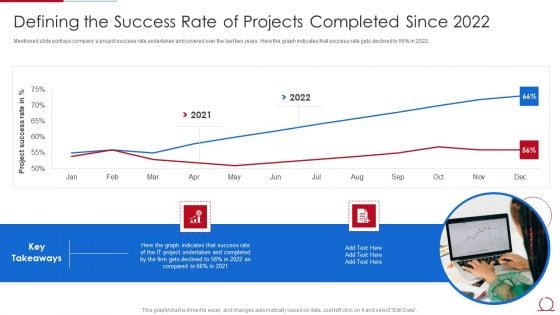
Quality Assurance Model For Agile IT Defining The Success Rate Of Projects Completed Themes PDF
Mentioned slide portrays companys project success rate undertaken and covered over the last two years. Here the graph indicates that success rate gets declined to 56 percent in 2022. Deliver an awe inspiring pitch with this creative quality assurance model for agile it defining the success rate of projects completed themes pdf bundle. Topics like success rate, it project, 2021 to 2022 can be discussed with this completely editable template. It is available for immediate download depending on the needs and requirements of the user.

Quality Assurance Model For Agile IT Forecasted Impact Of Adopting Agile Model Themes PDF
Mentioned slide portrays forecasted companys project success rate after adopting agile mode. Here the graph indicates that success rate will get increased to 73 percent in 2023. Deliver and pitch your topic in the best possible manner with this quality assurance model for agile it forecasted impact of adopting agile model themes pdf. Use them to share invaluable insights on success rate, it project, 2022 to 2023 and impress your audience. This template can be altered and modified as per your expectations. So, grab it now.
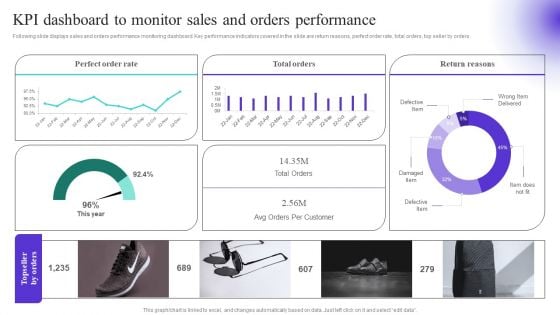
KPI Dashboard To Monitor Sales And Orders Performance Diagrams PDF
Following slide displays sales and orders performance monitoring dashboard. Key performance indicators covered in the slide are return reasons, perfect order rate, total orders, top seller by orders. Create an editable KPI Dashboard To Monitor Sales And Orders Performance Diagrams PDF that communicates your idea and engages your audience. Whether you are presenting a business or an educational presentation, pre designed presentation templates help save time. KPI Dashboard To Monitor Sales And Orders Performance Diagrams PDF is highly customizable and very easy to edit, covering many different styles from creative to business presentations. Slidegeeks has creative team members who have crafted amazing templates. So, go and get them without any delay.
Multi Cloud Infrastructure Management Cloud Performance Tracking Dashboard Diagrams PDF
This slide covers the Key performance indicators for tracking performance of the cloud such as violations break down, sources, rules and severity. From laying roadmaps to briefing everything in detail, our templates are perfect for you. You can set the stage with your presentation slides. All you have to do is download these easy-to-edit and customizable templates. Multi Cloud Infrastructure Management Cloud Performance Tracking Dashboard Diagrams PDF will help you deliver an outstanding performance that everyone would remember and praise you for. Do download this presentation today.
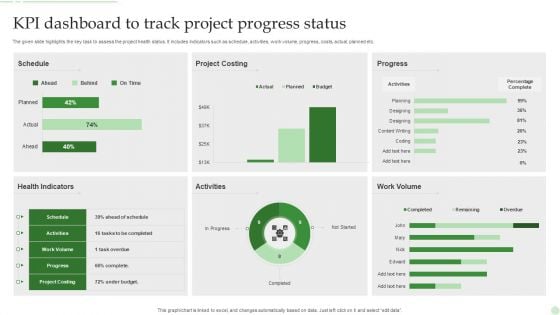
KPI Dashboard To Track Project Progress Status Ppt PowerPoint Presentation Gallery Maker PDF
The given slide highlights the key task to assess the project health status. It includes indicators such as schedule, activities, work volume, progress, costs, actual, planned etc. Showcasing this set of slides titled KPI Dashboard To Track Project Progress Status Ppt PowerPoint Presentation Gallery Maker PDF. The topics addressed in these templates are Schedule, Project Costing, Progress, Activities. All the content presented in this PPT design is completely editable. Download it and make adjustments in color, background, font etc. as per your unique business setting.
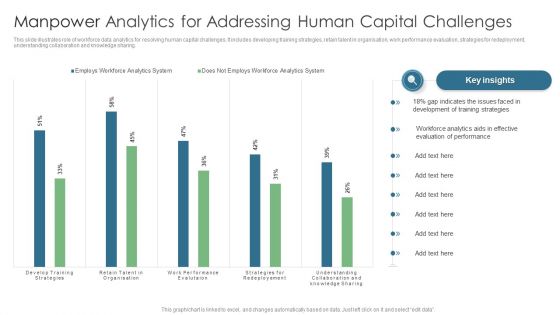
Manpower Analytics For Addressing Human Capital Challenges Diagrams PDF
This slide illustrates role of workforce data analytics for resolving human capital challenges. It includes developing training strategies, retain talent in organisation, work performance evaluation, strategies for redeployment, understanding collaboration and knowledge sharing. Showcasing this set of slides titled Manpower Analytics For Addressing Human Capital Challenges Diagrams PDF. The topics addressed in these templates are Gap Indicates, Training Strategies, Evaluation Performance. All the content presented in this PPT design is completely editable. Download it and make adjustments in color, background, font etc. as per your unique business setting.
Product Development Status Icon With Bulb Ideas PDF
The following slide showcases dashboard that helps to track key performance indicators of product development. Key metrics covered overall progress, planning, design, development, testing, risks, summary, average handle time, overdue tasks, upcoming deadlines and projected launch date. Showcasing this set of slides titled Product Development Status Icon With Bulb Ideas PDF. The topics addressed in these templates are Design, Development, Planning. All the content presented in this PPT design is completely editable. Download it and make adjustments in color, background, font etc. as per your unique business setting.
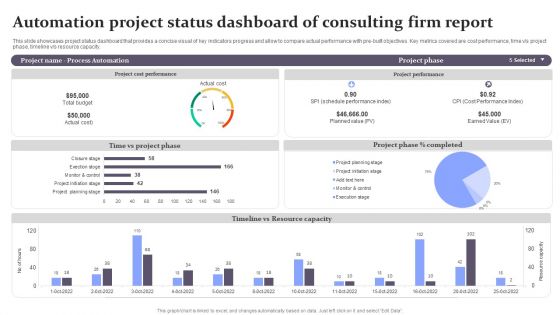
Automation Project Status Dashboard Of Consulting Firm Report Background PDF
This slide showcases project status dashboard that provides a concise visual of key indicators progress and allow to compare actual performance with pre-built objectives. Key metrics covered are cost performance, time v or s project phase, timeline v or s resource capacity. Showcasing this set of slides titled Automation Project Status Dashboard Of Consulting Firm Report Background PDF. The topics addressed in these templates are Project Phase, Planned Value, Cost Performance Index. All the content presented in this PPT design is completely editable. Download it and make adjustments in color, background, font etc. as per your unique business setting.
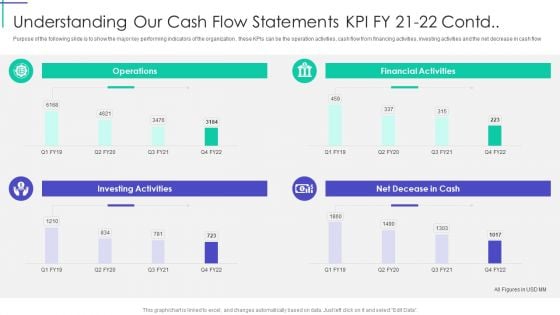
Understanding Our Cash Flow Statements KPI Fy 21 To 22 Contd Themes PDF
Purpose of the following slide is to show the major key performing indicators of the organization , these KPIs can be the operation activities, cash flow from financing activities, investing activities and the net decrease in cash flow Deliver and pitch your topic in the best possible manner with this Understanding Our Cash Flow Statements KPI Fy 21 To 22 Contd Themes PDF. Use them to share invaluable insights on Investing Activities, Financial Activities, Operations and impress your audience. This template can be altered and modified as per your expectations. So, grab it now.
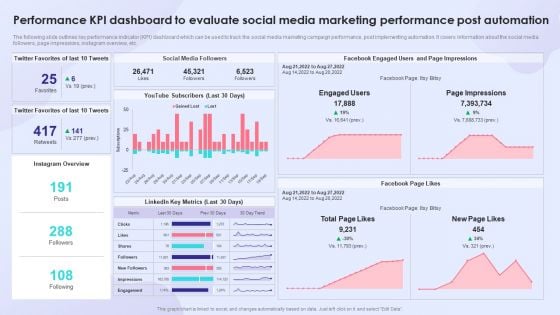
Performance KPI Dashboard To Evaluate Social Media Marketing Performance Post Automation Themes PDF
The following slide outlines key performance indicator KPI dashboard which can be used to track the social media marketing campaign performance, post implementing automation. It covers information about the social media followers, page impressions, instagram overview, etc. Deliver and pitch your topic in the best possible manner with this Performance KPI Dashboard To Evaluate Social Media Marketing Performance Post Automation Themes PDF. Use them to share invaluable insights on Social Media Followers, Linkedin Key Metrics, Performance KPI Dashboard and impress your audience. This template can be altered and modified as per your expectations. So, grab it now.
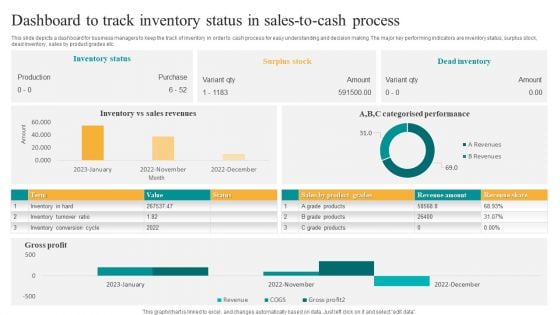
Dashboard To Track Inventory Status In Sales To Cash Process Themes PDF
This slide depicts a dashboard for business managers to keep the track of inventory in order to cash process for easy understanding and decision making. The major key performing indicators are inventory status, surplus stock, dead inventory, sales by product grades etc. Showcasing this set of slides titled Dashboard To Track Inventory Status In Sales To Cash Process Themes PDF. The topics addressed in these templates are Inventory Status, Surplus Stock, Dead Inventory. All the content presented in this PPT design is completely editable. Download it and make adjustments in color, background, font etc. as per your unique business setting.
Cloud Performance Tracking Dashboard Cloud Computing Complexities And Solutions Structure PDF
This slide covers the Key performance indicators for tracking performance of the cloud such as violations break down, sources, rules and severity. Are you searching for a xxxxxxxxxxxxxxxxxxxxxx that is uncluttered, straightforward, and original Its easy to edit, and you can change the colors to suit your personal or business branding. For a presentation that expresses how much effort you ve put in, this template is ideal With all of its features, including tables, diagrams, statistics, and lists, its perfect for a business plan presentation. Make your ideas more appealing with these professional slides. Download Cloud Performance Tracking Dashboard Cloud Computing Complexities And Solutions Structure PDF from Slidegeeks today.
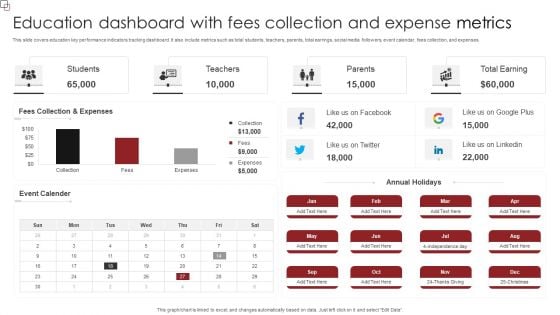
Education Dashboard With Fees Collection And Expense Metrics Demonstration PDF
This slide covers education key performance indicators tracking dashboard. It also include metrics such as total students, teachers, parents, total earrings, social media followers, event calendar, fees collection, and expenses. Showcasing this set of slides titled Education Dashboard With Fees Collection And Expense Metrics Demonstration PDF. The topics addressed in these templates are Event Calender, Annual Holidays, Fees Collection, Expenses. All the content presented in this PPT design is completely editable. Download it and make adjustments in color, background, font etc. as per your unique business setting.
Digital Sales Metrics Showing Enhancement Icons PDF
The following slide represents statistics of online sales key performance indicators KPIs which can assist marketing manager to review their performance and take necessary steps. It include different metrics such as add to cart rate, conversion rate, and revenue per session. Showcasing this set of slides titled Digital Sales Metrics Showing Enhancement Icons PDF. The topics addressed in these templates are Quarterly Online Sales Metrics, Targeted Right Customers, Offered Product Recommendations. All the content presented in this PPT design is completely editable. Download it and make adjustments in color, background, font etc. as per your unique business setting.
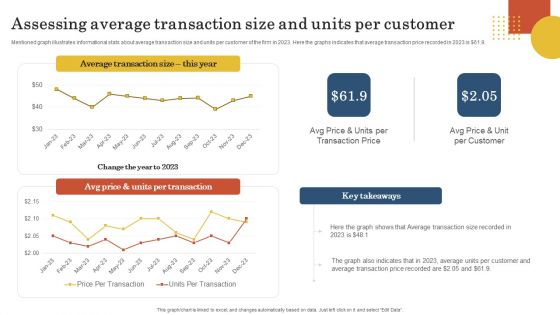
Retail Business Operation Management To Optimize Customer Experience Assessing Average Transaction Size Information PDF
Mentioned graph illustrates informational stats about average transaction size and units per customer of the firm in 2023. Here the graphs indicates that average transaction price recorded in 2023 is 61.9. There are so many reasons you need a Retail Business Operation Management To Optimize Customer Experience Assessing Average Transaction Size Information PDF. The first reason is you cannot spend time making everything from scratch, Thus, Slidegeeks has made presentation templates for you too. You can easily download these templates from our website easily.
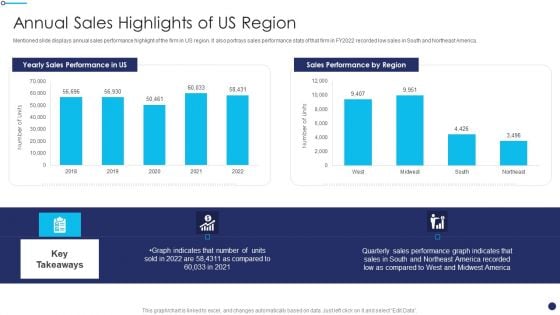
Effective Sales Technique For New Product Launch Annual Sales Highlights Of US Region Inspiration PDF
Mentioned slide displays annual sales performance highlight of the firm in US region. It also portrays sales performance stats of that firm in FY2022 recorded low sales in South and Northeast America. Deliver an awe inspiring pitch with this creative Effective Sales Technique For New Product Launch Annual Sales Highlights Of US Region Inspiration PDF bundle. Topics like Sales Performance, Graph Indicates, Performance Graph can be discussed with this completely editable template. It is available for immediate download depending on the needs and requirements of the user.
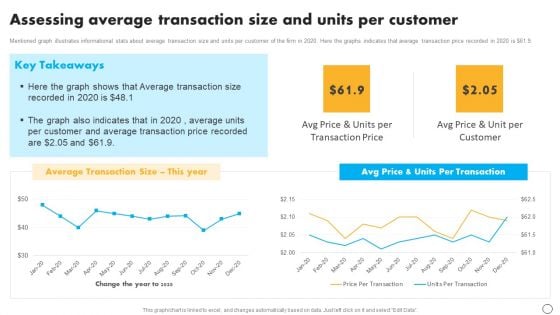
Retail Business Optimization Through Operational Excellence Strategy Assessing Average Transaction Size Microsoft PDF
Mentioned graph illustrates informational stats about average transaction size and units per customer of the firm in 2020. Here the graphs indicates that average transaction price recorded in 2020 is doller 61.9. Want to ace your presentation in front of a live audience Our Retail Business Optimization Through Operational Excellence Strategy Assessing Average Transaction Size Microsoft PDF can help you do that by engaging all the users towards you. Slidegeeks experts have put their efforts and expertise into creating these impeccable powerpoint presentations so that you can communicate your ideas clearly. Moreover, all the templates are customizable, and easy to edit and downloadable. Use these for both personal and commercial use.
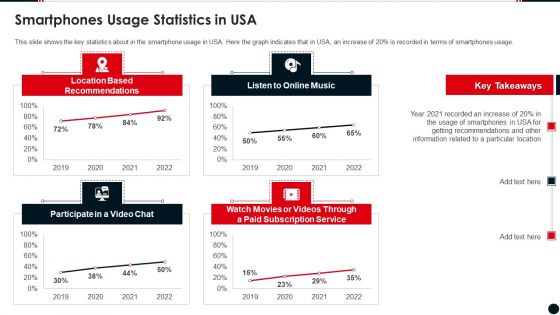
Geolocating Based Service Platform Pitch Deck Smartphones Usage Statistics In USA Summary PDF
This slide shows the key statistics about in the smartphone usage in USA. Here the graph indicates that in USA, an increase of 20 percent is recorded in terms of smartphones usage. Deliver an awe inspiring pitch with this creative geolocating based service platform pitch deck smartphones usage statistics in usa summary pdf bundle. Topics like smartphones usage statistics in usa can be discussed with this completely editable template. It is available for immediate download depending on the needs and requirements of the user.
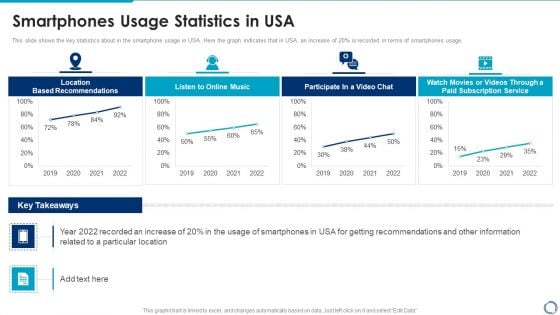
Location And Navigation Smartphones Usage Statistics In Usa Demonstration PDF
This slide shows the key statistics about in the smartphone usage in USA. Here the graph indicates that in USA, an increase of 20 percent is recorded in terms of smartphones usage. Deliver an awe inspiring pitch with this creative Location And Navigation Smartphones Usage Statistics In Usa Demonstration PDF bundle. Topics like Location Based Recommendations, Listen to Online Music, Participate In a Video Chat can be discussed with this completely editable template. It is available for immediate download depending on the needs and requirements of the user.
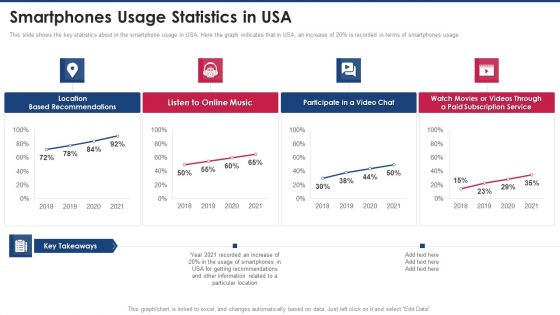
Capital Raising Pitch Presentation Smartphones Usage Statistics In USA Pictures PDF
This slide shows the key statistics about in the smartphone usage in USA. Here the graph indicates that in USA, an increase of 20 percent is recorded in terms of smartphones usage. Deliver an awe inspiring pitch with this creative Capital Raising Pitch Presentation Smartphones Usage Statistics In USA Pictures PDF bundle. Topics like Location, Based Recommendations, Listen To Online Music, Participate Video Chat, 2018 To 2021 can be discussed with this completely editable template. It is available for immediate download depending on the needs and requirements of the user.
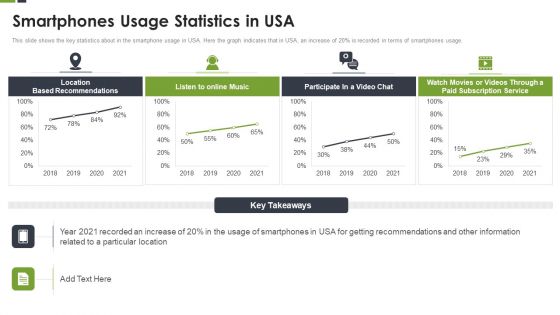
LBS Application Elevator Smartphones Usage Statistics In Usa Ppt Infographics Grid PDF
This slide shows the key statistics about in the smartphone usage in USA. Here the graph indicates that in USA, an increase of 20 percent is recorded in terms of smartphones usage. Deliver and pitch your topic in the best possible manner with this LBS Application Elevator Smartphones Usage Statistics In Usa Ppt Infographics Grid PDF. Use them to share invaluable insights on Location Based, Subscription Service, Particular Location and impress your audience. This template can be altered and modified as per your expectations. So, grab it now.
Plan Dashboard For Tracking Location Wise Revenue Diagrams PDF
This slide presents a dashboard which will assist managers to track the revenue of each branch having geographical presence in different corners of the world. The key performance indicators are total revenue, location wise rent, branch performance among many others.Pitch your topic with ease and precision using this Plan Dashboard For Tracking Location Wise Revenue Diagrams PDF. This layout presents information on Taxes Paid, Current Month, Branch Performance, Previous Quarter. It is also available for immediate download and adjustment. So, changes can be made in the color, design, graphics or any other component to create a unique layout.
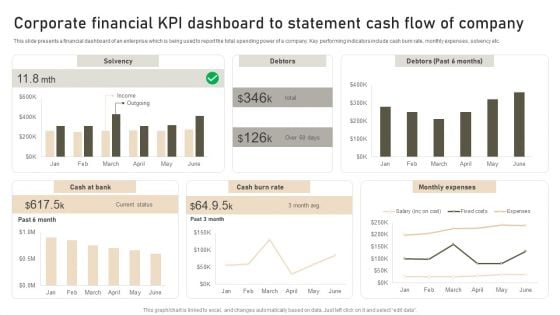
Corporate Financial KPI Dashboard To Statement Cash Flow Of Company Diagrams PDF
This slide presents a financial dashboard of an enterprise which is being used to report the total spending power of a company. Key performing indicators include cash burn rate, monthly expenses, solvency etc. Showcasing this set of slides titled Corporate Financial KPI Dashboard To Statement Cash Flow Of Company Diagrams PDF. The topics addressed in these templates are Solvency, Debtors, Monthly Expenses. All the content presented in this PPT design is completely editable. Download it and make adjustments in color, background, font etc. as per your unique business setting.

Introduction To Mobile Money In Developing Countries Five Year Comparison Of Registered Demonstration PDF
This slide shows the information statistics about region wise registered mobile money customers spread during last 5 years. It indicates that customers spread in South Asia recorded highest that is 28.4persent over the last five years.Deliver an awe inspiring pitch with this creative introduction to mobile money in developing countries five year comparison of registered demonstration pdf bundle. Topics like five year comparison of registered mobile money customers spread by region can be discussed with this completely editable template. It is available for immediate download depending on the needs and requirements of the user.
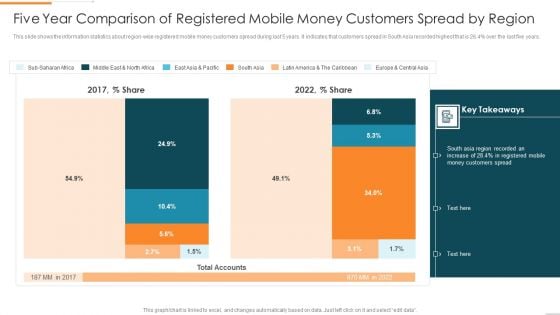
Enhanced Customer Banking Experience With Mobile Five Year Comparison Of Registered Mobile Background PDF
This slide shows the information statistics about region-wise registered mobile money customers spread during last 5 years. It indicates that customers spread in South Asia recorded highest that is 28.4percent over the last five years.Deliver an awe inspiring pitch with this creative Enhanced Customer Banking Experience With Mobile Five Year Comparison Of Registered Mobile Background PDF bundle. Topics like Five Year Comparison Of Registered Mobile Money Customers Spread By Region can be discussed with this completely editable template. It is available for immediate download depending on the needs and requirements of the user.
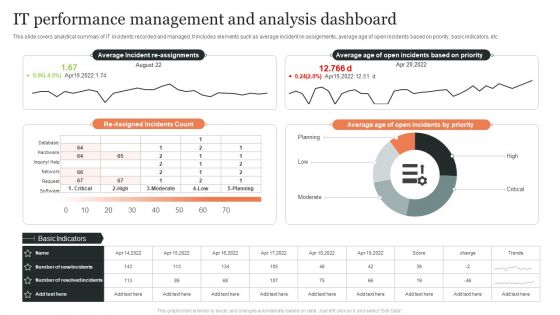
IT Performance Management And Analysis Dashboard Ppt Styles Portrait PDF
This slide covers analytical summary of IT incidents recorded and managed. It includes elements such as average incident re-assignments, average age of open incidents based on priority, basic indicators, etc. Showcasing this set of slides titled IT Performance Management And Analysis Dashboard Ppt Styles Portrait PDF. The topics addressed in these templates are Average Age, Open Incidents Priority, Re Assigned, Incidents Count. All the content presented in this PPT design is completely editable. Download it and make adjustments in color, background, font etc. as per your unique business setting.
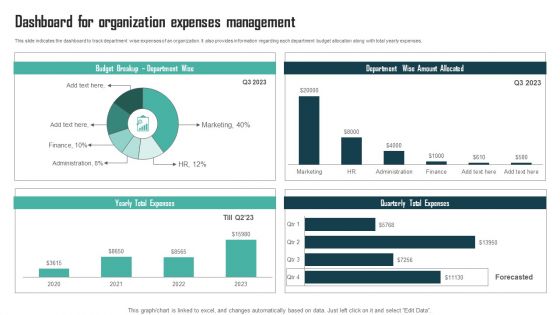
Expenses Management Plan Dashboard For Organization Expenses Management Mockup PDF
This slide indicates the dashboard to track department wise expenses of an organization. It also provides information regarding each department budget allocation along with total yearly expenses. Slidegeeks is one of the best resources for PowerPoint templates. You can download easily and regulate Expenses Management Plan Dashboard For Organization Expenses Management Mockup PDF for your personal presentations from our wonderful collection. A few clicks is all it takes to discover and get the most relevant and appropriate templates. Use our Templates to add a unique zing and appeal to your presentation and meetings. All the slides are easy to edit and you can use them even for advertisement purposes.
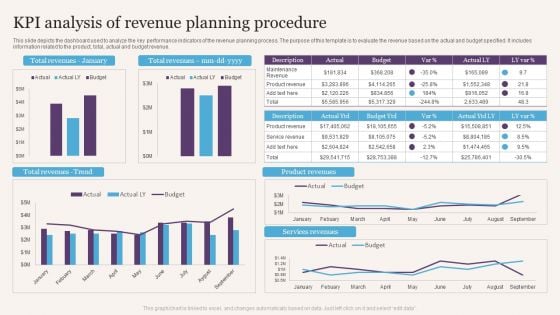
KPI Analysis Of Revenue Planning Procedure Professional PDF
This slide depicts the dashboard used to analyze the key performance indicators of the revenue planning process. The purpose of this template is to evaluate the revenue based on the actual and budget specified. It includes information related to the product, total, actual and budget revenue. Showcasing this set of slides titled KPI Analysis Of Revenue Planning Procedure Professional PDF. The topics addressed in these templates are Kpi Analysis, Revenue Planning Procedure. All the content presented in this PPT design is completely editable. Download it and make adjustments in color, background, font etc. as per your unique business setting.
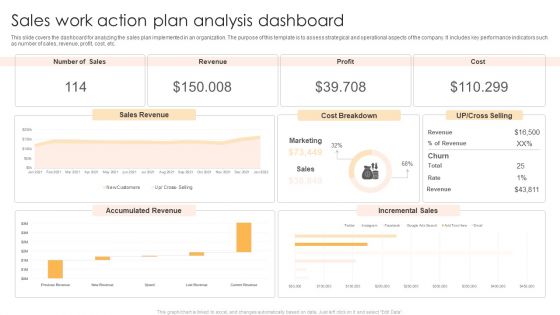
Sales Work Action Plan Analysis Dashboard Brochure PDF
This slide covers the dashboard for analyzing the sales plan implemented in an organization. The purpose of this template is to assess strategical and operational aspects of the company. It includes key performance indicators such as number of sales, revenue, profit, cost, etc. Showcasing this set of slides titled Sales Work Action Plan Analysis Dashboard Brochure PDF. The topics addressed in these templates are Sales Revenue, Cost Breakdown, Accumulated Revenue. All the content presented in this PPT design is completely editable. Download it and make adjustments in color, background, font etc. as per your unique business setting.
Employee Training And Development Plan Performance Tracking Dashboard Portrait PDF
Mentioned slide outlines key performance indicator KPI dashboard which can be used by organization to monitor training and development strategies. The major metrics covered in the template are cost per participant, per hour, number of trainees , etc. Showcasing this set of slides titled Employee Training And Development Plan Performance Tracking Dashboard Portrait PDF. The topics addressed in these templates are Employee Training, Development Plan Performance, Tracking Dashboard. All the content presented in this PPT design is completely editable. Download it and make adjustments in color, background, font etc. as per your unique business setting.
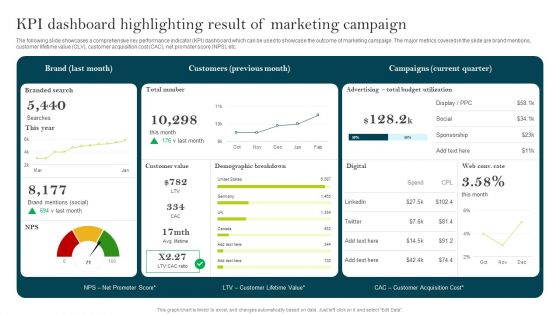
KPI Dashboard Highlighting Result Of Marketing Campaign Ppt PowerPoint Presentation Diagram Lists PDF
The following slide showcases a comprehensive key performance indicator KPI dashboard which can be used to showcase the outcome of marketing campaign. The major metrics covered in the slide are brand mentions, customer lifetime value CLV, customer acquisition cost CAC, net promoter score NPS, etc. Are you in need of a template that can accommodate all of your creative concepts This one is crafted professionally and can be altered to fit any style. Use it with Google Slides or PowerPoint. Include striking photographs, symbols, depictions, and other visuals. Fill, move around, or remove text boxes as desired. Test out color palettes and font mixtures. Edit and save your work, or work with colleagues. Download KPI Dashboard Highlighting Result Of Marketing Campaign Ppt PowerPoint Presentation Diagram Lists PDF and observe how to make your presentation outstanding. Give an impeccable presentation to your group and make your presentation unforgettable.


 Continue with Email

 Home
Home


