Meter Chart
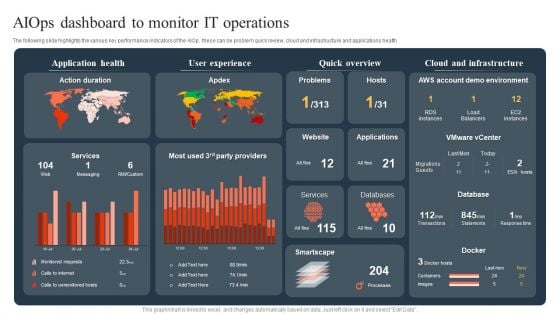
Ml And Big Data In Information Technology Processes Aiops Dashboard To Monitor IT Operations Sample PDF
The following slide highlights the various key performance indicators of the AIOp, these can be problem quick review, cloud and infrastructure and applications health If you are looking for a format to display your unique thoughts, then the professionally designed Ml And Big Data In Information Technology Processes Aiops Dashboard To Monitor IT Operations Sample PDF is the one for you. You can use it as a Google Slides template or a PowerPoint template. Incorporate impressive visuals, symbols, images, and other charts. Modify or reorganize the text boxes as you desire. Experiment with shade schemes and font pairings. Alter, share or cooperate with other people on your work. Download Ml And Big Data In Information Technology Processes Aiops Dashboard To Monitor IT Operations Sample PDF and find out how to give a successful presentation. Present a perfect display to your team and make your presentation unforgettable.
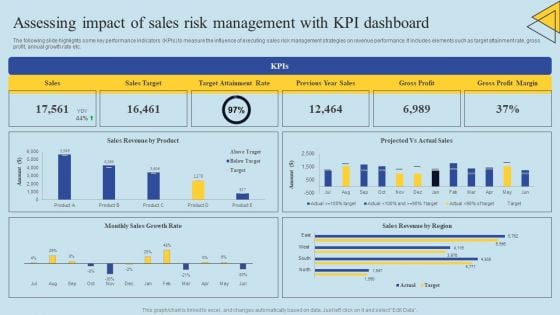
Determining Risks In Sales Administration Procedure Assessing Impact Of Sales Risk Management Sample PDF
The following slide highlights some key performance indicators KPIs to measure the influence of executing sales risk management strategies on revenue performance. It includes elements such as target attainment rate, gross profit, annual growth rate etc. If you are looking for a format to display your unique thoughts, then the professionally designed Determining Risks In Sales Administration Procedure Assessing Impact Of Sales Risk Management Sample PDF is the one for you. You can use it as a Google Slides template or a PowerPoint template. Incorporate impressive visuals, symbols, images, and other charts. Modify or reorganize the text boxes as you desire. Experiment with shade schemes and font pairings. Alter, share or cooperate with other people on your work. Download Determining Risks In Sales Administration Procedure Assessing Impact Of Sales Risk Management Sample PDF and find out how to give a successful presentation. Present a perfect display to your team and make your presentation unforgettable.
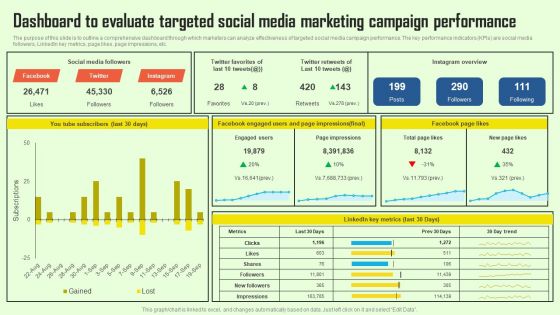
Increasing Consumer Engagement With Database Dashboard To Evaluate Targeted Social Media Portrait PDF
The purpose of this slide is to outline a comprehensive dashboard through which marketers can analyze effectiveness of targeted social media campaign performance. The key performance indicators KPIs are social media followers, LinkedIn key metrics, page likes, page impressions, etc. If you are looking for a format to display your unique thoughts, then the professionally designed Increasing Consumer Engagement With Database Dashboard To Evaluate Targeted Social Media Portrait PDF is the one for you. You can use it as a Google Slides template or a PowerPoint template. Incorporate impressive visuals, symbols, images, and other charts. Modify or reorganize the text boxes as you desire. Experiment with shade schemes and font pairings. Alter, share or cooperate with other people on your work. Download Increasing Consumer Engagement With Database Dashboard To Evaluate Targeted Social Media Portrait PDF and find out how to give a successful presentation. Present a perfect display to your team and make your presentation unforgettable.
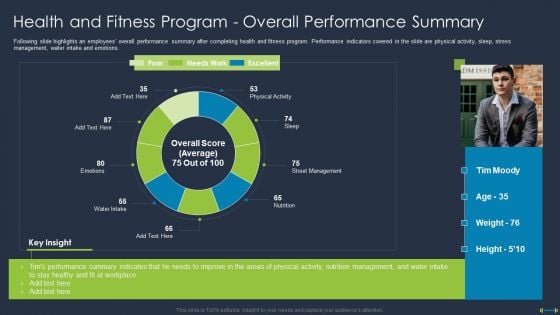
Corporate Physical Health And Fitness Culture Playbook Health And Fitness Program Overall Portrait PDF
Following slide highlights an employees overall performance summary after completing health and fitness program. Performance indicators covered in the slide are physical activity, sleep, stress management, water intake and emotions. Deliver an awe inspiring pitch with this creative corporate physical health and fitness culture playbook health and fitness program overall portrait pdf bundle. Topics like tims performance summary indicates, physical activity, nutrition management can be discussed with this completely editable template. It is available for immediate download depending on the needs and requirements of the user.
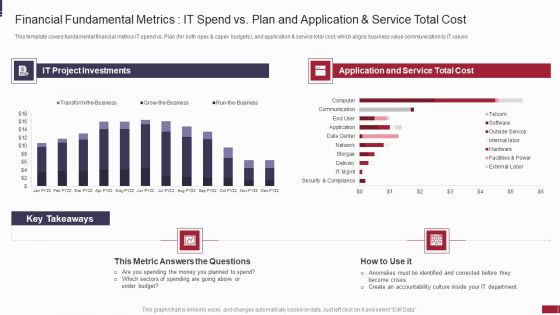
IT Value Story Significant To Corporate Leadership Financial Fundamental Metrics Diagrams PDF
These indicators assist IT leaders in stewarding technology expenditures and investments, and they are essential to managing the IT company. These measures aid in the management of the departments financial health and may indicate levers for cost reduction, improved resource allocation, and enhanced accountability. Deliver and pitch your topic in the best possible manner with this it value story significant to corporate leadership financial fundamental metrics diagrams pdf. Use them to share invaluable insights on organizations, budget, metric, cost and impress your audience. This template can be altered and modified as per your expectations. So, grab it now.
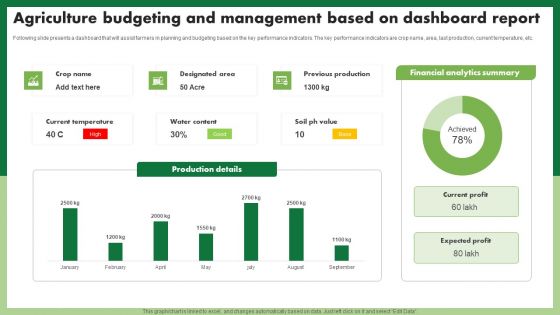
Agriculture Budgeting And Management Based On Dashboard Report Topics PDF
Following slide presents a dashboard that will assist farmers in planning and budgeting based on the key performance indicators. The key performance indicators are crop name, area, last production, current temperature, etc. Showcasing this set of slides titled Agriculture Budgeting And Management Based On Dashboard Report Topics PDF. The topics addressed in these templates are Production Details. All the content presented in this PPT design is completely editable. Download it and make adjustments in color, background, font etc. as per your unique business setting.
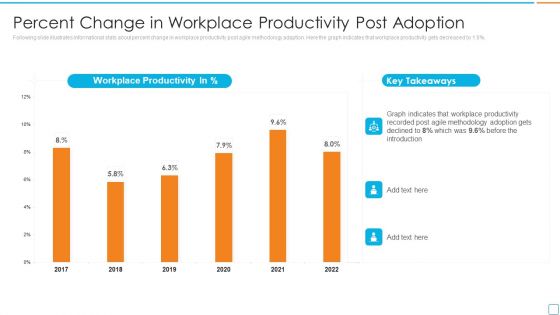
Professional Scrum Master Certification Percent Change In Workplace Productivity Post Adoption Infographics PDF
Following slide illustrates informational stats about percent change in workplace productivity post agile methodology adaption. Here the graph indicates that workplace productivity gets decreased by 1.6 percent. Deliver and pitch your topic in the best possible manner with this professional scrum master certification percent change in workplace productivity post adoption infographics pdf. Use them to share invaluable insights on workplace productivity, 2017 to 2022, graph indicates and impress your audience. This template can be altered and modified as per your expectations. So, grab it now.
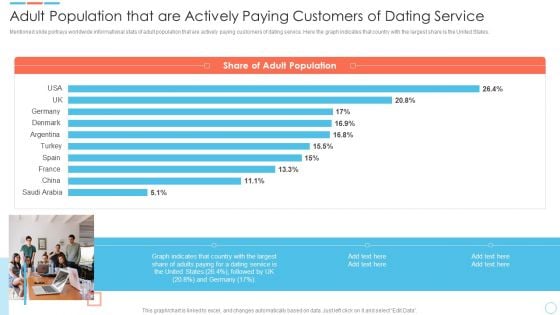
Elevator Online Dating Software Adult Population That Are Actively Paying Customers Guidelines PDF
Mentioned slide portrays worldwide informational stats of adult population that are actively paying customers of dating service. Here the graph indicates that country with the largest share is the United States. Deliver an awe inspiring pitch with this creative Elevator Online Dating Software Adult Population That Are Actively Paying Customers Guidelines PDF bundle. Topics like Share Adult Population, Graph indicates, Customers can be discussed with this completely editable template. It is available for immediate download depending on the needs and requirements of the user.

Iot And Digital Twin To Reduce Costs Post Covid Healthcare Dashboard Showing Analytical Data Elements PDF
This slide shows the healthcare dashboard that presents analytical data such as occupancy, patient turnover, efficiency and costs, satisfaction and service indicators. Deliver and pitch your topic in the best possible manner with this iot and digital twin to reduce costs post covid healthcare dashboard showing analytical data elements pdf. Use them to share invaluable insights on occupancy, patient turnover, efficiency and costs, satisfaction and service indicators and impress your audience. This template can be altered and modified as per your expectations. So, grab it now.

Financial Fundamental Metrics Infrastructure Unit Costs Vs Target Benchmarks Ppt Professional Example PDF
These indicators assist IT leaders in stewarding technology expenditures and investments, and they are essential to managing the IT company. These measures aid in the management of the departments financial health and may indicate levers for cost reduction, improved resource allocation, and enhanced accountability. Deliver and pitch your topic in the best possible manner with this financial fundamental metrics infrastructure unit costs vs target benchmarks ppt professional example pdf. Use them to share invaluable insights on outsourcing, organizations, budget and impress your audience. This template can be altered and modified as per your expectations. So, grab it now.
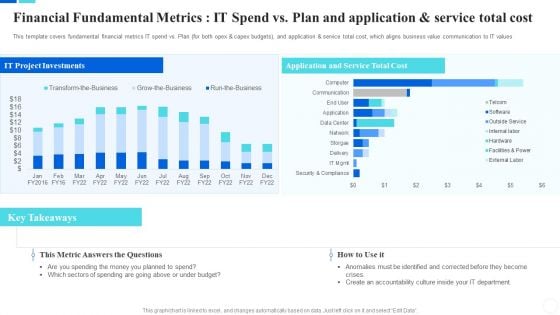
Communicate Company Value To Your Stakeholders Financial Fundamental Metrics Graphics PDF
These indicators assist IT leaders in stewarding technology expenditures and investments, and they are essential to managing the IT company. These measures aid in the management of the departments financial health and may indicate levers for cost reduction, improved resource allocation, and enhanced accountability. Deliver and pitch your topic in the best possible manner with this communicate company value to your stakeholders financial fundamental metrics graphics pdf. Use them to share invaluable insights on organizations, budget, protect and impress your audience. This template can be altered and modified as per your expectations. So, grab it now.

How To Evaluate And Develop The Organizational Value Of IT Service Financial Fundamental Metrics Slides PDF
These indicators assist IT leaders in stewarding technology expenditures and investments, and they are essential to managing the IT company. These measures aid in the management of the departments financial health and may indicate levers for cost reduction, improved resource allocation, and enhanced accountability. Deliver and pitch your topic in the best possible manner with this how to evaluate and develop the organizational value of it service financial fundamental metrics slides pdf. Use them to share invaluable insights on organizations, budget, business, efficiency and impress your audience. This template can be altered and modified as per your expectations. So, grab it now.
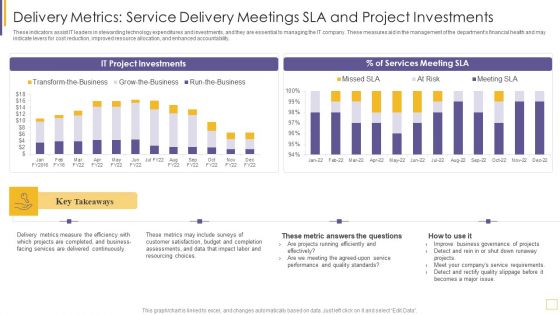
Guidelines For Exhibiting Business Value Of Information And Technology Delivery Metrics Service Portrait PDF
These indicators assist IT leaders in stewarding technology expenditures and investments, and they are essential to managing the IT company. These measures aid in the management of the departments financial health and may indicate levers for cost reduction, improved resource allocation, and enhanced accountability. Deliver and pitch your topic in the best possible manner with this guidelines for exhibiting business value of information and technology delivery metrics service portrait pdf. Use them to share invaluable insights on metrics measure, services, budget, resourcing and impress your audience. This template can be altered and modified as per your expectations. So, grab it now.
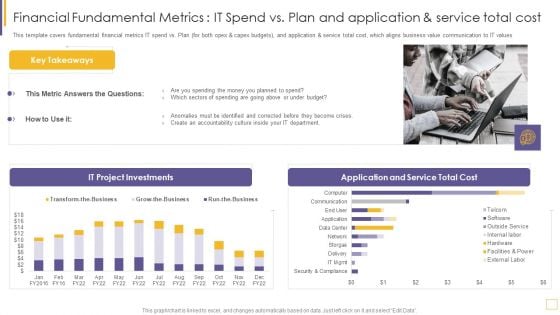
Guidelines For Exhibiting Business Value Of Information And Technology Financial Fundamental Metrics IT Spend Mockup PDF
These indicators assist IT leaders in stewarding technology expenditures and investments, and they are essential to managing the IT company. These measures aid in the management of the departments financial health and may indicate levers for cost reduction, improved resource allocation, and enhanced accountability. Deliver an awe inspiring pitch with this creative guidelines for exhibiting business value of information and technology financial fundamental metrics it spend mockup pdf bundle. Topics like metric, organizations, budget, demonstrate can be discussed with this completely editable template. It is available for immediate download depending on the needs and requirements of the user.
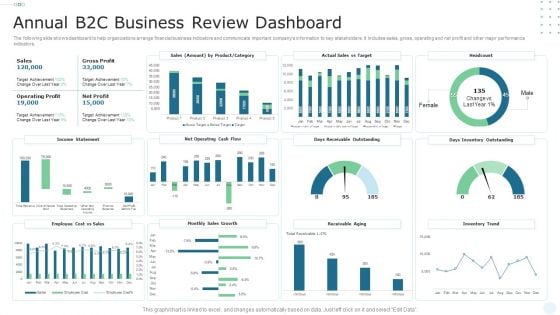
Annual B2C Business Review Dashboard Microsoft PDF
The following slide shows dashboard to help organizations arrange financial business indicators and communicate important companys information to key stakeholders. It includes sales, gross, operating and net profit and other major performance indicators. Showcasing this set of slides titled Annual B2C Business Review Dashboard Microsoft PDF. The topics addressed in these templates are Gross Profit, Sales, Operating Profit. All the content presented in this PPT design is completely editable. Download it and make adjustments in color, background, font etc. as per your unique business setting.
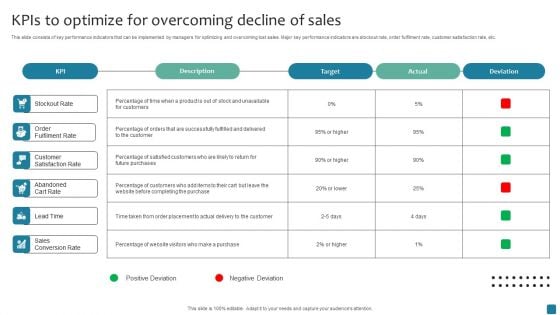
Kpis To Optimize For Overcoming Decline Of Sales Mockup PDF
This slide consists of key performance indicators that can be implemented by managers for optimizing and overcoming lost sales. Major key performance indicators are stockout rate, order fulfilment rate, customer satisfaction rate, etc. Showcasing this set of slides titled Kpis To Optimize For Overcoming Decline Of Sales Mockup PDF. The topics addressed in these templates are Target, Actual, Deviation. All the content presented in this PPT design is completely editable. Download it and make adjustments in color, background, font etc. as per your unique business setting.
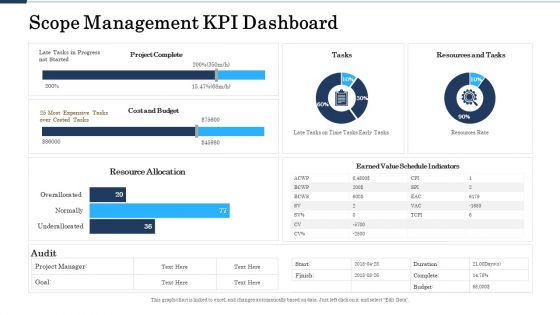
Project Deliverables Administration Outline Scope Management KPI Dashboard Ppt Inspiration Graphics Template PDF
Deliver an awe-inspiring pitch with this creative project deliverables administration outline scope management kpi dashboard ppt inspiration graphics template pdf bundle. Topics like project complete, tasks, resources and tasks, cost and budget, resource allocation, earned value schedule indicators can be discussed with this completely editable template. It is available for immediate download depending on the needs and requirements of the user.
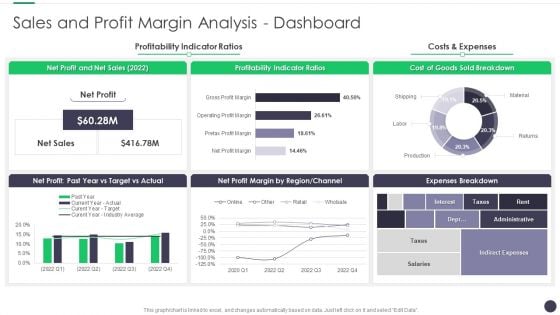
Finance And Accounting Online Conversion Plan Sales And Profit Margin Analysis Dashboard Demonstration PDF
Deliver and pitch your topic in the best possible manner with this Finance And Accounting Online Conversion Plan Sales And Profit Margin Analysis Dashboard Demonstration PDF. Use them to share invaluable insights on Profitability Indicator, Goods Breakdown, Expenses Breakdown and impress your audience. This template can be altered and modified as per your expectations. So, grab it now.
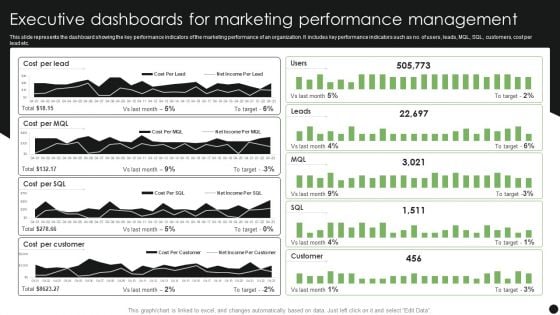
Executive Dashboards For Marketing Performance Management Slides PDF
This slide represents the dashboard showing the key performance indicators of the marketing performance of an organization. It includes key performance indicators such as no. of users, leads, MQL, SQL, customers, cost per lead etc. Pitch your topic with ease and precision using this Executive Dashboards For Marketing Performance Management Slides PDF. This layout presents information on Cost Per Lead, Cost Per Customer. It is also available for immediate download and adjustment. So, changes can be made in the color, design, graphics or any other component to create a unique layout.
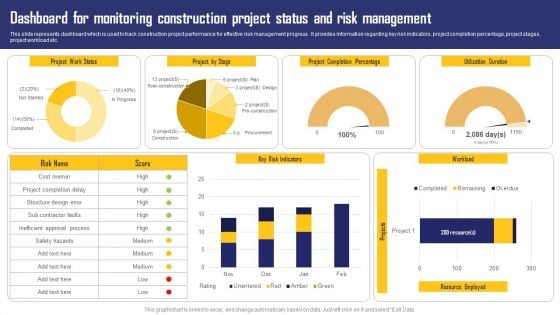
Dashboard For Monitoring Construction Project Status And Risk Management Ideas PDF
This slide represents dashboard which is used to track construction project performance for effective risk management progress . It provides information regarding key risk indicators, project completion percentage, project stages, project workload etc. Pitch your topic with ease and precision using this Dashboard For Monitoring Construction Project Status And Risk Management Ideas PDF. This layout presents information on Project Completion Percentage, Key Risk Indicators, Project By Stage. It is also available for immediate download and adjustment. So, changes can be made in the color, design, graphics or any other component to create a unique layout.
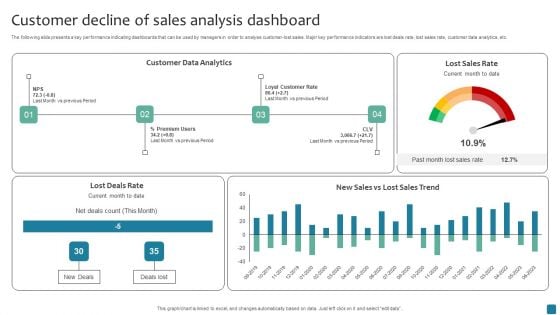
Customer Decline Of Sales Analysis Dashboard Rules PDF
The following slide presents a key performance indicating dashboards that can be used by managers in order to analyse customer-lost sales. Major key performance indicators are lost deals rate, lost sales rate, customer data analytics, etc. Pitch your topic with ease and precision using this Customer Decline Of Sales Analysis Dashboard Rules PDF. This layout presents information on Customer Data Analytics. It is also available for immediate download and adjustment. So, changes can be made in the color, design, graphics or any other component to create a unique layout.
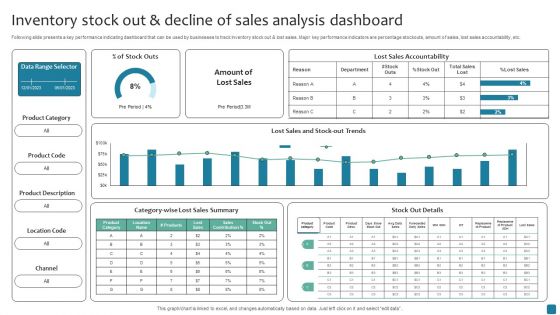
Inventory Stock Out And Decline Of Sales Analysis Dashboard Inspiration PDF
Following slide presents a key performance indicating dashboard that can be used by businesses to track Inventory stock out and lost sales. Major key performance indicators are percentage stockouts, amount of sales, lost sales accountability, etc. Pitch your topic with ease and precision using this Inventory Stock Out And Decline Of Sales Analysis Dashboard Inspiration PDF. This layout presents information on Lost Sales Summary, Stock Out Details It is also available for immediate download and adjustment. So, changes can be made in the color, design, graphics or any other component to create a unique layout.
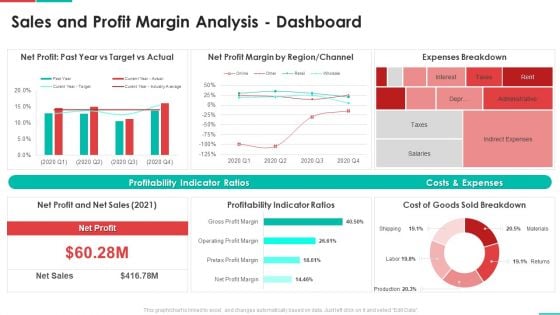
Roadmap For Financial Accounting Transformation Sales And Profit Margin Analysis Dashboard Pictures PDF
Deliver an awe inspiring pitch with this creative roadmap for financial accounting transformation sales and profit margin analysis dashboard pictures pdf bundle. Topics like profitability indicator ratios, costs and expenses, expenses breakdown can be discussed with this completely editable template. It is available for immediate download depending on the needs and requirements of the user.
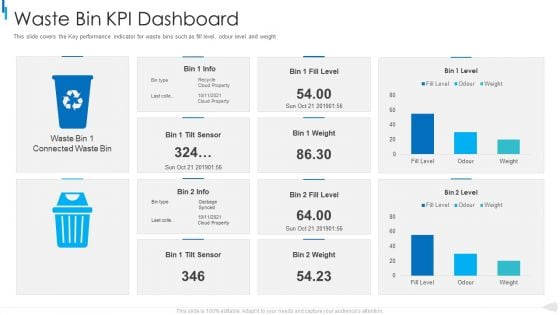
MSW Management Waste Bin Kpi Dashboard Clipart PDF
This slide covers the Key performance indicator for waste bins such as fill level, odour level and weight. Deliver an awe inspiring pitch with this creative MSW Management Waste Bin Kpi Dashboard Clipart Pdf bundle. Topics like waste bin kpi dashboard can be discussed with this completely editable template. It is available for immediate download depending on the needs and requirements of the user.
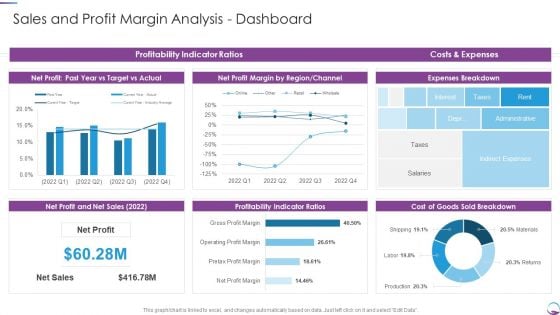
Sales And Profit Margin Analysis Dashboard Introduction PDF
Deliver an awe inspiring pitch with this creative Sales And Profit Margin Analysis Dashboard Introduction PDF bundle. Topics like Net Sales, Net Profit, Profitability Indicator Ratios can be discussed with this completely editable template. It is available for immediate download depending on the needs and requirements of the user.
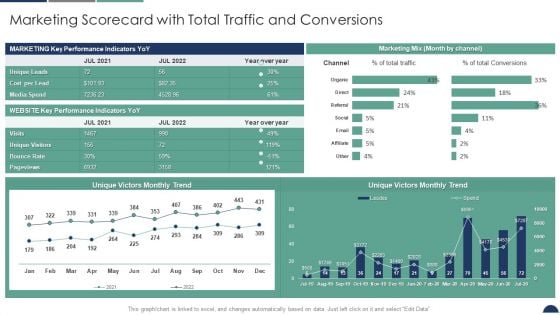
Marketing Scorecard With Total Traffic And Conversions Sales And Marketing Scorecard Topics PDF
Deliver and pitch your topic in the best possible manner with this Marketing Scorecard With Total Traffic And Conversions Sales And Marketing Scorecard Topics PDF. Use them to share invaluable insights on Key Performance Indicators, Marketing Mix, Bounce Rate and impress your audience. This template can be altered and modified as per your expectations. So, grab it now.
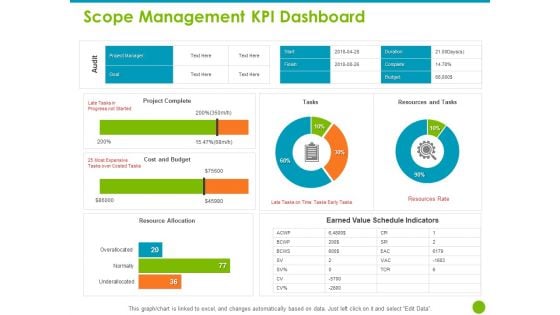
Project Capabilities Scope Management KPI Dashboard Ppt Slide Download PDF
Presenting this set of slides with name project capabilities scope management kpi dashboard ppt slide download pdf. The topics discussed in these slides are project complete, cost and budget, resource allocation, earned value schedule indicators, resources and tasks. This is a completely editable PowerPoint presentation and is available for immediate download. Download now and impress your audience.
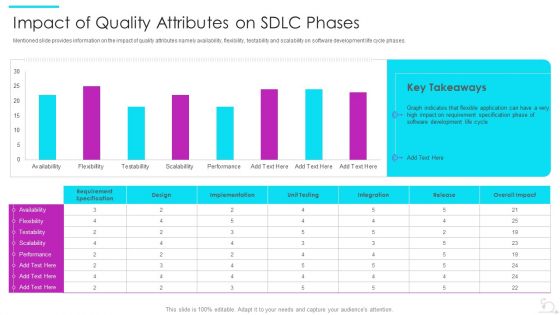
Agile Software Development Lifecycle IT Impact Of Quality Attributes On SDLC Phases Clipart PDF
Mentioned slide provides information on the impact of quality attributes namely availability, flexibility, testability and scalability on software development life cycle phases.Deliver an awe inspiring pitch with this creative agile software development lifecycle it impact of quality attributes on sdlc phases clipart pdf bundle. Topics like indicates that flexible, impact on requirement, software development can be discussed with this completely editable template. It is available for immediate download depending on the needs and requirements of the user.
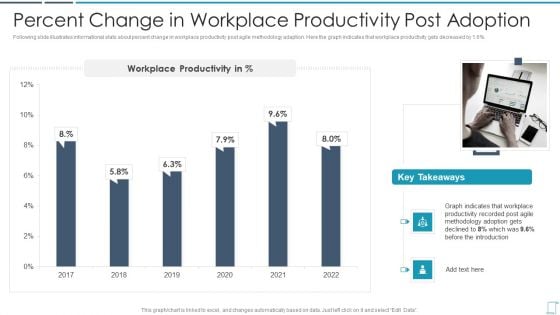
Professional Scrum Master Certification Training Program IT Percent Change In Workplace Template PDF
Following slide illustrates informational stats about percent change in workplace productivity post agile methodology adaption. Here the graph indicates that workplace productivity gets decreased by 1.6persent.Deliver and pitch your topic in the best possible manner with this professional scrum master certification training program it percent change in workplace template pdf Use them to share invaluable insights on productivity, methodology adoption, before the introduction and impress your audience. This template can be altered and modified as per your expectations. So, grab it now.
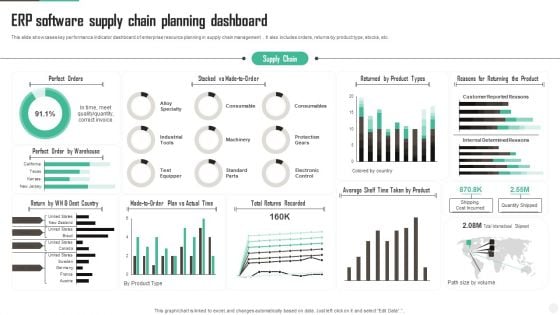
ERP Software Supply Chain Planning Dashboard Diagrams PDF
This slide showcases key performance indicator dashboard of enterprise resource planning in supply chain management . It also includes orders, returns by product type, stocks, etc. Showcasing this set of slides titled ERP Software Supply Chain Planning Dashboard Diagrams PDF Sample. The topics addressed in these templates are Perfect Orders, Dest Country, Actual Time. All the content presented in this PPT design is completely editable. Download it and make adjustments in color, background, font etc. as per your unique business setting.
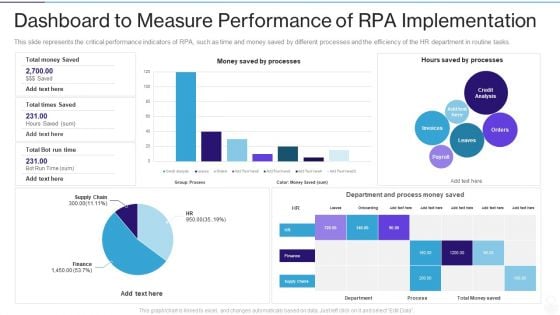
RPA IT Dashboard To Measure Performance Of RPA Implementation Ppt Professional Pictures PDF
This slide represents the critical performance indicators of RPA, such as time and money saved by different processes and the efficiency of the HR department in routine tasks. Deliver an awe inspiring pitch with this creative rpa it dashboard to measure performance of rpa implementation ppt professional pictures pdf bundle. Topics like processes, finance, supply chain, analysis, payroll can be discussed with this completely editable template. It is available for immediate download depending on the needs and requirements of the user.
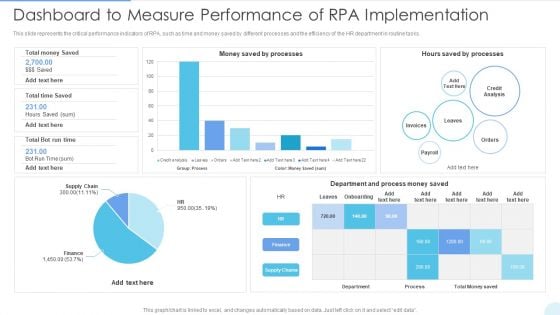
Dashboard To Measure Performance Of RPA Implementation Mockup PDF
This slide represents the critical performance indicators of RPA, such as time and money saved by different processes and the efficiency of the HR department in routine tasks. Deliver and pitch your topic in the best possible manner with this Dashboard To Measure Performance Of RPA Implementation Mockup PDF. Use them to share invaluable insights on Credit Analysis, Department And Process and impress your audience. This template can be altered and modified as per your expectations. So, grab it now.
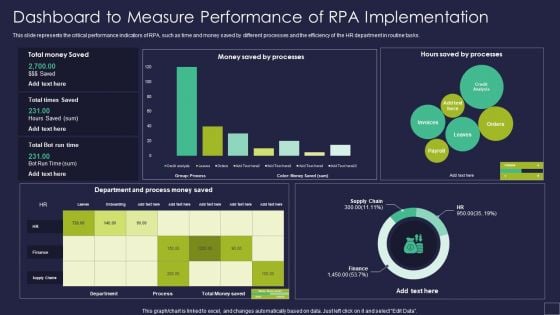
Dashboard To Measure Performance Of RPA Implementation Robotic Process Automation Technology Slides PDF
This slide represents the critical performance indicators of RPA, such as time and money saved by different processes and the efficiency of the HR department in routine tasks. Deliver an awe inspiring pitch with this creative Dashboard To Measure Performance Of RPA Implementation Robotic Process Automation Technology Slides PDF bundle. Topics like Department Process, Saved Processes, Hours Saved can be discussed with this completely editable template. It is available for immediate download depending on the needs and requirements of the user.
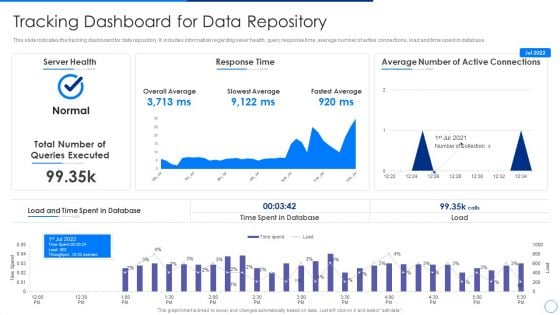
Scale Up Plan For Data Inventory Model Tracking Dashboard For Data Repository Themes PDF
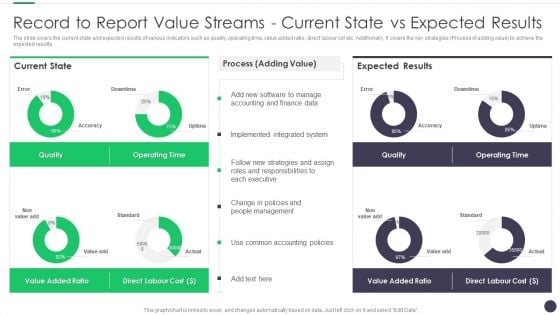
Finance And Accounting Online Conversion Plan Record To Report Value Streams Mockup PDF
The slide covers the current state and expected results of various indicators such as quality, operating time, value added ratio, direct labour cot etc. Additionally, it covers the key strategies Process of adding value to achieve the expected results. Deliver an awe inspiring pitch with this creative Finance And Accounting Online Conversion Plan Record To Report Value Streams Mockup PDF bundle. Topics like Operating Time, Process, Expected Results can be discussed with this completely editable template. It is available for immediate download depending on the needs and requirements of the user.
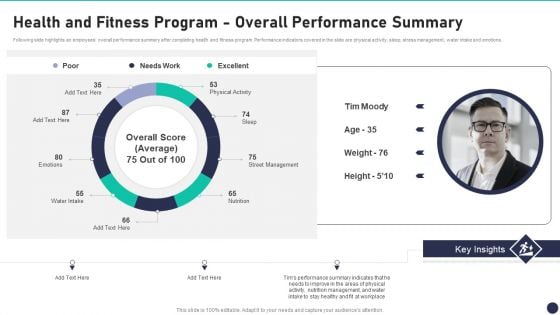
Workspace Wellness Playbook Health And Fitness Program Overall Performance Summary Guidelines PDF
Following slide highlights an employees overall performance summary after completing health and fitness program. Performance indicators covered in the slide are physical activity, sleep, stress management, water intake and emotions. Deliver an awe inspiring pitch with this creative workspace wellness playbook health and fitness program overall performance summary guidelines pdf bundle. Topics like health and fitness program overall performance summary can be discussed with this completely editable template. It is available for immediate download depending on the needs and requirements of the user.
Tactical Planning And Analyzing Organizational Goals Icon Infographics PDF
This slide defines the dashboard for analyzing the sales key performance indicators KPIs. It includes information related to the number of sales, revenue, profit, and cost. Showcasing this set of slides titled Tactical Planning And Analyzing Organizational Goals Icon Infographics PDF. The topics addressed in these templates are Cost Breakdown, Sales Revenue, Accumulated Revenue. All the content presented in this PPT design is completely editable. Download it and make adjustments in color, background, font etc. as per your unique business setting.
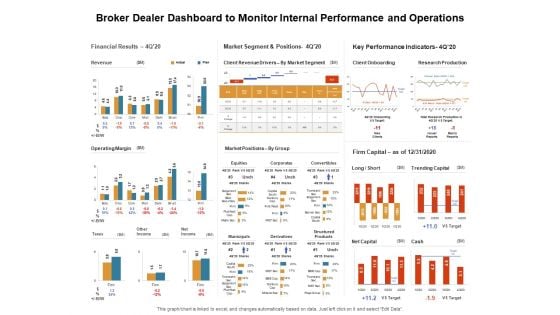
Venture Capitalist Control Board Broker Dealer Dashboard To Monitor Internal Performance And Operations Information PDF
Presenting this set of slides with name venture capitalist control board broker dealer dashboard to monitor internal performance and operations information pdf. The topics discussed in these slides are financial results, market segment and positions, key performance indicators. This is a completely editable PowerPoint presentation and is available for immediate download. Download now and impress your audience.
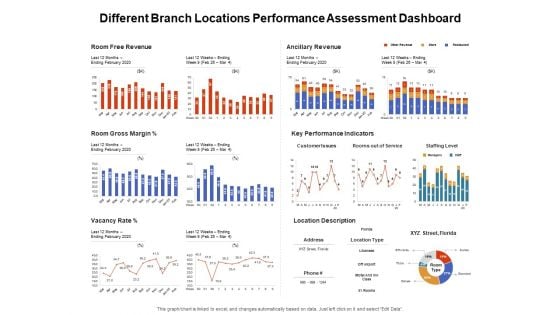
Venture Capitalist Control Board Different Branch Locations Performance Assessment Dashboard Graphics PDF
Presenting this set of slides with name venture capitalist control board different branch locations performance assessment dashboard graphics pdf. The topics discussed in these slides are room free revenue, ancillary revenue, key performance indicators, room gross margin, location description, vacancy rate. This is a completely editable PowerPoint presentation and is available for immediate download. Download now and impress your audience.

Annual Business Financial Summary Dashboard Themes PDF
This slide shows annual financial report dashboard of company to monitor yearly business performance. It includes various indicators such as revenue, net profits, costs and breakdown of cost. Showcasing this set of slides titled Annual Business Financial Summary Dashboard Themes PDF. The topics addressed in these templates are Revenue, Costs, Net Profit. All the content presented in this PPT design is completely editable. Download it and make adjustments in color, background, font etc. as per your unique business setting.
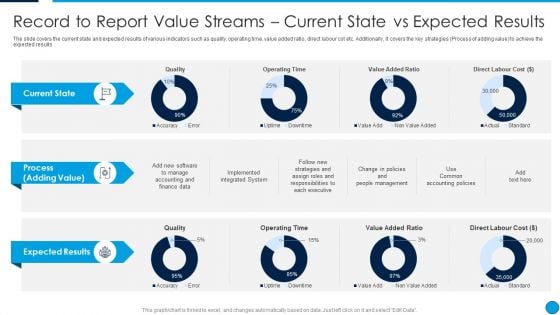
Summary Financial Record To Report Value Streams Current State Vs Expected Results Template PDF
The slide covers the current state and expected results of various indicators such as quality, operating time, value added ratio, direct labour cot etc. Additionally, it covers the key strategies Process of adding value to achieve the expected results. Deliver an awe inspiring pitch with this creative Summary Financial Record To Report Value Streams Current State Vs Expected Results Template PDF bundle. Topics like Current State, Process, Adding Value, Expected Results, Operating Time, Value Added Ratio can be discussed with this completely editable template. It is available for immediate download depending on the needs and requirements of the user.
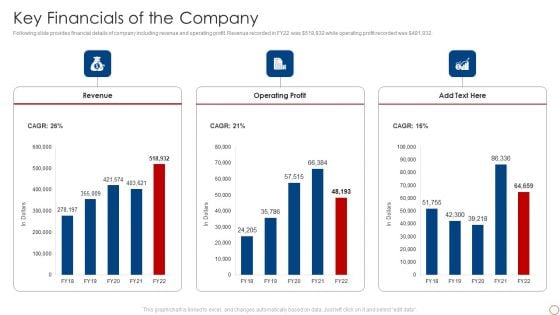
Kpis For Evaluating Business Sustainability Key Financials Of The Company Rules PDF
Following slide provides financial details of company including revenue and operating profit. Revenue recorded in FY22 was dollar 518,932 while operating profit recorded was dollar 481,932. Deliver and pitch your topic in the best possible manner with this Kpis For Evaluating Business Sustainability Financial Performance Indicator Dashboard Demonstration PDF. Use them to share invaluable insights on Revenue, Operating Profit and impress your audience. This template can be altered and modified as per your expectations. So, grab it now.
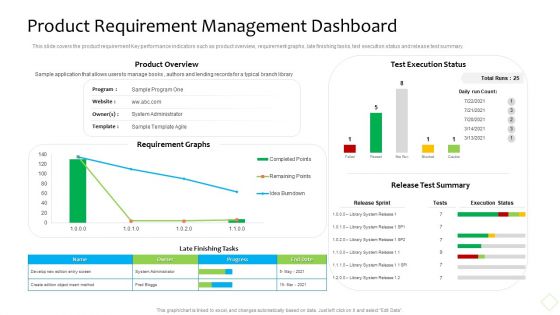
Product Demand Administration Product Requirement Management Dashboard Themes PDF
This slide covers the product requirement Key performance indicators such as product overview, requirement graphs, late finishing tasks, text execution status and release test summary. Deliver and pitch your topic in the best possible manner with this product demand administration product requirement management dashboard themes pdf. Use them to share invaluable insights on develop, progress, system and impress your audience. This template can be altered and modified as per your expectations. So, grab it now.
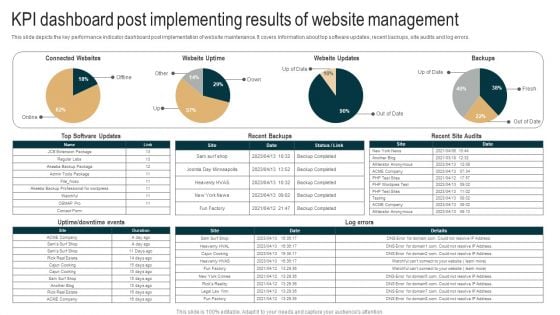
KPI Dashboard Post Implementing Results Of Website Management Themes PDF
This slide depicts the key performance indicator dashboard post implementation of website maintenance. It covers information about top software updates, recent backups, site audits and log errors. Showcasing this set of slides titled KPI Dashboard Post Implementing Results Of Website Management Themes PDF. The topics addressed in these templates are Website Updates, Website Uptime, Connected Websites. All the content presented in this PPT design is completely editable. Download it and make adjustments in color, background, font etc. as per your unique business setting.

Evaluating Projected Vs Actual Sales Performance Diagrams PDF
The following slide depicts the evaluation of existing sales performance to set future standards and determine opportunities for improvement. It mainly includes key performance indicators KPIs such as pipeline, forecast, attainment, gap etc. There are so many reasons you need a Evaluating Projected Vs Actual Sales Performance Diagrams PDF. The first reason is you can not spend time making everything from scratch, Thus, Slidegeeks has made presentation templates for you too. You can easily download these templates from our website easily.
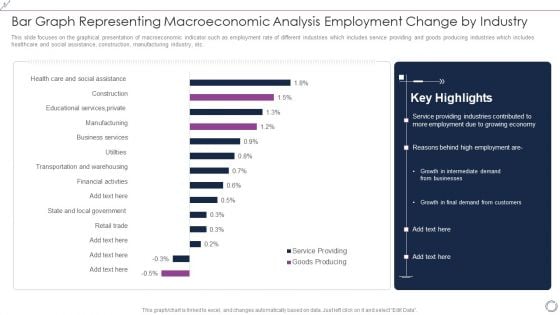
Bar Graph Representing Macroeconomic Analysis Employment Change By Industry Background PDF
This slide focuses on the graphical presentation of macroeconomic indicator such as employment rate of different industries which includes service providing and goods producing industries which includes healthcare and social assistance, construction, manufacturing industry, etc. Pitch your topic with ease and precision using this Bar Graph Representing Macroeconomic Analysis Employment Change By Industry Background PDF. This layout presents information on Goods Producing, Service Providing, Financial, Business. It is also available for immediate download and adjustment. So, changes can be made in the color, design, graphics or any other component to create a unique layout.
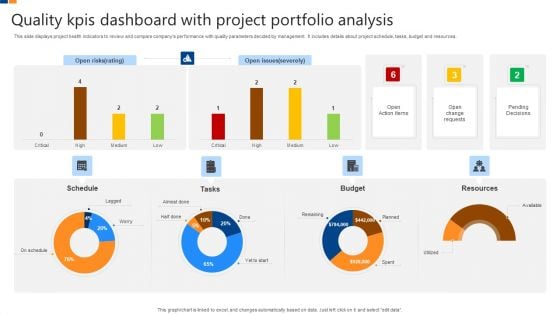
Quality Kpis Dashboard With Project Portfolio Analysis Download PDF
This slide displays project health indicators to review and compare companys performance with quality parameters decided by management. It includes details about project schedule, tasks, budget and resources. Showcasing this set of slides titled Quality Kpis Dashboard With Project Portfolio Analysis Download PDF. The topics addressed in these templates are Schedule, Tasks, Budget, Resources. All the content presented in this PPT design is completely editable. Download it and make adjustments in color, background, font etc. as per your unique business setting.

Commercial Marketing KPI With Return On Investment Diagrams PDF
This slide templates covers about trade marketing key performing indicators with website visitors, leads by channel, social media reach with yearly goal achievement.Pitch your topic with ease and precision using this Commercial Marketing KPI With Return On Investment Diagrams PDF. This layout presents information on Marketing Spend, Return Investment, Budget Remaining. It is also available for immediate download and adjustment. So, changes can be made in the color, design, graphics or any other component to create a unique layout.
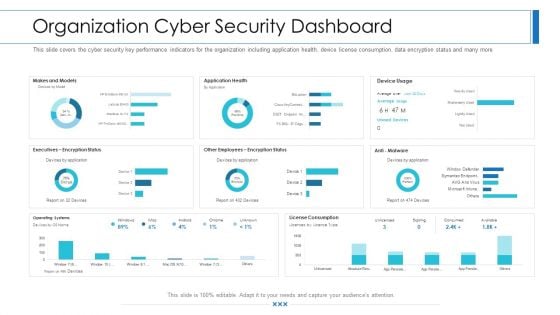
Workforce Security Realization Coaching Plan Organization Cyber Security Dashboard Template PDF
This slide covers the cyber security key performance indicators for the organization including application health, device license consumption, data encryption status and many more. Deliver an awe-inspiring pitch with this creative workforce security realization coaching plan organization cyber security dashboard template pdf bundle. Topics like makes and models, operating systems, encryption status, application health, license consumption can be discussed with this completely editable template. It is available for immediate download depending on the needs and requirements of the user.
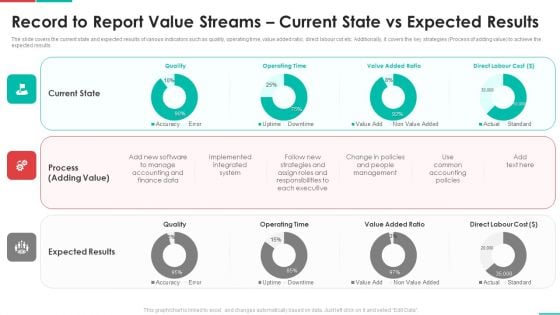
Roadmap For Financial Accounting Transformation Record To Report Value Streams Current State Professional PDF
The slide covers the current state and expected results of various indicators such as quality, operating time, value added ratio, direct labour cot etc. Additionally, it covers the key strategies Process of adding value to achieve the expected results. Deliver and pitch your topic in the best possible manner with this roadmap for financial accounting transformation record to report value streams current state professional pdf. Use them to share invaluable insights on current state, process, expected results and impress your audience. This template can be altered and modified as per your expectations. So, grab it now.
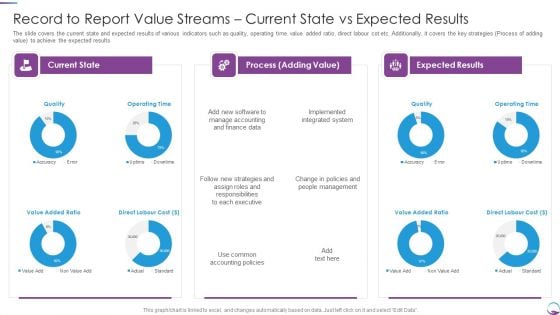
Record To Report Value Streams Current State Vs Expected Results Professional PDF
The slide covers the current state and expected results of various indicators such as quality, operating time, value added ratio, direct labour cot etc. Additionally, it covers the key strategies Process of adding value to achieve the expected results. Deliver and pitch your topic in the best possible manner with this Record To Report Value Streams Current State Vs Expected Results Professional PDF. Use them to share invaluable insights on Management, Strategies, Executive, Finance Data and impress your audience. This template can be altered and modified as per your expectations. So, grab it now.
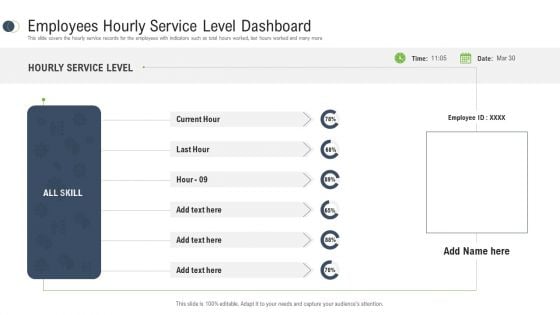
Consumer Complaint Procedure Employees Hourly Service Level Dashboard Ppt Infographics Professional PDF
This slide covers the hourly service records for the employees with indicators such as total hours worked, last hours worked and many more. Deliver and pitch your topic in the best possible manner with this consumer complaint procedure employees hourly service level dashboard ppt infographics professional pdf. Use them to share invaluable insights on employees hourly service level dashboard, hourly service level, skill and impress your audience. This template can be altered and modified as per your expectations. So, grab it now.
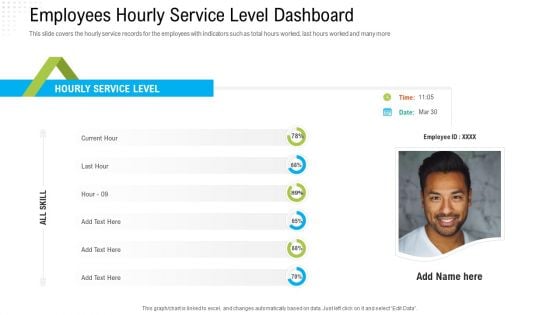
Robotization In Issues Management Employees Hourly Service Level Dashboard Ppt Pictures Maker PDF
This slide covers the hourly service records for the employees with indicators such as total hours worked, last hours worked and many more. Deliver and pitch your topic in the best possible manner with this robotization in issues management employees hourly service level dashboard ppt pictures maker pdf. Use them to share invaluable insights on employees hourly service level dashboard and impress your audience. This template can be altered and modified as per your expectations. So, grab it now.
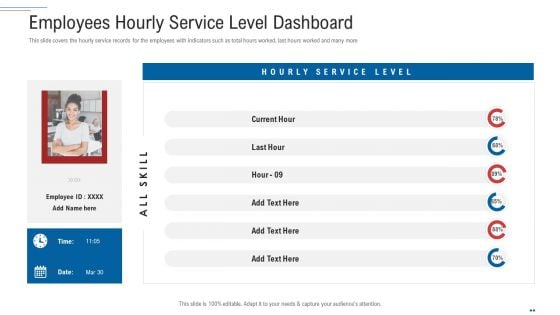
Customer Complaint Handling Process Employees Hourly Service Level Dashboard Rules PDF
This slide covers the hourly service records for the employees with indicators such as total hours worked, last hours worked and many more. Deliver and pitch your topic in the best possible manner with this customer complaint handling process employees hourly service level dashboard rules pdf. Use them to share invaluable insights on employees hourly service level dashboard and impress your audience. This template can be altered and modified as per your expectations. So, grab it now.
Client Support Satisfaction Dashboard Icons PDF
This slide shows KPI dashboard which can be used to track customer satisfaction level. It includes key performance indicators such as total requests, cases by channel, customer satisfaction by subject, etc. Showcasing this set of slides titled Client Support Satisfaction Dashboard Icons PDF. The topics addressed in these templates are Client Support, Satisfaction Dashboard. All the content presented in this PPT design is completely editable. Download it and make adjustments in color, background, font etc. as per your unique business setting.
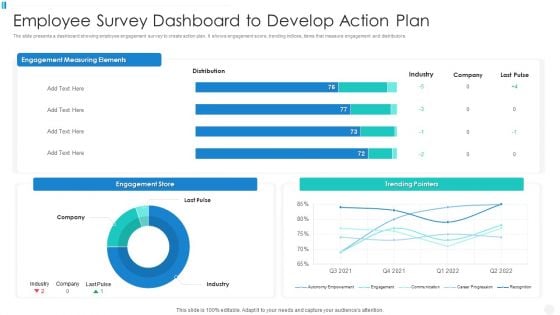
Employee Survey Dashboard To Develop Action Plan Infographics PDF
The slide presents a dashboard showing employee engagement survey to create action plan. It shows engagement score, trending indices, items that measure engagement and distributors. Showcasing this set of slides titled employee survey dashboard to develop action plan infographics pdf The topics addressed in these templates are employee survey dashboard to develop action plan All the content presented in this PPT design is completely editable. Download it and make adjustments in color, background, font etc. as per your unique business setting.
Organization Cyber Security Dashboard Ppt Icon Sample PDF
This slide covers the cyber security key performance indicators for the organization including application health, device license consumption, data encryption status and many more Deliver and pitch your topic in the best possible manner with this organization cyber security dashboard ppt icon sample pdf. Use them to share invaluable insights on makes and models, application health, license consumption, operating systems and impress your audience. This template can be altered and modified as per your expectations. So, grab it now.
Waste Bin Kpi Dashboard Ppt PowerPoint Presentation Icon Show PDF
This slide covers the Key performance indicator for waste bins such as fill level, odour level and weight. Deliver an awe inspiring pitch with this creative waste bin kpi dashboard ppt powerpoint presentation icon show pdf bundle. Topics like waste bin kpi dashboard can be discussed with this completely editable template. It is available for immediate download depending on the needs and requirements of the user.
Online Consumer Engagement Website Traffic Performance Measure Icons PDF
This slide provides information regarding the dashboard that contains various performance indicators that are measured to determine engagement performance. Deliver and pitch your topic in the best possible manner with this online consumer engagement website traffic performance measure icons pdf. Use them to share invaluable insights on analysis, performance, measure, average and impress your audience. This template can be altered and modified as per your expectations. So, grab it now.
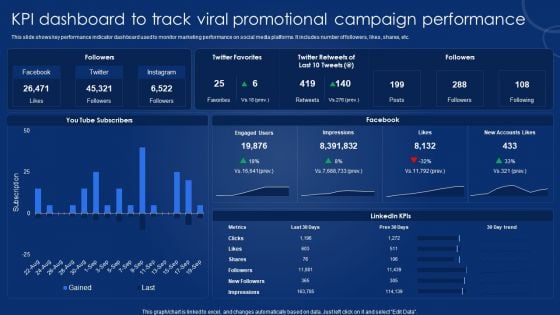
KPI Dashboard To Track Viral Promotional Campaign Performance Icons PDF


 Continue with Email

 Home
Home


