Meter Chart
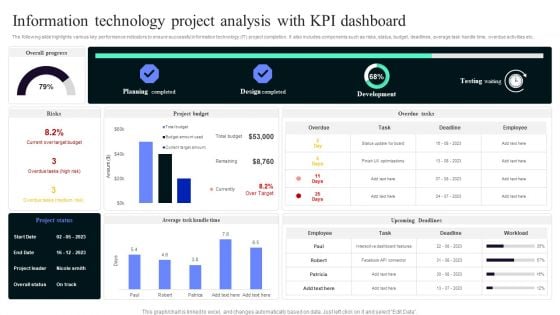
Information Technology Project Analysis With Kpi Dashboard Portrait PDF
The following slide highlights various key performance indicators to ensure successful information technology IT project completion. It also includes components such as risks, status, budget, deadlines, average task handle time, overdue activities etc. Pitch your topic with ease and precision using this Information Technology Project Analysis With Kpi Dashboard Portrait PDF. This layout presents information on Planning Completed, Design Completed, Development . It is also available for immediate download and adjustment. So, changes can be made in the color, design, graphics or any other component to create a unique layout.
Analysis Plan For E Commerce Promotion Tactics Content Performance Tracking Dashboard For Social Media Channels Icons PDF
This slide indicates the content performance tracking dashboard for social media channels providing information regarding the total number of posts, engagement rate, audience sentiments and multiple hashtags performance. Formulating a presentation can take up a lot of effort and time, so the content and message should always be the primary focus. The visuals of the PowerPoint can enhance the presenters message, so our Analysis Plan For E Commerce Promotion Tactics Content Performance Tracking Dashboard For Social Media Channels Icons PDF was created to help save time. Instead of worrying about the design, the presenter can concentrate on the message while our designers work on creating the ideal templates for whatever situation is needed. Slidegeeks has experts for everything from amazing designs to valuable content, we have put everything into Analysis Plan For E Commerce Promotion Tactics Content Performance Tracking Dashboard For Social Media Channels Icons PDF
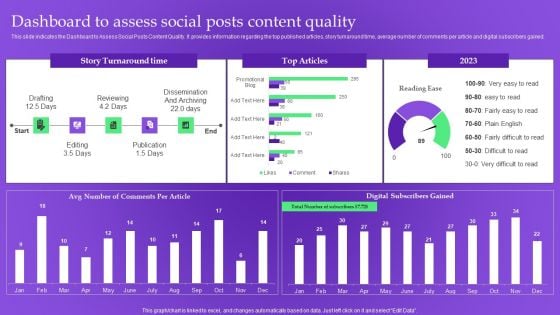
Analysis Plan For E Commerce Promotion Tactics Dashboard To Assess Social Posts Content Quality Sample PDF
This slide indicates the Dashboard to Assess Social Posts Content Quality. It provides information regarding the top published articles, story turnaround time, average number of comments per article and digital subscribers gained. This modern and well arranged Analysis Plan For E Commerce Promotion Tactics Dashboard To Assess Social Posts Content Quality Sample PDF provides lots of creative possibilities. It is very simple to customize and edit with the Powerpoint Software. Just drag and drop your pictures into the shapes. All facets of this template can be edited with Powerpoint no extra software is necessary. Add your own material, put your images in the places assigned for them, adjust the colors, and then you can show your slides to the world, with an animated slide included.
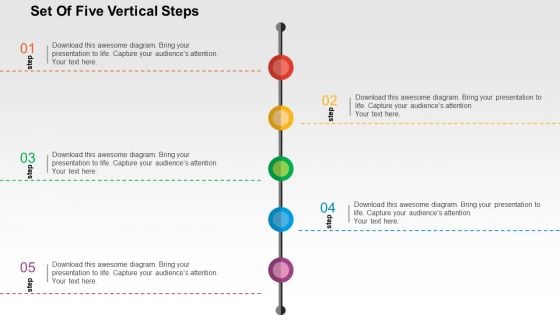
Set Of Five Vertical Steps Powerpoint Templates
This slide has been professionally created for visual representation of steps of a process. The multicolored circles which have been arranged in can be used to depict individual steps in a systematic and organized manner. This template can be used to indicate a link between individuals and can also be used to represent Hierarchy of an organization. It would be one of the easiest ways to graphically represent the flow of information or data from the top level to the lower level or vice versa in a vertical manner. This slide can also be used to depict a planned course of action. Adequate space has been marked for description which can be modified or removed as per individual needs and requirements.
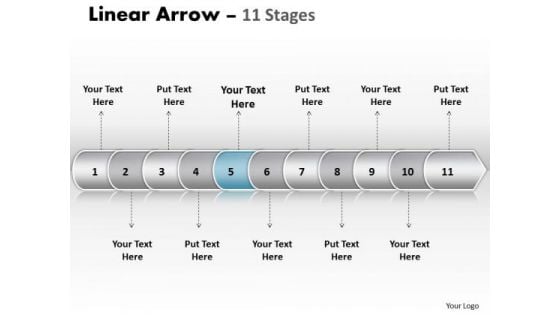
Usa Ppt Template Linear Arrow 11 Phase Diagram Time Management PowerPoint 6 Design
USA PPT template linear arrow 11 phase diagram time management powerpoint 6 design-This linear arrow chart makes information accessible throughout the organization with a collective, visible view of critical data from different perspectives and providing the tools to upcoming business scenarios and plan for change.-USA PPT template linear arrow 11 phase diagram time management powerpoint 6 design-Arrow, Background, Collection, Completed, Concept, Confirmation, Design, Flow, Graph, Graphic, Illustration, Indication, Indicator, Information, Instruction, Interface, Internet, Layout, Measurement, Order, Phase, Pointer, Process, Progress, Reflection, Scale, Shape, Sign Integrate teams with our Usa Ppt Template Linear Arrow 11 Phase Diagram Time Management PowerPoint 6 Design. Download without worries with our money back guaranteee.
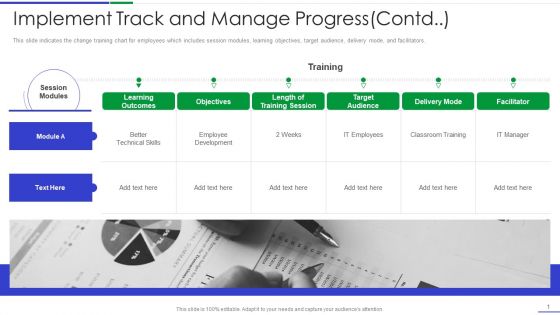
Ultimate Guide To Effective Change Management Process Implement Track And Manage Progress Contd Topics PDF
This slide indicates the change training chart for employees which includes session modules, learning objectives, target audience, delivery mode, and facilitators. Presenting ultimate guide to effective change management process implement track and manage progress contd topics pdf to provide visual cues and insights. Share and navigate important information on one stages that need your due attention. This template can be used to pitch topics like objectives, target audience, facilitator, training, development. In addtion, this PPT design contains high resolution images, graphics, etc, that are easily editable and available for immediate download.
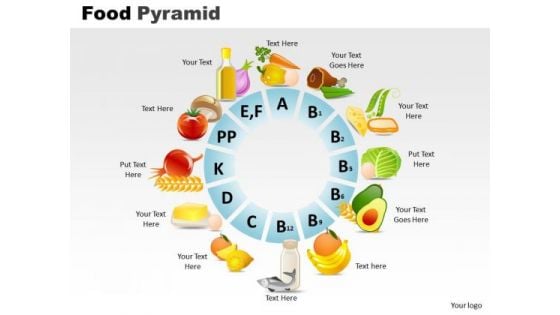
PowerPoint Slides Food Pyramid Editable Ppt Themes
PowerPoint Slides Food Pyramid Editable PPT Themes-A chart indicates various foods filling capacity and nutrition level in an amazing way to inspire people to adopt balance diet-Illustration, balanced, bar, bread, bun, butter, cake, calorie, calories, candy, carbohydrates, cereals, cheese, dairy, diet, egg, fats, fish, food, fresh, fruits, grains, guide, healthy, isolated, market, meat, nutritious, oil, outline, proteins, pyramid, shape, vector, vectors, vegetables-PowerPoint Slides Food Pyramid Editable PPT Themes Ascertain goals with our PowerPoint Slides Food Pyramid Editable Ppt Themes. Download without worries with our money back guaranteee.
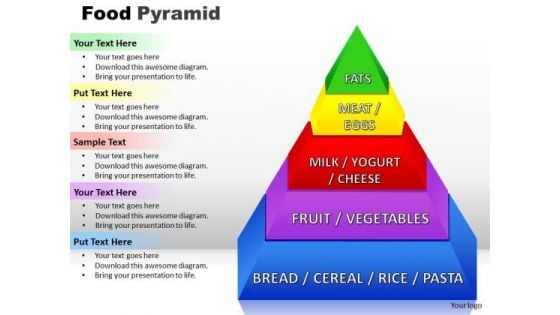
PowerPoint Templates Food Pyramid Growth Ppt Theme
PowerPoint Templates Food Pyramid Growth PPT Theme-This chart indicates various foods filling capacity and nutrition level in an amazing way to inspire people to adopt balance diet.-Illustration, balanced, bar, bread, bun, butter, cake, calorie, calories, candy, carbohydrates, cereals, cheese, dairy, diet, egg, fats, fish, food, fresh, fruits, grains, guide, healthy, isolated, market, meat, nutritious, oil, outline, proteins, pyramid, shape, vector, vectors, vegetables-PowerPoint Templates Food Pyramid Growth PPT Theme Our PowerPoint Templates Food Pyramid Growth Ppt Theme give you the correct feel. Connect with your audience in a convincing way.
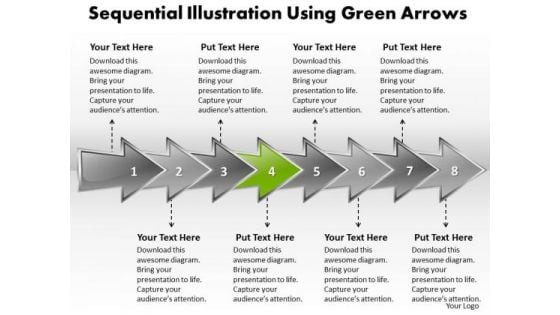
Ppt Sequential Model Using Shapes Arrows PowerPoint Templates
PPT sequential model using shapes arrows powerpoint Templates-This Diagram with an image of Even arrows helps you chart the course of your presentation. Use it to show related information. They are indicators of the path you have in mind.-PPT sequential model using shapes arrows powerpoint Templates-action, arrow, badge, banner, blank, business, button, collection, colorful, concern, connect, decoration, design, direction, element, financial, flow, graph, instruction, involve, label, link, method, navigation, operate, procedure, process, relate, sequence, sequent, series, shape, stage, step, successive, technique Make your audience listen and observe with our Ppt Sequential Model Using Shapes Arrows PowerPoint Templates. You will be at the top of your game.
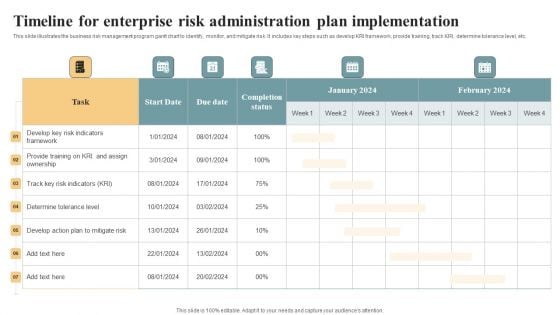
Timeline For Enterprise Risk Administration Plan Implementation Designs PDF
This slide illustrates the business risk management program gantt chart to identify, monitor, and mitigate risk. It includes key steps such as develop KRI framework, provide training, track KRI, determine tolerance level, etc. Showcasing this set of slides titled Timeline For Enterprise Risk Administration Plan Implementation Designs PDF. The topics addressed in these templates are Develop Key Risk, Indicators Framework, Determine Tolerance Level . All the content presented in this PPT design is completely editable. Download it and make adjustments in color, background, font etc. as per your unique business setting.
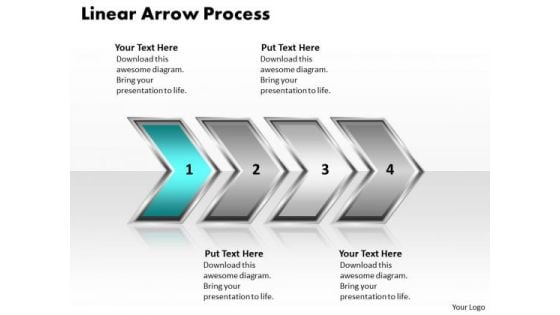
Ppt Linear Flow Of Process Using 4 State PowerPoint Presentation Diagram Templates
PPT linear flow of process using 4 state powerpoint presentation diagram Templates-This templatehelps you chart the course of your presentation. The concept and strategy is your strength. Our template will help pinpoint their viability.-PPT linear flow of process using 4 state powerpoint presentation diagram Templates-Aim, Arrow, Arrowheads, Badge, Border, Click, Connection, Curve, Design, Direction, Download, Element, Fuchsia, Icon, Illustration, Indicator, Internet, Magenta, Mark, Object, Orientation, Pointer, Shadow, Shape, Sign Display an ambitious attitude with our Ppt Linear Flow Of Process Using 4 State PowerPoint Presentation Diagram Templates. Your audience will become believers.
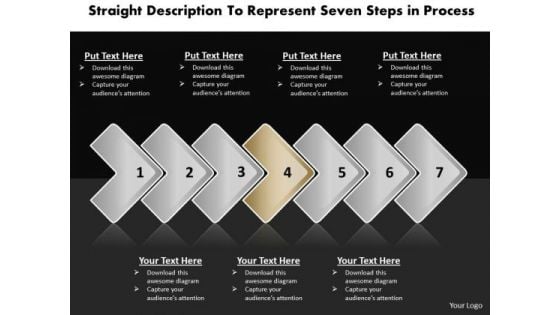
Ppt Horizontal Description To Represent Seven Steps In Process PowerPoint Templates
PPT horizontal description to represent seven steps in process PowerPoint Templates-Use this Business Process Chart which consists of seven text boxes to describe seven different approaches. It imitates affairs, bargaining, barter, buying and selling, contracts, deal, dealings, exchange, free enterprise, game, industrialism, industry, manufacturing, manner, means, measure, mechanism, mode, modus operandi, movement, operation, and outgrowth.-PPT horizontal description to represent seven steps in process PowerPoint Templates-Aim, Arrow, Arrowheads, Badge, Border, Click, Connection, Curve, Design, Direction, Download, Element, Fuchsia, Icon, Illustration, Indicator, Internet, Magenta, Mark, Object, Orientation, Pointer, Shadow, Shape, Sign Experience the striking graphics of our Ppt Horizontal Description To Represent Seven Steps In Process PowerPoint Templates. They bring good quality to the table.
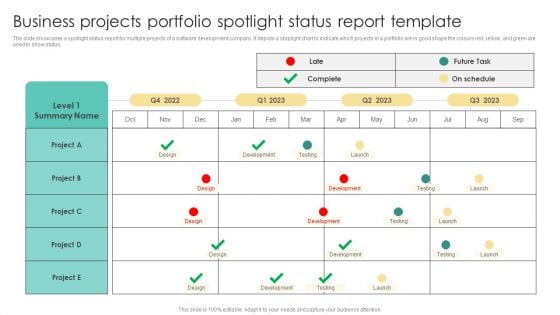
Business Projects Portfolio Spotlight Status Report Template Brochure PDF
The slide showcases a spotlight status report for multiple projects of a software development company. It depicts a stoplight chart to indicate which projects in a portfolio are in good shape the colours red, yellow, and green are used to show status. Showcasing this set of slides titled Business Projects Portfolio Spotlight Status Report Template Brochure PDF. The topics addressed in these templates are Business Projects Portfolio, Spotlight Status, Report Template. All the content presented in this PPT design is completely editable. Download it and make adjustments in color, background, font etc. as per your unique business setting.
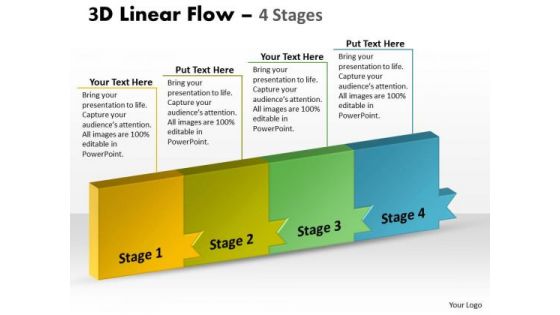
Ppt Template Continous Way To Show 4 Stages Firm Process 1 Design
We present our PPT template continuous way to show 4 stages firm Process 1 design. Use our Advertising PowerPoint Templates because, they are indicators of the path you have in mind. Use our Business PowerPoint Templates because; now imprint them on the minds of your audience via our slides. Use our Shapes PowerPoint Templates because, Goal Pie Chart Template: - You have a clear vision of the cake you want. Use our Process and Flows PowerPoint Templates because, transmit your thoughts via our slides and prod your team to action. Use our Finance PowerPoint Templates because, the core of any organization is the people who work for it. Use these PowerPoint slides for presentations relating to Abstract, Algorithm, Arrow, Business, Chart, Color, Connection, Design, Development, Direction, Element, Flow, Graph, Linear, Management, Model, Organization, Plan, Process, Program, Section, Segment, Set, Sign, Solution, Strategy, Symbol, Technology. The prominent colors used in the PowerPoint template are Yellow, Blue, and Green Deliver education with our Ppt Template Continous Way To Show 4 Stages Firm Process 1 Design. Cover the course in a systematic manner.
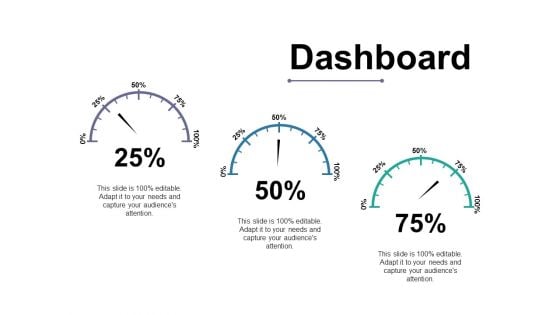
Dashboard Ppt PowerPoint Presentation Styles Themes
This is a dashboard ppt powerpoint presentation styles themes. This is a three stage process. The stages in this process are dashboard, speed, meter, business, marketing.
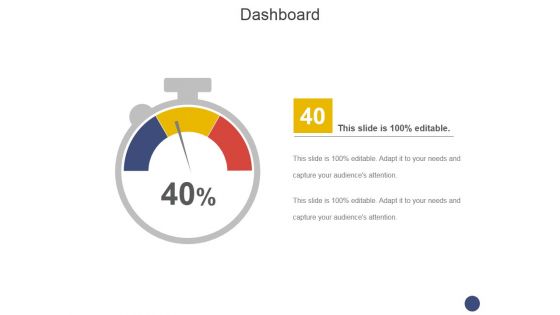
Dashboard Ppt PowerPoint Presentation Layouts Diagrams
This is a dashboard ppt powerpoint presentation layouts diagrams. This is a one stage process. The stages in this process are speed, meter, business, marketing, equipment.
Dashboard Ppt PowerPoint Presentation Outline Icon
This is a dashboard ppt powerpoint presentation outline icon. This is a three stage process. The stages in this process are speed, meter, business, marketing, equipment.
Dashboard Ppt PowerPoint Presentation Pictures Icon
This is a dashboard ppt powerpoint presentation pictures icon. This is a six stage process. The stages in this process are dashboard, meter, measure, speed, marketing.
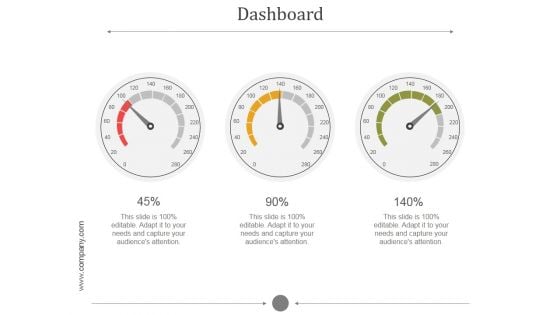
Dashboard Ppt PowerPoint Presentation Show
This is a dashboard ppt powerpoint presentation show. This is a three stage process. The stages in this process are speed, meter, measure, needle, calculate.
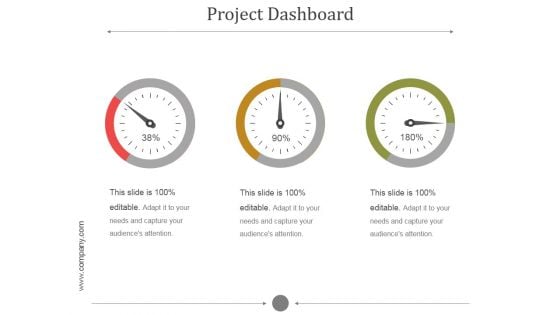
Project Dashboard Ppt PowerPoint Presentation Clipart
This is a project dashboard ppt powerpoint presentation clipart. This is a three stage process. The stages in this process are speed, meter, measure, needle, calculate.
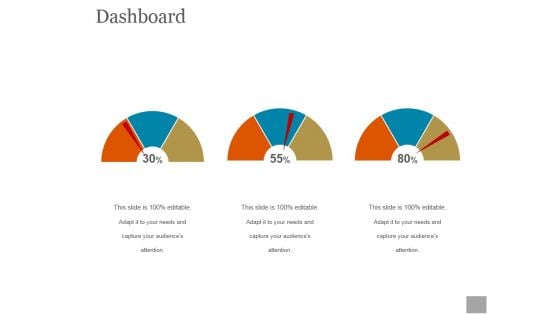
Dashboard Ppt PowerPoint Presentation Styles
This is a dashboard ppt powerpoint presentation styles. This is a three stage process. The stages in this process are dashboard, business, marketing, meter, speed.
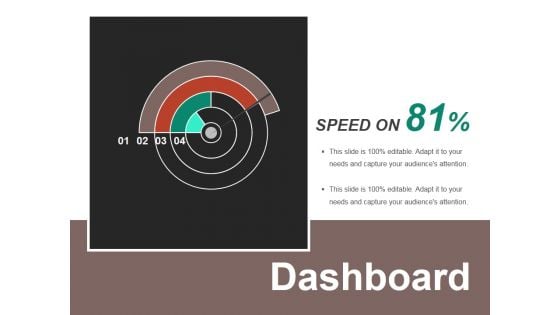
Dashboard Ppt PowerPoint Presentation Summary Format
This is a dashboard ppt powerpoint presentation summary format. This is a one stage process. The stages in this process are speed, meter, dashboard, measure, planning.
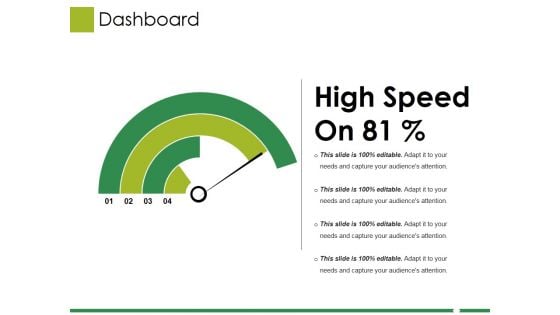
Dashboard Ppt PowerPoint Presentation Model Slide Download
This is a dashboard ppt powerpoint presentation model slide download. This is a one stage process. The stages in this process are finance, planning, meter, speed, dashboard.
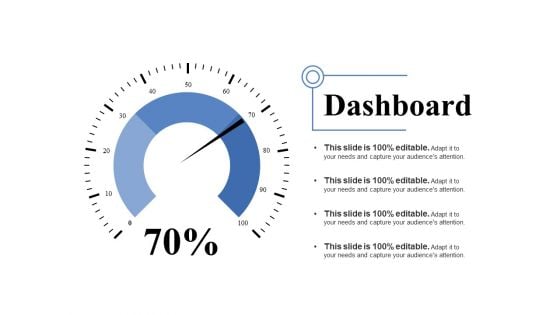
Dashboard Ppt PowerPoint Presentation Summary Maker
This is a dashboard ppt powerpoint presentation summary maker. This is a one stage process. The stages in this process are dashboard, marketing, speed, planning, meter.
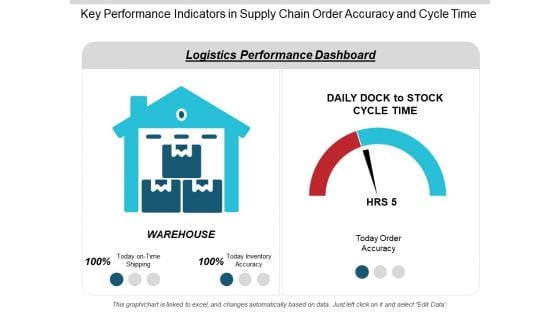
Key Performance Indicators In Supply Chain Order Accuracy And Cycle Time Ppt PowerPoint Presentation Infographics Slideshow
This is a key performance indicators in supply chain order accuracy and cycle time ppt powerpoint presentation infographics slideshow. This is a two stage process. The stages in this process are logistics performance, logistics dashboard, logistics kpis.
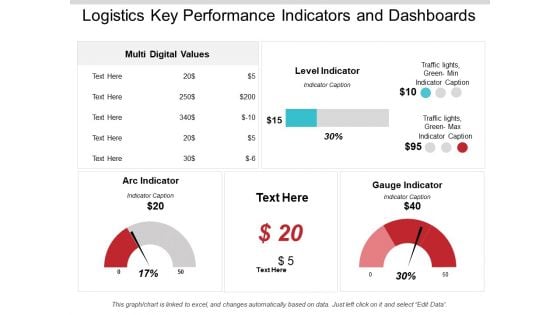
Logistics Key Performance Indicators And Dashboards Ppt PowerPoint Presentation Infographics Background Image
This is a logistics key performance indicators and dashboards ppt powerpoint presentation infographics background image. This is a three stage process. The stages in this process are logistics performance, logistics dashboard, logistics kpis.
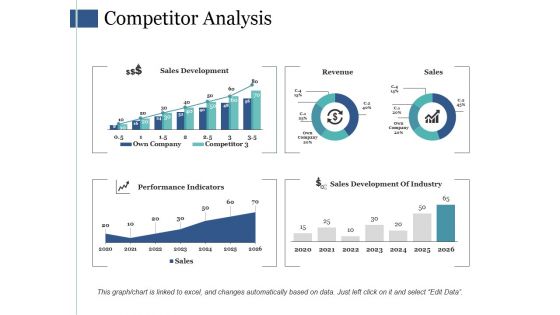
Competitor Analysis Ppt PowerPoint Presentation Slides Visuals
This is a competitor analysis ppt powerpoint presentation slides visuals. This is a four stage process. The stages in this process are sales development, revenue, sales, performance, indicators.
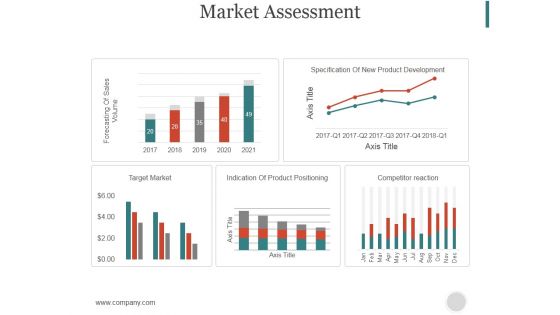
Market Assessment Ppt PowerPoint Presentation Model
This is a market assessment ppt powerpoint presentation model. This is a five stage process. The stages in this process are forecasting of sales volume, specification of new product development, target market, indication of product positioning.
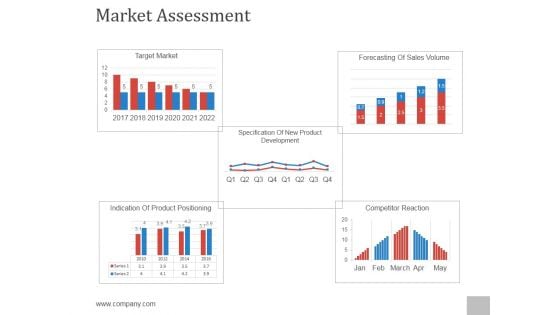
Market Assessment Ppt PowerPoint Presentation Files
This is a market assessment ppt powerpoint presentation files. This is a five stage process. The stages in this process are target market, forecasting of sales volume, indication of product positioning, competitor reaction, specification of new product development.
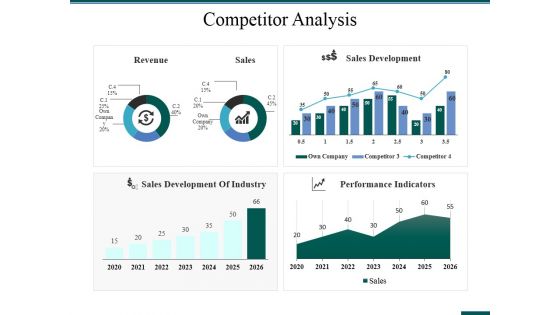
Competitor Analysis Ppt PowerPoint Presentation Model Visual Aids
This is a competitor analysis ppt powerpoint presentation model visual aids. This is a four stage process. The stages in this process are competitor analysis, revenue, sales, sales development, performance indicators.
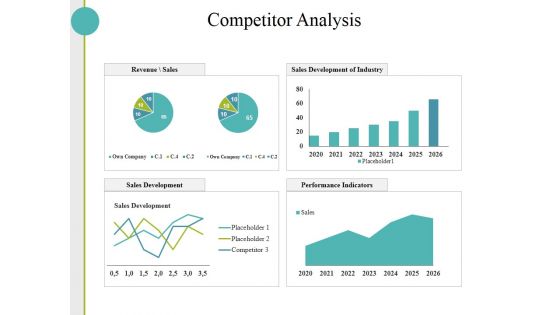
Competitor Analysis Ppt PowerPoint Presentation Layouts Slides
This is a competitor analysis ppt powerpoint presentation layouts slides. This is a four stage process. The stages in this process are sales development, performance indicators, sales development of industry, revenue sales.
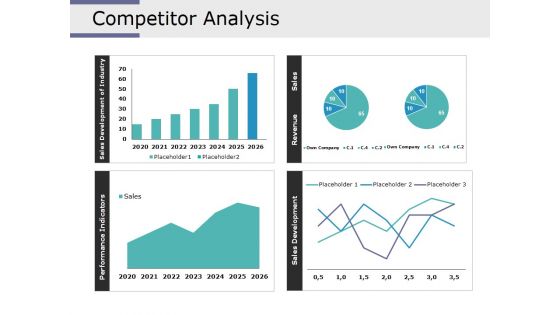
Competitor Analysis Ppt PowerPoint Presentation Model Show
This is a competitor analysis ppt powerpoint presentation model show. This is a four stage process. The stages in this process are performance indicators, sales development of industry, sales development, revenue, sales.
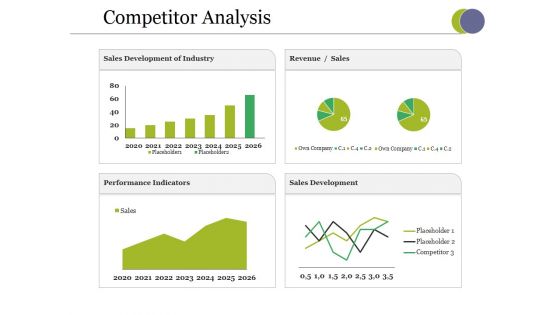
Competitor Analysis Ppt PowerPoint Presentation Samples
This is a competitor analysis ppt powerpoint presentation samples. This is a four stage process. The stages in this process are sales development of industry, performance indicators, sales development, sales.
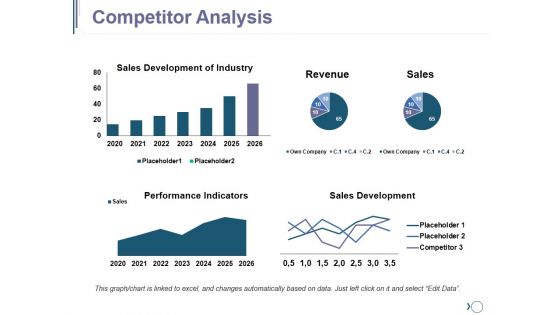
Competitor Analysis Ppt PowerPoint Presentation Outline Ideas
This is a competitor analysis ppt powerpoint presentation outline ideas. This is a four stage process. The stages in this process are sales development of industry, revenue, sales, performance indicators.
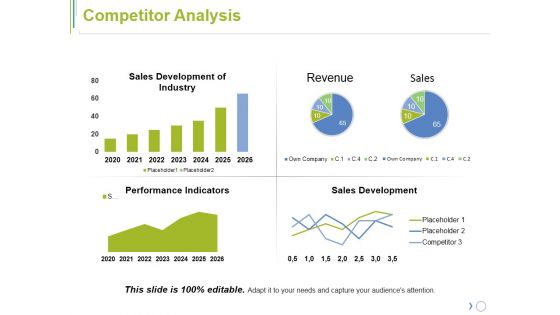
Competitor Analysis Ppt PowerPoint Presentation File Mockup
This is a competitor analysis ppt powerpoint presentation file mockup. This is a four stage process. The stages in this process are sales development of industry, revenue, performance indicators, sales development.
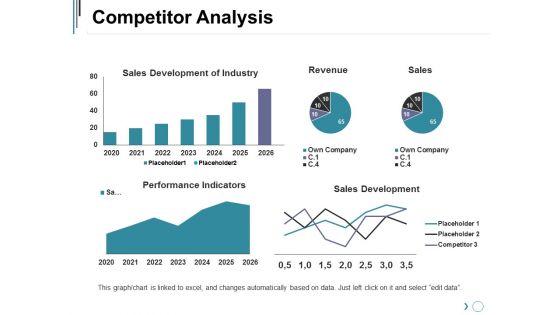
Competitor Analysis Ppt PowerPoint Presentation Layouts Slideshow
This is a competitor analysis ppt powerpoint presentation layouts slideshow. This is a four stage process. The stages in this process are sales development of industry, performance indicators, sales development, revenue, sales.
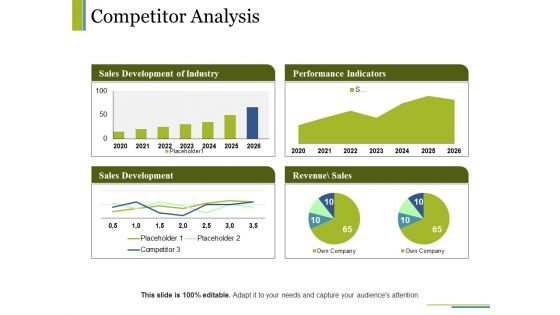
Competitor Analysis Ppt PowerPoint Presentation Visual Aids Model
This is a competitor analysis ppt powerpoint presentation visual aids model. This is a four stage process. The stages in this process are sales development of industry, performance indicators, sales development, revenue sales, business.
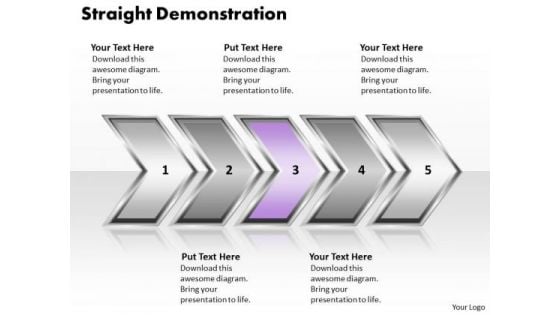
Ppt Straight Demonstration Of Process Using Circular Arrows PowerPoint 2010 Templates
PPT straight demonstration of process using circular arrows powerpoint 2010 Templates-Analyze the six success factors of your business with this linear business chart for Microsoft PowerPoint presentations. This diagram helps you to analyze all the connected ideas and also can be used to show six aspects of an issue. It is a useful captivating tool enables you to define your message in your Marketing PPT presentations. You can apply other 3D Styles and shapes to the slide to enhance your presentations.-PPT straight demonstration of process using circular arrows powerpoint 2010 Templates-Aim, Arrow, Arrowheads, Badge, Border, Click, Connection, Curve, Design, Direction, Download, Element, Fuchsia, Icon, Illustration, Indicator, Internet, Magenta, Mark, Object, Orientation, Pointer, Shadow, Shape, Sign Deliver your address in copybook style. Our Ppt Straight Demonstration Of Process Using Circular Arrows PowerPoint 2010 Templates are the epitome of correctness.
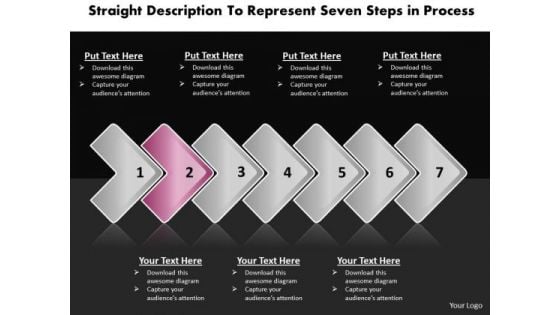
Ppt Continuous Description To Represent Seven Steps Process PowerPoint Templates
PPT continuous description to represent seven steps process PowerPoint Templates-Use this layout to define the outcome and the multiple possibilities in a way that is used in calculation of probabilities, genetics and strategic reasoning. This chart visualizes the concept of process steps, reoccurrences and components or of your company structure or product features. You can change color, size and orientation of any icon to your liking. -PPT continuous description to represent seven steps process PowerPoint Templates-Aim, Arrow, Arrowheads, Badge, Border, Click, Connection, Curve, Design, Direction, Download, Element, Fuchsia, Icon, Illustration, Indicator, Internet, Magenta, Mark, Object, Orientation, Pointer, Shadow, Shape, Sign Carry it off elegantly with our Ppt Continuous Description To Represent Seven Steps Process PowerPoint Templates. Get your thoughts into fashion.
PowerPoint Templates Business Arrows Ppt Slides
PowerPoint Templates Business Arrows PPT Slides-The arrows indicate the progression of the process. Constant monitoring of the processes provides you with opportunities to concentrate on the core competencies in your business and improve the standards for more effective results.-PowerPoint Templates Business Arrows PPT Slides Facilitate your career with our PowerPoint Templates Business Arrows Ppt Slides. Convey your ideas with confidence.
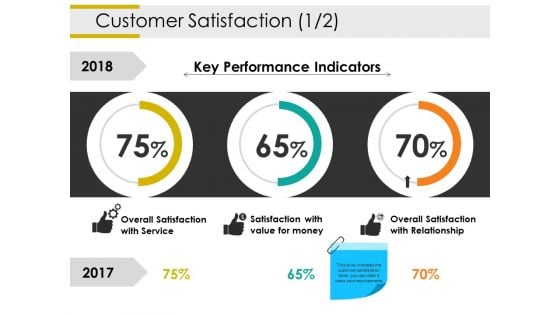
Customer Satisfaction Template 1 Ppt PowerPoint Presentation Portfolio Graphics Example
This is a customer satisfaction template 1 ppt powerpoint presentation portfolio graphics example. This is a three stage process. The stages in this process are overall satisfaction with service, satisfaction with value for money, overall satisfaction with relationship, key performance indicators, business, percentage.
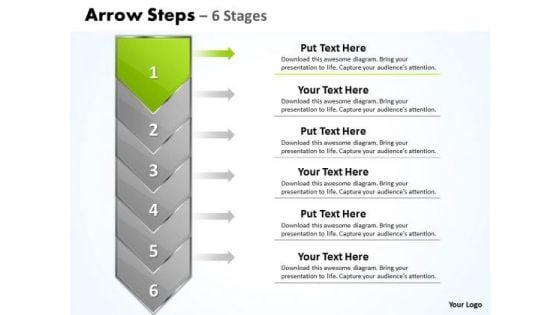
Process PowerPoint Template Arrow 6 Stages 1 Communication Skills Design
We present our process PowerPoint template arrow 6 stages 1 communication skills design. Use our Abstract PowerPoint Templates because; now imprint them on the minds of your audience via our slides. Use our Symbol PowerPoint Templates because, Its also been said that prevention is better than cure, either way you have a store of knowledge for sure. Use our Arrows PowerPoint Templates because, aesthetically designed to make a great first impression this template highlights. Use our Business PowerPoint Templates because, they are indicators of the path you have in mind. Use our Process and Flows PowerPoint Templates because, Brainstorming Light Bulbs: - The atmosphere in the workplace is electric. Use these PowerPoint slides for presentations relating to Arrow, Background, Business, Chart, Diagram, Financial, Graphic, Gray, Icon, Illustration, Management, Orange, Perspective, Planning, Process, Process, Stages, Steps, Text. The prominent colors used in the PowerPoint template are Green, Gray, and Black Announce your arrival on the stage with our Process PowerPoint Template Arrow 6 Stages 1 Communication Skills Design. They allow you to make a grand entry,
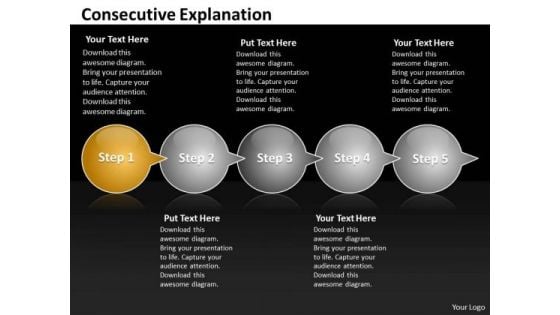
Ppt Consecutive Explanation Of 5 Steps Through Arrows PowerPoint 2010 Templates
PPT consecutive explanation of 5 steps through arrows powerpoint 2010 Templates-This is a type of diagram that represents an algorithm or process, showing the steps as circles. Arrows Indicates the way to growth. Use this diagram for improved controls to drive your business towards the right direction.-PPT consecutive explanation of 5 steps through arrows powerpoint 2010 Templates-3d, Abstract, Arrow, Circle, Circular, Click, Computer, Data, Direction, Graphic, Icon, Illustration, Insignia, Intention, Internet, Isolated, Label, Mail, Mascot, Media, Menu, Motion, Page, Pushing, Search, Shiny, Sign, Simple, Symbol Exhibit your plan with our Ppt Consecutive Explanation Of 5 Steps Through Arrows PowerPoint 2010 Templates. Display the clarity of your ideas.
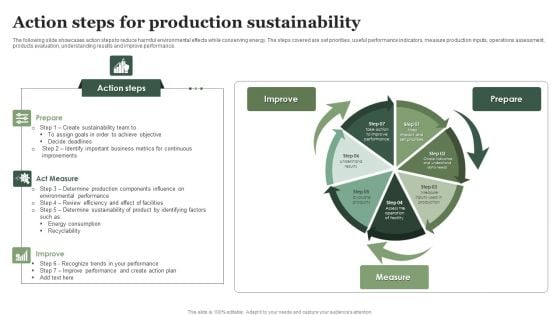
Action Steps For Production Sustainability Ppt Pictures Tips PDF
The following slide showcases action steps to reduce harmful environmental effects while conserving energy. The steps covered are set priorities, useful performance indicators, measure production inputs, operations assessment, products evaluation, understanding results and improve performance. Presenting Action Steps For Production Sustainability Ppt Pictures Tips PDF to dispense important information. This template comprises three stages. It also presents valuable insights into the topics including Action Steps, Act Measure, Improve. This is a completely customizable PowerPoint theme that can be put to use immediately. So, download it and address the topic impactfully.
Ppt Consecutive Implementation Of 6 Concepts Through Arrows PowerPoint 2010 Templates
PPT consecutive implementation of 6 concepts through arrows powerpoint 2010 Templates-This arrow diagram is built for presenting different ways for a single process. This power point diagram consists of 6 arrows. Continuous and ongoing process can be shown using this PPT Template.-PPT consecutive implementation of 6 concepts through arrows powerpoint 2010 Templates-Aim, Arrow, Badge, Border, Color, Connection, Curve, Design, Direction, Download, Icon, Illustration, Indicator, Internet, Label, Link, Magenta, Mark, Next, Object, Orientation, Paper, Peeling, Pointer, Rounded, Set, Shadow, Shape, Sign Concentrate on the important stuff with our Ppt Consecutive Implementation Of 6 Concepts Through Arrows PowerPoint 2010 Templates. You will come out on top.
Ppt Consecutive Practice Of 6 Concepts Through Circular Arrows PowerPoint 2010 Templates
PPT consecutive practice of 6 concepts through circular arrows powerpoint 2010 Templates-This arrow diagram is built for presenting different ways for a single process. This power point diagram consists of 6 arrows. Continuous and ongoing process can be shown using this PPT Template.-PPT consecutive practice of 6 concepts through circular arrows powerpoint 2010 Templates-Aim, Arrow, Badge, Border, Color, Connection, Curve, Design, Direction, Download, Icon, Illustration, Indicator, Internet, Label, Link, Magenta, Mark, Next, Object, Orientation, Paper, Peeling, Pointer, Rounded, Set, Shadow, Shape, Sign You are known to be erudite. Share your learning with our Ppt Consecutive Practice Of 6 Concepts Through Circular Arrows PowerPoint 2010 Templates.
Ppt Straight Explanation To Represent Seven Steps In Process PowerPoint Templates
PPT straight explanation to represent seven steps in process PowerPoint Templates-Develop competitive advantage with our above Diagram which contains a diagram of horizontal arrows. These arrows are indicators of the path you have in mind. Use them to help you organize the logic of your views-PPT straight explanation to represent seven steps in process PowerPoint Templates-above, aiming, arrow, arrowhead, balance, communicate, communication, connection, descriptive, design, designer, direct, direction, dynamic, element, graphic, high, icon, illustration, inform, internet, journey, multimedia, pointer, reflection, set, shape, sign, signal, straight, symbol, top, transportation, travel, vector You possess enterprising ideas. Display them with courage on our Ppt Straight Explanation To Represent Seven Steps In Process PowerPoint Templates.
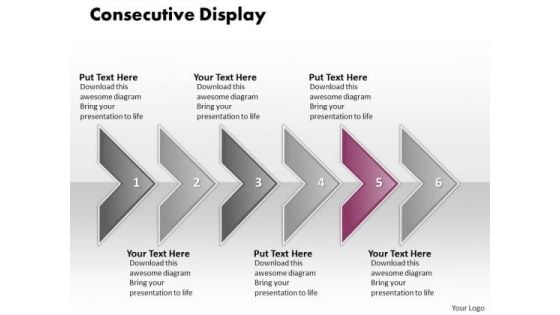
Ppt Consecutive Display Of 6 Concepts Through Curved Arrows PowerPoint 2010 Templates
PPT consecutive display of 6 concepts through curved arrows powerpoint 2010 Templates-This diagram is used to organize information so that it can be accessed more easily. It consists of consecutive arrows. You should understand your target audience and enhance presentations to create the wow effect to your visual delivery.-PPT consecutive display of 6 concepts through curved arrows powerpoint 2010 Templates-Aim, Arrow, Badge, Border, Color, Connection, Curve, Design, Direction, Download, Icon, Illustration, Indicator, Internet, Label, Link, Magenta, Mark, Next, Object, Orientation, Paper, Peeling, Pointer, Rounded, Set, Shadow, Shape, Sign Equalize the odds with our Ppt Consecutive Display Of 6 Concepts Through Curved Arrows PowerPoint 2010 Templates. Better the chances of your ideas working.
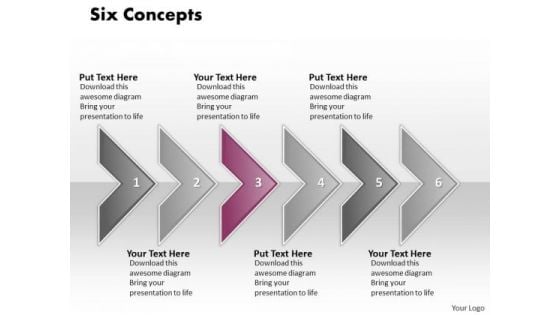
Ppt Consecutive Effect Of 6 Concepts Through Arrows PowerPoint Templates
PPT consecutive effect of 6 concepts through arrows powerpoint templates-This diagram organizes, represents and summarizes information so that patterns and relationships can be identified. It aims to inform, influence or convince an audience. Add charm and personality to your presentations with our attractive PPT design-PPT consecutive effect of 6 concepts through arrows powerpoint templates-Aim, Arrow, Badge, Border, Color, Connection, Curve, Design, Direction, Download, Icon, Illustration, Indicator, Internet, Label, Link, Magenta, Mark, Next, Object, Orientation, Paper, Peeling, Pointer, Rounded, Set, Shadow, Shape, Sign Display a fair minded approach with our Ppt Consecutive Effect Of 6 Concepts Through Arrows PowerPoint Templates. Give due attention to all aspects.
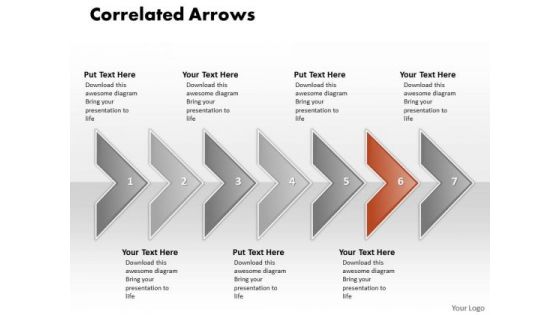
Ppt 7 Phase Diagram Correlated Arrows In Horizontal Line PowerPoint Templates
PPT 7 phase diagram correlated arrows in horizontal line PowerPoint Templates-The above template contains a graphic of seven arrows in straight line. This image signifies the concept of correlated activities. Adjust the above image in your PPT presentations to visually support your content in your PPT slideshows related to Market surveys, Statistics and Analysis. Create captivating presentations to deliver comparative facts and figures.-PPT 7 phase diagram correlated arrows in horizontal line PowerPoint Templates-Aim, Arrow, Badge, Border, Color, Connection, Curve, Design, Direction, Download, Icon, Illustration, Indicator, Internet, Label, Link, Magenta, Mark, Next, Object, Orientation, Paper, Peeling, Pointer, Rounded, Set, Shadow, Shape, Sign Educate your team with a winning presentation with our Ppt 7 Phase Diagram Correlated Arrows In Horizontal Line PowerPoint Templates. You will come out on top.
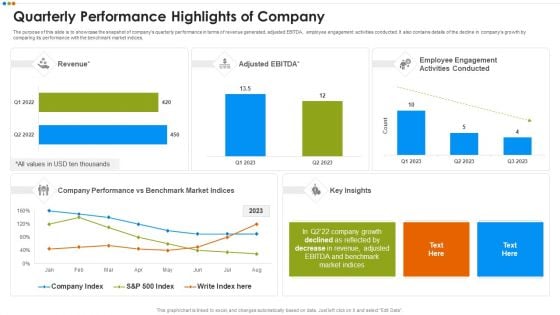
Quarterly Budget Analysis Of Business Organization Quarterly Performance Highlights Of Company Graphics PDF
The purpose of this slide is to showcase the snapshot of companys quarterly performance in terms of revenue generated, adjusted EBITDA, employee engagement activities conducted. It also contains details of the decline in companys growth by comparing its performance with the benchmark market indices.This is a Quarterly Budget Analysis Of Business Organization Quarterly Performance Highlights Of Company Graphics PDF template with various stages. Focus and dispense information on two stages using this creative set, that comes with editable features. It contains large content boxes to add your information on topics like Quarterly Performance Highlights Of Company You can also showcase facts, figures, and other relevant content using this PPT layout. Grab it now.
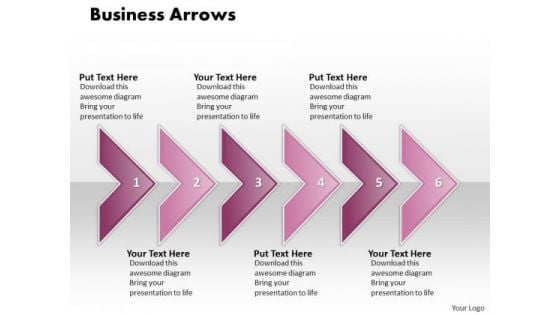
Ppt Consecutive Execution Of 6 Concepts Through Curved Arrows PowerPoint 2010 Templates
PPT consecutive execution of 6 concepts through curved arrows powerpoint 2010 Templates-The above template displays a diagram of curved arrows. This Diagram is mainly used to depict the progress of sequential steps in the flow or process. It is a powerful tool conceived to enable you to define your message more clearly in your PPT presentations. -PPT consecutive execution of 6 concepts through curved arrows powerpoint 2010 Templates-Aim, Arrow, Badge, Border, Color, Connection, Curve, Design, Direction, Download, Icon, Illustration, Indicator, Internet, Label, Link, Magenta, Mark, Next, Object, Orientation, Paper, Peeling, Pointer, Rounded, Set, Shadow, Shape, Sign Get fashionable with our Ppt Consecutive Execution Of 6 Concepts Through Curved Arrows PowerPoint 2010 Templates. Whatever you display will be in.
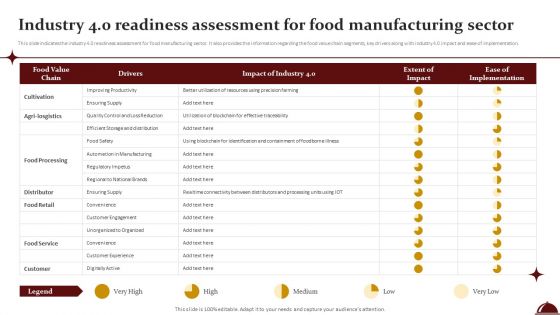
Industry 4 0 Readiness Assessment For Food Manufacturing Sector Portrait PDF
This slide indicates the industry 4.0 readiness assessment for food manufacturing sector. It also provides the information regarding the food value chain segments, key drivers along with industry 4.0 impact and ease of implementation. Coming up with a presentation necessitates that the majority of the effort goes into the content and the message you intend to convey. The visuals of a PowerPoint presentation can only be effective if it supplements and supports the story that is being told. Keeping this in mind our experts created Industry 4 0 Readiness Assessment For Food Manufacturing Sector Portrait PDF to reduce the time that goes into designing the presentation. This way, you can concentrate on the message while our designers take care of providing you with the right template for the situation.
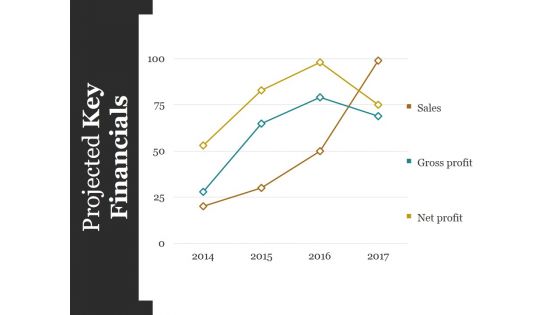
Projected Key Financials Template Ppt PowerPoint Presentation Styles Graphics Design
This is a projected key financials template ppt powerpoint presentation styles graphics design. This is a four stage process. The stages in this process are sales, gross profit, net profit.
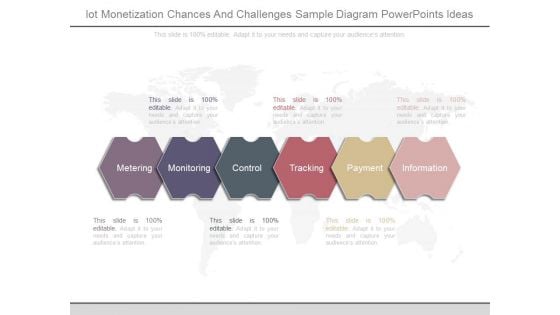
Iot Monetization Chances And Challenges Sample Diagram Powerpoints Ideas
This is a iot monetization chances and challenges sample diagram powerpoints ideas. This is a six stage process. The stages in this process are metering, monitoring, control, tracking, payment, information.
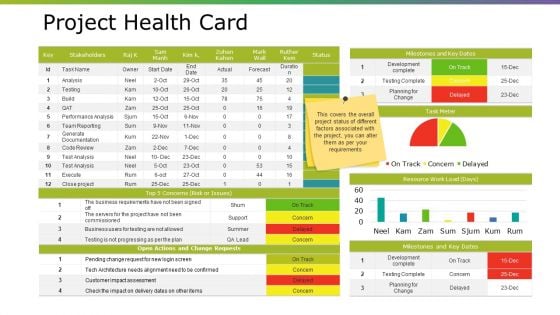
Project Health Card Ppt PowerPoint Presentation Summary Example
This is a project health card ppt powerpoint presentation summary example. This is a seven stage process. The stages in this process are development complete, testing complete, planning for change, milestones and key dates, task meter.
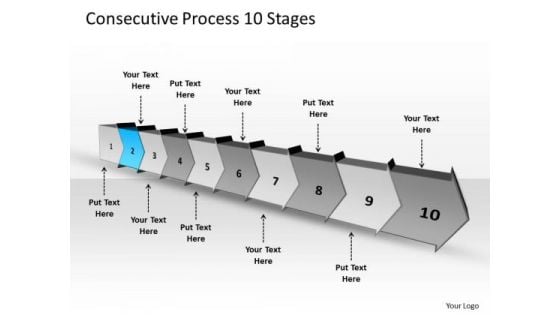
Consecutive Process 10 Stages Creating Flowchart PowerPoint Templates
We present our consecutive process 10 stages creating flowchart PowerPoint templates. Use our Arrows PowerPoint Templates because; you have the ideas to develop the teams vision of where they need to be in the future. Use our Business PowerPoint Templates because, you have played a stellar role and have a few ideas. Use our Shapes PowerPoint Templates because, prove how they mesh to motivate the company team and provide the steam to activate the composite machine. Use our Finance PowerPoint Templates because, our presentation designs are for those on the go. Use our Process and Flows PowerPoint Templates because, they are indicators of the path you have in mind. Use these PowerPoint slides for presentations relating to abstract arrow blank business chart circular circulation concept conceptual consecutive design diagram executive flow icon idea illustration management model numbers organization procedure process. The prominent colors used in the PowerPoint template are Blue, Gray, and Black Get the value of a lifetime with our Consecutive Process 10 Stages Creating Flowchart PowerPoint Templates. Dont waste time struggling with PowerPoint. Let us do it for you.
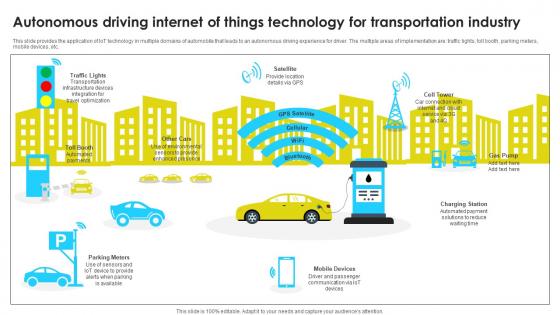
Autonomous Driving Internet Of Things Technology For Transportation Industry Information Pdf
This slide provides the application of IoT technology in multiple domains of automobile that leads to an autonomous driving experience for driver. The multiple areas of implementation are traffic lights, toll booth, parking meters, mobile devices, etc. Pitch your topic with ease and precision using this Autonomous Driving Internet Of Things Technology For Transportation Industry Information Pdf This layout presents information on Parking Meters, Mobile Devices, Charging Station It is also available for immediate download and adjustment. So, changes can be made in the color, design, graphics or any other component to create a unique layout. This slide provides the application of IoT technology in multiple domains of automobile that leads to an autonomous driving experience for driver. The multiple areas of implementation are traffic lights, toll booth, parking meters, mobile devices, etc.
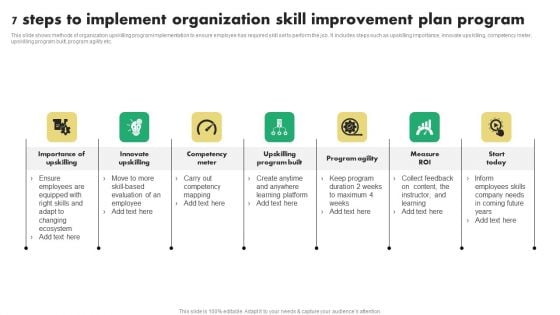
7 Steps To Implement Organization Skill Improvement Plan Program Infographics PDF
This slide shows methods of organization upskilling program implementation to ensure employee has required skill set to perform the job. It includes steps such as upskilling importance, innovate upskilling, competency meter, upskilling program built, program agility etc. Presenting 7 Steps To Implement Organization Skill Improvement Plan Program Infographics PDF to dispense important information. This template comprises seven stages. It also presents valuable insights into the topics including Competency Meter, Innovate Upskilling, Program Agility. This is a completely customizable PowerPoint theme that can be put to use immediately. So, download it and address the topic impactfully.
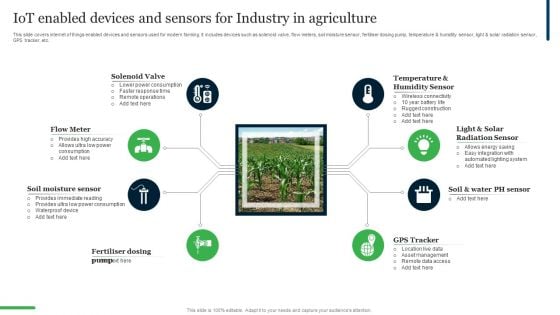
Iot Enabled Devices And Sensors For Industry In Agriculture Ppt PowerPoint Presentation Gallery Show PDF
This slide covers internet of things enabled devices and sensors used for modern farming. It includes devices such as solenoid valve, flow meters, soil moisture sensor, fertiliser dosing pump, temperature and humidity sensor, light ans solar radiation sensor, GPS tracker, etc. Presenting Iot Enabled Devices And Sensors For Industry In Agriculture Ppt PowerPoint Presentation Gallery Show PDF to dispense important information. This template comprises eight stages. It also presents valuable insights into the topics including Solenoid Valve, Flow Meter, Soil Moisture Sensor. This is a completely customizable PowerPoint theme that can be put to use immediately. So, download it and address the topic impactfully.


 Continue with Email

 Home
Home


