Meter Chart
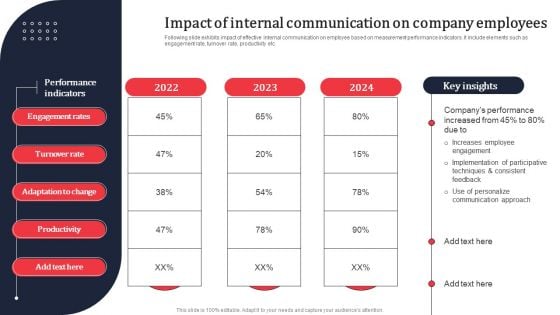
Impact Of Internal Communication On Company Employees Ppt PowerPoint Presentation File Example PDF
Following slide exhibits impact of effective internal communication on employee based on measurement performance indicators. It include elements such as engagement rate, turnover rate, productivity etc. If you are looking for a format to display your unique thoughts, then the professionally designed Impact Of Internal Communication On Company Employees Ppt PowerPoint Presentation File Example PDF is the one for you. You can use it as a Google Slides template or a PowerPoint template. Incorporate impressive visuals, symbols, images, and other charts. Modify or reorganize the text boxes as you desire. Experiment with shade schemes and font pairings. Alter, share or cooperate with other people on your work. Download Impact Of Internal Communication On Company Employees Ppt PowerPoint Presentation File Example PDF and find out how to give a successful presentation. Present a perfect display to your team and make your presentation unforgettable.
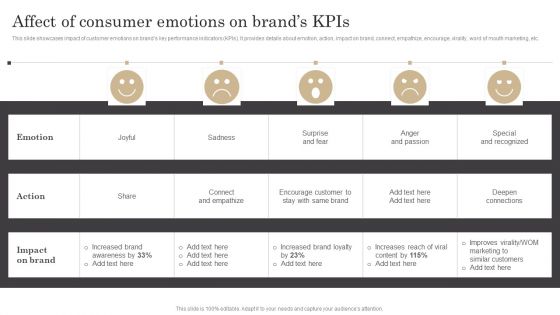
Affect Of Consumer Emotions On Brands Kpis Ppt Summary PDF
This slide showcases impact of customer emotions on brands key performance indicators KPIs. It provides details about emotion, action, impact on brand, connect, empathize, encourage, virality, word of mouth marketing, etc. If you are looking for a format to display your unique thoughts, then the professionally designed Affect Of Consumer Emotions On Brands Kpis Ppt Summary PDF is the one for you. You can use it as a Google Slides template or a PowerPoint template. Incorporate impressive visuals, symbols, images, and other charts. Modify or reorganize the text boxes as you desire. Experiment with shade schemes and font pairings. Alter, share or cooperate with other people on your work. Download Affect Of Consumer Emotions On Brands Kpis Ppt Summary PDF and find out how to give a successful presentation. Present a perfect display to your team and make your presentation unforgettable.
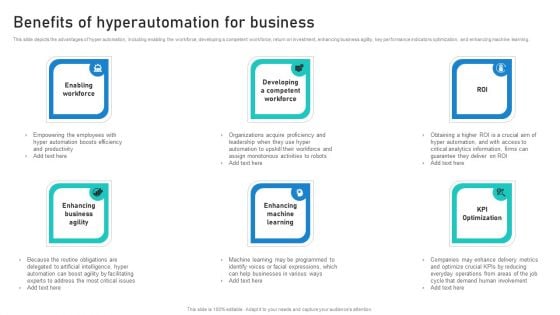
Intelligent Process Automation IPA Benefits Of Hyperautomation For Business Structure PDF
This slide depicts the advantages of hyper automation, including enabling the workforce, developing a competent workforce, return on investment, enhancing business agility, key performance indicators optimization, and enhancing machine learning. If you are looking for a format to display your unique thoughts, then the professionally designed Intelligent Process Automation IPA Benefits Of Hyperautomation For Business Structure PDF is the one for you. You can use it as a Google Slides template or a PowerPoint template. Incorporate impressive visuals, symbols, images, and other charts. Modify or reorganize the text boxes as you desire. Experiment with shade schemes and font pairings. Alter, share or cooperate with other people on your work. Download Intelligent Process Automation IPA Benefits Of Hyperautomation For Business Structure PDF and find out how to give a successful presentation. Present a perfect display to your team and make your presentation unforgettable.

Business Diagram Thermometer Graphics Indicating Progress Presentation Template
This power point template diagram has been designed with graphic of thermometer and bar graph. This PPT contains the concept of growth analysis. Use this PPT for business and marketing related presentations.
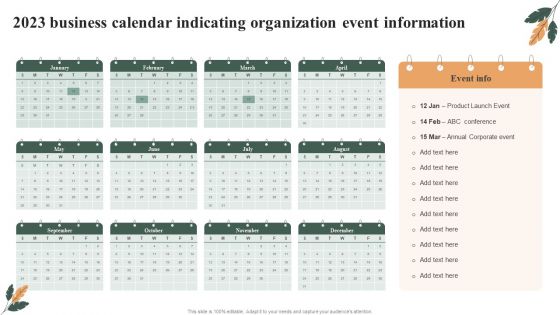
2023 Business Calendar Indicating Organization Event Information Portrait PDF
Presenting 2023 Business Calendar Indicating Organization Event Information Portrait PDF to dispense important information. This template comprises tweleve stages. It also presents valuable insights into the topics including Business Calendar Indicating, Organization Event Information. This is a completely customizable PowerPoint theme that can be put to use immediately. So, download it and address the topic impactfully.
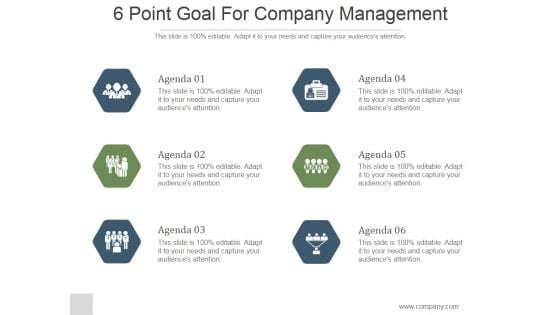
6 Point Goal For Company Management Ppt PowerPoint Presentation Slide
This is a 6 point goal for company management ppt powerpoint presentation slide. This is a six stage process. The stages in this process are agenda, business, strategy, icons, hexagon, marketing.
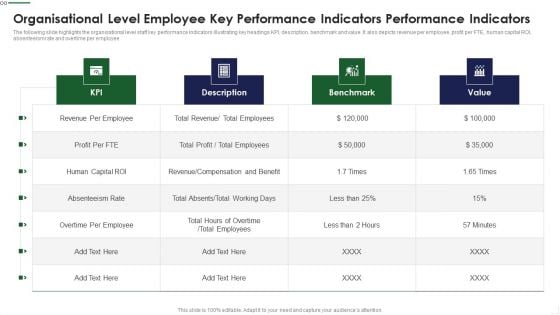
Organisational Level Employee Key Performance Indicators Performance Indicators Rules PDF
The following slide highlights the organisational level staff key performance Indicators illustrating key headings KPI, description, benchmark and value. It also depicts revenue per employee, profit per FTE, human capital ROI, absenteeism rate and overtime per employee Showcasing this set of slides titled Organisational Level Employee Key Performance Indicators Performance Indicators Rules PDF The topics addressed in these templates are Revenue Compensation, Overtime Employee, Benchmark All the content presented in this PPT design is completely editable. Download it and make adjustments in color, background, font etc. as per your unique business setting.
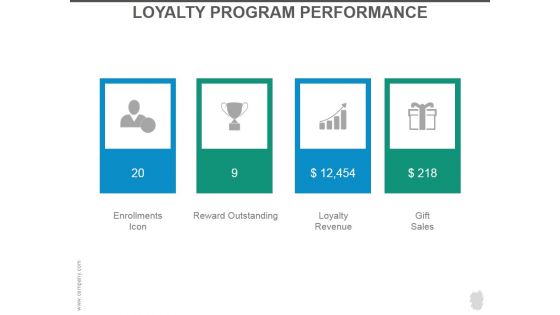
Loyalty Program Performance Ppt PowerPoint Presentation Slides
This is a loyalty program performance ppt powerpoint presentation slides. This is a four stage process. The stages in this process are enrollments icon, reward outstanding, loyalty revenue, gift sales.
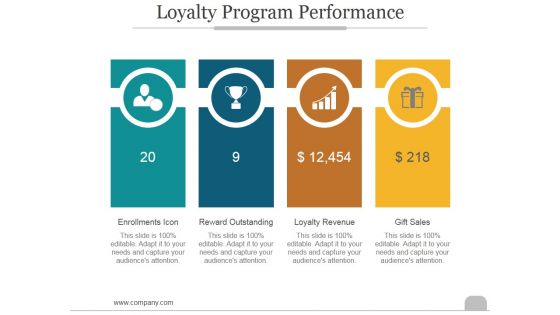
Loyalty Program Performance Ppt PowerPoint Presentation Introduction
This is a loyalty program performance ppt powerpoint presentation introduction. This is a four stage process. The stages in this process are enrollments icon, reward outstanding, loyalty revenue, gift sales.

Golden Bar Graph Success PowerPoint Templates And PowerPoint Themes 1012
Golden Bar Graph Success PowerPoint Templates And PowerPoint Themes 1012-Use this Above PowerPoint Template Displaying the Bar Graph in Horizontal Manner. It indicates beefing up, boost, buildup, crop, cultivation, enlargement, evolution, gain, heightening, hike, improvement, increase. Original thinking is the need of the hour. We provide the means to project your views.-Golden Bar Graph Success PowerPoint Templates And PowerPoint Themes 1012-This PowerPoint template can be used for presentations relating to-Business Graph, Business, Competition, Finance, Future, Technology No idea is too far fetched for our Golden Bar Graph Success PowerPoint Templates And PowerPoint Themes 1012. They will help you think it through.
Corporate Identity Icon Indicating Business Card And Letterhead Diagrams PDF
Presenting Corporate Identity Icon Indicating Business Card And Letterhead Diagrams PDF to dispense important information. This template comprises four stages. It also presents valuable insights into the topics including Business, Letterhead, Corporate. This is a completely customizable PowerPoint theme that can be put to use immediately. So, download it and address the topic impactfully.
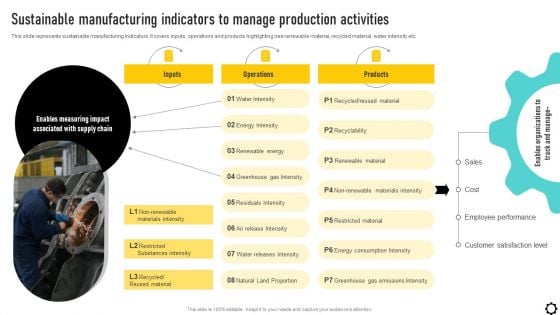
Optimizing Production Process Sustainable Manufacturing Indicators To Manage Themes PDF
This slide represents sustainable manufacturing indicators. It covers inputs, operations and products highlighting nee renewable material, recycled material, water intensity etc. Formulating a presentation can take up a lot of effort and time, so the content and message should always be the primary focus. The visuals of the PowerPoint can enhance the presenters message, so our Optimizing Production Process Sustainable Manufacturing Indicators To Manage Themes PDF was created to help save time. Instead of worrying about the design, the presenter can concentrate on the message while our designers work on creating the ideal templates for whatever situation is needed. Slidegeeks has experts for everything from amazing designs to valuable content, we have put everything into Optimizing Production Process Sustainable Manufacturing Indicators To Manage Themes PDF.

Phases Of Smart Grid Maturity Model Navigation Smart Grid Working
This slide represents the phases of smart grid maturity model navigation and includes preparation, survey workshop, analysis, aspirations workshop and wrap up. The findings of the compass poll will indicate the utilitys AS IS condition in each of the eight domains. Are you searching for a Phases Of Smart Grid Maturity Model Navigation Smart Grid Working that is uncluttered, straightforward, and original Its easy to edit, and you can change the colors to suit your personal or business branding. For a presentation that expresses how much effort you have put in, this template is ideal With all of its features, including tables, diagrams, statistics, and lists, its perfect for a business plan presentation. Make your ideas more appealing with these professional slides. Download Phases Of Smart Grid Maturity Model Navigation Smart Grid Working from Slidegeeks today. This slide represents the phases of smart grid maturity model navigation and includes preparation, survey workshop, analysis, aspirations workshop and wrap up. The findings of the compass poll will indicate the utilitys AS IS condition in each of the eight domains.
Corporate Key Performance Indicator Icon Inspiration PDF
Showcasing this set of slides titled Corporate Key Performance Indicator Icon Inspiration PDF. The topics addressed in these templates are Corporate Key, Performance Indicator Icon. All the content presented in this PPT design is completely editable. Download it and make adjustments in color, background, font etc. as per your unique business setting.
Disagreement Icon Indicating B2b Challenges Professional PDF
Showcasing this set of slides titled Disagreement Icon Indicating B2b Challenges Professional PDF. The topics addressed in these templates are Disagreement Icon, Indicating B2b, Challenges. All the content presented in this PPT design is completely editable. Download it and make adjustments in color, background, font etc. as per your unique business setting.
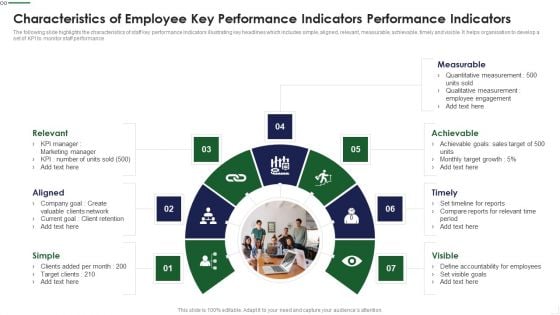
Characteristics Of Employee Key Performance Indicators Performance Indicators Guidelines PDF
The following slide highlights the characteristics of staff key performance Indicators illustrating key headlines which includes simple, aligned, relevant, measurable, achievable, timely and visible. It helps organisation to develop a set of KPI to monitor staff performance Presenting Characteristics Of Employee Key Performance Indicators Performance Indicators Guidelines PDF to dispense important information. This template comprises seven stages. It also presents valuable insights into the topics including Measurable, Achievable, Timely, Visible, Simple This is a completely customizable PowerPoint theme that can be put to use immediately. So, download it and address the topic impactfully.
Key Metrics For Business Leadership Team Ppt Diagrams
This is a key metrics for business leadership team ppt diagrams. This is a five stage process. The stages in this process are kpi.
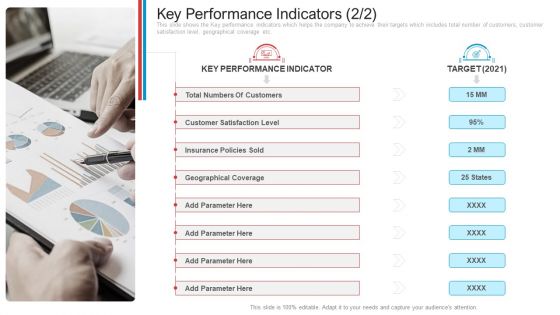
Key Performance Indicators Customers Introduction PDF
This slide shows the Key performance indicators which helps the company to achieve their targets which includes total number of customers, customer satisfaction level, geographical coverage etc. Presenting key performance indicators customers introduction pdf. to provide visual cues and insights. Share and navigate important information on seven stages that need your due attention. This template can be used to pitch topics like total numbers of customers, customer satisfaction level, insurance policies sold, geographical coverage, key performance indicator. In addtion, this PPT design contains high resolution images, graphics, etc, that are easily editable and available for immediate download.
Company Accounts Planning Strategy Powerpoint Guide
This is a company accounts planning strategy powerpoint guide. This is a four stage process. The stages in this process are goal, target, planning, strategy, company.
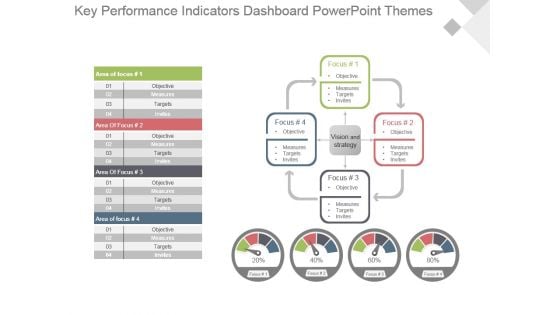
Key Performance Indicators Dashboard Powerpoint Themes
This is a key performance indicators dashboard powerpoint themes. This is a four stage process. The stages in this process are focus, objective, measures, targets, invites, vision and strategy, area of focus.
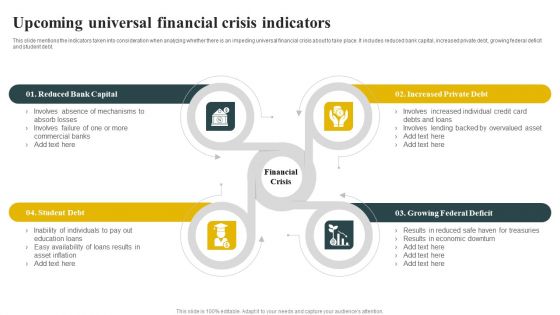
Upcoming Universal Financial Crisis Indicators Themes PDF
This slide mentions the indicators taken into consideration when analyzing whether there is an impeding universal financial crisis about to take place. It includes reduced bank capital, increased private debt, growing federal deficit and student debt. Persuade your audience using this Upcoming Universal Financial Crisis Indicators Themes PDF. This PPT design covers four stages, thus making it a great tool to use. It also caters to a variety of topics including Reduced Bank Capital, Increased Private Debt, Growing Federal Deficit, Student Debt. Download this PPT design now to present a convincing pitch that not only emphasizes the topic but also showcases your presentation skills.
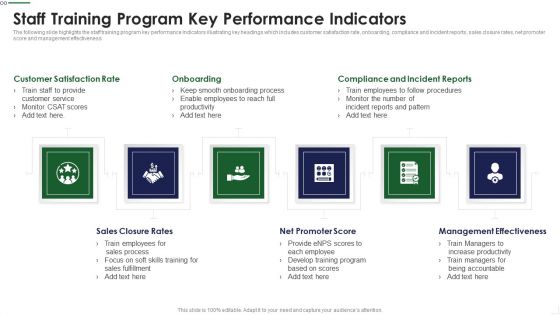
Staff Training Program Key Performance Indicators Diagrams PDF
The following slide highlights the staff training program key performance Indicators illustrating key headings which includes customer satisfaction rate, onboarding, compliance and incident reports, sales closure rates, net promoter score and management effectiveness Presenting Staff Training Program Key Performance Indicators Diagrams PDF to provide visual cues and insights. Share and navigate important information on six stages that need your due attention. This template can be used to pitch topics like Turnover Quarter, Turnover Type, Turnover Reasons In addtion, this PPT design contains high resolution images, graphics, etc, that are easily editable and available for immediate download.
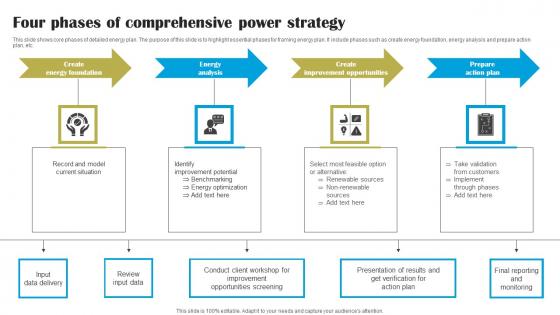
Four Phases Of Comprehensive Power Strategy Inspiration Pdf
This slide shows key performance indicators for energy plan. The purpose of this slide is to highlight main key performance indicators that should be considered for performance measurement. It include indicators such as facility wide units and process unit levels, etc.Showcasing this set of slides titled Four Phases Of Comprehensive Power Strategy Inspiration Pdf The topics addressed in these templates are Energy Analysis, Improvement Opportunities, Prepare Action Plan All the content presented in this PPT design is completely editable. Download it and make adjustments in color, background, font etc. as per your unique business setting. This slide shows key performance indicators for energy plan. The purpose of this slide is to highlight main key performance indicators that should be considered for performance measurement. It include indicators such as facility wide units and process unit levels, etc.
Key Attributes Of Fixed Price Model Ppt PowerPoint Presentation Icon
This is a key attributes of fixed price model ppt powerpoint presentation icon. This is a six stage process. The stages in this process are fixed price model.
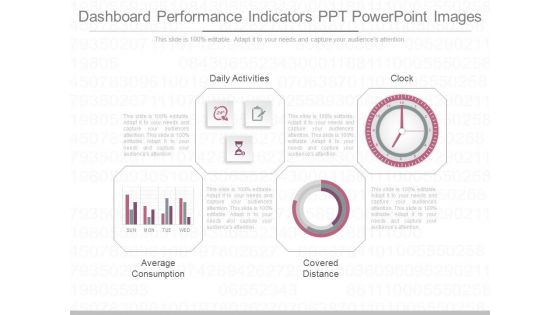
Dashboard Performance Indicators Ppt Powerpoint Images
This is a dashboard performance indicators ppt powerpoint images. This is a four stage process. The stages in this process are daily activities, average consumption, covered distance, clock.
Business Meeting Plan Icon Indicating Manager Presenting Objectives Diagrams PDF
Pitch your topic with ease and precision using this business meeting plan icon indicating manager presenting objectives diagrams pdf This layout presents information on business meeting plan icon indicating manager presenting objectives It is also available for immediate download and adjustment. So, changes can be made in the color, design, graphics or any other component to create a unique layout.
Icon Indicating Managers Developing Risk Communication Strategies Plan Rules PDF
Persuade your audience using this Icon Indicating Managers Developing Risk Communication Strategies Plan Rules PDF. This PPT design covers four stages, thus making it a great tool to use. It also caters to a variety of topics including Icon Indicating Managers, Developing Risk Communication, Strategies Plan. Download this PPT design now to present a convincing pitch that not only emphasizes the topic but also showcases your presentation skills.
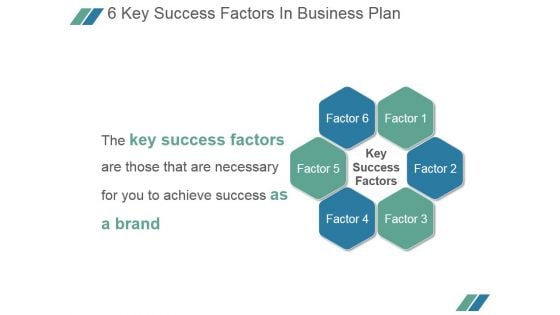
6 Key Success Factors In Business Plan Ppt PowerPoint Presentation Microsoft
This is a 6 key success factors in business plan ppt powerpoint presentation microsoft. This is a six stage process. The stages in this process are key success factors, factor.

Key Performance Indicators Sample Diagram Ppt Slides
This is a Key Performance Indicators Sample Diagram Ppt Slides. This is a four stage process. The stages in this process are strategize, measure, innovate, propagate.
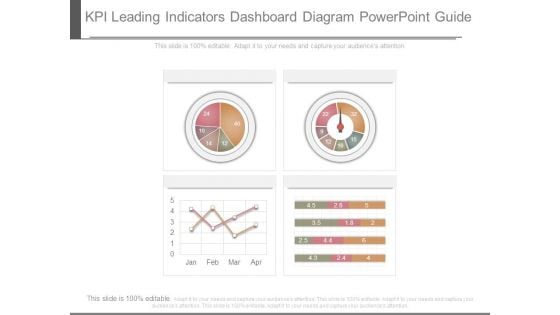
Kpi Leading Indicators Dashboard Diagram Powerpoint Guide
This is a kpi leading indicators dashboard diagram powerpoint guide. This is a four stage process. The stages in this process are business, success, process.
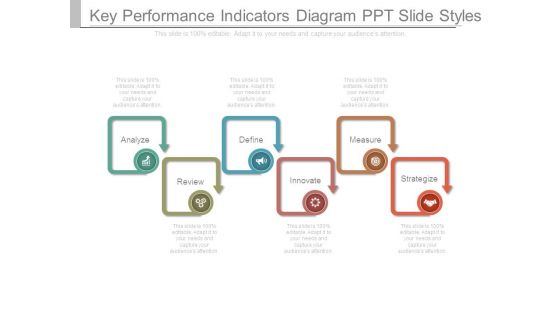
Key Performance Indicators Diagram Ppt Slide Styles
This is a key performance indicators diagram ppt slide styles. This is a six stage process. The stages in this process are analyze, define, measure, review, innovate, strategize.
Key Financial Ratios Template 2 Ppt PowerPoint Presentation Icon Slide Download
This is a key financial ratios template 2 ppt powerpoint presentation icon slide download. This is a six stage process. The stages in this process are price to earnings, debt to equity ratio, current ratio, return on, equity, return on , assets, return on investment.
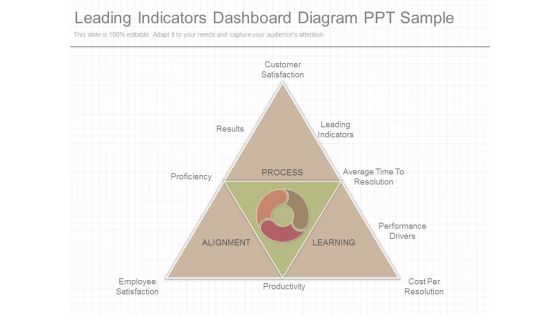
Leading Indicators Dashboard Diagram Ppt Sample
This is a leading indicators dashboard diagram ppt sample. This is a five stage process. The stages in this process are customer satisfaction, leading indicators, average time to resolution, performance drivers, cost per resolution, productivity, employee satisfaction, proficiency, results, process, learning, alignment.
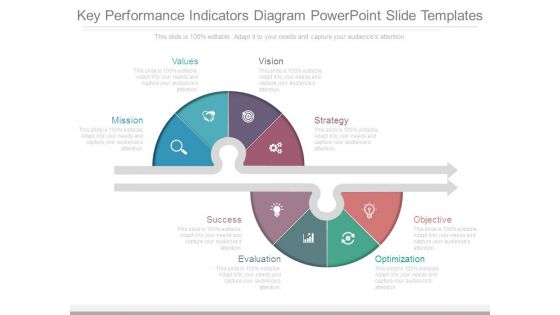
Key Performance Indicators Diagram Powerpoint Slide Templates
This is a key performance indicators diagram powerpoint slide templates. This is a eight stage process. The stages in this process are mission, values, vision, strategy, success, evaluation, optimization, objective.
Market Summary Icon With Key Indicators And Metrics Icons PDF
Persuade your audience using this Market Summary Icon With Key Indicators And Metrics Icons PDF. This PPT design covers three stages, thus making it a great tool to use. It also caters to a variety of topics including Market Summary Icon With Key Indicators And Metrics. Download this PPT design now to present a convincing pitch that not only emphasizes the topic but also showcases your presentation skills.
Icon Indicating Business Corporate Sustainability For Future Diagrams PDF
The following slide showcases techniques to bring sustainability in startups. It provides information about sustainable solutions, eco point, electric vehicles, ozone generator, etc.Pitch your topic with ease and precision using this Icon Indicating Business Corporate Sustainability For Future Diagrams PDF. This layout presents information on Icon Indicating, Business Corporate, Sustainability Future. It is also available for immediate download and adjustment. So, changes can be made in the color, design, graphics or any other component to create a unique layout.

Pharmaceutical Company Key Performance Indicators Clipart PDF
The slide shows the key Performance Indicator KPI s which will help the company to track the success rate of implemented strategies. Major KPIs include number of products sold, pharma products manufactures, research and development expenses per year, total number of patients, etc.Presenting pharmaceutical company key performance indicators clipart pdf to provide visual cues and insights. Share and navigate important information on one stage that need your due attention. This template can be used to pitch topics like research and development, key performance indicator, pharma products manufactured In addtion, this PPT design contains high resolution images, graphics, etc, that are easily editable and available for immediate download.
Employee Key Performance Indicators Performance Indicators Analytics And Monitoring Icon Demonstration PDF
Pitch your topic with ease and precision using this Employee Key Performance Indicators Performance Indicators Analytics And Monitoring Icon Demonstration PDF This layout presents information on Employee Key, Performance Indicators, Performance Indicators It is also available for immediate download and adjustment. So, changes can be made in the color, design, graphics or any other component to create a unique layout.
Speed Dashboard With Arrows Percent Values And Icons Ppt PowerPoint Presentation Infographic Template Model
This is a speed dashboard with arrows percent values and icons ppt powerpoint presentation infographic template model. This is a two stage process. The stages in this process are fuel gauge, gas gauge, fuel containers.
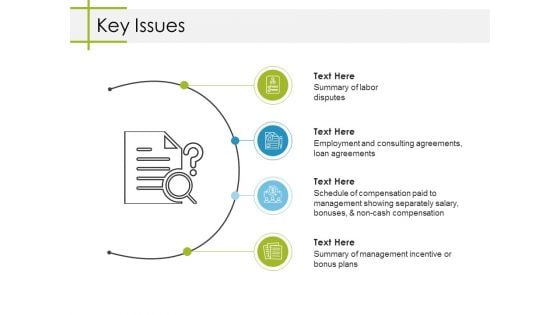
Key Issues Ppt PowerPoint Presentation Slides Deck
This is a key issues ppt powerpoint presentation slides deck. This is a four stage process. The stages in this process are key issues, business, marketing, icons, strategy.

Setting Short Term Goals Powerpoint Slide Graphics
This is a setting short term goals powerpoint slide graphics. This is a five stage process. The stages in this process are february, january, march, may, april.
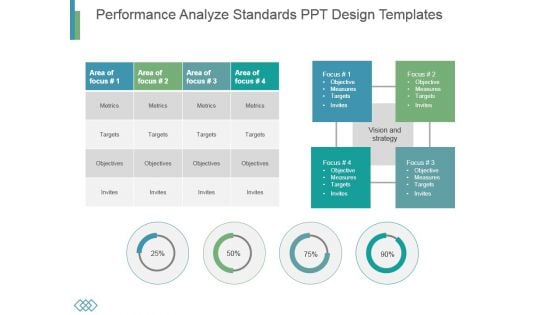
Performance Analyze Standards Ppt Design Templates
This is a performance analyze standards ppt design templates. This is a four stage process. The stages in this process are metrics, targets, objectives, invites.
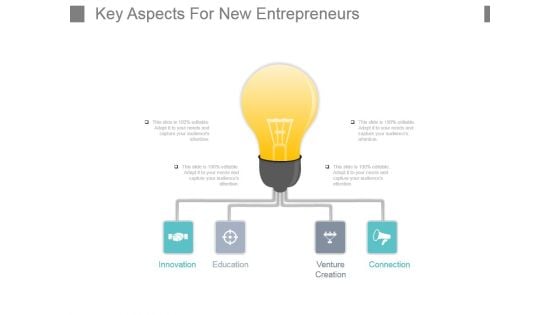
Key Aspects For New Entrepreneurs Powerpoint Slide Ideas
This is a key aspects for new entrepreneurs powerpoint slide ideas. This is a four stage process. The stages in this process are innovation, education, venture creation, connection.
4 Key Market Drivers Of Economic Growth Ppt PowerPoint Presentation Templates
This is a 4 key market drivers of economic growth ppt powerpoint presentation templates. This is a four stage process. The stages in this process are key market driver.
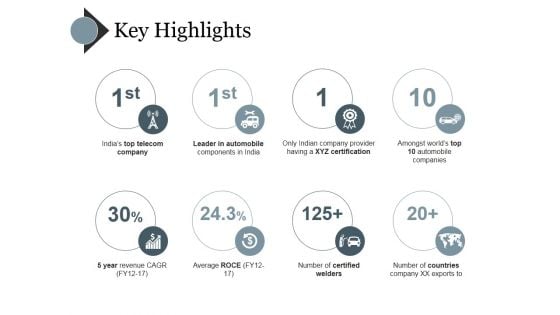
Key Highlights Ppt PowerPoint Presentation Gallery Deck
This is a key highlights ppt powerpoint presentation gallery deck. This is a eight stage process. The stages in this process are indias top telecom company, leader in automobile components in india, only indian company provider having a xyz certification, amongst worlds top 10 automobile companies, number of certified welders.
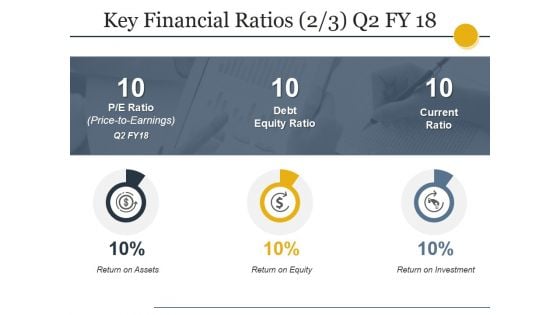
Key Financial Ratios Template Ppt PowerPoint Presentation Show Graphics Design
This is a key financial ratios template ppt powerpoint presentation show graphics design. This is a four stage process. The stages in this process are liquidity, profitability, activity, solvency.
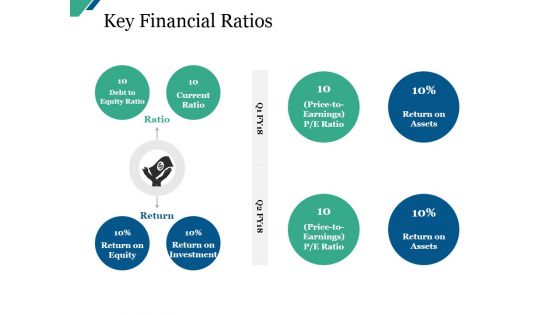
Key Financial Ratios Ppt PowerPoint Presentation Infographic Template Master Slide
This is a key financial ratios ppt powerpoint presentation infographic template master slide. This is a eight stage process. The stages in this process are debt to equity ratio, current ratio, return on equity, return on investment.
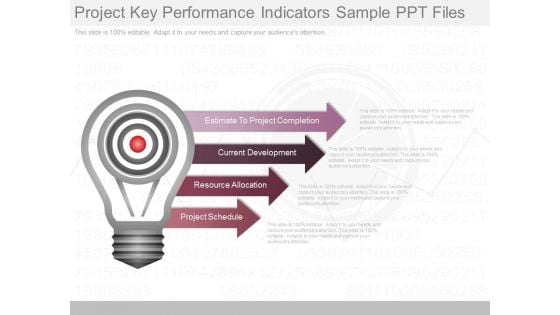
Project Key Performance Indicators Sample Ppt Files
This is a project key performance indicators sample ppt files. This is a four stage process. The stages in this process are estimate to project completion, current development, resource allocation, project schedule.
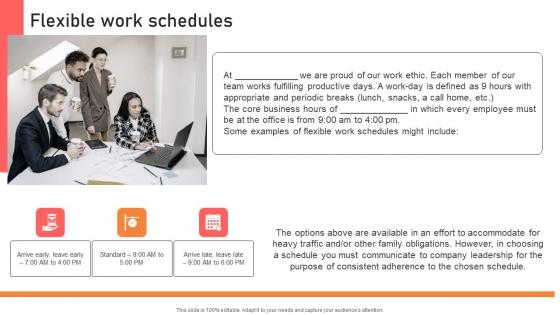
Flexible Work Schedules Handbook For Corporate Personnel Infographics Pdf
Slidegeeks has constructed Flexible Work Schedules Handbook For Corporate Personnel Infographics Pdf after conducting extensive research and examination. These presentation templates are constantly being generated and modified based on user preferences and critiques from editors. Here, you will find the most attractive templates for a range of purposes while taking into account ratings and remarks from users regarding the content. This is an excellent jumping-off point to explore our content and will give new users an insight into our top-notch PowerPoint Templates. This slide covers KPI dashboard to measure employee satisfaction due to effective internal communication. It includes indicators such as net promoter score, retention rate, absenteeism etc.
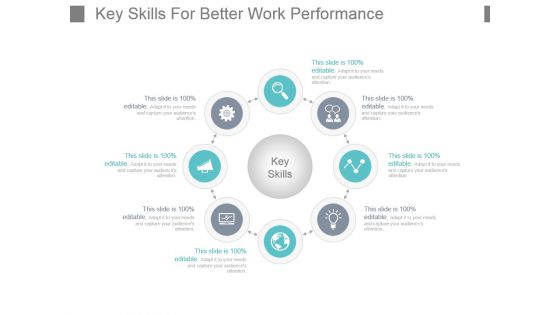
Key Skills For Better Work Performance Powerpoint Shapes
This is a key skills for better work performance powerpoint shapes. This is a four stage process. The stages in this process are key skills, flow, process, circle, icons.
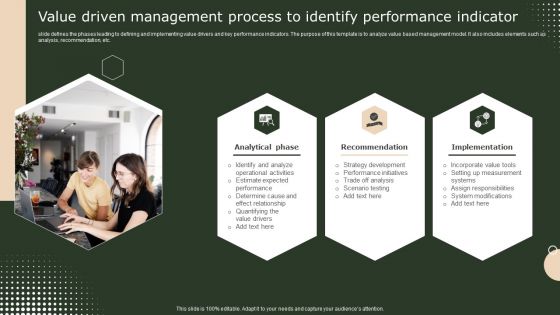
Value Driven Management Process To Identify Performance Indicator Themes PDF
slide defines the phases leading to defining and implementing value drivers and key performance indicators. The purpose of this template is to analyze value based management model. It also includes elements such as analysis, recommendation, etc. Persuade your audience using this Value Driven Management Process To Identify Performance Indicator Themes PDF. This PPT design covers three stages, thus making it a great tool to use. It also caters to a variety of topics including Recommendation, Analytical Phase, Implementation. Download this PPT design now to present a convincing pitch that not only emphasizes the topic but also showcases your presentation skills.
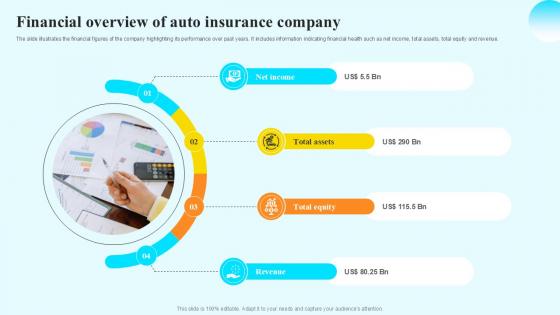
Financial Overview Of Auto Steps By Step Guide For Claiming Car PPT Sample
The slide illustrates the financial figures of the company highlighting its performance over past years. It includes information indicating financial health such as net income, total assets, total equity and revenue. If you are looking for a format to display your unique thoughts, then the professionally designed Financial Overview Of Auto Steps By Step Guide For Claiming Car PPT Sample is the one for you. You can use it as a Google Slides template or a PowerPoint template. Incorporate impressive visuals, symbols, images, and other charts. Modify or reorganize the text boxes as you desire. Experiment with shade schemes and font pairings. Alter, share or cooperate with other people on your work. Download Financial Overview Of Auto Steps By Step Guide For Claiming Car PPT Sample and find out how to give a successful presentation. Present a perfect display to your team and make your presentation unforgettable. The slide illustrates the financial figures of the company highlighting its performance over past years. It includes information indicating financial health such as net income, total assets, total equity and revenue.
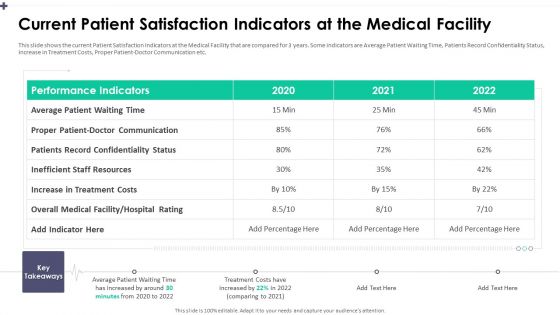
Current Patient Satisfaction Indicators At The Medical Facility Diagrams PDF
This slide shows the current Patient Satisfaction Indicators at the Medical Facility that are compared for 3 years. Some indicators are Average Patient Waiting Time, Patients Record Confidentiality Status, Increase in Treatment Costs, Proper Patient Doctor Communication etc.Deliver and pitch your topic in the best possible manner with this patients record confidentiality, inefficient staff resources, performance indicators. Use them to share invaluable insights on patients record confidentiality, inefficient staff resources, performance indicators and impress your audience. This template can be altered and modified as per your expectations. So, grab it now.
Key Performance Indicators Construction Company Icons PDF
The slide shows the key Performance Indicator KPI s which will help the company to track the success rate of implemented strategies. Major KPIs include Number of construction projects, Number of construction defect, Total project cost, customer satisfaction level etc. Deliver and pitch your topic in the best possible manner with this key performance indicators construction company icons pdf. Use them to share invaluable insights on key performance indicators construction company and impress your audience. This template can be altered and modified as per your expectations. So, grab it now.
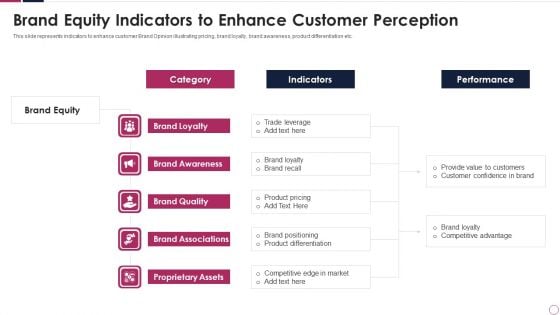
brand equity indicators to enhance customer perception infographics pdf
This slide represents indicators to enhance customer Brand Opinion illustrating pricing, brand loyalty, brand awareness, product differentiation etc. Showcasing this set of slides titled brand equity indicators to enhance customer perception infographics pdf. The topics addressed in these templates are brand awareness, brand quality, brand associations. All the content presented in this PPT design is completely editable. Download it and make adjustments in color, background, font etc. as per your unique business setting.
HR Meeting Icon Indicating Strategic OGSM Model Training Professional PDF
Persuade your audience using this HR Meeting Icon Indicating Strategic OGSM Model Training Professional PDF. This PPT design covers Three stages, thus making it a great tool to use. It also caters to a variety of topics including HR Meeting Icon, Indicating Strategic, OGSM Model Training. Download this PPT design now to present a convincing pitch that not only emphasizes the topic but also showcases your presentation skills.
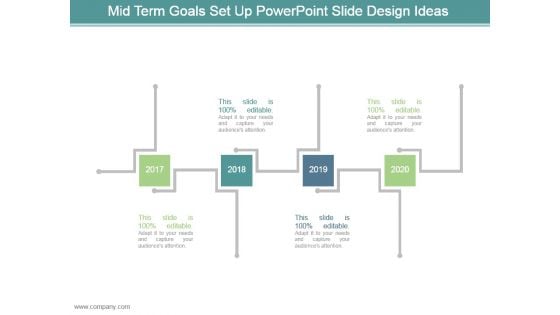
Mid Term Goals Set Up Powerpoint Slide Design Ideas
This is a mid term goals set up powerpoint slide design ideas. This is a four stage process. The stages in this process are arrows, business, marketing, planning, years.
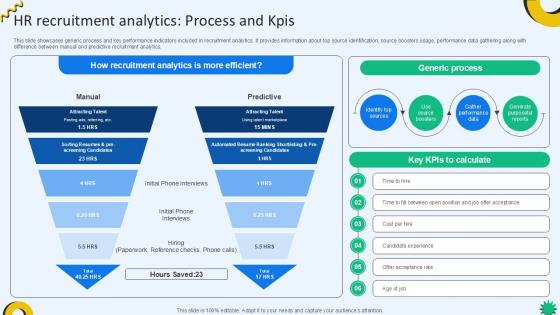
HR Recruitment Analytics Process And KPIs Cloud Recruiting Technologies PPT Sample
This slide showcases generic process and key performance indicators included in recruitment analytics. It provides information about top source identification, source boosters usage, performance data gathering along with difference between manual and predictive recruitment analytics. If you are looking for a format to display your unique thoughts, then the professionally designed HR Recruitment Analytics Process And KPIs Cloud Recruiting Technologies PPT Sample is the one for you. You can use it as a Google Slides template or a PowerPoint template. Incorporate impressive visuals, symbols, images, and other charts. Modify or reorganize the text boxes as you desire. Experiment with shade schemes and font pairings. Alter, share or cooperate with other people on your work. Download HR Recruitment Analytics Process And KPIs Cloud Recruiting Technologies PPT Sample and find out how to give a successful presentation. Present a perfect display to your team and make your presentation unforgettable. This slide showcases generic process and key performance indicators included in recruitment analytics. It provides information about top source identification, source boosters usage, performance data gathering along with difference between manual and predictive recruitment analytics.

HR Recruitment Analytics Process And KPIs Enhancing Recruitment Process PPT PowerPoint
This slide showcases generic process and key performance indicators included in recruitment analytics. It provides information about top source identification, source boosters usage, performance data gathering along with difference between manual and predictive recruitment analytics. If you are looking for a format to display your unique thoughts, then the professionally designed HR Recruitment Analytics Process And KPIs Enhancing Recruitment Process PPT PowerPoint is the one for you. You can use it as a Google Slides template or a PowerPoint template. Incorporate impressive visuals, symbols, images, and other charts. Modify or reorganize the text boxes as you desire. Experiment with shade schemes and font pairings. Alter, share or cooperate with other people on your work. Download HR Recruitment Analytics Process And KPIs Enhancing Recruitment Process PPT PowerPoint and find out how to give a successful presentation. Present a perfect display to your team and make your presentation unforgettable. This slide showcases generic process and key performance indicators included in recruitment analytics. It provides information about top source identification, source boosters usage, performance data gathering along with difference between manual and predictive recruitment analytics.
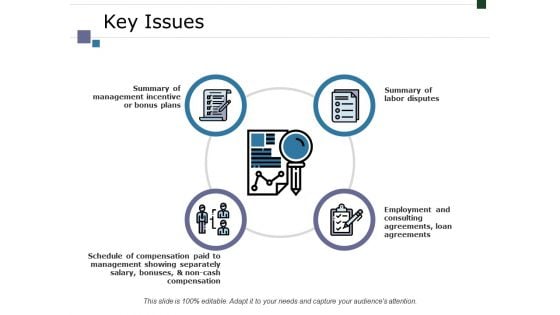
Key Issues Ppt PowerPoint Presentation Infographic Template Example 2015
This is a key issues ppt powerpoint presentation infographic template example 2015. This is a four stage process. The stages in this process are business, summary of management incentive or bonus plans, summary of labor disputes, employment and consulting agreements, loan agreements, management.


 Continue with Email

 Home
Home


