Meter Icon
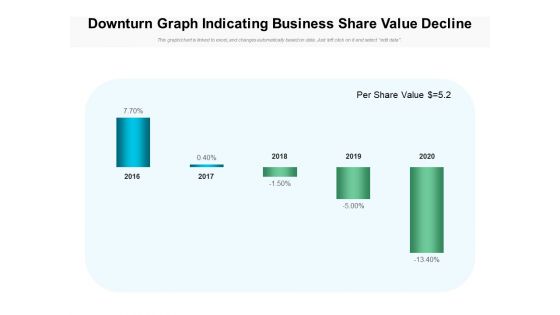
Downturn Graph Indicating Business Share Value Decline Ppt PowerPoint Presentation Professional Elements PDF
Showcasing this set of slides titled downturn graph indicating business share value decline ppt powerpoint presentation professional elements pdf. The topics addressed in these templates are per share value, 2016 to 2020. All the content presented in this PPT design is completely editable. Download it and make adjustments in color, background, font etc. as per your unique business setting.
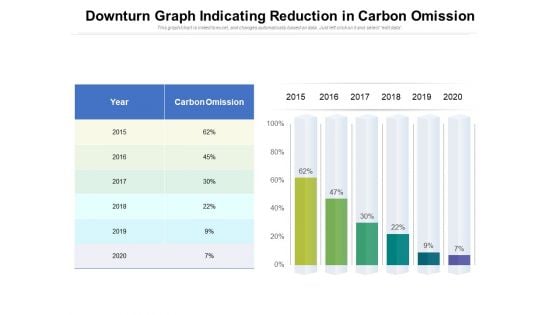
Downturn Graph Indicating Reduction In Carbon Omission Ppt PowerPoint Presentation Outline Inspiration PDF
Showcasing this set of slides titled downturn graph indicating reduction in carbon omission ppt powerpoint presentation outline inspiration pdf. The topics addressed in these templates are carbon omission, year, 2015 to 2020. All the content presented in this PPT design is completely editable. Download it and make adjustments in color, background, font etc. as per your unique business setting.
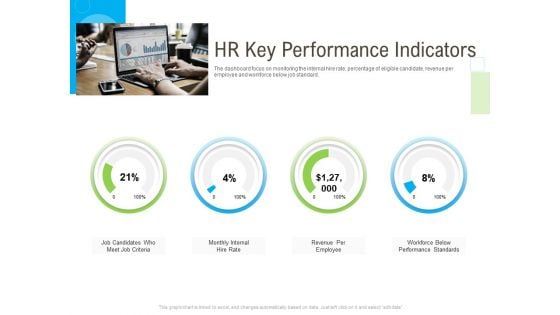
Rapid Innovation In HR Technology Space HR Key Performance Indicators Slides PDF
Deliver an awe inspiring pitch with this creative rapid innovation in hr technology space hr key performance indicators slides pdf bundle. Topics like criteria, workforce, performance, revenue, internal can be discussed with this completely editable template. It is available for immediate download depending on the needs and requirements of the user.
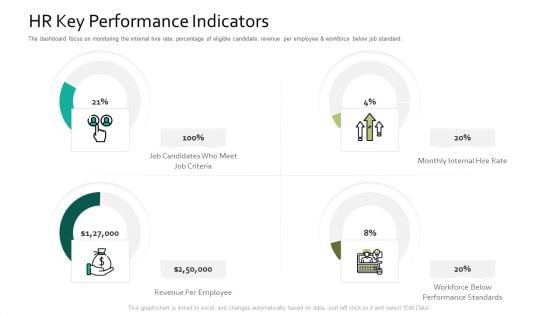
HR Key Performance Indicators Human Resource Information System For Organizational Effectiveness Pictures PDF
Deliver an awe inspiring pitch with this creative hr key performance indicators human resource information system for organizational effectiveness pictures pdf bundle. Topics like revenue, employee, performance, rate can be discussed with this completely editable template. It is available for immediate download depending on the needs and requirements of the user.
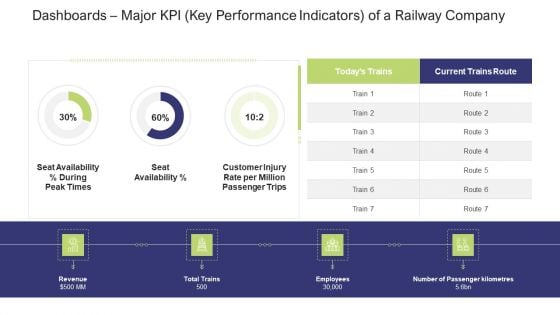
Dashboards Major KPI Key Performance Indicators Of A Railway Company Information PDF
Deliver an awe-inspiring pitch with this creative dashboards major KPI key performance indicators of a railway company information pdf. bundle. Topics like seat availability percent during, peak times, seat availability percent can be discussed with this completely editable template. It is available for immediate download depending on the needs and requirements of the user.
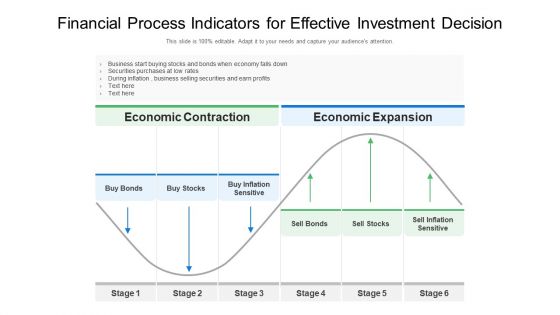
Financial Process Indicators For Effective Investment Decision Ppt PowerPoint Presentation Gallery Objects PDF
Presenting our well structured financial process indicators for effective investment decision ppt powerpoint presentation gallery objects pdf. The topics discussed in this slide are economic expansion, economic contraction, stocks. This is an instantly available PowerPoint presentation that can be edited conveniently. Download it right away and captivate your audience.
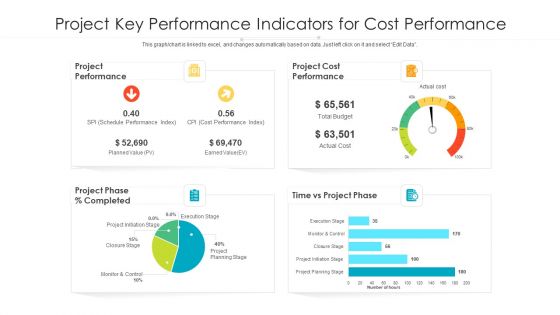
Project Key Performance Indicators For Cost Performance Ppt PowerPoint Presentation File Visuals PDF
Pitch your topic with ease and precision using this project key performance indicators for cost performance ppt powerpoint presentation file rules pdf. This layout presents information on project performance, project cost performance, schedule performance, closure stage. It is also available for immediate download and adjustment. So, changes can be made in the color, design, graphics or any other component to create a unique layout.
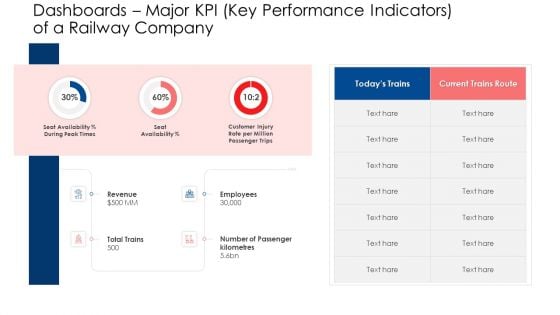
Dashboards Major KPI Key Performance Indicators Of A Railway Company Formats PDF
Deliver an awe inspiring pitch with this creative dashboards major kpi key performance indicators of a railway company formats pdf bundle. Topics like revenue, employees, dashboards can be discussed with this completely editable template. It is available for immediate download depending on the needs and requirements of the user.
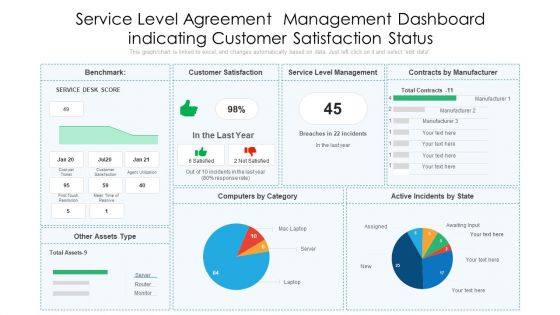
Service Level Agreement Management Dashboard Indicating Customer Satisfaction Status Designs PDF
Pitch your topic with ease and precision using this service level agreement management dashboard indicating customer satisfaction status designs pdf. This layout presents information on customer satisfaction, service level management, contracts by manufacturer. It is also available for immediate download and adjustment. So, changes can be made in the color, design, graphics or any other component to create a unique layout.
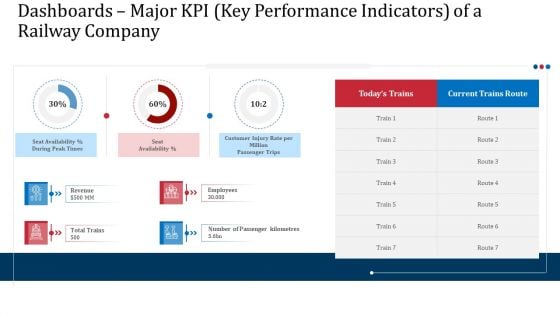
Dashboards Major KPI Key Performance Indicators Of A Railway Company Professional PDF
Deliver an awe inspiring pitch with this creative dashboards major kpi key performance indicators of a railway company professional pdf bundle. Topics like dashboards positive train control ptc implementation by freight and passenger trains can be discussed with this completely editable template. It is available for immediate download depending on the needs and requirements of the user.
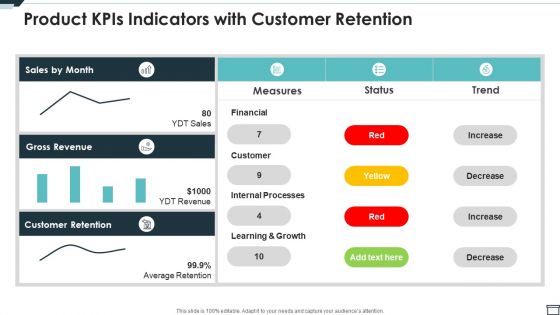
Product Kpis Indicators With Customer Retention Ppt PowerPoint Presentation File Examples PDF
Showcasing this set of slides titled product kpis indicators with customer retention ppt powerpoint presentation file examples pdf. The topics addressed in these templates are customer, financial, measures. All the content presented in this PPT design is completely editable. Download it and make adjustments in color, background, font etc. as per your unique business setting.
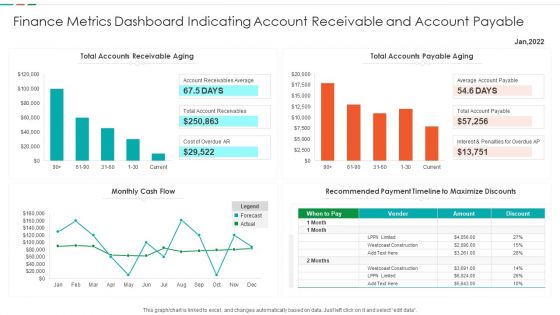
Finance Metrics Dashboard Indicating Account Receivable And Account Payable Demonstration PDF
This graph or chart is linked to excel, and changes automatically based on data. Just left click on it and select edit data. Showcasing this set of slides titled Finance Metrics Dashboard Indicating Account Receivable And Account Payable Demonstration PDF. The topics addressed in these templates are Total Accounts Receivable, Total Accounts Payable, Recommended Payment Timeline, Monthly Cash Flow. All the content presented in this PPT design is completely editable. Download it and make adjustments in color, background, font etc. as per your unique business setting.
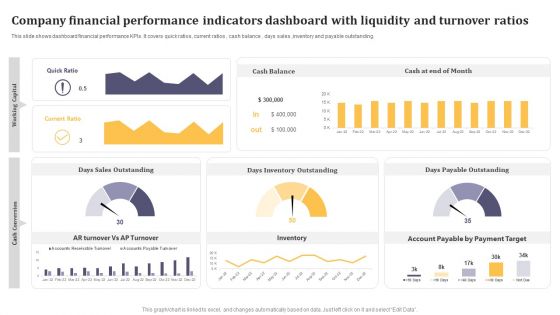
Company Financial Performance Indicators Dashboard With Liquidity And Turnover Ratios Formats PDF
This graph or chart is linked to excel, and changes automatically based on data. Just left click on it and select Edit Data. Pitch your topic with ease and precision using this Company Financial Performance Indicators Dashboard With Liquidity And Turnover Ratios Formats PDF. This layout presents information on Cash Balance, Days Inventory Outstanding, Days Payable Outstanding. It is also available for immediate download and adjustment. So, changes can be made in the color, design, graphics or any other component to create a unique layout.
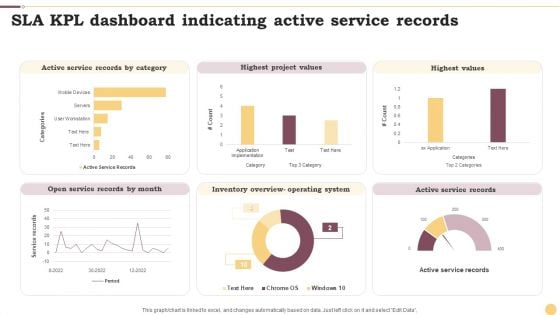
SLA KPL Dashboard Indicating Active Service Records Ppt Professional Graphics Example PDF
This graph or chart is linked to excel, and changes automatically based on data. Just left click on it and select Edit Data. Pitch your topic with ease and precision using this SLA KPL Dashboard Indicating Active Service Records Ppt Professional Graphics Example PDF. This layout presents information on Active Service Records, Highest Project Values, Highest Values. It is also available for immediate download and adjustment. So, changes can be made in the color, design, graphics or any other component to create a unique layout.
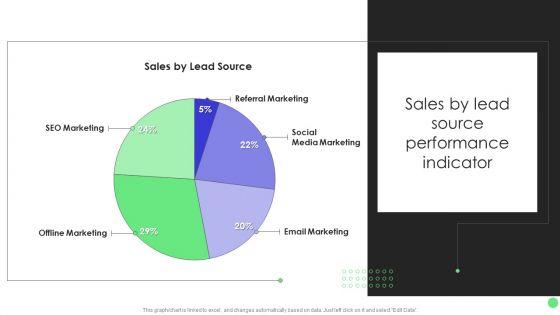
Comprehensive Guide For Launch Sales By Lead Source Performance Indicator Inspiration PDF
This graph or chart is linked to excel, and changes automatically based on data. Just left click on it and select Edit Data. The Comprehensive Guide For Launch Sales By Lead Source Performance Indicator Inspiration PDF is a compilation of the most recent design trends as a series of slides. It is suitable for any subject or industry presentation, containing attractive visuals and photo spots for businesses to clearly express their messages. This template contains a variety of slides for the user to input data, such as structures to contrast two elements, bullet points, and slides for written information. Slidegeeks is prepared to create an impression.
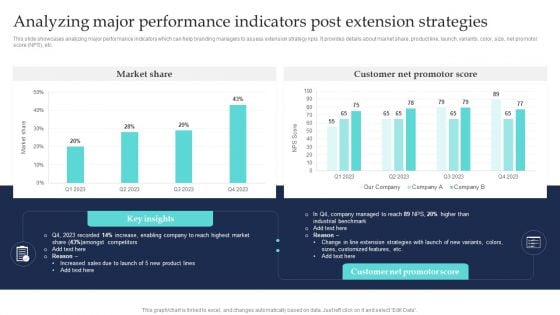
Commodity Line Extension Techniques Analyzing Major Performance Indicators Post Slides PDF
This slide showcases analyzing major performance indicators which can help branding managers to assess extension strategy kpis. It provides details about market share, product line, launch, variants, color, size, net promotor score NPS, etc. Slidegeeks is here to make your presentations a breeze with Commodity Line Extension Techniques Analyzing Major Performance Indicators Post Slides PDF With our easy-to-use and customizable templates, you can focus on delivering your ideas rather than worrying about formatting. With a variety of designs to choose from, youre sure to find one that suits your needs. And with animations and unique photos, illustrations, and fonts, you can make your presentation pop. So whether youre giving a sales pitch or presenting to the board, make sure to check out Slidegeeks first.
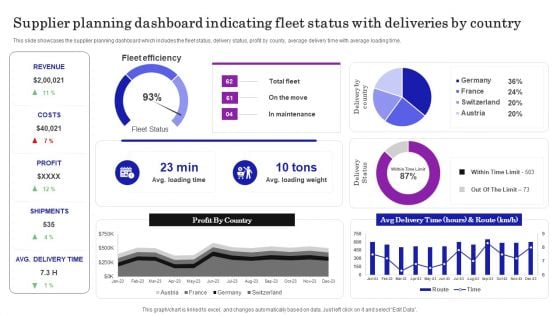
Supplier Planning Dashboard Indicating Fleet Status With Deliveries By Country Ideas PDF
This slide showcases the supplier planning dashboard which includes the fleet status, delivery status, profit by county, average delivery time with average loading time. Here you can discover an assortment of the finest PowerPoint and Google Slides templates. With these templates, you can create presentations for a variety of purposes while simultaneously providing your audience with an eye catching visual experience. Download Supplier Planning Dashboard Indicating Fleet Status With Deliveries By Country Ideas PDF to deliver an impeccable presentation. These templates will make your job of preparing presentations much quicker, yet still, maintain a high level of quality. Slidegeeks has experienced researchers who prepare these templates and write high quality content for you. Later on, you can personalize the content by editing the Supplier Planning Dashboard Indicating Fleet Status With Deliveries By Country Ideas PDF.
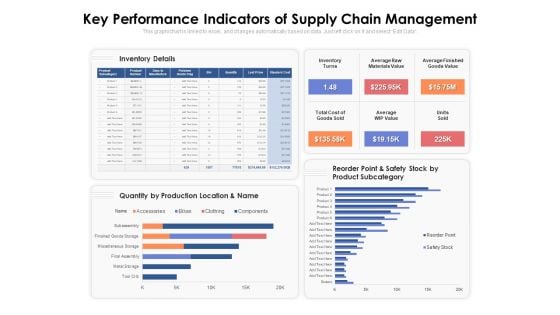
Key Performance Indicators Of Supply Chain Management Ppt PowerPoint Presentation Model Portfolio PDF
Presenting this set of slides with name key performance indicators of supply chain management ppt powerpoint presentation model portfolio pdf. The topics discussed in these slides are inventory details, inventory turns, average raw materials value, average finished goods value, total cost of goods sold, average wip value, units sold. This is a completely editable PowerPoint presentation and is available for immediate download. Download now and impress your audience.
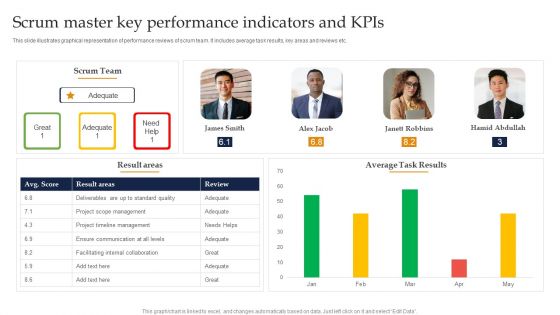
Scrum Master Key Performance Indicators And Kpis Ppt Gallery Files PDF
This slide illustrates graphical representation of performance reviews of scrum team. It includes average task results, key areas and reviews etc. Showcasing this set of slides titled Scrum Master Key Performance Indicators And Kpis Ppt Gallery Files PDF. The topics addressed in these templates are Scrum Team, Average Task Results, Project Timeline Management. All the content presented in this PPT design is completely editable. Download it and make adjustments in color, background, font etc. as per your unique business setting.
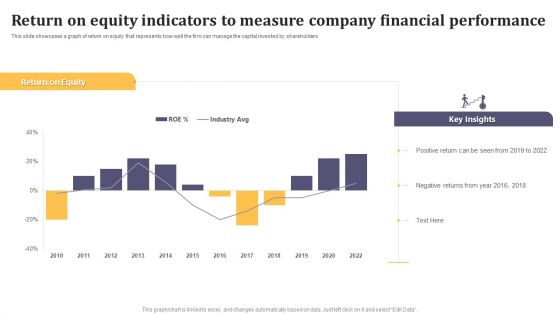
Return On Equity Indicators To Measure Company Financial Performance Mockup PDF
This slide showcases a graph of return on equity that represents how well the firm can manage the capital invested by shareholders. Pitch your topic with ease and precision using this Return On Equity Indicators To Measure Company Financial Performance Mockup PDF. This layout presents information on Return On Equity, Key Insights, Positive Return. It is also available for immediate download and adjustment. So, changes can be made in the color, design, graphics or any other component to create a unique layout.
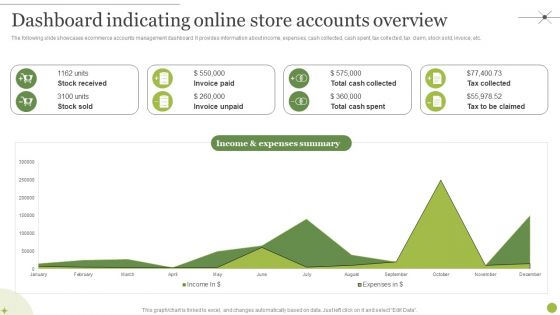
Managing E Commerce Business Accounting Dashboard Indicating Online Store Accounts Overview Inspiration PDF
The following slide showcases ecommerce accounts management dashboard. It provides information about income, expenses, cash collected, cash spent, tax collected, tax claim, stock sold, invoice, etc. There are so many reasons you need a Managing E Commerce Business Accounting Dashboard Indicating Online Store Accounts Overview Inspiration PDF. The first reason is you can not spend time making everything from scratch, Thus, Slidegeeks has made presentation templates for you too. You can easily download these templates from our website easily.
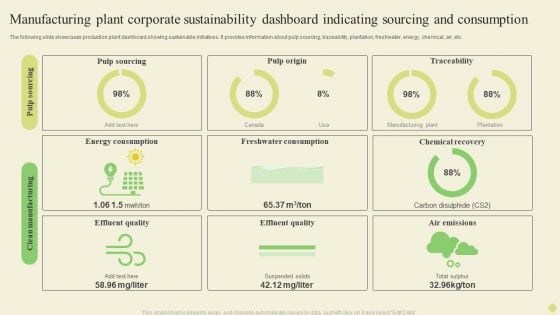
Manufacturing Plant Corporate Sustainability Dashboard Indicating Sourcing And Consumption Infographics PDF
The following slide showcases business sustainability dashboard highlighting multiple sources of technology. It provides information about renewable energy, plant age, solar, wind, biomass, regionality, etc.Pitch your topic with ease and precision using this Manufacturing Plant Corporate Sustainability Dashboard Indicating Sourcing And Consumption Infographics PDF. This layout presents information on Energy Consumption, Freshwater Consumption, Chemical Recovery. It is also available for immediate download and adjustment. So, changes can be made in the color, design, graphics or any other component to create a unique layout.

Debt Retrieval Techniques Our Key Performance Indicators For Balance Sheet Ppt Pictures Gallery PDF
Purpose of the following side is to display the major KPI for the balance sheet as it highlight the key components such as current asset, current liabilities, total assets and total liability of the organization for the financial year 2020 2021 Deliver and pitch your topic in the best possible manner with this debt retrieval techniques our key performance indicators for balance sheet ppt pictures gallery pdf. Use them to share invaluable insights on current assets, current liabilities, total assets, total liabilities and impress your audience. This template can be altered and modified as per your expectations. So, grab it now.
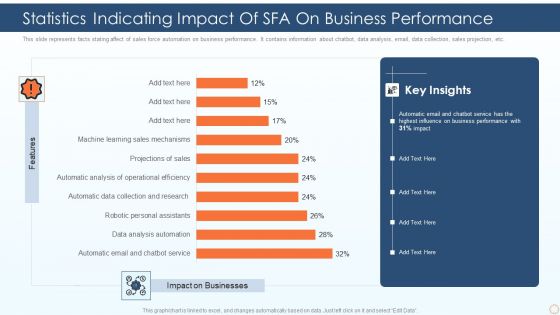
Statistics Indicating Impact Of SFA On Business Performance Ppt PowerPoint Presentation Gallery Outfit PDF
This slide represents facts stating affect of sales force automation on business performance. It contains information about chatbot, data analysis, email, data collection, sales projection, etc. Pitch your topic with ease and precision using this statistics indicating impact of sfa on business performance ppt powerpoint presentation gallery outfit pdf. This layout presents information on automatic email and chatbot service, data analysis automation, robotic personal assistants. It is also available for immediate download and adjustment. So, changes can be made in the color, design, graphics or any other component to create a unique layout.
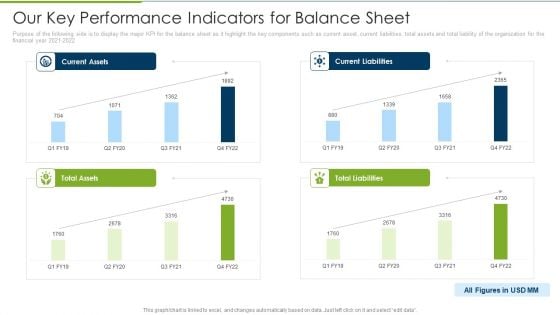
Debt Collection Improvement Plan Our Key Performance Indicators For Balance Sheet Professional PDF
Purpose of the following side is to display the major KPI for the balance sheet as it highlight the key components such as current asset, current liabilities, total assets and total liability of the organization for the financial year 2021 to 2022. Deliver and pitch your topic in the best possible manner with this debt collection improvement plan our key performance indicators for balance sheet professional pdf. Use them to share invaluable insights on current assets, current liabilities, total assets, total liabilities and impress your audience. This template can be altered and modified as per your expectations. So, grab it now.
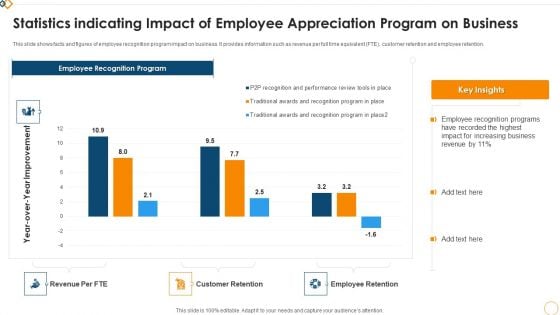
Statistics Indicating Impact Of Employee Appreciation Program On Business Graphics PDF
This slide shows facts and figures of employee recognition program impact on business. It provides information such as revenue per full time equivalent FTE, customer retention and employee retention. Showcasing this set of slides titled Statistics Indicating Impact Of Employee Appreciation Program On Business Graphics PDF. The topics addressed in these templates are Employee Recognition Program, Revenue Per FTE, Customer Retention. All the content presented in this PPT design is completely editable. Download it and make adjustments in color, background, font etc. as per your unique business setting.
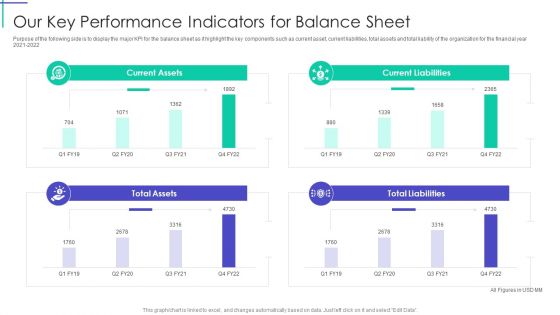
Mortgage Recovery Strategy For Finance Companies Our Key Performance Indicators For Balance Sheet Inspiration PDF
Purpose of the following side is to display the major KPI for the balance sheet as it highlight the key components such as current asset, current liabilities, total assets and total liability of the organization for the financial year 2021 to 2022. Deliver an awe inspiring pitch with this creative Mortgage Recovery Strategy For Finance Companies Our Key Performance Indicators For Balance Sheet Inspiration PDF bundle. Topics like Current Assets, Current Liabilities, Total Liabilities can be discussed with this completely editable template. It is available for immediate download depending on the needs and requirements of the user.
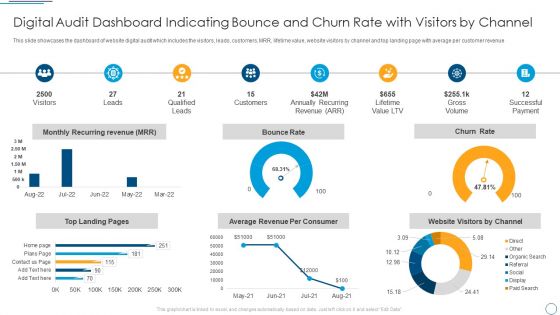
Digital Audit Dashboard Indicating Bounce And Churn Rate With Visitors By Channel Demonstration PDF
This slide showcases the dashboard of website digital audit which includes the visitors, leads, customers, MRR, lifetime value, website visitors by channel and top landing page with average per customer revenue.Deliver and pitch your topic in the best possible manner with this Digital Audit Dashboard Indicating Bounce And Churn Rate With Visitors By Channel Demonstration PDF. Use them to share invaluable insights on Qualified Leads, Annually Recurring, Successful Payment and impress your audience. This template can be altered and modified as per your expectations. So, grab it now.
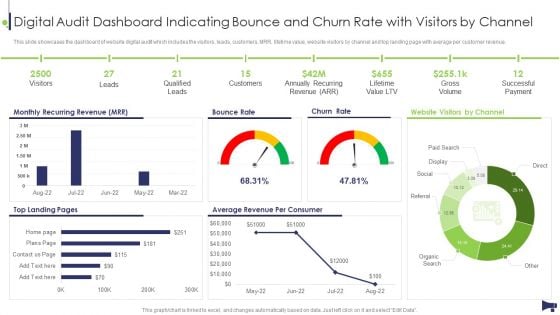
Website And Social Media Digital Audit Dashboard Indicating Bounce And Churn Rate Template PDF
This slide showcases the dashboard of website digital audit which includes the visitors, leads, customers, MRR, lifetime value, website visitors by channel and top landing page with average per customer revenue. Deliver and pitch your topic in the best possible manner with this Website And Social Media Digital Audit Dashboard Indicating Bounce And Churn Rate Template PDF. Use them to share invaluable insights on Monthly Recurring Revenue, Bounce Rate, Churn Rate and impress your audience. This template can be altered and modified as per your expectations. So, grab it now.
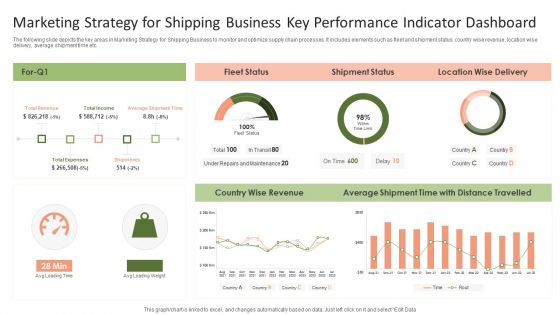
Marketing Strategy For Shipping Business Key Performance Indicator Dashboard Graphics PDF
The following slide depicts the key areas in Marketing Strategy for Shipping Business to monitor and optimize supply chain processes. It includes elements such as fleet and shipment status, country wise revenue, location wise delivery, average shipment time etc.Pitch your topic with ease and precision using this Marketing Strategy For Shipping Business Key Performance Indicator Dashboard Graphics PDF. This layout presents information on Shipment Status, Average Shipment, Wise Revenue. It is also available for immediate download and adjustment. So, changes can be made in the color, design, graphics or any other component to create a unique layout.
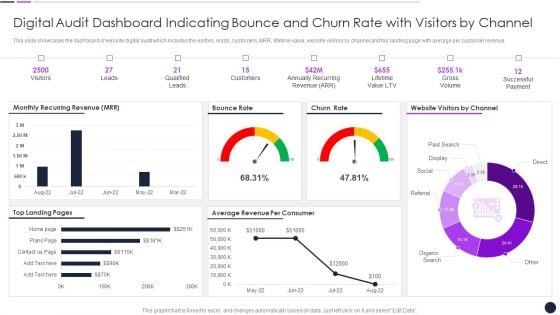
Digital Audit Dashboard Indicating Bounce And Churn Rate With Visitors By Channel Inspiration PDF
This slide showcases the dashboard of website digital audit which includes the visitors, leads, customers, MRR, lifetime value, website visitors by channel and top landing page with average per customer revenue.Deliver and pitch your topic in the best possible manner with this Digital Audit Dashboard Indicating Bounce And Churn Rate With Visitors By Channel Inspiration PDF. Use them to share invaluable insights on Qualified Leads, Annually Recurring, Lifetime Value and impress your audience. This template can be altered and modified as per your expectations. So, grab it now.

Digital Audit Dashboard Indicating Bounce And Churn Rate With Visitors By Channel Information PDF
This slide showcases the dashboard of website digital audit which includes the visitors, leads, customers, MRR, lifetime value, website visitors by channel and top landing page with average per customer revenue. Deliver an awe inspiring pitch with this creative Digital Audit Dashboard Indicating Bounce And Churn Rate With Visitors By Channel Information PDF bundle. Topics like Monthly Recurring Revenue, Bounce Rate, Churn Rate can be discussed with this completely editable template. It is available for immediate download depending on the needs and requirements of the user.
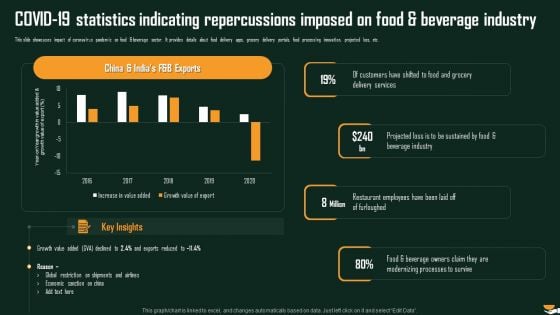
COVID 19 Statistics Indicating Repercussions Imposed On Food And Beverage Industry Demonstration PDF
This slide showcases impact of coronavirus pandemic on food beverage sector. It provides details about food delivery apps, grocery delivery portals, food processing innovation, projected loss, etc. Deliver and pitch your topic in the best possible manner with this COVID 19 Statistics Indicating Repercussions Imposed On Food And Beverage Industry Demonstration PDF. Use them to share invaluable insights on Delivery Services, Beverage Industry, Sustained Food and impress your audience. This template can be altered and modified as per your expectations. So, grab it now.
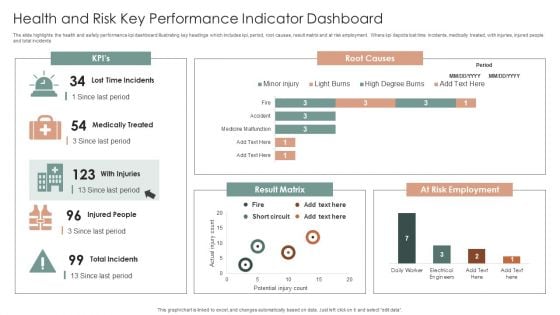
Health And Risk Key Performance Indicator Dashboard Ppt Layouts Graphics Design PDF
The slide highlights the health and safety performance kpi dashboard illustrating key headings which includes kpi, period, root causes, result matrix and at risk employment. Where kpi depicts lost time incidents, medically treated, with injuries, injured people and total incidents. Showcasing this set of slides titled Health And Risk Key Performance Indicator Dashboard Ppt Layouts Graphics Design PDF. The topics addressed in these templates are Root Causes, Result Matrix, At Risk Employment. All the content presented in this PPT design is completely editable. Download it and make adjustments in color, background, font etc. as per your unique business setting.
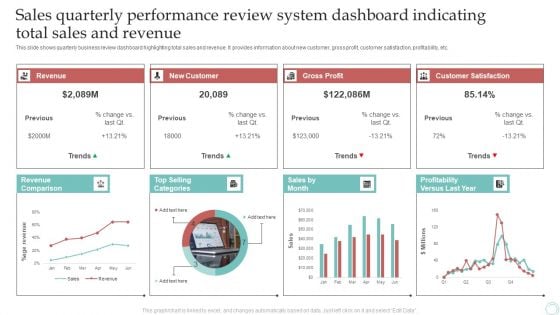
Sales Quarterly Performance Review System Dashboard Indicating Total Sales And Revenue Download PDF
This slide shows quarterly business review dashboard highlighting total sales and revenue. It provides information about new customer, gross profit, customer satisfaction, profitability, etc. Pitch your topic with ease and precision using this Sales Quarterly Performance Review System Dashboard Indicating Total Sales And Revenue Download PDF. This layout presents information on Revenue, New Customer, Gross Profit. It is also available for immediate download and adjustment. So, changes can be made in the color, design, graphics or any other component to create a unique layout.
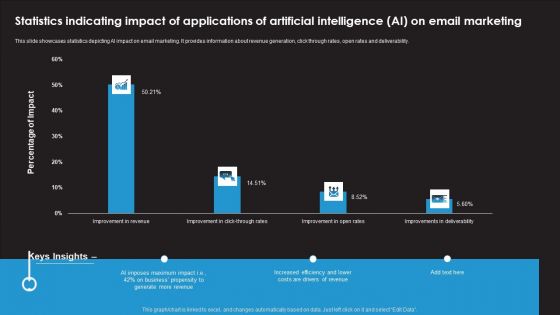
Statistics Indicating Impact Of Applications Of Artificial Intelligence AI On Email Marketing Inspiration PDF
This slide showcases statistics depicting AI impact on email marketing. It provides information about revenue generation, click through rates, open rates and deliverability. Showcasing this set of slides titled Statistics Indicating Impact Of Applications Of Artificial Intelligence AI On Email Marketing Inspiration PDF. The topics addressed in these templates are AI Imposes Maximum Impact, Business Propensity, Increased Efficiency. All the content presented in this PPT design is completely editable. Download it and make adjustments in color, background, font etc. as per your unique business setting.
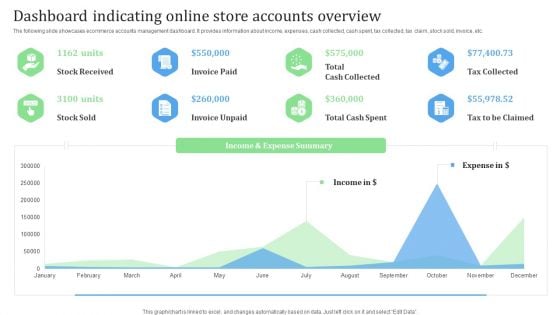
Dashboard Indicating Online Store Accounts Overview Financial Management Strategies Clipart PDF
The following slide showcases ecommerce accounts management dashboard. It provides information about income, expenses, cash collected, cash spent, tax collected, tax claim, stock sold, invoice, etc.From laying roadmaps to briefing everything in detail, our templates are perfect for you. You can set the stage with your presentation slides. All you have to do is download these easy-to-edit and customizable templates. Dashboard Indicating Online Store Accounts Overview Financial Management Strategies Clipart PDF will help you deliver an outstanding performance that everyone would remember and praise you for. Do download this presentation today.
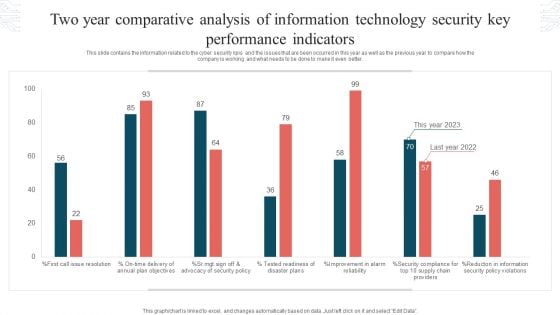
Two Year Comparative Analysis Of Information Technology Security Key Performance Indicators Graphics PDF
This slide contains the information related to the cyber security kpis and the issues that are been occurred in this year as well as the previous year to compare how the company is working and what needs to be done to make it even better. Showcasing this set of slides titled Two Year Comparative Analysis Of Information Technology Security Key Performance Indicators Graphics PDF. The topics addressed in these templates are Tested Readiness, Disaster Plans, Security Policy Violations. All the content presented in this PPT design is completely editable. Download it and make adjustments in color, background, font etc. as per your unique business setting.
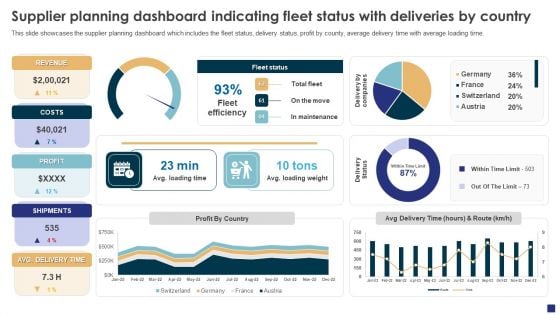
Comprehensive Guide To Ecommerce Supplier Planning Dashboard Indicating Fleet Status Mockup PDF
This slide showcases the supplier planning dashboard which includes the fleet status, delivery status, profit by county, average delivery time with average loading time. Want to ace your presentation in front of a live audience Our Comprehensive Guide To Ecommerce Supplier Planning Dashboard Indicating Fleet Status Mockup PDF can help you do that by engaging all the users towards you.. Slidegeeks experts have put their efforts and expertise into creating these impeccable powerpoint presentations so that you can communicate your ideas clearly. Moreover, all the templates are customizable, and easy-to-edit and downloadable. Use these for both personal and commercial use.
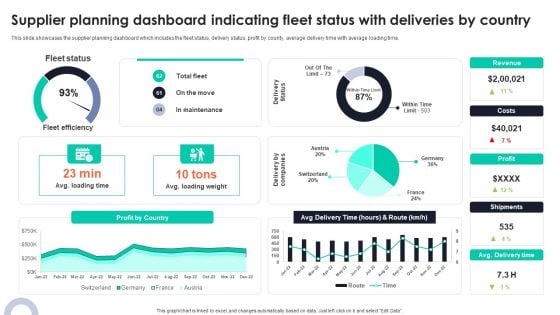
Supplier Planning Dashboard Indicating Fleet Status With Deliveries By Country Graphics PDF
Present like a pro with Supplier Planning Dashboard Indicating Fleet Status With Deliveries By Country Graphics PDF Create beautiful presentations together with your team, using our easy to use presentation slides. Share your ideas in real time and make changes on the fly by downloading our templates. So whether you are in the office, on the go, or in a remote location, you can stay in sync with your team and present your ideas with confidence. With Slidegeeks presentation got a whole lot easier. Grab these presentations today.
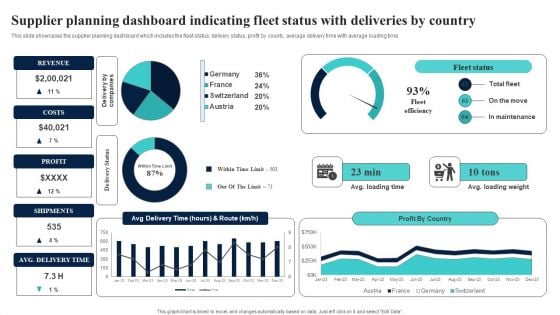
Supplier Planning Dashboard Indicating Fleet Status With Deliveries By Country Microsoft PDF
This slide showcases the supplier planning dashboard which includes the fleet status, delivery status, profit by county, average delivery time with average loading time. This Supplier Planning Dashboard Indicating Fleet Status With Deliveries By Country Microsoft PDF from Slidegeeks makes it easy to present information on your topic with precision. It provides customization options, so you can make changes to the colors, design, graphics, or any other component to create a unique layout. It is also available for immediate download, so you can begin using it right away. Slidegeeks has done good research to ensure that you have everything you need to make your presentation stand out. Make a name out there for a brilliant performance.
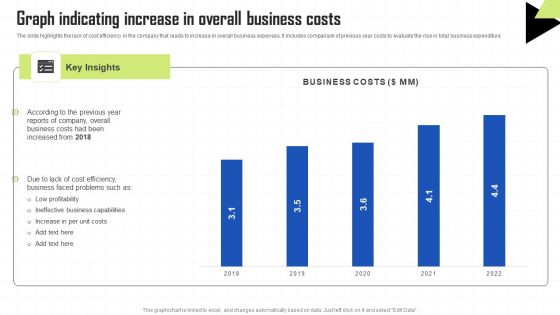
Key Techniques To Enhance Cost Efficiency Graph Indicating Increase In Overall Business Costs Structure PDF
The slide highlights the lack of cost efficiency in the company that leads to increase in overall business expenses. It includes comparison of previous year costs to evaluate the rise in total business expenditure Welcome to our selection of the Key Techniques To Enhance Cost Efficiency Graph Indicating Increase In Overall Business Costs Structure PDF. These are designed to help you showcase your creativity and bring your sphere to life. Planning and Innovation are essential for any business that is just starting out. This collection contains the designs that you need for your everyday presentations. All of our PowerPoints are 100 percent editable, so you can customize them to suit your needs. This multi purpose template can be used in various situations. Grab these presentation templates today.
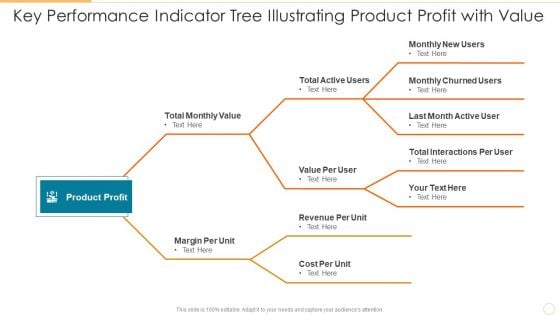
Key Performance Indicator Tree Illustrating Product Profit With Value Brochure PDF
Persuade your audience using this key performance indicator tree illustrating product profit with value brochure pdf. This PPT design covers three stages, thus making it a great tool to use. It also caters to a variety of topics including value per user, revenue per unit, cost per unit. Download this PPT design now to present a convincing pitch that not only emphasizes the topic but also showcases your presentation skills.
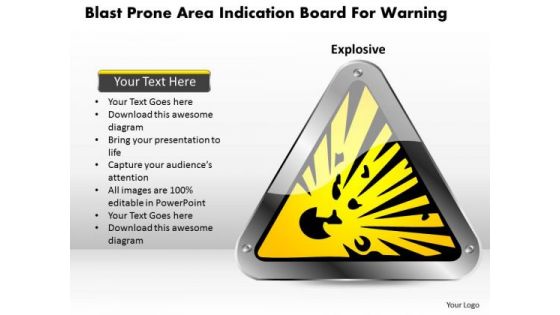
Business Diagram Blast Prone Area Indication Board For Warning Presentation Template
This Power Point template has been designed with graphic of warning symbol. This diagram contains the concept of warning sign for blast prone area. Use this diagram for warning and safety related topics.
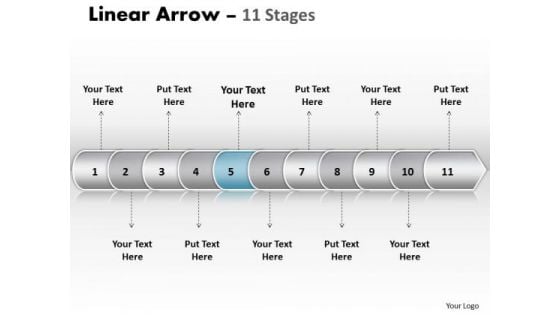
Usa Ppt Template Linear Arrow 11 Phase Diagram Time Management PowerPoint 6 Design
USA PPT template linear arrow 11 phase diagram time management powerpoint 6 design-This linear arrow chart makes information accessible throughout the organization with a collective, visible view of critical data from different perspectives and providing the tools to upcoming business scenarios and plan for change.-USA PPT template linear arrow 11 phase diagram time management powerpoint 6 design-Arrow, Background, Collection, Completed, Concept, Confirmation, Design, Flow, Graph, Graphic, Illustration, Indication, Indicator, Information, Instruction, Interface, Internet, Layout, Measurement, Order, Phase, Pointer, Process, Progress, Reflection, Scale, Shape, Sign Integrate teams with our Usa Ppt Template Linear Arrow 11 Phase Diagram Time Management PowerPoint 6 Design. Download without worries with our money back guaranteee.
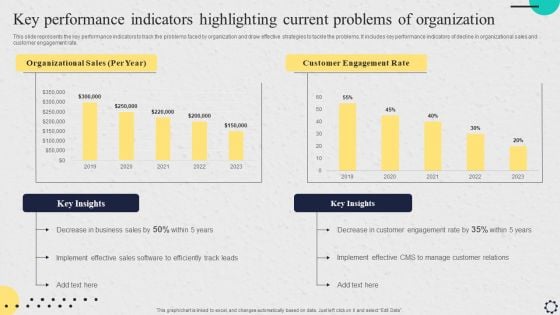
Software Implementation Strategy Key Performance Indicators Highlighting Current Problems Of Organization Professional PDF
This slide represents the key performance indicators to track the problems faced by organization and draw effective strategies to tackle the problems. It includes key performance indicators of decline in organizational sales and customer engagement rate. Make sure to capture your audiences attention in your business displays with our gratis customizable Software Implementation Strategy Key Performance Indicators Highlighting Current Problems Of Organization Professional PDF. These are great for business strategies, office conferences, capital raising or task suggestions. If you desire to acquire more customers for your tech business and ensure they stay satisfied, create your own sales presentation with these plain slides.

Glowing Spiral Christmas Tree Festival PowerPoint Templates Ppt Background For Slides 1112
We present our Glowing Spiral Christmas Tree Festival PowerPoint Templates PPT Background For Slides 1112.Present our Festival PowerPoint Templates because you know your business and have a vision for it. Download our Christmas PowerPoint Templates because the Christmas season brings with it cheer and goodwill. Present our Holidays PowerPoint Templates because this is a good example of the strength of teamwork. Download and present our Stars PowerPoint Templates because they are the indicators of the path you have in mind. Download our New year PowerPoint Templates because its New Year time.Use these PowerPoint slides for presentations relating to Glowing christmas tree, new year,festival, christmas, holidays, stars. The prominent colors used in the PowerPoint template are Red, Yellow, White. You can be sure our Glowing Spiral Christmas Tree Festival PowerPoint Templates PPT Background For Slides 1112 are Ultra. Professionals tell us our holidays PowerPoint templates and PPT Slides are Versatile. We assure you our Glowing Spiral Christmas Tree Festival PowerPoint Templates PPT Background For Slides 1112 are specially created by a professional team with vast experience. They diligently strive to come up with the right vehicle for your brilliant Ideas. PowerPoint presentation experts tell us our christmas PowerPoint templates and PPT Slides have awesome images to get your point across. The feedback we get is that our Glowing Spiral Christmas Tree Festival PowerPoint Templates PPT Background For Slides 1112 are Ultra. PowerPoint presentation experts tell us our christmas PowerPoint templates and PPT Slides are Fashionable. Make your audience listen and observe with our Glowing Spiral Christmas Tree Festival PowerPoint Templates Ppt Background For Slides 1112. You will be at the top of your game.

Christmas Baubles Hanging On Abstract PowerPoint Templates Ppt Backgrounds For Slides 1112
We present our Christmas Baubles Hanging On Abstract PowerPoint Templates PPT Backgrounds For Slides 1112.Download our Christmas PowerPoint Templates because you can Amplify your views, ideas and thoughts from very basic aspects to the highly technical and complicated issus using this template as a tool. Download our Festival PowerPoint Templates because they are the indicators of the path you have in mind. Download our Holidays PowerPoint Templates because The search for new holiday spots is an ongoing quest for many. Slightly off the beaten track but worth a visit. Download and present our New year PowerPoint Templates because another year is coming to a close. Download our Stars PowerPoint Templates because you can Master them all and you have it made.Use these PowerPoint slides for presentations relating to Hanging christmas baubles, christmas, holidays, new year, festival, stars. The prominent colors used in the PowerPoint template are Pink, Blue light, Blue. Presenters tell us our Christmas Baubles Hanging On Abstract PowerPoint Templates PPT Backgrounds For Slides 1112 provide great value for your money. Be assured of finding the best projection to highlight your words. Professionals tell us our year PowerPoint templates and PPT Slides are Royal. Presenters tell us our Christmas Baubles Hanging On Abstract PowerPoint Templates PPT Backgrounds For Slides 1112 are Amazing. Presenters tell us our baubles PowerPoint templates and PPT Slides are Wonderful. Use our Christmas Baubles Hanging On Abstract PowerPoint Templates PPT Backgrounds For Slides 1112 are Festive. PowerPoint presentation experts tell us our holidays PowerPoint templates and PPT Slides are Amazing. Enter the professional club with our Christmas Baubles Hanging On Abstract PowerPoint Templates Ppt Backgrounds For Slides 1112. You will come out on top.
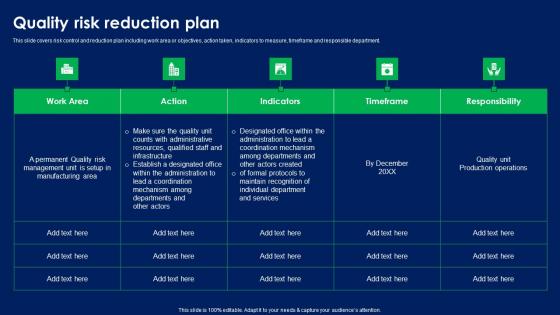
Quality Risk Reduction Plan Quality Risk Assessment Diagrams PDF
This slide covers risk control and reduction plan including work area or objectives, action taken, indicators to measure, timeframe and responsible department. This Quality Risk Reduction Plan Quality Risk Assessment Diagrams PDF is perfect for any presentation, be it in front of clients or colleagues. It is a versatile and stylish solution for organizing your meetings. The Quality Risk Reduction Plan Quality Risk Assessment Diagrams PDF features a modern design for your presentation meetings. The adjustable and customizable slides provide unlimited possibilities for acing up your presentation. Slidegeeks has done all the homework before launching the product for you. So, do not wait, grab the presentation templates today This slide covers risk control and reduction plan including work area or objectives, action taken, indicators to measure, timeframe and responsible department.
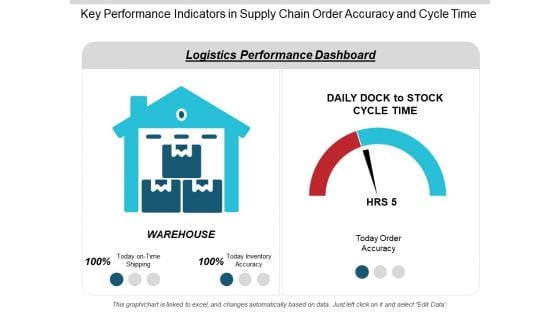
Key Performance Indicators In Supply Chain Order Accuracy And Cycle Time Ppt PowerPoint Presentation Infographics Slideshow
This is a key performance indicators in supply chain order accuracy and cycle time ppt powerpoint presentation infographics slideshow. This is a two stage process. The stages in this process are logistics performance, logistics dashboard, logistics kpis.
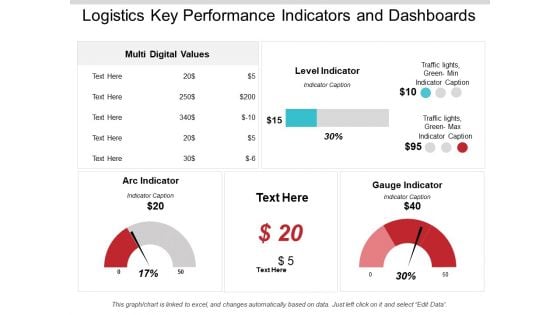
Logistics Key Performance Indicators And Dashboards Ppt PowerPoint Presentation Infographics Background Image
This is a logistics key performance indicators and dashboards ppt powerpoint presentation infographics background image. This is a three stage process. The stages in this process are logistics performance, logistics dashboard, logistics kpis.
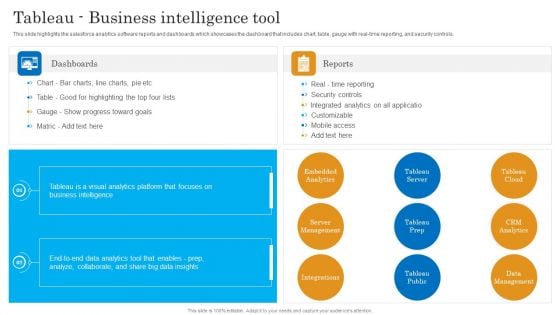
Tableau Business Intelligence Tool Salesforce Business Profile Diagrams PDF
This slide highlights the salesforce analytics software reports and dashboards which showcases the dashboard that includes chart, table, gauge with real-time reporting, and security controls. Deliver an awe inspiring pitch with this creative Tableau Business Intelligence Tool Salesforce Business Profile Diagrams PDF bundle. Topics like Server Management, Embedded Analytics, Security Controls can be discussed with this completely editable template. It is available for immediate download depending on the needs and requirements of the user.
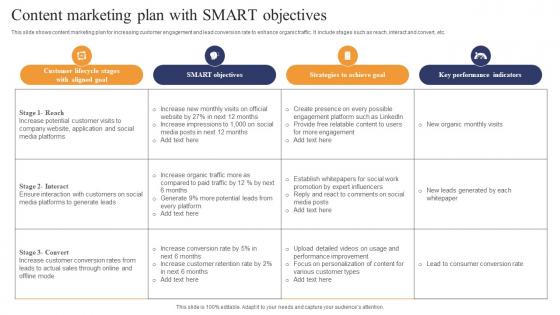
Content Marketing Plan With Smart Objectives Diagrams Pdf
This slide shows content marketing plan for increasing customer engagement and lead conversion rate to enhance organic traffic. It include stages such as reach, interact and convert, etc. Pitch your topic with ease and precision using this Content Marketing Plan With Smart Objectives Diagrams Pdf This layout presents information on Customer Lifecycle, Strategies, Performance Indicators It is also available for immediate download and adjustment. So, changes can be made in the color, design, graphics or any other component to create a unique layout. This slide shows content marketing plan for increasing customer engagement and lead conversion rate to enhance organic traffic. It include stages such as reach, interact and convert, etc.
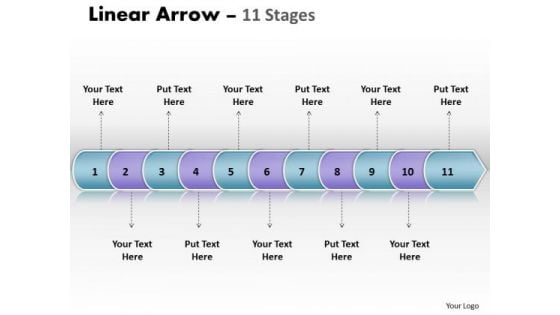
Usa Ppt Linear Arrow 11 Phase Diagram Business Management PowerPoint Image
USA PPT linear arrow 11 phase diagram business management powerpoint Image-This Linear Diagram is simple but nice enough to illustrate your thoughts and experiences to your staff. Explain in detail you assessment of the need for care to ensure continued smooth progress.-USA PPT linear arrow 11 phase diagram business management powerpoint Image-Arrow, Background, Collection, Completed, Concept, Confirmation, Design, Flow, Graph, Graphic, Illustration, Indication, Indicator, Information, Instruction, Interface, Internet, Layout, Measurement, Order, Phase, Pointer, Process, Progress, Reflection, Scale, Shape, Sign Deliberate on the evidence with our Usa Ppt Linear Arrow 11 Phase Diagram Business Management PowerPoint Image. Draw conclusions from the bare facts.
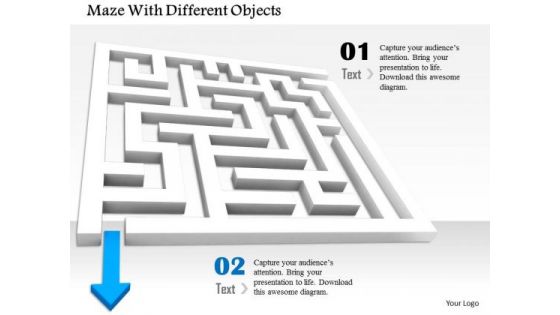
Stock Photo Blue Arrow Indicating Way Out From Maze PowerPoint Slide
This image is designed with blue arrow indication way out of maze. Use this professional image to demonstrate concepts of problem solving and finding solution. Use this theme of maze to give unified look to your presentations.

Ppt Background 3d Illustration Of 5 Phase Diagram Partnership Transaction 6 Image
We present our PPT Background 3d illustration of 5 phase diagram partnership transaction 6 Image. Use our Arrows PowerPoint Templates because, It is a step by step process with levels rising at every stage. Use our Circle Charts PowerPoint Templates because, You have it all down to a T. Use our Shapes PowerPoint Templates because, Illustrate your ideas and imprint them in the minds of your team with this template. Use our Business PowerPoint Templates because; Break it all down to Key Result Areas. Use our Process and Flows PowerPoint Templates because, they are indicators of the path you have in mind. Use these PowerPoint slides for presentations relating to background, blog, business, chain, communication, connection, constructive, contact, design, diagonal, dialog, digital, flow, global, interaction, internet, line, linear, network, partner, pointer, reaction, social, stream, structure, system, team,. The prominent colors used in the PowerPoint template are Pink, Gray, and Black Our Ppt Background 3d Illustration Of 5 Phase Diagram Partnership Transaction 6 Image are fairly far sighted. They help you see clearly into the distance.
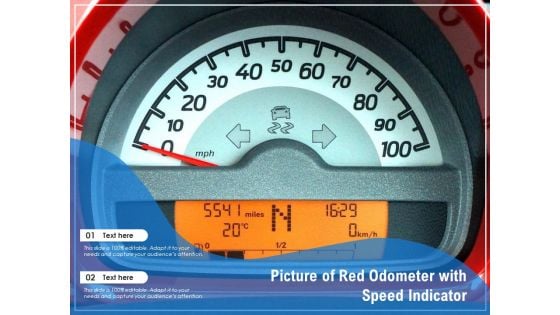
Picture Of Red Odometer With Speed Indicator Ppt PowerPoint Presentation Summary Ideas PDF
Presenting picture of red odometer with speed indicator ppt powerpoint presentation summary ideas pdf to dispense important information. This template comprises two stages. It also presents valuable insights into the topics including picture of red odometer, speed indicator. This is a completely customizable PowerPoint theme that can be put to use immediately. So, download it and address the topic impactfully.
Key Performance Indicators For Business Growth Management Ppt PowerPoint Presentation Outline Layout PDF
Presenting key performance indicators for business growth management ppt powerpoint presentation outline layout pdf to dispense important information. This template comprises three stages. It also presents valuable insights into the topics including key performance indicators for business growth management. This is a completely customizable PowerPoint theme that can be put to use immediately. So, download it and address the topic impactfully.
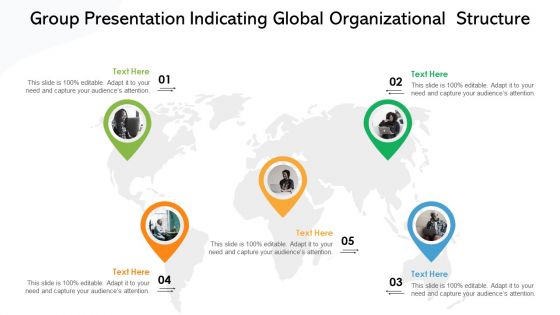
Group Presentation Indicating Global Organizational Structure Ppt PowerPoint Presentation File Infographics PDF
Presenting group presentation indicating global organizational structure ppt powerpoint presentation file infographics pdf to dispense important information. This template comprises five stages. It also presents valuable insights into the topics including group presentation indicating global organizational structure. This is a completely customizable PowerPoint theme that can be put to use immediately. So, download it and address the topic impactfully.
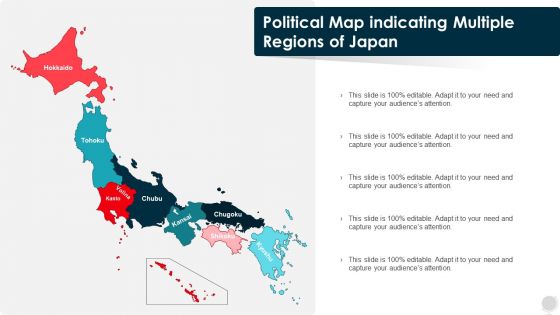
Political Map Indicating Multiple Regions Of Japan Ppt PowerPoint Presentation Gallery Inspiration PDF
Presenting Political Map Indicating Multiple Regions Of Japan Ppt PowerPoint Presentation Gallery Inspiration PDF to dispense important information. This template comprises one stages. It also presents valuable insights into the topics including Political Map Indicating Multiple Regions Of Japan. This is a completely customizable PowerPoint theme that can be put to use immediately. So, download it and address the topic impactfully.
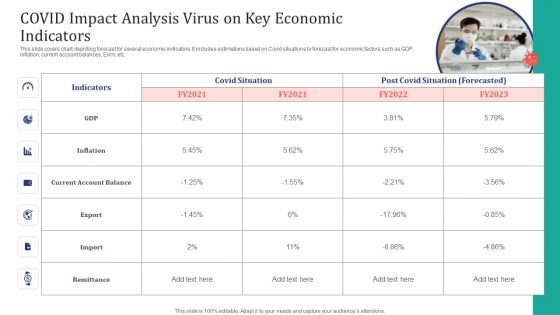
COVID Impact Analysis Virus On Key Economic Indicators Ppt Pictures Inspiration PDF
This slide covers chart depicting forecast for several economic indicators. It includes estimations based on Covid situations to forecast for economic factors such as GDP, inflation, current account balances, Exim, etc. Pitch your topic with ease and precision using this COVID Impact Analysis Virus On Key Economic Indicators Ppt Pictures Inspiration PDF. This layout presents information on Covid Situation, Post Covid Situation, Current Account Balance. It is also available for immediate download and adjustment. So, changes can be made in the color, design, graphics or any other component to create a unique layout.

Iot And Digital Twin To Reduce Costs Post Covid Key Performance Indicators In Oil And Gas Industry Infographics PDF
This slide focuses on the key performance indicators in oil and gas industry which includes loss of primary containment, oil spills, greenhouse gas emissions, etc. Deliver an awe inspiring pitch with this creative iot and digital twin to reduce costs post covid key performance indicators in oil and gas industry infographics pdf bundle. Topics like reported recordable injury frequency, loss of primary containment, oil spills, diversity and inclusion, group priorities engagement can be discussed with this completely editable template. It is available for immediate download depending on the needs and requirements of the user.
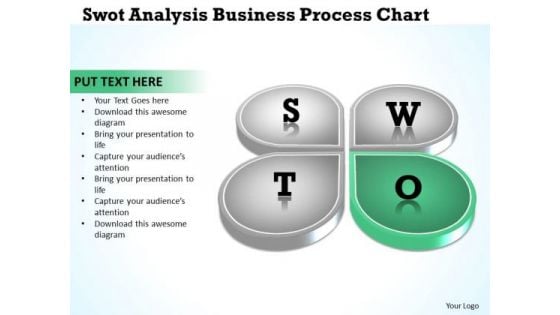
Business Logic Diagram Analysis PowerPoint Theme Process Chart Ppt Templates
We present our business logic diagram analysis powerpoint theme process chart ppt templates.Download and present our Business PowerPoint Templates because Our PowerPoint Templates and Slides are conceived by a dedicated team. Use them and give form to your wondrous ideas. Download and present our Shapes PowerPoint Templates because These PowerPoint Templates and Slides will give the updraft to your ideas. See them soar to great heights with ease. Use our Success PowerPoint Templates because You can Create a matrix with our PowerPoint Templates and Slides. Feel the strength of your ideas click into place. Download and present our Flow Charts PowerPoint Templates because You canTake a leap off the starting blocks with our PowerPoint Templates and Slides. They will put you ahead of the competition in quick time. Download and present our Process and Flows PowerPoint Templates because Our PowerPoint Templates and Slides will bullet point your ideas. See them fall into place one by one.Use these PowerPoint slides for presentations relating to Business, center, circle, circular, circulation, concept, control, cycle, development, diagram, direction, flow, graphic, green, idea, illustration, indicator, iterative, life, lifecycle, loop, management, method, mix, motion, movement, nature, pointer, process, propeller, quality, range, recycling, research, ring, rotation, round, schema, spectrum, spiral, step, strategy, success. The prominent colors used in the PowerPoint template are Green, Gray, White. People tell us our business logic diagram analysis powerpoint theme process chart ppt templates are designed by a team of presentation professionals. PowerPoint presentation experts tell us our circular PowerPoint templates and PPT Slides are designed by professionals Presenters tell us our business logic diagram analysis powerpoint theme process chart ppt templates are aesthetically designed to attract attention. We guarantee that they will grab all the eyeballs you need. Use our control PowerPoint templates and PPT Slides will impress their bosses and teams. Customers tell us our business logic diagram analysis powerpoint theme process chart ppt templates are designed by a team of presentation professionals. People tell us our circular PowerPoint templates and PPT Slides are aesthetically designed to attract attention. We guarantee that they will grab all the eyeballs you need. Dont ignore the perils of a boring presentation. Liven it up with our Business Logic Diagram Analysis PowerPoint Theme Process Chart Ppt Templates. Make sure your presentation gets the attention it deserves.
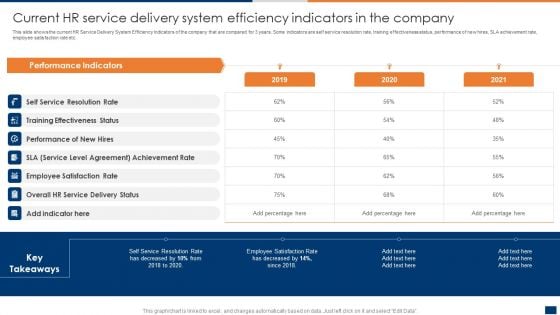
Current HR Service Delivery System Efficiency Indicators In The Company Ppt PowerPoint Presentation File Deck PDF
This slide shows the current HR Service Delivery System Efficiency Indicators of the company that are compared for 3 years. Some indicators are self service resolution rate, training effectiveness status, performance of new hires, SLA achievement rate, employee satisfaction rate etc. If you are looking for a format to display your unique thoughts, then the professionally designed Current HR Service Delivery System Efficiency Indicators In The Company Ppt PowerPoint Presentation File Deck PDF is the one for you. You can use it as a Google Slides template or a PowerPoint template. Incorporate impressive visuals, symbols, images, and other charts. Modify or reorganize the text boxes as you desire. Experiment with shade schemes and font pairings. Alter, share or cooperate with other people on your work. Download Current HR Service Delivery System Efficiency Indicators In The Company Ppt PowerPoint Presentation File Deck PDF and find out how to give a successful presentation. Present a perfect display to your team and make your presentation unforgettable.
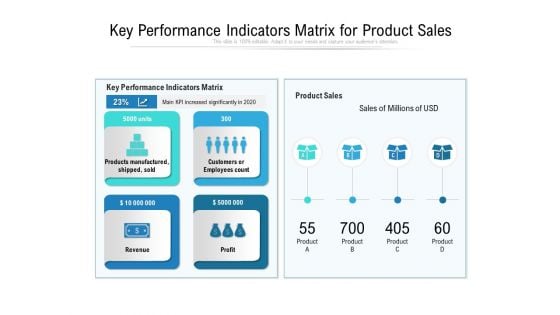
Key Performance Indicators Matrix For Product Sales Ppt PowerPoint Presentation File Clipart PDF
Presenting key performance indicators matrix for product sales ppt powerpoint presentation file clipart pdf to dispense important information. This template comprises four stages. It also presents valuable insights into the topics including manufactured, revenue, performance. This is a completely customizable PowerPoint theme that can be put to use immediately. So, download it and address the topic impactfully.
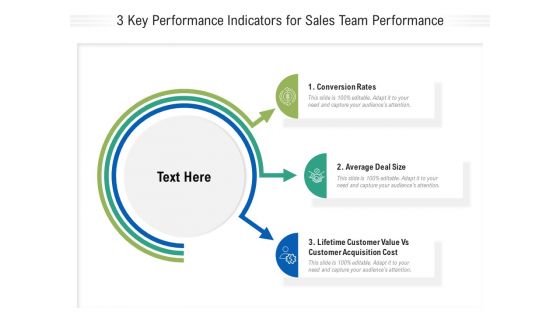
3 Key Performance Indicators For Sales Team Performance Ppt PowerPoint Presentation File Slides PDF
Presenting 3 key performance indicators for sales team performance ppt powerpoint presentation file slides pdf to dispense important information. This template comprises three stages. It also presents valuable insights into the topics including deal, lifetime, customer. This is a completely customizable PowerPoint theme that can be put to use immediately. So, download it and address the topic impactfully.
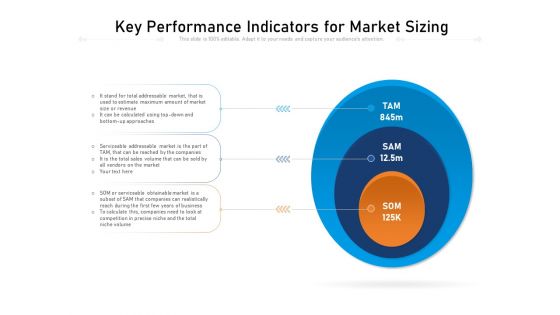
Key Performance Indicators For Market Sizing Ppt PowerPoint Presentation Visuals PDF
Presenting key performance indicators for market sizing ppt powerpoint presentation visuals pdf to dispense important information. This template comprises three stages. It also presents valuable insights into the topics including tam, sam, som. This is a completely customizable PowerPoint theme that can be put to use immediately. So, download it and address the topic impactfully.
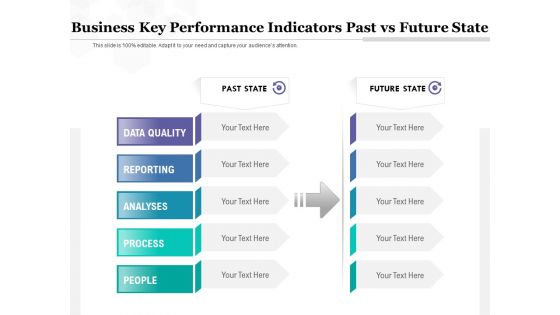
Business Key Performance Indicators Past Vs Future State Ppt PowerPoint Presentation File Format PDF
Presenting business key performance indicators past vs future state ppt powerpoint presentation file format pdf to dispense important information. This template comprises two stages. It also presents valuable insights into the topics including past state, future state. This is a completely customizable PowerPoint theme that can be put to use immediately. So, download it and address the topic impactfully.
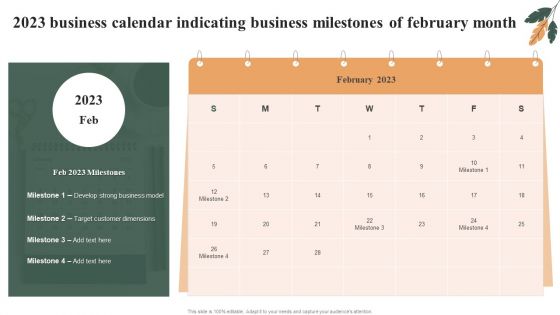
2023 Business Calendar Indicating Business Milestones Of February Month Topics PDF
Presenting 2023 Business Calendar Indicating Business Milestones Of February Month Topics PDF to dispense important information. This template comprises one stages. It also presents valuable insights into the topics including Develop Strong Business Model, Target Customer Dimensions. This is a completely customizable PowerPoint theme that can be put to use immediately. So, download it and address the topic impactfully.
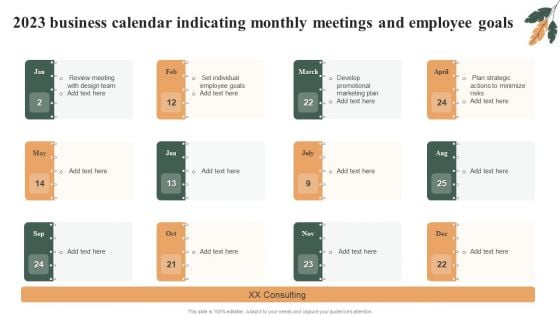
2023 Business Calendar Indicating Monthly Meetings And Employee Goals Template PDF
Presenting 2023 Business Calendar Indicating Monthly Meetings And Employee Goals Template PDF to dispense important information. This template comprises tweleve stages. It also presents valuable insights into the topics including Design Team, Employee Goals, Marketing Plan. This is a completely customizable PowerPoint theme that can be put to use immediately. So, download it and address the topic impactfully.
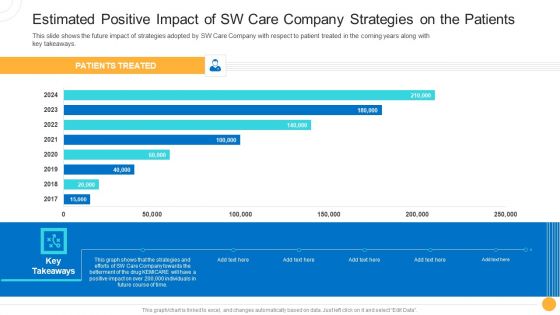
Drug Indicator Extension In A Pharmaceuticals Company Estimated Positive Impact Of SW Care Company Strategies On The Patients Elements PDF
This slide shows the future impact of strategies adopted by SW Care Company with respect to patient treated in the coming years along with key takeaways. Deliver an awe inspiring pitch with this creative drug indicator extension in a pharmaceuticals company estimated positive impact of sw care company strategies on the patients elements pdf bundle. Topics like estimated positive impact of sw care company strategies on the patients can be discussed with this completely editable template. It is available for immediate download depending on the needs and requirements of the user.
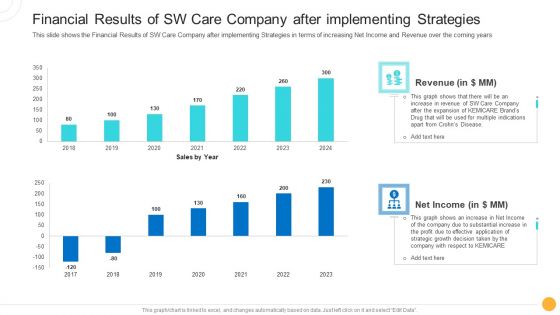
Drug Indicator Extension In A Pharmaceuticals Company Financial Results Of SW Care Company After Implementing Strategies Designs PDF
This slide shows the Financial Results of SW Care Company after implementing Strategies in terms of increasing Net Income and Revenue over the coming years. Deliver and pitch your topic in the best possible manner with this drug indicator extension in a pharmaceuticals company financial results of sw care company after implementing strategies designs pdf. Use them to share invaluable insights on revenue, net income and impress your audience. This template can be altered and modified as per your expectations. So, grab it now.
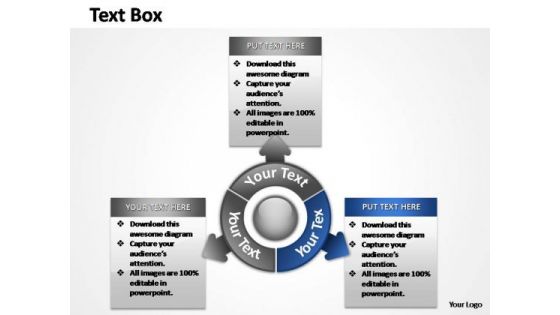
PowerPoint Theme Process Steps Ppt Presentation
Arrows Indicates the way to growth. Use this diagram for improved controls to drive your business towards the right direction Baseless fears can be a bane. Allay them with our PowerPoint Theme Process Steps Ppt Presentation.
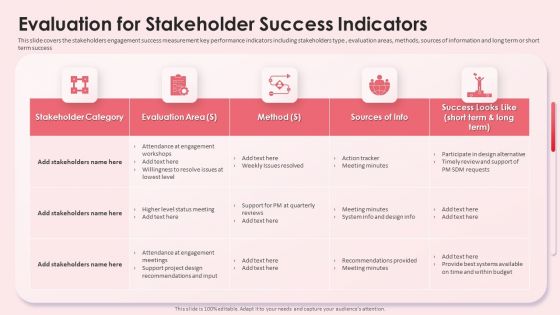
Evaluation For Stakeholder Success Indicators Impact Shareholder Decisions With Stakeholder Administration Clipart PDF
This slide covers the stakeholders engagement success measurement key performance indicators including stakeholders type , evaluation areas, methods, sources of information and long term or short term success. If you are looking for a format to display your unique thoughts, then the professionally designed Evaluation For Stakeholder Success Indicators Impact Shareholder Decisions With Stakeholder Administration Clipart PDF is the one for you. You can use it as a Google Slides template or a PowerPoint template. Incorporate impressive visuals, symbols, images, and other charts. Modify or reorganize the text boxes as you desire. Experiment with shade schemes and font pairings. Alter, share or cooperate with other people on your work. Download Evaluation For Stakeholder Success Indicators Impact Shareholder Decisions With Stakeholder Administration Clipart PDF and find out how to give a successful presentation. Present a perfect display to your team and make your presentation unforgettable.

Major Indicators Of Cybersecurity Insider Threat In Cyber Security Microsoft PDF
This slide shows major indicators of cybersecurity insider threat along with mitigation strategies. It contains information about behavioral, information technology IT sabotage and data theft. Presenting Major Indicators Of Cybersecurity Insider Threat In Cyber Security Microsoft PDF to dispense important information. This template comprises three stages. It also presents valuable insights into the topics including Behavioral, IT Sabotage, Data Theft. This is a completely customizable PowerPoint theme that can be put to use immediately. So, download it and address the topic impactfully.
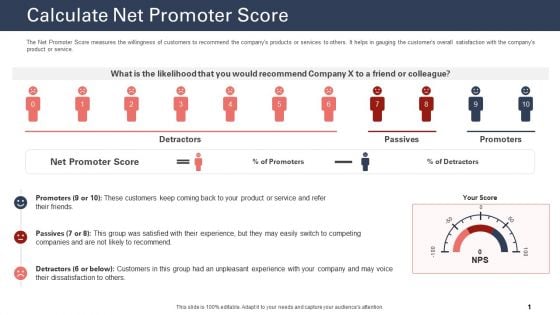
Techniques To Increase Customer Satisfaction Calculate Net Promoter Score Diagrams PDF
The Net Promoter Score measures the willingness of customers to recommend the companys products or services to others. It helps in gauging the customers overall satisfaction with the companys product or service. Deliver an awe inspiring pitch with this creative techniques to increase customer satisfaction calculate net promoter score diagrams pdf bundle. Topics like calculate net promoter score, product or service, net promoter score can be discussed with this completely editable template. It is available for immediate download depending on the needs and requirements of the user.
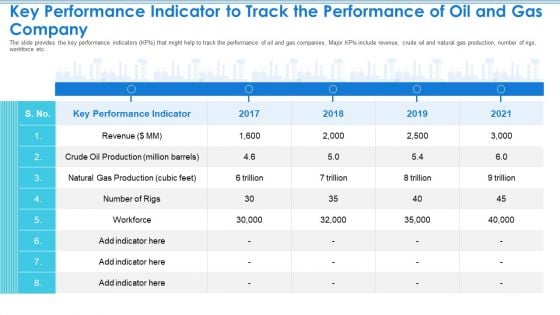
Case Competition Petroleum Sector Issues Key Performance Indicator To Track The Performance Of Oil And Gas Company Diagrams PDF
The slide provides the key performance indicators KPIs that might help to track the performance of oil and gas companies. Major KPIs include revenue, crude oil and natural gas production, number of rigs, workforce etc. Deliver and pitch your topic in the best possible manner with this case competition petroleum sector issues key performance indicator to track the performance of oil and gas company diagrams pdf. Use them to share invaluable insights on key performance indicator, revenue, 2017 to 2021 and impress your audience. This template can be altered and modified as per your expectations. So, grab it now.
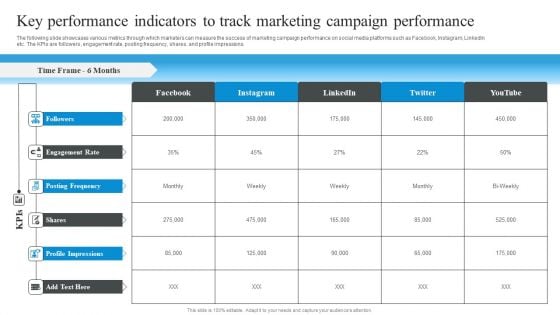
Market Evaluation Of IT Industry Key Performance Indicators To Track Marketing Campaign Performance Slides PDF
The following slide showcases various metrics through which marketers can measure the success of marketing campaign performance on social media platforms such as Facebook, Instagram, LinkedIn etc. The KPIs are followers, engagement rate, posting frequency, shares, and profile impressions. If you are looking for a format to display your unique thoughts, then the professionally designed Market Evaluation Of IT Industry Key Performance Indicators To Track Marketing Campaign Performance Slides PDF is the one for you. You can use it as a Google Slides template or a PowerPoint template. Incorporate impressive visuals, symbols, images, and other charts. Modify or reorganize the text boxes as you desire. Experiment with shade schemes and font pairings. Alter, share or cooperate with other people on your work. Download Market Evaluation Of IT Industry Key Performance Indicators To Track Marketing Campaign Performance Slides PDF and find out how to give a successful presentation. Present a perfect display to your team and make your presentation unforgettable.
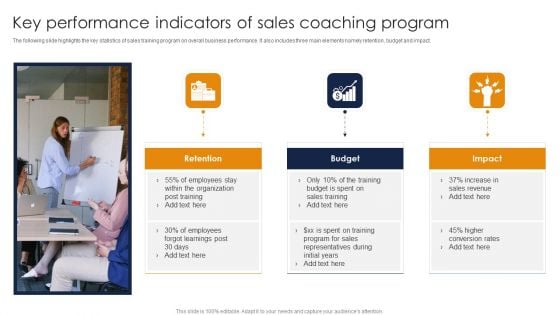
Key Performance Indicators Of Sales Coaching Program Ppt Styles Graphic Images PDF
The following slide highlights the key statistics of sales training program on overall business performance. It also includes three main elements namely retention, budget and impact. Presenting Key Performance Indicators Of Sales Coaching Program Ppt Styles Graphic Images PDF to dispense important information. This template comprises three stages. It also presents valuable insights into the topics including Retention, Budget, Impact, Employee. This is a completely customizable PowerPoint theme that can be put to use immediately. So, download it and address the topic impactfully.
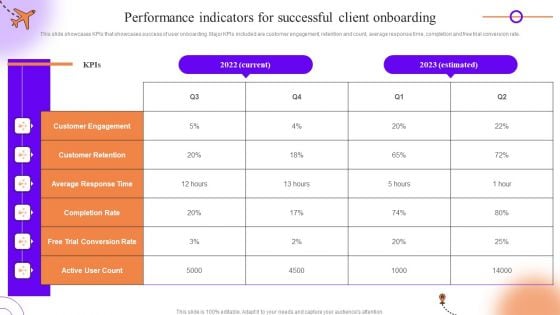
Client Onboarding Journey Impact On Business Performance Indicators For Successful Client Onboarding Elements PDF
This slide showcases KPIs that showcases success of user onboarding. Major KPIs included are customer engagement, retention and count, average response time, completion and free trial conversion rate. Retrieve professionally designed Client Onboarding Journey Impact On Business Performance Indicators For Successful Client Onboarding Elements PDF to effectively convey your message and captivate your listeners. Save time by selecting pre-made slideshows that are appropriate for various topics, from business to educational purposes. These themes come in many different styles, from creative to corporate, and all of them are easily adjustable and can be edited quickly. Access them as PowerPoint templates or as Google Slides themes. You do not have to go on a hunt for the perfect presentation because Slidegeeks got you covered from everywhere.
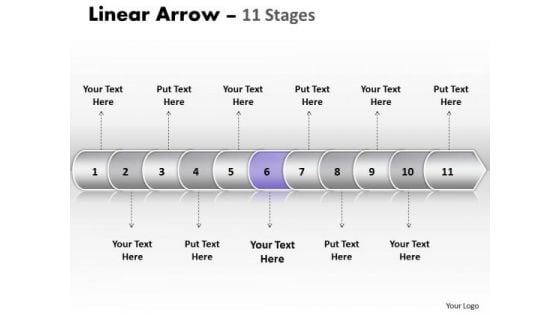
Usa Ppt Template Linear Arrow 11 Phase Diagram Time Management PowerPoint 7 Design
USA PPT template linear arrow 11 phase diagram time management powerpoint 7 design-This diagram is capable of conveying the important characteristics more plainly than what words are capable of doing. Feel the buzz as they comprehend your plan to get the entire act together.-USA PPT template linear arrow 11 phase diagram time management powerpoint 7 design-Arrow, Background, Collection, Completed, Concept, Confirmation, Design, Flow, Graph, Graphic, Illustration, Indication, Indicator, Information, Instruction, Interface, Internet, Layout, Measurement, Order, Phase, Pointer, Process, Progress, Reflection, Scale, Shape, Sign The impact of your ideas will take time to fade. The images of our Usa Ppt Template Linear Arrow 11 Phase Diagram Time Management PowerPoint 7 Design will help their recall.

Electronic Indicator Device Speedometer Ppt PowerPoint Presentation Complete Deck With Slides
If designing a presentation takes a lot of your time and resources and you are looking for a better alternative, then this electronic indicator device speedometer ppt powerpoint presentation complete deck with slides is the right fit for you. This is a prefabricated set that can help you deliver a great presentation on the topic. All the twelve slides included in this sample template can be used to present a birds-eye view of the topic. These slides are also fully editable, giving you enough freedom to add specific details to make this layout more suited to your business setting. Apart from the content, all other elements like color, design, theme are also replaceable and editable. This helps in designing a variety of presentations with a single layout. Not only this, you can use this PPT design in formats like PDF, PNG, and JPG once downloaded. Therefore, without any further ado, download and utilize this sample presentation as per your liking.

Key Performance Indicator Tree Variable Revenue Ppt PowerPoint Presentation Complete Deck With Slides
This key performance indicator tree variable revenue ppt powerpoint presentation complete deck with slides acts as backup support for your ideas, vision, thoughts, etc. Use it to present a thorough understanding of the topic. This PPT slideshow can be utilized for both in-house and outside presentations depending upon your needs and business demands. Entailing twelve slides with a consistent design and theme, this template will make a solid use case. As it is intuitively designed, it suits every business vertical and industry. All you have to do is make a few tweaks in the content or any other component to design unique presentations. The biggest advantage of this complete deck is that it can be personalized multiple times once downloaded. The color, design, shapes, and other elements are free to modify to add personal touches. You can also insert your logo design in this PPT layout. Therefore a well-thought and crafted presentation can be delivered with ease and precision by downloading this key performance indicator tree variable revenue ppt powerpoint presentation complete deck with slides PPT slideshow.
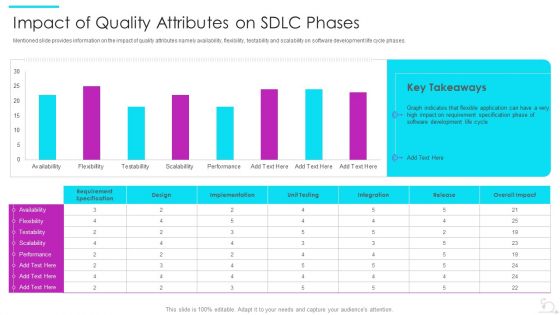
Agile Software Development Lifecycle IT Impact Of Quality Attributes On SDLC Phases Clipart PDF
Mentioned slide provides information on the impact of quality attributes namely availability, flexibility, testability and scalability on software development life cycle phases.Deliver an awe inspiring pitch with this creative agile software development lifecycle it impact of quality attributes on sdlc phases clipart pdf bundle. Topics like indicates that flexible, impact on requirement, software development can be discussed with this completely editable template. It is available for immediate download depending on the needs and requirements of the user.

Process Flow Of Clinical Trial Phases Medical Research Phases For Clinical Tests Elements PDF
This slide indicates the key steps involved in the clinical drug investigation process. The major steps involved are preclinical, phase 1, phase 2, phase 3, phase 4, and phase 5. Are you searching for a Process Flow Of Clinical Trial Phases Medical Research Phases For Clinical Tests Elements PDF that is uncluttered, straightforward, and original Its easy to edit, and you can change the colors to suit your personal or business branding. For a presentation that expresses how much effort you have put in, this template is ideal With all of its features, including tables, diagrams, statistics, and lists, its perfect for a business plan presentation. Make your ideas more appealing with these professional slides. Download Process Flow Of Clinical Trial Phases Medical Research Phases For Clinical Tests Elements PDF from Slidegeeks today.

Business Strategic Development Performance Indicators Ppt PowerPoint Presentation Complete Deck With Slides
Share a great deal of information on the topic by deploying this business strategic development performance indicators ppt powerpoint presentation complete deck with slides. Support your ideas and thought process with this prefabricated set. It includes a set of twelve slides, all fully modifiable and editable. Each slide can be restructured and induced with the information and content of your choice. You can add or remove large content boxes as well, to make this PPT slideshow more personalized. Its high-quality graphics and visuals help in presenting a well-coordinated pitch. This PPT template is also a resourceful tool to take visual cues from and implement the best ideas to help your business grow and expand. The main attraction of this well-formulated deck is that everything is editable, giving you the freedom to adjust it to your liking and choice. Changes can be made in the background and theme as well to deliver an outstanding pitch. Therefore, click on the download button now to gain full access to this multifunctional set.
Quality Assurance Indicator Dashboard Ppt PowerPoint Presentation Complete Deck With Slides
Share a great deal of information on the topic by deploying this Quality Assurance Indicator Dashboard Ppt PowerPoint Presentation Complete Deck With Slides. Support your ideas and thought process with this prefabricated set. It includes a set of Fifteen slides, all fully modifiable and editable. Each slide can be restructured and induced with the information and content of your choice. You can add or remove large content boxes as well, to make this PPT slideshow more personalized. Its high-quality graphics and visuals help in presenting a well-coordinated pitch. This PPT template is also a resourceful tool to take visual cues from and implement the best ideas to help your business grow and expand. The main attraction of this well-formulated deck is that everything is editable, giving you the freedom to adjust it to your liking and choice. Changes can be made in the background and theme as well to deliver an outstanding pitch. Therefore, click on the download button now to gain full access to this multifunctional set.
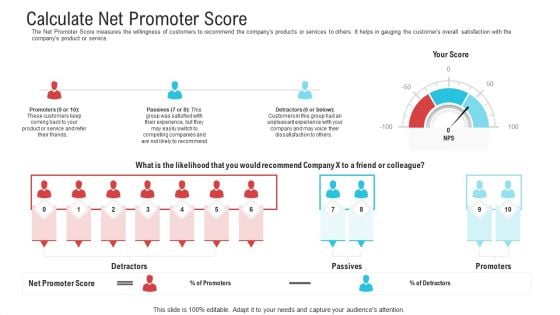
Objective To Improve Customer Experience Calculate Net Promoter Score Slides PDF
The Net Promoter Score measures the willingness of customers to recommend the companys products or services to others. It helps in gauging the customers overall satisfaction with the companys product or service.Deliver an awe-inspiring pitch with this creative objective to improve customer experience calculate net promoter score slides pdf. bundle. Topics like calculate net promoter score can be discussed with this completely editable template. It is available for immediate download depending on the needs and requirements of the user.
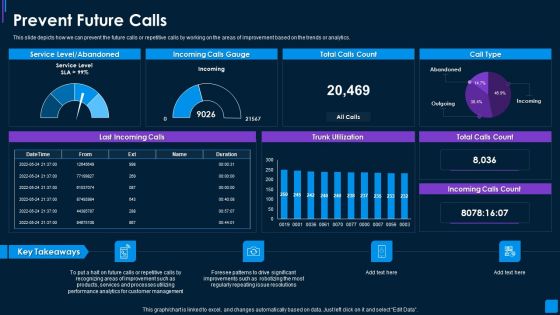
Advance IT Service Delivery Prevent Future Calls Clipart PDF
This slide depicts how we can prevent the future calls or repetitive calls by working on the areas of improvement based on the trends or analytics. Deliver and pitch your topic in the best possible manner with this advance it service delivery prevent future calls clipart pdf. Use them to share invaluable insights on service level, abandoned, incoming calls gauge, total calls count and impress your audience. This template can be altered and modified as per your expectations. So, grab it now.
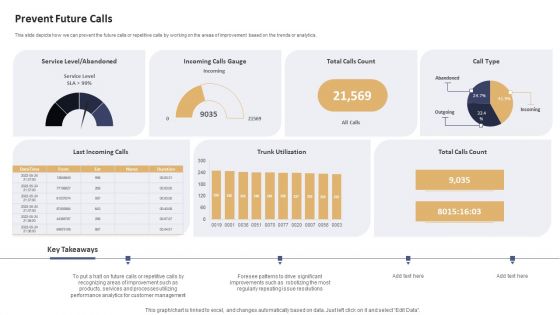
Data Processing Services Delivery Prevent Future Calls Ppt Inspiration Clipart Images PDF
This slide depicts how we can prevent the future calls or repetitive calls by working on the areas of improvement based on the trends or analytics. Deliver an awe inspiring pitch with this creative Data Processing Services Delivery Prevent Future Calls Ppt Inspiration Clipart Images PDF bundle. Topics like Service Level, Abandoned, Incoming Calls Gauge, Total Calls Count can be discussed with this completely editable template. It is available for immediate download depending on the needs and requirements of the user.
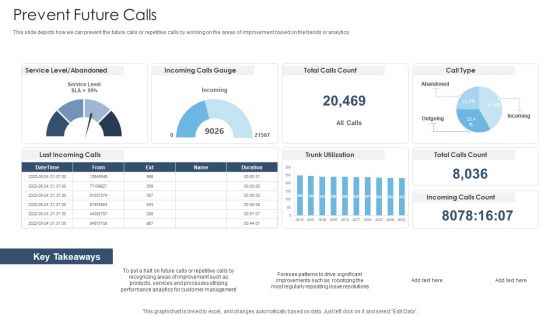
Achieving Proactive From Reactive Prevent Future Calls Structure PDF
This slide depicts how we can prevent the future calls or repetitive calls by working on the areas of improvement based on the trends or analytics. Deliver an awe inspiring pitch with this creative Achieving Proactive From Reactive Prevent Future Calls Structure PDF bundle. Topics like Service Level, Abandoned, Incoming Calls Gauge, Total Calls Count can be discussed with this completely editable template. It is available for immediate download depending on the needs and requirements of the user.

Software Application Marketing Data Analytics Report Mockup PDF
This slide shows app marketing analytics dashboard to gauge how well the marketing efforts are performing. It includes parameters like non organic content, organic content attribution,reengegement. Showcasing this set of slides titled Software Application Marketing Data Analytics Report Mockup PDF. The topics addressed in these templates are Software Application, Marketing Data, Analytics Report. All the content presented in this PPT design is completely editable. Download it and make adjustments in color, background, font etc. as per your unique business setting.

Employee Work Time Utilization Analysis Graph Mockup PDF
The following slide highlights the employee work time assessment to gauge their productivity. It includes activities such as daily tasks, research, meetings, reports, contracting, travel, etc. Showcasing this set of slides titled Employee Work Time Utilization Analysis Graph Mockup PDF. The topics addressed in these templates are Employee Work Time, Utilization Analysis Graph. All the content presented in this PPT design is completely editable. Download it and make adjustments in color, background, font etc. as per your unique business setting.
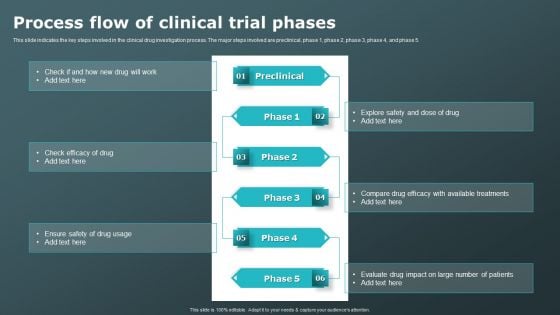
Process Flow Of Clinical Trial Phases Clinical Research Trial Phases Slides PDF
This slide indicates the key steps involved in the clinical drug investigation process. The major steps involved are preclinical, phase 1, phase 2, phase 3, phase 4, and phase 5. Slidegeeks is one of the best resources for PowerPoint templates. You can download easily and regulate Process Flow Of Clinical Trial Phases Clinical Research Trial Phases Slides PDF for your personal presentations from our wonderful collection. A few clicks is all it takes to discover and get the most relevant and appropriate templates. Use our Templates to add a unique zing and appeal to your presentation and meetings. All the slides are easy to edit and you can use them even for advertisement purposes.
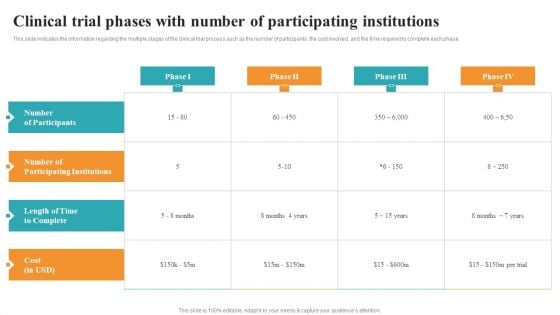
Clinical Trial Phases With Number Of Participating Institutions Medical Research Phases For Clinical Tests Mockup PDF
This slide indicates the information regarding the multiple stages of the clinical trial process such as the number of participants, the cost involved, and the time required to complete each phase. Boost your pitch with our creative Clinical Trial Phases With Number Of Participating Institutions Medical Research Phases For Clinical Tests Mockup PDF. Deliver an awe-inspiring pitch that will mesmerize everyone. Using these presentation templates you will surely catch everyones attention. You can browse the ppts collection on our website. We have researchers who are experts at creating the right content for the templates. So you do not have to invest time in any additional work. Just grab the template now and use them.
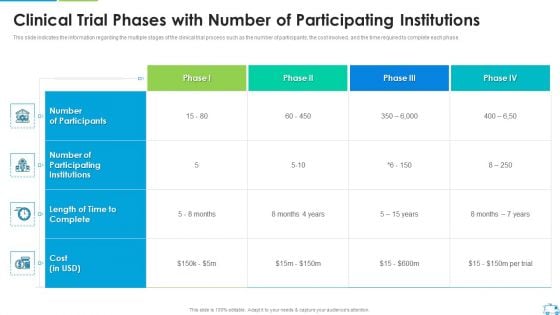
Clinical Trial Phases With Number Of Participating Institutions Clipart PDF
This slide indicates the information regarding the multiple stages of the clinical trial process such as the number of participants, the cost involved, and the time required to complete each phase.Deliver an awe inspiring pitch with this creative Clinical Trial Phases With Number Of Participating Institutions Clipart PDF bundle. Topics like Participating Institutions, Length Of Time, Participants can be discussed with this completely editable template. It is available for immediate download depending on the needs and requirements of the user.
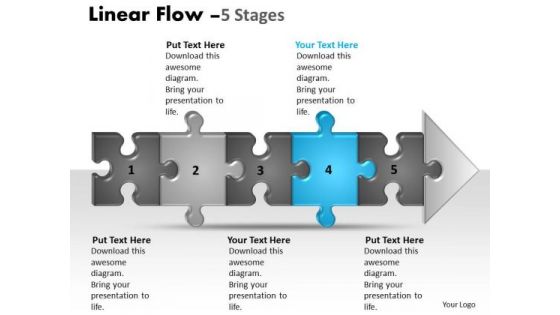
Flow Ppt Linear 5 Phase Diagram Style1 Time Management PowerPoint Design
We present our flow PPT Linear 5 phase diagram style1 time management PowerPoint design. Use our Puzzles or Jigsaws PowerPoint Templates because, Saves your time a prized possession, an ideal aid to give an ideal presentation. Use our Game Pieces PowerPoint Templates because; inform your team ofyour ideas using our illustrative slides. Use our Finance PowerPoint Templates because, they are indicators of the path you have in mind. Use our Shapes PowerPoint Templates because; demonstrate how they contribute to the larger melting pot. Use our Business PowerPoint Templates because, Cycle Template: - Rolling along while gathering profits along the way is the aim. Use these PowerPoint slides for presentations relating to abstract, algorithm, arrow, block diagram, business, chart, color, connection, design, development, diagram, direction, element, flow, graph, linear, linear diagram, management, organization, plan, process, section, segment, set, sign, solution, strategy, symbol, technology, vector. The prominent colors used in the PowerPoint template are Blue, Gray, and Black Help them discover new faith with our Flow Ppt Linear 5 Phase Diagram Style1 Time Management PowerPoint Design. Convert them to your line of thinking.

Business Diagram Bulb With Seventy Five Percent Loading Presentation Template
This power point template has been crafted with graphic of 3d bulb and loading indication. This PPT contains the concept of processing. Use this PPT for your business and marketing related presentations.
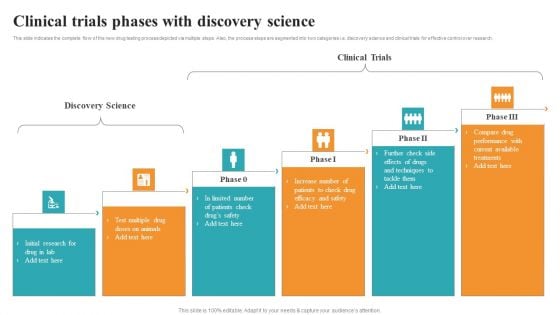
Clinical Trials Phases With Discovery Science Medical Research Phases For Clinical Tests Topics PDF
This slide indicates the complete flow of the new drug testing process depicted via multiple steps. Also, the process steps are segmented into two categories i.e. discovery science and clinical trials for effective control over research. Slidegeeks is here to make your presentations a breeze with Clinical Trials Phases With Discovery Science Medical Research Phases For Clinical Tests Topics PDF With our easy to use and customizable templates, you can focus on delivering your ideas rather than worrying about formatting. With a variety of designs to choose from, you are sure to find one that suits your needs. And with animations and unique photos, illustrations, and fonts, you can make your presentation pop. So whether you are giving a sales pitch or presenting to the board, make sure to check out Slidegeeks first.
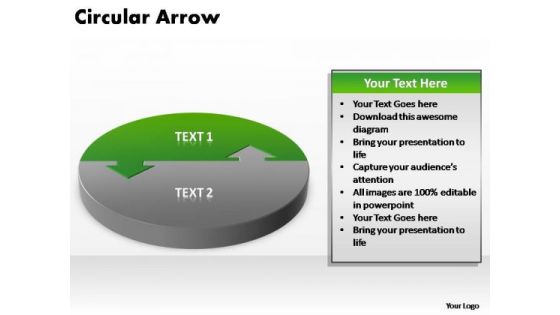
PowerPoint Theme Editable Circular Arrow Ppt Presentation
PowerPoint Theme Editable Circular Arrow PPT Presentation-The arrows indicate the progression of the process. Constant monitoring of the processes provides you with opportunities to concentrate on the core competencies in your business and improve the standards for more effective results.-PowerPoint Theme Editable Circular Arrow PPT Presentation Cull any confusion with our PowerPoint Theme Editable Circular Arrow Ppt Presentation. Your thoughtswill be consistent and cogent.
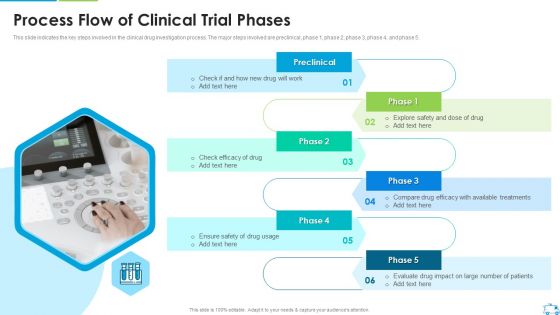
Process Flow Of Clinical Trial Phases Brochure PDF
This slide indicates the key steps involved in the clinical drug investigation process. The major steps involved are preclinical, phase 1, phase 2, phase 3, phase 4, and phase 5.Presenting Process Flow Of Clinical Trial Phases Brochure PDF to provide visual cues and insights. Share and navigate important information on six stages that need your due attention. This template can be used to pitch topics like Available Treatments, Evaluate Drug Impact, Compare Drug Efficacy In addtion, this PPT design contains high resolution images, graphics, etc, that are easily editable and available for immediate download.
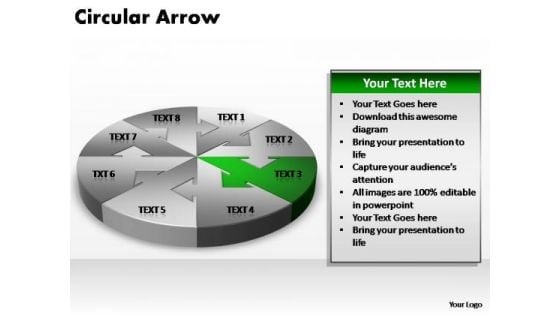
PowerPoint Theme Editable Circular Arrow Ppt Slides
PowerPoint Theme Editable Circular Arrow PPT Slides-The arrows indicate the progression of the process. Constant monitoring of the processes provides you with opportunities to concentrate on the core competencies in your business and improve the standards for more effective results.-PowerPoint Theme Editable Circular Arrow PPT Slides Announce your plans with much ado. Our PowerPoint Theme Editable Circular Arrow Ppt Slides will not let the cheering fade.
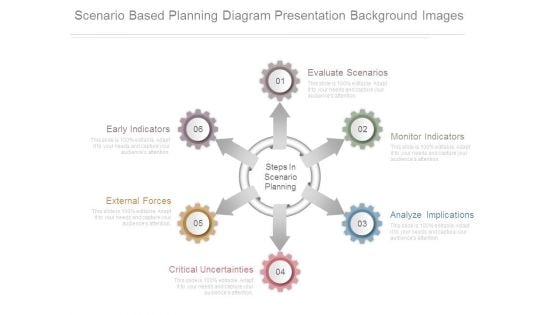
Scenario Based Planning Diagram Presentation Background Images
This is a scenario based planning diagram presentation background images. This is a six stage process. The stages in this process are evaluate scenarios, monitor indicators, analyze implications, critical uncertainties, external forces, early indicators, steps in scenario planning.
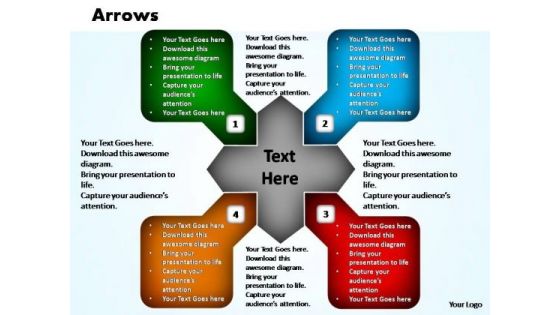
PowerPoint Templates Business Arrows Ppt Slides
PowerPoint Templates Business Arrows PPT Slides-The arrows indicate the progression of the process. Constant monitoring of the processes provides you with opportunities to concentrate on the core competencies in your business and improve the standards for more effective results.-PowerPoint Templates Business Arrows PPT Slides Facilitate your career with our PowerPoint Templates Business Arrows Ppt Slides. Convey your ideas with confidence.
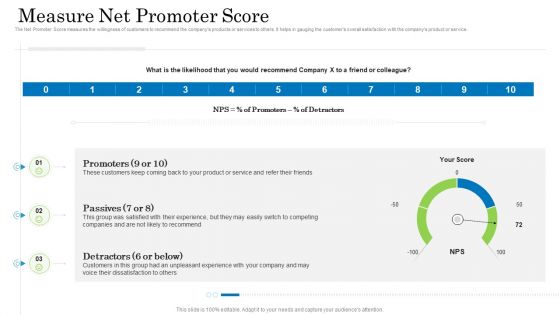
Customer Behavioral Data And Analytics Measure Net Promoter Score Mockup PDF
The Net Promoter Score measures the willingness of customers to recommend the companys products or services to others. It helps in gauging the customers overall satisfaction with the companys product or service. Deliver and pitch your topic in the best possible manner with this customer behavioral data and analytics measure net promoter score mockup pdf. Use them to share invaluable insights on promoters, passives, detractors and impress your audience. This template can be altered and modified as per your expectations. So, grab it now.

Employee Feedback Dashboard With Key Metrics Elements PDF
The following slide depicts the key insights of the feedback survey to gauge employee engagement at different department levels. It includes metrics such as engagement score, response rate, no. of comments etc.Showcasing this set of slides titled Employee Feedback Dashboard With Key Metrics Elements PDF The topics addressed in these templates are Employee Feedback Dashboard With Key Metrics All the content presented in this PPT design is completely editable. Download it and make adjustments in color, background, font etc. as per your unique business setting.
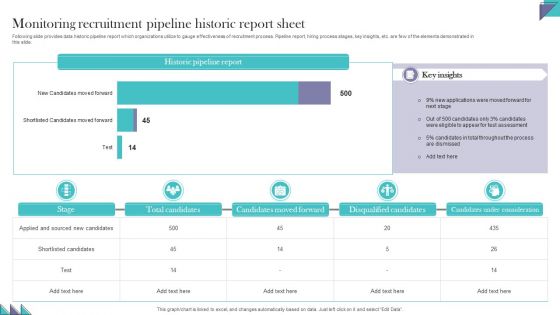
Monitoring Recruitment Pipeline Historic Report Sheet Pictures PDF
Following slide provides data historic pipeline report which organizations utilize to gauge effectiveness of recruitment process. Pipeline report, hiring process stages, key insights, etc. are few of the elements demonstrated in this slide. Pitch your topic with ease and precision using this Monitoring Recruitment Pipeline Historic Report Sheet Pictures PDF. This layout presents information on Candidates Moved Forward, Disqualified Candidates, Candidates Under Consideration. It is also available for immediate download and adjustment. So, changes can be made in the color, design, graphics or any other component to create a unique layout
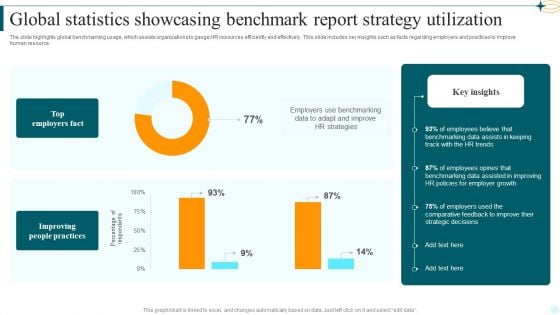
Global Statistics Showcasing Benchmark Report Strategy Utilization Mockup PDF
The slide highlights global benchmarking usage, which assists organizations to gauge HR resources efficiently and effectively. This slide includes key insights such as facts regarding employers and practices to improve human resource. Showcasing this set of slides titled Global Statistics Showcasing Benchmark Report Strategy Utilization Mockup PDF. The topics addressed in these templates are Top Employers Fact, Improving People Practices, Employers Use Benchmarking. All the content presented in this PPT design is completely editable. Download it and make adjustments in color, background, font etc. as per your unique business setting.
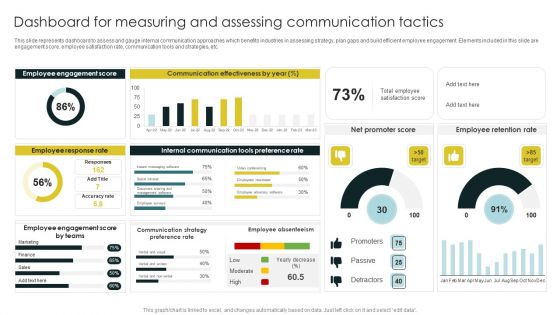
Dashboard For Measuring And Assessing Communication Tactics Information PDF
This slide represents dashboard to assess and gauge internal communication approaches which benefits industries in assessing strategy, plan gaps and build efficient employee engagement. Elements included in this slide are engagement score, employee satisfaction rate, communication tools and strategies, etc. Showcasing this set of slides titled Dashboard For Measuring And Assessing Communication Tactics Information PDF. The topics addressed in these templates are Employee Engagement, Employee Response Rate, Communication Effectiveness. All the content presented in this PPT design is completely editable. Download it and make adjustments in color, background, font etc. as per your unique business setting.
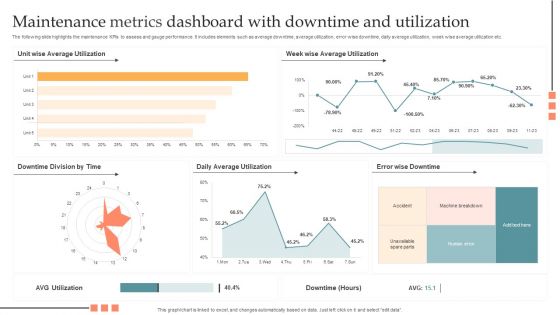
Maintenance Metrics Dashboard With Downtime And Utilization Pictures PDF
The following slide highlights the maintenance KPIs to assess and gauge performance. It includes elements such as average downtime, average utilization, error wise downtime, daily average utilization, week wise average utilization etc. Showcasing this set of slides titled Maintenance Metrics Dashboard With Downtime And Utilization Pictures PDF. The topics addressed in these templates are Maintenance Metrics Dashboard, Downtime And Utilization. All the content presented in this PPT design is completely editable. Download it and make adjustments in color, background, font etc. as per your unique business setting.
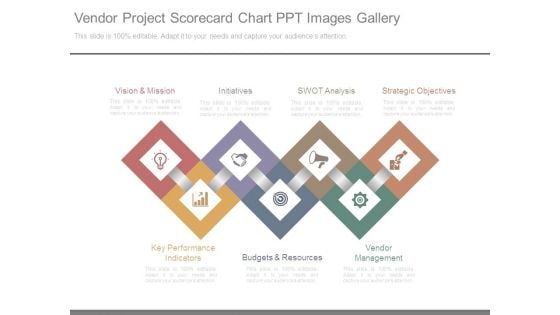
Vendor Project Scorecard Chart Ppt Images Gallery
This is a vendor project scorecard chart ppt images gallery. This is a seven stage process. The stages in this process are vision and mission, initiatives, swot analysis, strategic objectives, vendor management, budgets and resources, key performance indicators.

Annual Business Financial Summary Dashboard Themes PDF
This slide shows annual financial report dashboard of company to monitor yearly business performance. It includes various indicators such as revenue, net profits, costs and breakdown of cost. Showcasing this set of slides titled Annual Business Financial Summary Dashboard Themes PDF. The topics addressed in these templates are Revenue, Costs, Net Profit. All the content presented in this PPT design is completely editable. Download it and make adjustments in color, background, font etc. as per your unique business setting.
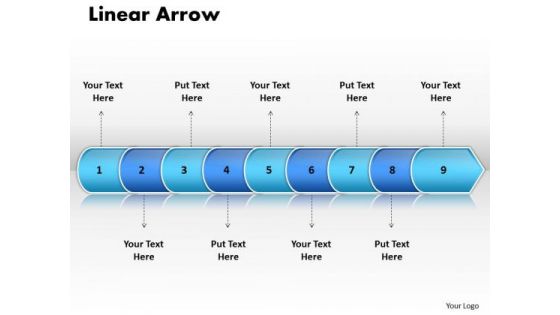
Ppt Linear Arrow 9 State Diagram PowerPoint Templates
PPT linear arrow 9 state diagram PowerPoint Templates-Use this PowerPoint diagram to define basic work and data flow and quality management processes to increase efficiency of your business.-PPT linear arrow 9 state diagram PowerPoint Templates-Arrow, Background, Collection, Completed, Concept, Confirmation, Design, Flow, Graph, Graphic, Illustration, Indication, Indicator, Information, Instruction, Interface, Internet, Layout, Measurement, Order, Phase, Pointer, Process, Progress, Reflection, Scale, Shape, Sign Fill out your thoughts with our Ppt Linear Arrow 9 State Diagram PowerPoint Templates. They will get bigger and better.
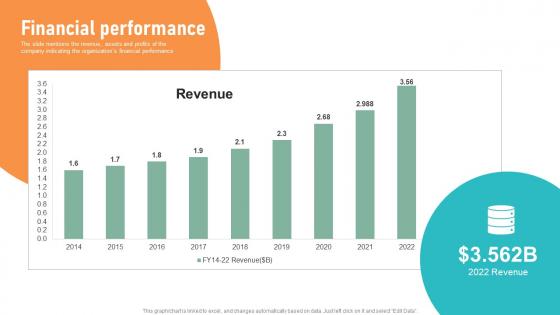
Financial Performance Circuit Designing Company Investor Fund Raising Pitch Deck Themes Pdf
The slide mentions the revenue, assets and profits of the company indicating the organizations financial performance From laying roadmaps to briefing everything in detail, our templates are perfect for you. You can set the stage with your presentation slides. All you have to do is download these easy to edit and customizable templates. Financial Performance Circuit Designing Company Investor Fund Raising Pitch Deck Themes Pdf will help you deliver an outstanding performance that everyone would remember and praise you for. Do download this presentation today. The slide mentions the revenue, assets and profits of the company indicating the organizations financial performance
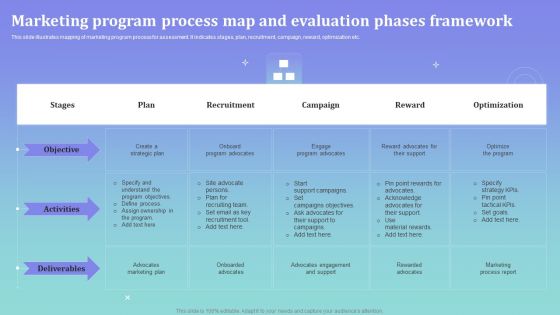
Marketing Program Process Map And Evaluation Phases Framework Ppt Slides Styles PDF
This slide illustrates mapping of marketing program process for assessment. It indicates stages, plan, recruitment, campaign, reward, optimization etc. Showcasing this set of slides titled Marketing Program Process Map And Evaluation Phases Framework Ppt Slides Styles PDF. The topics addressed in these templates are Recruitment, Optimization, Engage Program Advocates. All the content presented in this PPT design is completely editable. Download it and make adjustments in color, background, font etc. as per your unique business setting.
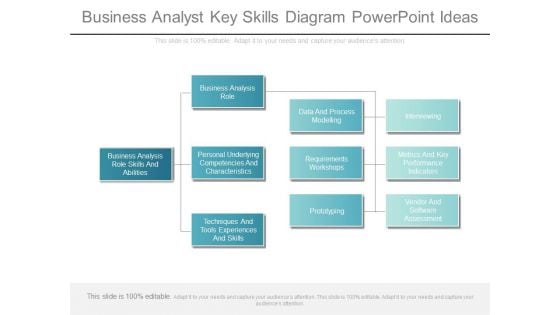
Business Analyst Key Skills Diagram Powerpoint Ideas
This is a business analyst key skills diagram powerpoint ideas. This is a four stage process. The stages in this process are business analysis role skills and abilities, business analysis role, personal underlying competencies and characteristics, techniques and tools experiences and skills, data and process modelling, requirements workshops, prototyping, interviewing, metrics and key performance indicators, vendor and software assessment.
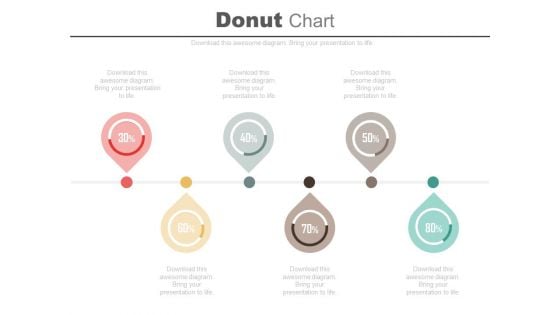
Six Pointers Percentage Timeline Diagram Powerpoint Slides
Profitability indicator ratios have been displayed this business slide. This PowerPoint template contains linear pointers timeline diagram. Use this professional diagram slide to build an exclusive presentation.
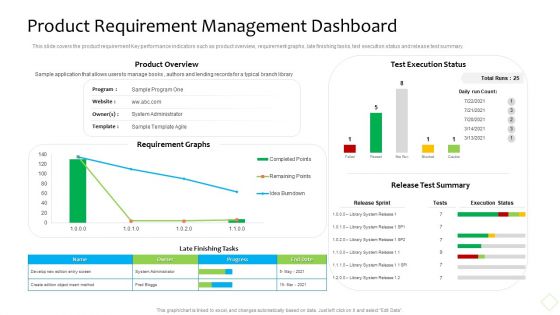
Product Demand Administration Product Requirement Management Dashboard Themes PDF
This slide covers the product requirement Key performance indicators such as product overview, requirement graphs, late finishing tasks, text execution status and release test summary. Deliver and pitch your topic in the best possible manner with this product demand administration product requirement management dashboard themes pdf. Use them to share invaluable insights on develop, progress, system and impress your audience. This template can be altered and modified as per your expectations. So, grab it now.
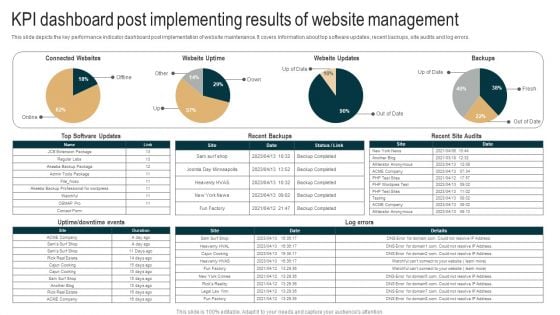
KPI Dashboard Post Implementing Results Of Website Management Themes PDF
This slide depicts the key performance indicator dashboard post implementation of website maintenance. It covers information about top software updates, recent backups, site audits and log errors. Showcasing this set of slides titled KPI Dashboard Post Implementing Results Of Website Management Themes PDF. The topics addressed in these templates are Website Updates, Website Uptime, Connected Websites. All the content presented in this PPT design is completely editable. Download it and make adjustments in color, background, font etc. as per your unique business setting.
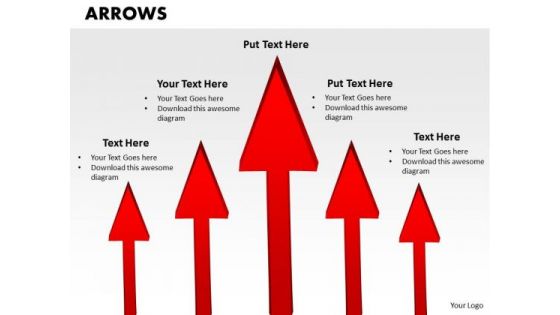
PowerPoint Templates Arrows Success Ppt Themes
PowerPoint Templates arrows Success PPT Themes-Arrows Indicates the way to growth. Use this diagram for improved controls to drive your business towards the right direction. -3d, Our PowerPoint Templates Arrows Success Ppt Themes team keep their eyes open. Always digging out new designs for you.

 Home
Home