Meter Icon

Dollar Question Mark Finance PowerPoint Templates And PowerPoint Themes 1112
We present our Dollar Question Mark Finance PowerPoint Templates And PowerPoint Themes 1112.Use our Success PowerPoint Templates because, Timelines Display:- You have developed a vision of where you want to be a few years from now. Use our Money PowerPoint Templates because, Illustrate your ideas one by one and demonstrate how each is an important cog in running the entire wheel. Use our Success PowerPoint Templates because, Start the gears of youthful minds and set them in motion. Use our Signs PowerPoint Templates because,They are indicators of the path you have in mind. Use our Business PowerPoint Templates because,Marketing Strategy Business Template:- Maximising sales of your product is the intended destination.Use these PowerPoint slides for presentations relating to Dollar question mark, money, finance, success, signs, business. The prominent colors used in the PowerPoint template are Green, Red, Black Examine data with our Dollar Question Mark Finance PowerPoint Templates And PowerPoint Themes 1112. You will come out on top.
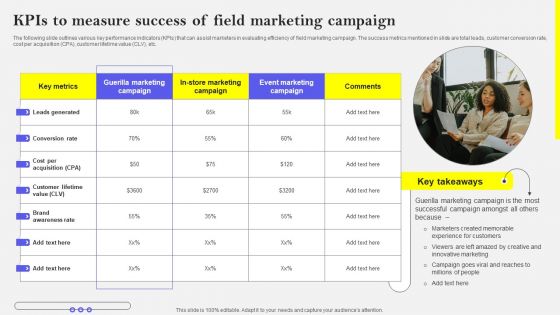
Kpis To Measure Success Of Field Marketing Campaign Themes PDF
The following slide outlines various key performance indicators KPIs that can assist marketers in evaluating efficiency of field marketing campaign. The success metrics mentioned in slide are total leads, customer conversion rate, cost per acquisition CPA, customer lifetime value CLV, etc. Explore a selection of the finest Kpis To Measure Success Of Field Marketing Campaign Themes PDF here. With a plethora of professionally designed and pre-made slide templates, you can quickly and easily find the right one for your upcoming presentation. You can use our Kpis To Measure Success Of Field Marketing Campaign Themes PDF to effectively convey your message to a wider audience. Slidegeeks has done a lot of research before preparing these presentation templates. The content can be personalized and the slides are highly editable. Grab templates today from Slidegeeks.
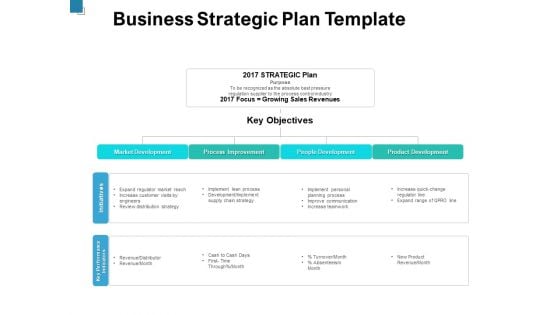
Business Strategic Plan Template Ppt PowerPoint Presentation Pictures Inspiration
Presenting this set of slides with name business strategic plan template ppt powerpoint presentation pictures inspiration. This is a two stage process. The stages in this process are market development, process improvement, people development, product development, key objectives, key performance indicators, initiatives. This is a completely editable PowerPoint presentation and is available for immediate download. Download now and impress your audience.
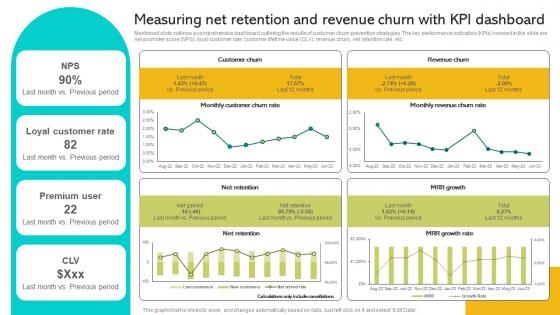
Implementing Strategies To Enhance Measuring Net Retention And Revenue Churn With Kpi Brochure PDF
Mentioned slide outlines a comprehensive dashboard outlining the results of customer churn prevention strategies. The key performance indicators KPIs covered in the slide are net promoter score NPS, loyal customer rate, customer lifetime value CLV, revenue churn, net retention rate, etc. Retrieve professionally designed ng Strategies To Enhance Measuring Net Retention And Revenue Churn With Kpi Brochure PDF to effectively convey your message and captivate your listeners. Save time by selecting pre-made slideshows that are appropriate for various topics, from business to educational purposes. These themes come in many different styles, from creative to corporate, and all of them are easily adjustable and can be edited quickly. Access them as PowerPoint templates or as Google Slides themes. You do not have to go on a hunt for the perfect presentation because Slidegeeks got you covered from everywhere. Mentioned slide outlines a comprehensive dashboard outlining the results of customer churn prevention strategies. The key performance indicators KPIs covered in the slide are net promoter score NPS, loyal customer rate, customer lifetime value CLV, revenue churn, net retention rate, etc.
Cloud Performance Tracking Dashboard Cloud Computing Complexities And Solutions Structure PDF
This slide covers the Key performance indicators for tracking performance of the cloud such as violations break down, sources, rules and severity. Are you searching for a xxxxxxxxxxxxxxxxxxxxxx that is uncluttered, straightforward, and original Its easy to edit, and you can change the colors to suit your personal or business branding. For a presentation that expresses how much effort you ve put in, this template is ideal With all of its features, including tables, diagrams, statistics, and lists, its perfect for a business plan presentation. Make your ideas more appealing with these professional slides. Download Cloud Performance Tracking Dashboard Cloud Computing Complexities And Solutions Structure PDF from Slidegeeks today.
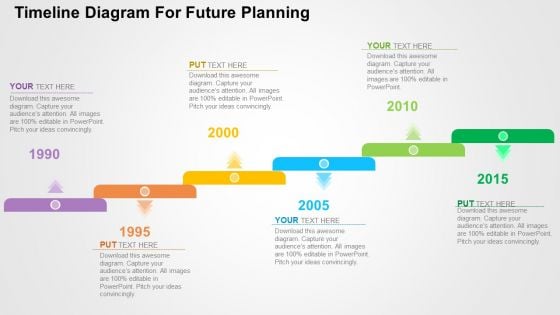
Timeline Diagram For Future Planning Powerpoint Templates
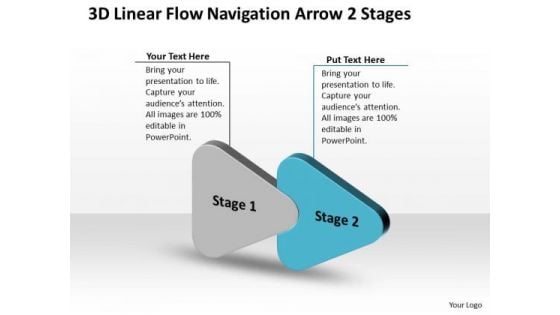
3d Linear Flow Navigation Arrow 2 Stages Ppt Working Chart PowerPoint Slides
We present our 3d linear flow navigation arrow 2 stages ppt working chart PowerPoint Slides. Use our Arrows PowerPoint Templates because; Highlight the key components of your entire manufacturing/ business process. Use our Symbol PowerPoint Templates because, guaranteed to focus the minds of your team. Use our Shapes PowerPoint Templates because, they are indicators of the path you have in mind. Use our Business PowerPoint Templates because, Shine the light on these thoughts and motivate your team to improve the quality of celebration for all around you. Use our Process and Flows PowerPoint Templates because, You sure have something unique, so use this template to expound on it and be rest assured that soon there will be an enthusiastic response and a purposeful Aye- Aye Sir. Use these PowerPoint slides for presentations relating to abstract, arrow, arrows business, chart, design, development, diagram, direction, element, flow, flowchart, graph, linear, management, model, motion, organization, plan, process, program, section, segment, set, sign, solution, strategy, symbol, technology. The prominent colors used in the PowerPoint template are Blue, Gray, and Black Escape from the humdrum with our 3d Linear Flow Navigation Arrow 2 Stages Ppt Working Chart PowerPoint Slides. Put in the element of excitement in your talk.
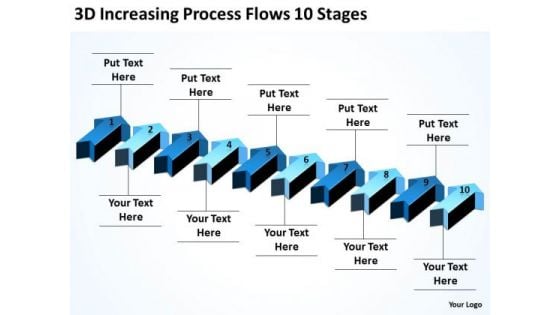
Arrows For Ppt Increasing Process Flows 10 Stages PowerPoint Templates Backgrounds Slides
We present our arrows for ppt increasing process flows 10 stages PowerPoint templates backgrounds slides.Use our Marketing PowerPoint Templates because you can Add colour to your speech with our PowerPoint Templates and Slides. Your presentation will leave your audience speechless. Download and present our Flow charts PowerPoint Templates because It will mark the footprints of your journey. Illustrate how they will lead you to your desired destination. Use our Shapes PowerPoint Templates because you should Whip up a frenzy with our PowerPoint Templates and Slides. They will fuel the excitement of your team. Download and present our Arrows PowerPoint Templates because Our PowerPoint Templates and Slides are focused like a searchlight beam. They highlight your ideas for your target audience. Download and present our Process and Flows PowerPoint Templates because You can Be the star of the show with our PowerPoint Templates and Slides. Rock the stage with your ideas.Use these PowerPoint slides for presentations relating to Arrow, Banner, Bar, Collection, Completion, Concept, Confirmation, Design, Flow, Graph, Graphic, Illustration, Indication, Information, Instruction, Interface, Internet, Layout, Measurement, Modern, Number, Order, Phase, Pointer, Process, Progress, Reflection, Scale, Shape, Stage, Status, Step, Template, Two, Vector, Web, Web Design, Web Design Elements, Websites, Work Flow. The prominent colors used in the PowerPoint template are Blue navy, Blue, Black. Customers tell us our arrows for ppt increasing process flows 10 stages PowerPoint templates backgrounds slides will help them to explain complicated concepts. We assure you our Flow PowerPoint templates and PPT Slides are readymade to fit into any presentation structure. Use our arrows for ppt increasing process flows 10 stages PowerPoint templates backgrounds slides are incredible easy to use. You can be sure our Confirmation PowerPoint templates and PPT Slides will help them to explain complicated concepts. PowerPoint presentation experts tell us our arrows for ppt increasing process flows 10 stages PowerPoint templates backgrounds slides will make the presenter look like a pro even if they are not computer savvy. The feedback we get is that our Confirmation PowerPoint templates and PPT Slides will help them to explain complicated concepts. Cast our Arrows For Ppt Increasing Process Flows 10 Stages PowerPoint Templates Backgrounds Slides in your act. The audience will call for an encore.
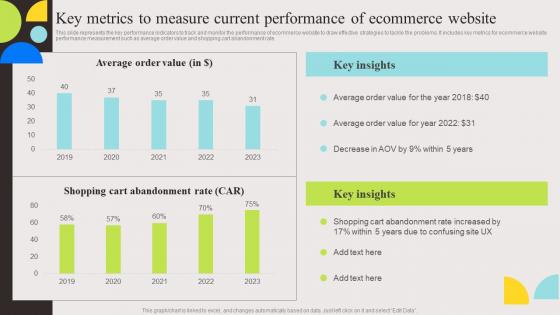
Key Metrics To Measure Current Evaluation And Deployment Of Enhanced Professional Pdf
This slide represents the key performance indicators to track and monitor the performance of ecommerce website to draw effective strategies to tackle the problems. It includes key metrics for ecommerce website performance measurement such as average order value and shopping cart abandonment rate. Are you searching for a Key Metrics To Measure Current Evaluation And Deployment Of Enhanced Professional Pdf that is uncluttered, straightforward, and original It is easy to edit, and you can change the colors to suit your personal or business branding. For a presentation that expresses how much effort you have put in, this template is ideal With all of its features, including tables, diagrams, statistics, and lists, it is perfect for a business plan presentation. Make your ideas more appealing with these professional slides. Download Key Metrics To Measure Current Evaluation And Deployment Of Enhanced Professional Pdf from Slidegeeks today. This slide represents the key performance indicators to track and monitor the performance of ecommerce website to draw effective strategies to tackle the problems. It includes key metrics for ecommerce website performance measurement such as average order value and shopping cart abandonment rate.
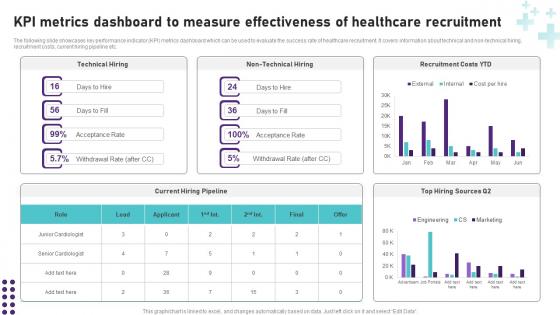
KPI Metrics Dashboard To Measure Healthcare Operational Areas Healthcare Brochure PDF
Retrieve professionally designed KPI Metrics Dashboard To Measure Healthcare Operational Areas Healthcare Brochure PDF to effectively convey your message and captivate your listeners. Save time by selecting pre-made slideshows that are appropriate for various topics, from business to educational purposes. These themes come in many different styles, from creative to corporate, and all of them are easily adjustable and can be edited quickly. Access them as PowerPoint templates or as Google Slides themes. You do not have to go on a hunt for the perfect presentation because Slidegeeks got you covered from everywhere. The following slide showcases key performance indicator KPI metrics dashboard which can be used to evaluate the success rate of healthcare recruitment. It covers information about technical and non-technical hiring, recruitment costs, current hiring pipeline etc.
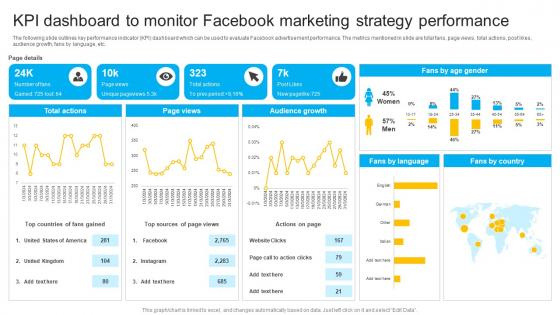
How To Create Cost Effective KPI Dashboard To Monitor Facebook Marketing Strategy SS V
The following slide outlines key performance indicator KPI dashboard which can be used to evaluate Facebook advertisement performance. The metrics mentioned in slide are total fans, page views, total actions, post likes, audience growth, fans by language, etc. Do you know about Slidesgeeks How To Create Cost Effective KPI Dashboard To Monitor Facebook Marketing Strategy SS V These are perfect for delivering any kind od presentation. Using it, create PowerPoint presentations that communicate your ideas and engage audiences. Save time and effort by using our pre-designed presentation templates that are perfect for a wide range of topic. Our vast selection of designs covers a range of styles, from creative to business, and are all highly customizable and easy to edit. Download as a PowerPoint template or use them as Google Slides themes. The following slide outlines key performance indicator KPI dashboard which can be used to evaluate Facebook advertisement performance. The metrics mentioned in slide are total fans, page views, total actions, post likes, audience growth, fans by language, etc.
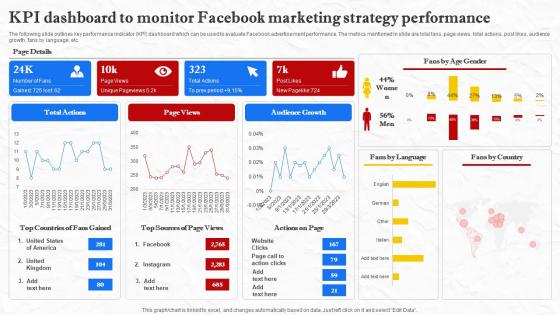
Facebook Marketing Techniques KPI Dashboard To Monitor Facebook Marketing Strategy SS V
The following slide outlines key performance indicator KPI dashboard which can be used to evaluate Facebook advertisement performance. The metrics mentioned in slide are total fans, page views, total actions, post likes, audience growth, fans by language, etc. Do you know about Slidesgeeks Facebook Marketing Techniques KPI Dashboard To Monitor Facebook Marketing Strategy SS V These are perfect for delivering any kind od presentation. Using it, create PowerPoint presentations that communicate your ideas and engage audiences. Save time and effort by using our pre-designed presentation templates that are perfect for a wide range of topic. Our vast selection of designs covers a range of styles, from creative to business, and are all highly customizable and easy to edit. Download as a PowerPoint template or use them as Google Slides themes. The following slide outlines key performance indicator KPI dashboard which can be used to evaluate Facebook advertisement performance. The metrics mentioned in slide are total fans, page views, total actions, post likes, audience growth, fans by language, etc.
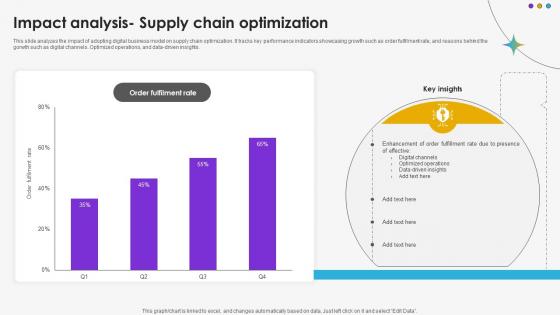
Impact Analysis Supply Chain Optimization DT SS V
This slide analyzes the impact of adopting digital business model on supply chain optimization. It tracks key performance indicators showcasing growth such as order fulfilment rate, and reasons behind the gorwth such as digital channels. Optimized operations, and data-driven insights.Whether you have daily or monthly meetings, a brilliant presentation is necessary. Impact Analysis Supply Chain Optimization DT SS V can be your best option for delivering a presentation. Represent everything in detail using Impact Analysis Supply Chain Optimization DT SS V and make yourself stand out in meetings. The template is versatile and follows a structure that will cater to your requirements. All the templates prepared by Slidegeeks are easy to download and edit. Our research experts have taken care of the corporate themes as well. So, give it a try and see the results. This slide analyzes the impact of adopting digital business model on supply chain optimization. It tracks key performance indicators showcasing growth such as order fulfilment rate, and reasons behind the gorwth such as digital channels. Optimized operations, and data-driven insights.
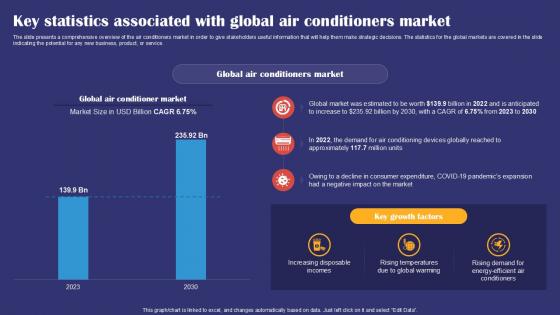
Key Statistics Associated With Global Air Conditioners Market Smartphones Industry Report PPT Sample IR SS V
The slide presents a comprehensive overview of the air conditioners market in order to give stakeholders useful information that will help them make strategic decisions. The statistics for the global markets are covered in the slide indicating the potential for any new business, product, or service. Whether you have daily or monthly meetings, a brilliant presentation is necessary. Key Statistics Associated With Global Air Conditioners Market Smartphones Industry Report PPT Sample IR SS V can be your best option for delivering a presentation. Represent everything in detail using Key Statistics Associated With Global Air Conditioners Market Smartphones Industry Report PPT Sample IR SS V and make yourself stand out in meetings. The template is versatile and follows a structure that will cater to your requirements. All the templates prepared by Slidegeeks are easy to download and edit. Our research experts have taken care of the corporate themes as well. So, give it a try and see the results. The slide presents a comprehensive overview of the air conditioners market in order to give stakeholders useful information that will help them make strategic decisions. The statistics for the global markets are covered in the slide indicating the potential for any new business, product, or service.
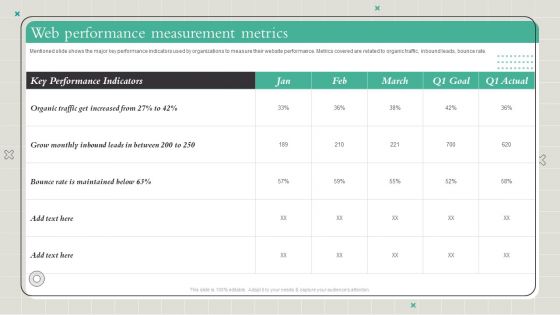
Playbook To Formulate Efficient Web Performance Measurement Metrics Diagrams PDF
Mentioned slide shows the major key performance indicators used by organizations to measure their website performance. Metrics covered are related to organic traffic, inbound leads, bounce rate. Slidegeeks has constructed Playbook To Formulate Efficient Web Performance Measurement Metrics Diagrams PDF after conducting extensive research and examination. These presentation templates are constantly being generated and modified based on user preferences and critiques from editors. Here, you will find the most attractive templates for a range of purposes while taking into account ratings and remarks from users regarding the content. This is an excellent jumping-off point to explore our content and will give new users an insight into our top-notch PowerPoint Templates.
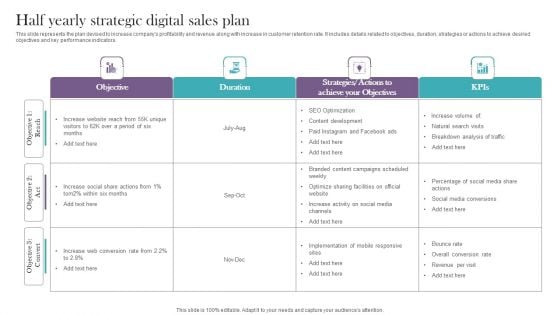
Half Yearly Strategic Digital Sales Plan Diagrams PDF
This slide represents the plan devised to increase companys profitability and revenue along with increase in customer retention rate. It includes details related to objectives, duration, strategies or actions to achieve desired objectives and key performance indicators. Showcasing this set of slides titled Half Yearly Strategic Digital Sales Plan Diagrams PDF. The topics addressed in these templates are Natural Search Visits, Breakdown Analysis Traffic. All the content presented in this PPT design is completely editable. Download it and make adjustments in color, background, font etc. as per your unique business setting.
Booting Brand Image By Tracking KPI Metrics Diagrams PDF
This slide consists of key performance indicators to be used by mangers to track the brand awareness . Key metrices covered are content reach, brand mention, blog shares, search volume data, repeat purchase and organic traffic. Showcasing this set of slides titled Booting Brand Image By Tracking KPI Metrics Diagrams PDF. The topics addressed in these templates are Content Reach, Brand Mentions, Blog Shares. All the content presented in this PPT design is completely editable. Download it and make adjustments in color, background, font etc. as per your unique business setting.
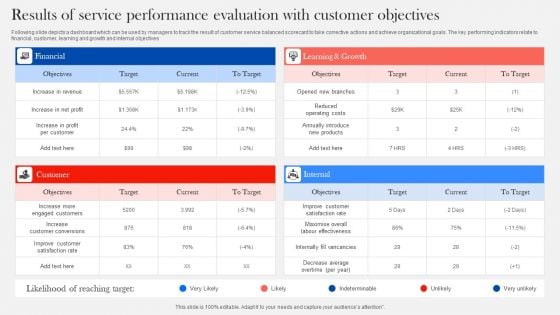
Results Of Service Performance Evaluation With Customer Objectives Diagrams PDF
Following slide depicts a dashboard which can be used by managers to track the result of customer service balanced scorecard to take corrective actions and achieve organizational goals. The key performing indicators relate to financial, customer, learning and growth and internal objectives. Showcasing this set of slides titled Results Of Service Performance Evaluation With Customer Objectives Diagrams PDF. The topics addressed in these templates are Financial, Customer, Internal. All the content presented in this PPT design is completely editable. Download it and make adjustments in color, background, font etc. as per your unique business setting.
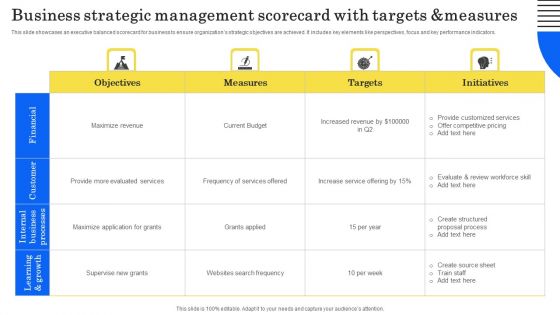
Business Strategic Management Scorecard With Targets And Measures Diagrams PDF
This slide showcases an executive balanced scorecard for business to ensure organizations strategic objectives are achieved. It includes key elements like perspectives, focus and key performance indicators. Showcasing this set of slides titled Business Strategic Management Scorecard With Targets And Measures Diagrams PDF. The topics addressed in these templates are Provide Customized Services, Offer Competitive Pricing, Grants Applied. All the content presented in this PPT design is completely editable. Download it and make adjustments in color, background, font etc. as per your unique business setting.
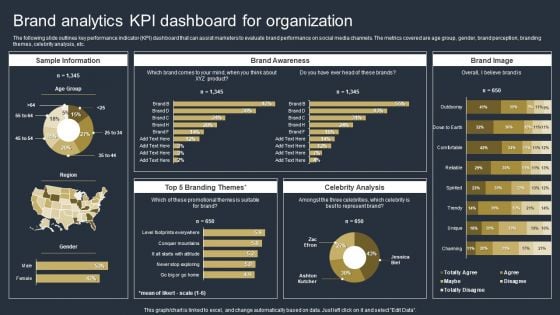
Comprehensive Market Research Guide Brand Analytics Kpi Dashboard For Organization Brochure PDF
The following slide outlines key performance indicator KPI dashboard that can assist marketers to evaluate brand performance on social media channels. The metrics covered are age group, gender, brand perception, branding themes, celebrity analysis, etc. From laying roadmaps to briefing everything in detail, our templates are perfect for you. You can set the stage with your presentation slides. All you have to do is download these easy-to-edit and customizable templates. Comprehensive Market Research Guide Brand Analytics Kpi Dashboard For Organization Brochure PDF will help you deliver an outstanding performance that everyone would remember and praise you for. Do download this presentation today.
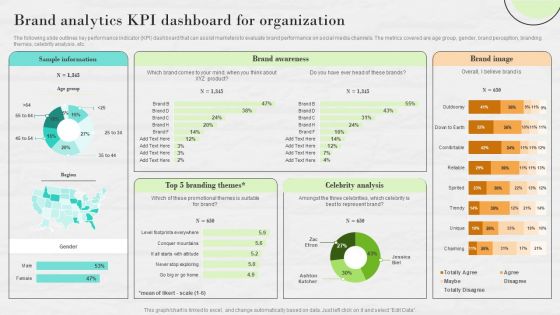
Market Research To Determine Business Opportunities Brand Analytics KPI Dashboard For Organization Inspiration PDF
The following slide outlines key performance indicator KPI dashboard that can assist marketers to evaluate brand performance on social media channels. The metrics covered are age group, gender, brand perception, branding themes, celebrity analysis, etc. There are so many reasons you need a Market Research To Determine Business Opportunities Brand Analytics KPI Dashboard For Organization Inspiration PDF. The first reason is you cannot spend time making everything from scratch, Thus, Slidegeeks has made presentation templates for you too. You can easily download these templates from our website easily.

White And Yellow Bar Graph Business Shapes PowerPoint Templates And PowerPoint Themes 1012
White And Yellow Bar Graph Business Shapes PowerPoint Templates And PowerPoint Themes 1012-Use this Above PowerPoint Template Displaying the Bar Graph in Circular Manner. It indicates beefing up, boost, buildup, crop, cultivation, enlargement, evolution, gain, heightening, hike, improvement, increase. Original thinking is the need of the hour. We provide the means to project your views.-White And Yellow Bar Graph Business Shapes PowerPoint Templates And PowerPoint Themes 1012-This PowerPoint template can be used for presentations relating to-Bar graph showing the growth, business, finance, success, marketing, shapes The environment deserves constant attention. Keep an eye through our White And Yellow Bar Graph Business Shapes PowerPoint Templates And PowerPoint Themes 1012.
Five Colors Piggy Bank Finance PowerPoint Templates And PowerPoint Themes 1012
Five Colors Piggy Bank Finance PowerPoint Templates And PowerPoint Themes 1012-Use this Graphical PowerPoint Template showing colorful Piggy banks. It indicates Savings, investments, reserves, nest egg, funds, hoard, stash, money etc. Clear thinking is your strength. Transmit your thoughts to your eager team. Adjust the above image in your PPT presentations to visually support your content in your Investment PPT slideshows.-Five Colors Piggy Bank Finance PowerPoint Templates And PowerPoint Themes 1012-This PowerPoint template can be used for presentations relating to-Five piggy bank in different colors, money, business, success, finance, symbol Correct wrongs with our Five Colors Piggy Bank Finance PowerPoint Templates And PowerPoint Themes 1012. Download without worries with our money back guaranteee.
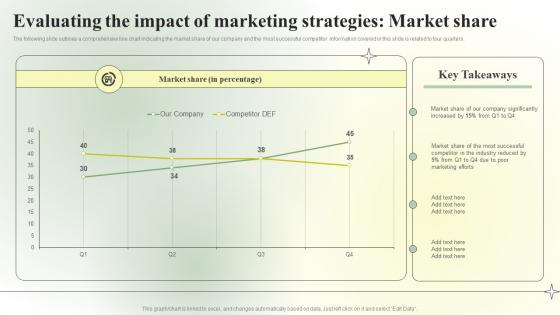
Competitive Branding Strategic Evaluating The Impact Of Marketing Infographics PDF
The following slide outlines a comprehensive line chart indicating the market share of our company and the most successful competitor. Information covered in this slide is related to four quarters. From laying roadmaps to briefing everything in detail, our templates are perfect for you. You can set the stage with your presentation slides. All you have to do is download these easy-to-edit and customizable templates. Competitive Branding Strategic Evaluating The Impact Of Marketing Infographics PDF will help you deliver an outstanding performance that everyone would remember and praise you for. Do download this presentation today. The following slide outlines a comprehensive line chart indicating the market share of our company and the most successful competitor. Information covered in this slide is related to four quarters.
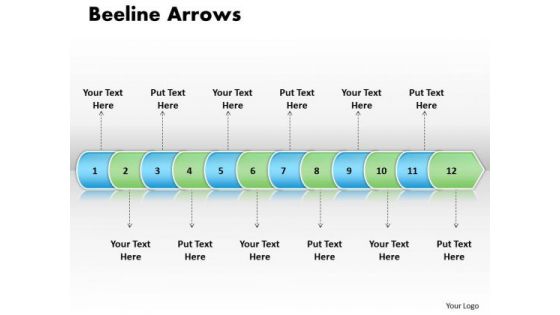
Ppt Linear Arrow 12 Stages PowerPoint Templates
PPT linear arrow 12 stages PowerPoint Templates-This PPT is made of Linear arrows. This graphics is of superlative quality that makes an attractive presentation. This template is quite a remedy to present any process-PPT linear arrow 12 stages PowerPoint Templates-Arrow, Background, Collection, Completed, Concept, Confirmation, Design, Flow, Graph, Graphic, Illustration, Indication, Indicator, Information, Instruction, Interface, Internet, Layout, Measurement, Order, Phase, Pointer, Process, Progress, Reflection, Scale, Shape, Sign Make the event with our Ppt Linear Arrow 12 Stages PowerPoint Templates. Your thoughts will be really happening.
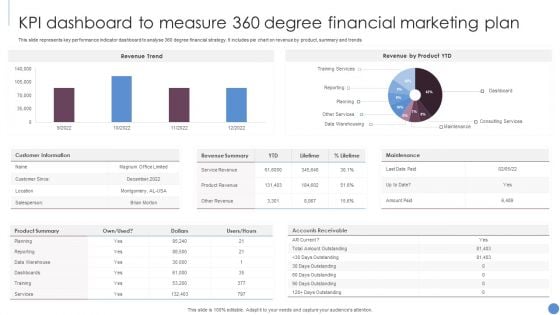
KPI Dashboard To Measure 360 Degree Financial Marketing Plan Slides PDF
This slide represents key performance indicator dashboard to analyse 360 degree financial strategy. It includes pie chart on revenue by product, summary and trends. Showcasing this set of slides titled KPI Dashboard To Measure 360 Degree Financial Marketing Plan Slides PDF. The topics addressed in these templates are Revenue Trend, Revenue Product YTD, Customer Information. All the content presented in this PPT design is completely editable. Download it and make adjustments in color, background, font etc. as per your unique business setting.
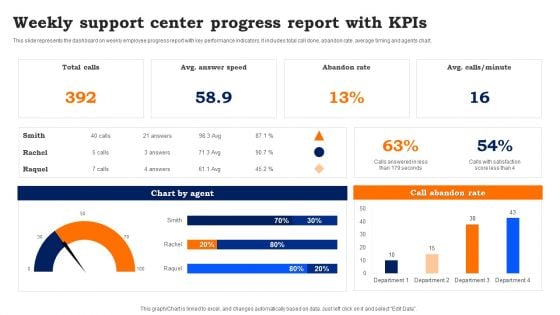
Weekly Support Center Progress Report With Kpis Template PDF
This slide represents the dashboard on weekly employee progress report with key performance indicators. It includes total call done, abandon rate, average timing and agents chart. Pitch your topic with ease and precision using this Weekly Support Center Progress Report With Kpis Template PDF. This layout presents information on Weekly Support, Center Progress Report. It is also available for immediate download and adjustment. So, changes can be made in the color, design, graphics or any other component to create a unique layout.
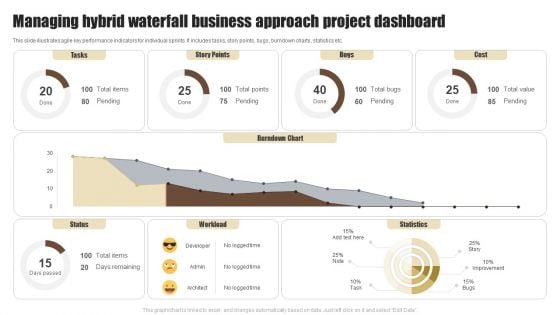
Managing Hybrid Waterfall Business Approach Project Dashboard Summary PDF
This slide illustrates agile key performance indicators for individual sprints. It includes tasks, story points, bugs, burndown charts, statistics etc. Showcasing this set of slides titled Managing Hybrid Waterfall Business Approach Project Dashboard Summary PDF. The topics addressed in these templates are Tasks, Story Points, Bugs. All the content presented in this PPT design is completely editable. Download it and make adjustments in color, background, font etc. as per your unique business setting.
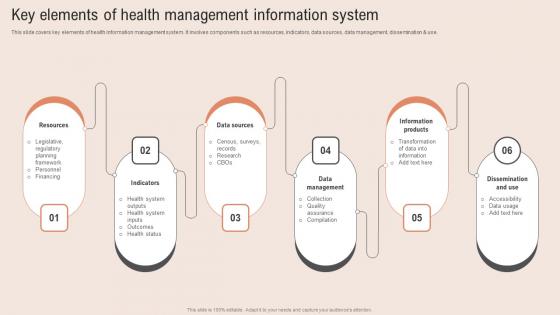
Key Elements Health Management Healthcare Information Tech To Enhance Medical Facilities Diagrams Pdf
This slide covers key elements of health information management system. It involves components such as resources, indicators, data sources, data management, dissemination and use. Explore a selection of the finest Key Elements Health Management Healthcare Information Tech To Enhance Medical Facilities Diagrams Pdf here. With a plethora of professionally designed and pre made slide templates, you can quickly and easily find the right one for your upcoming presentation. You can use our Key Elements Health Management Healthcare Information Tech To Enhance Medical Facilities Diagrams Pdf to effectively convey your message to a wider audience. Slidegeeks has done a lot of research before preparing these presentation templates. The content can be personalized and the slides are highly editable. Grab templates today from Slidegeeks. This slide covers key elements of health information management system. It involves components such as resources, indicators, data sources, data management, dissemination and use.
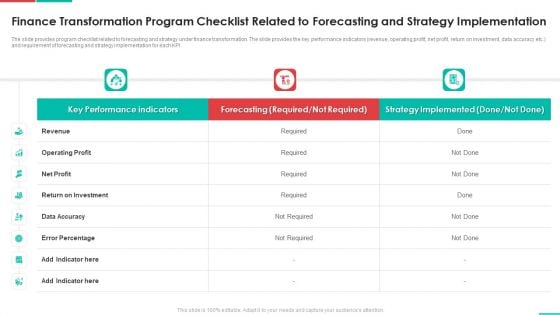
Roadmap For Financial Accounting Transformation Finance Transformation Program Checklist Related Themes PDF
The slide provides program checklist related to forecasting and strategy under finance transformation. The slide provides the key performance indicators revenue, operating profit, net profit, return on investment, data accuracy etc. and requirement of forecasting and strategy implementation for each KPI. Deliver and pitch your topic in the best possible manner with this roadmap for financial accounting transformation finance transformation program checklist related themes pdf. Use them to share invaluable insights on revenue, operating profit, net profit, return on investment, data accuracy and impress your audience. This template can be altered and modified as per your expectations. So, grab it now.
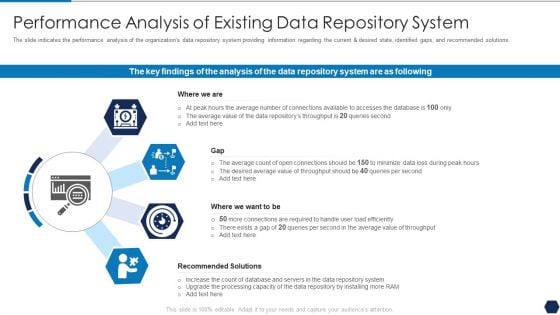
Tactical Plan For Upgrading DBMS Performance Analysis Of Existing Data Repository System Themes PDF
The slide indicates the performance analysis of the organizations data repository system providing information regarding the current and desired state, identified gaps, and recommended solutions. This is a tactical plan for upgrading dbms performance analysis of existing data repository system themes pdf template with various stages. Focus and dispense information on four stages using this creative set, that comes with editable features. It contains large content boxes to add your information on topics like performance analysis of existing data repository system. You can also showcase facts, figures, and other relevant content using this PPT layout. Grab it now.
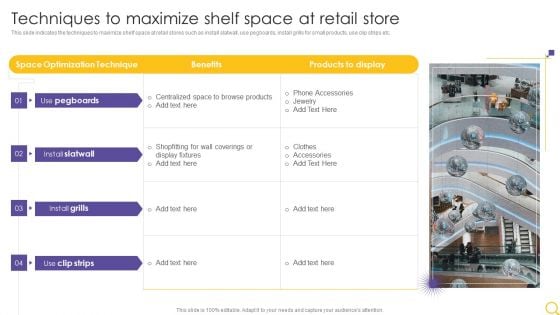
Retail Outlet Operational Efficiency Analytics Techniques To Maximize Shelf Space At Retail Store Themes PDF
This slide indicates the techniques to maximize shelf space at retail stores such as install slatwall, use pegboards, install grills for small products, use clip strips etc. Deliver and pitch your topic in the best possible manner with this Retail Outlet Operational Efficiency Analytics Techniques To Maximize Shelf Space At Retail Store Themes PDF. Use them to share invaluable insights on Space Optimization Technique, Benefits, Products To Display and impress your audience. This template can be altered and modified as per your expectations. So, grab it now.
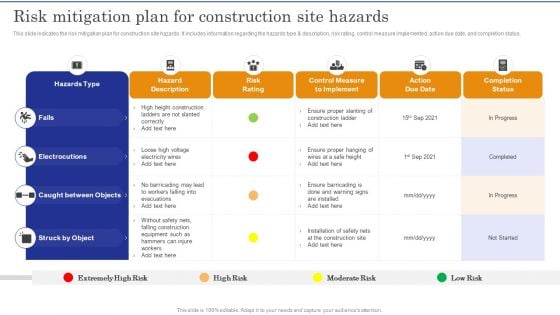
Construction Site Safety Measure Risk Mitigation Plan For Construction Site Hazards Themes PDF
This slide indicates the risk mitigation plan for construction site hazards. It includes information regarding the hazards type description, risk rating, control measure implemented, action due date, and completion status.Find a pre-designed and impeccable Construction Site Safety Measure Risk Mitigation Plan For Construction Site Hazards Themes PDF. The templates can ace your presentation without additional effort. You can download these easy-to-edit presentation templates to make your presentation stand out from others. So, what are you waiting for Download the template from Slidegeeks today and give a unique touch to your presentation.
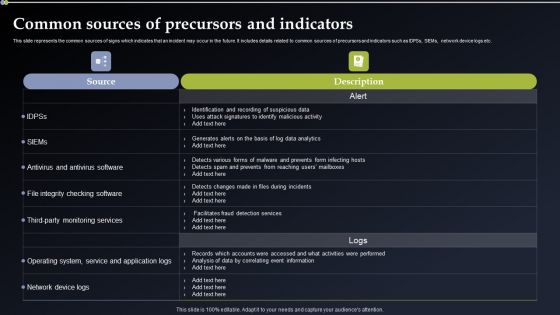
Deploying Cyber Security Incident Response Administration Common Sources Of Precursors Diagrams PDF
This slide represents the common sources of signs which indicates that an incident may occur in the future. It includes details related to common sources of precursors and indicators such as IDPSs, SIEMs, network device logs etc. This modern and well arranged Deploying Cyber Security Incident Response Administration Common Sources Of Precursors Diagrams PDF provides lots of creative possibilities. It is very simple to customize and edit with the Powerpoint Software. Just drag and drop your pictures into the shapes. All facets of this template can be edited with Powerpoint no extra software is necessary. Add your own material, put your images in the places assigned for them, adjust the colors, and then you can show your slides to the world, with an animated slide included.
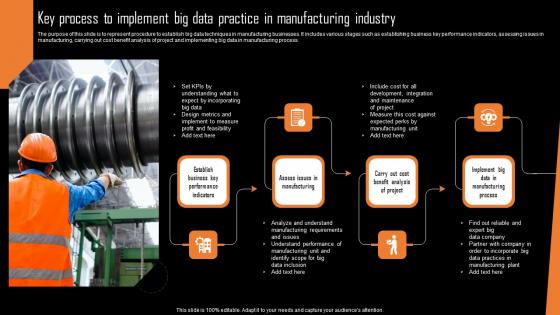
Key Process To Implement Big Data Practice In Manufacturing Industry Diagrams Pdf
The purpose of this slide is to represent procedure to establish big data techniques in manufacturing businesses. It includes various stages such as establishing business key performance indicators, assessing issues in manufacturing, carrying out cost benefit analysis of project and implementing big data in manufacturing process.Showcasing this set of slides titled Key Process To Implement Big Data Practice In Manufacturing Industry Diagrams Pdf The topics addressed in these templates are Expect Incorporating, Understand Performance, Manufacturing Plant All the content presented in this PPT design is completely editable. Download it and make adjustments in color, background, font etc. as per your unique business setting. The purpose of this slide is to represent procedure to establish big data techniques in manufacturing businesses. It includes various stages such as establishing business key performance indicators, assessing issues in manufacturing, carrying out cost benefit analysis of project and implementing big data in manufacturing process.
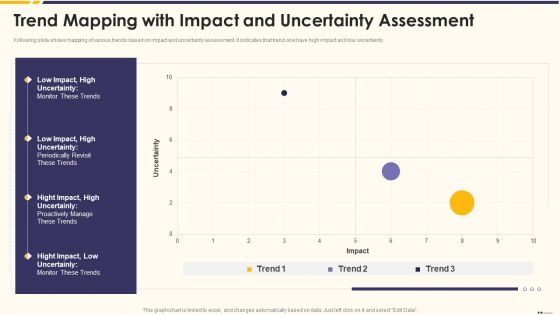
Promotion Standard Practices Tools And Templates Trend Mapping With Impact Diagrams PDF
Following slide shows mapping of various trends based on impact and uncertainty assessment. It indicates that trend one have high impact and low uncertainty.Deliver and pitch your topic in the best possible manner with this promotion standard practices tools and templates trend mapping with impact diagrams pdf Use them to share invaluable insights on trend mapping with impact and uncertainty assessment and impress your audience. This template can be altered and modified as per your expectations. So, grab it now.
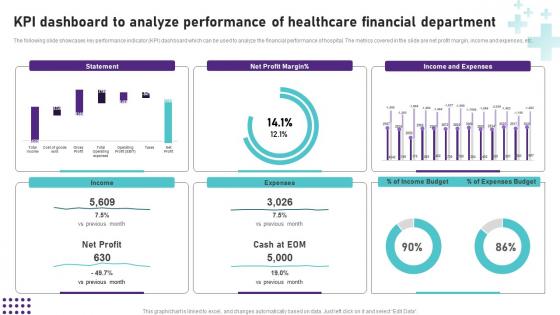
KPI Dashboard To Analyze Performance Of Healthcare Operational Areas Healthcare Clipart PDF
Are you searching for a KPI Dashboard To Analyze Performance Of Healthcare Operational Areas Healthcare Clipart PDF that is uncluttered, straightforward, and original Its easy to edit, and you can change the colors to suit your personal or business branding. For a presentation that expresses how much effort you have put in, this template is ideal With all of its features, including tables, diagrams, statistics, and lists, its perfect for a business plan presentation. Make your ideas more appealing with these professional slides. Download Kpi Dashboard To Analyze Performance Of Healthcare Operational Areas Healthcare Clipart PDF from Slidegeeks today. The following slide showcases key performance indicator KPI dashboard which can be used to analyze the financial performance of hospital. The metrics covered in the slide are net profit margin, income and expenses, etc.
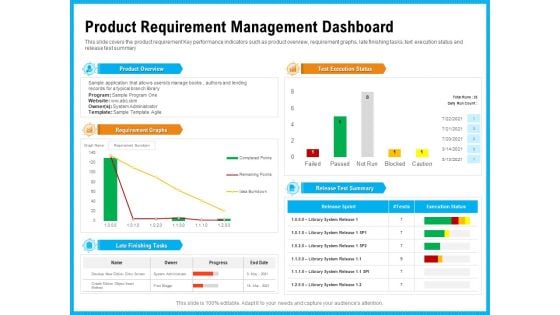
Requirement Gathering Techniques Product Requirement Management Dashboard Sample PDF
This slide covers the product requirement Key performance indicators such as product overview, requirement graphs, late finishing tasks, text execution status and release test summary. Deliver an awe inspiring pitch with this creative requirement gathering techniques product requirement management dashboard sample pdf bundle. Topics like product overview, requirement graphs, late finishing tasks, test execution status, release test summary can be discussed with this completely editable template. It is available for immediate download depending on the needs and requirements of the user.
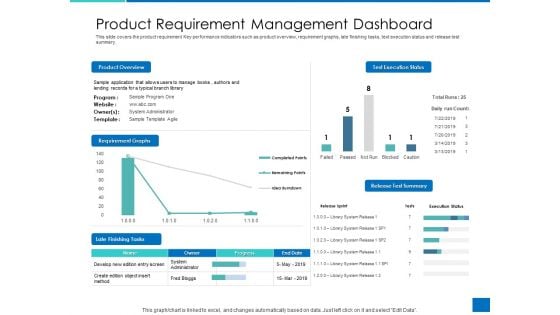
Analyzing Requirement Management Process Product Requirement Management Dashboard Download PDF
This slide covers the product requirement Key performance indicators such as product overview, requirement graphs, late finishing tasks, text execution status and release test summary. Deliver an awe inspiring pitch with this creative analyzing requirement management process product requirement management dashboard download pdf bundle. Topics like product overview, requirement graphs, late finishing tasks, test execution status, release test summary can be discussed with this completely editable template. It is available for immediate download depending on the needs and requirements of the user.
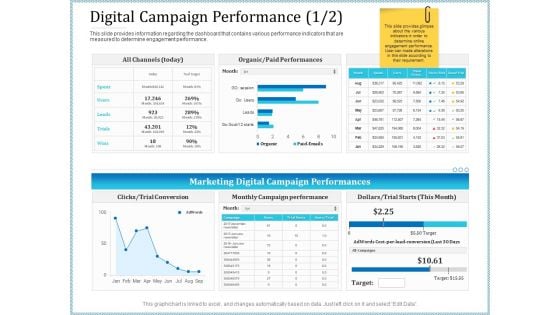
Leveraged Client Engagement Digital Campaign Performance Cost Structure PDF
This slide provides information regarding the dashboard that contains various performance indicators that are measured to determine engagement performance. Deliver and pitch your topic in the best possible manner with this leveraged client engagement digital campaign performance cost structure pdf. Use them to share invaluable insights on campaign, optimization, target, cost and impress your audience. This template can be altered and modified as per your expectations. So, grab it now.
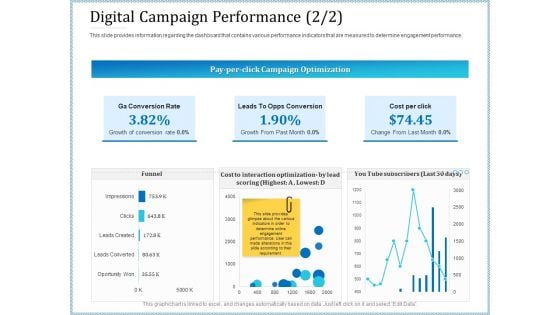
Leveraged Client Engagement Digital Campaign Performance Trend Formats PDF
This slide provides information regarding the dashboard that contains various performance indicators that are measured to determine engagement performance. Deliver an awe inspiring pitch with this creative leveraged client engagement digital campaign performance trend formats pdf bundle. Topics like growth, cost, funnel, optimization can be discussed with this completely editable template. It is available for immediate download depending on the needs and requirements of the user.
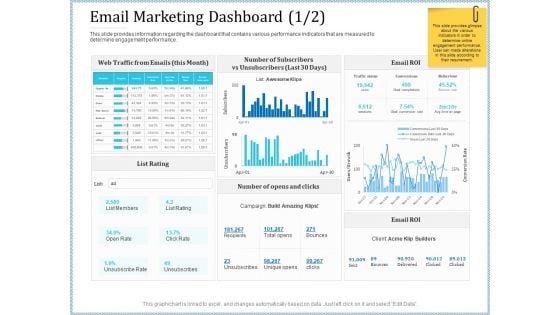
Leveraged Client Engagement Email Marketing Dashboard Click Professional PDF
This slide provides information regarding the dashboard that contains various performance indicators that are measured to determine engagement performance. Deliver and pitch your topic in the best possible manner with this leveraged client engagement email marketing dashboard click professional pdf. Use them to share invaluable insights on campaign, traffic status, social, organic, paid search and impress your audience. This template can be altered and modified as per your expectations. So, grab it now.
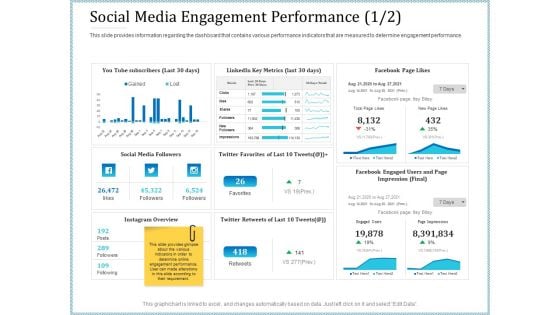
Leveraged Client Engagement Social Media Engagement Performance Clicks Pictures PDF
This slide provides information regarding the dashboard that contains various performance indicators that are measured to determine engagement performance. Deliver an awe inspiring pitch with this creative leveraged client engagement social media engagement performance clicks pictures pdf bundle. Topics like social media, metrics can be discussed with this completely editable template. It is available for immediate download depending on the needs and requirements of the user.
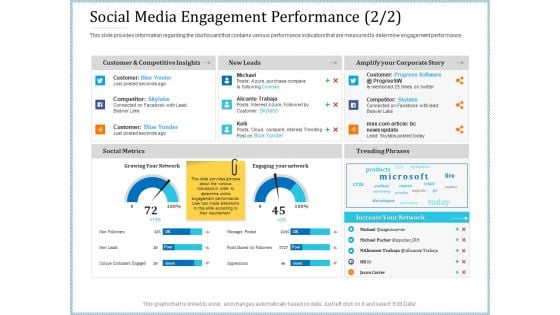
Leveraged Client Engagement Social Media Engagement Performance Leads Sample PDF
This slide provides information regarding the dashboard that contains various performance indicators that are measured to determine engagement performance. Deliver and pitch your topic in the best possible manner with this leveraged client engagement social media engagement performance leads sample pdf. Use them to share invaluable insights on performance, analysis, growing, social metrics and impress your audience. This template can be altered and modified as per your expectations. So, grab it now.
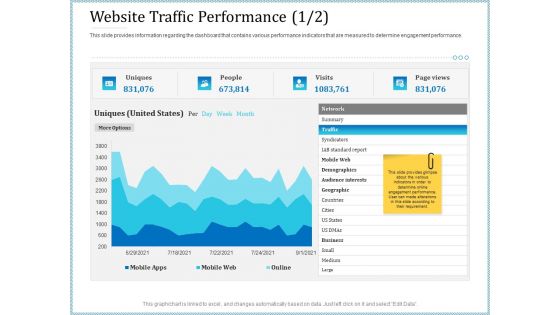
Leveraged Client Engagement Website Traffic Performance Cities Download PDF
This slide provides information regarding the dashboard that contains various performance indicators that are measured to determine engagement performance. Deliver an awe inspiring pitch with this creative leveraged client engagement website traffic performance cities download pdf bundle. Topics like traffic, geographic, business, syndicators, demographics can be discussed with this completely editable template. It is available for immediate download depending on the needs and requirements of the user.
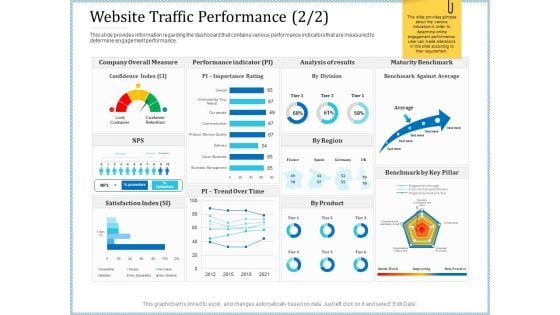
Leveraged Client Engagement Website Traffic Performance Time Inspiration PDF
This slide provides information regarding the dashboard that contains various performance indicators that are measured to determine engagement performance. Deliver and pitch your topic in the best possible manner with this leveraged client engagement website traffic performance time inspiration pdf. Use them to share invaluable insights on measure, performance, analysis, maturity and impress your audience. This template can be altered and modified as per your expectations. So, grab it now.
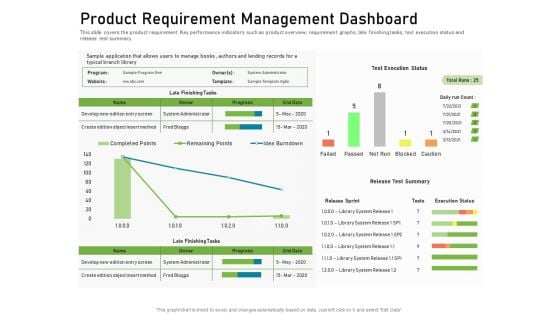
Product Requirement Management Dashboard Graphics PDF
This slide covers the product requirement Key performance indicators such as product overview, requirement graphs, late finishing tasks, text execution status and release test summary. Deliver and pitch your topic in the best possible manner with this product requirement management dashboard graphics pdf. Use them to share invaluable insights on product requirement management dashboard and impress your audience. This template can be altered and modified as per your expectations. So, grab it now.
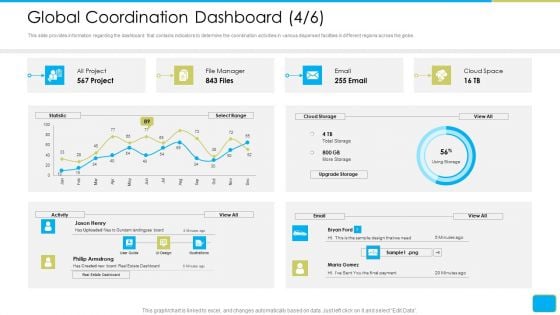
Cross Border Integration In Multinational Corporation Global Coordination Dashboard Cloud Formats PDF
This slide provides information regarding the dashboard that contains indicators to determine the coordination activities in various dispersed facilities in different regions across the globe. Deliver an awe-inspiring pitch with this creative cross border integration in multinational corporation global coordination dashboard cloud formats pdf bundle. Topics like project, cloud space, philip armstrong, cloud storage, upgrade storage can be discussed with this completely editable template. It is available for immediate download depending on the needs and requirements of the user.
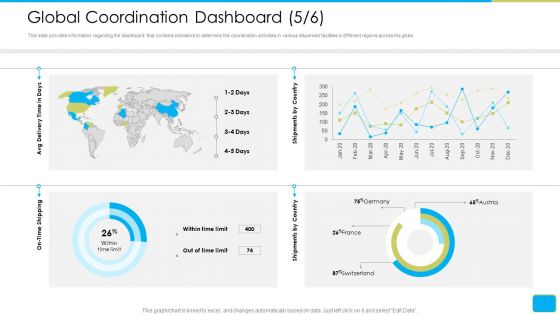
Cross Border Integration In Multinational Corporation Global Coordination Dashboard Limit Ideas PDF
This slide provides information regarding the dashboard that contains indicators to determine the coordination activities in various dispersed facilities in different regions across the globe. Deliver an awe-inspiring pitch with this creative cross border integration in multinational corporation global coordination dashboard limit ideas pdf bundle. Topics like avg delivery time days, on time shipping , shipments country can be discussed with this completely editable template. It is available for immediate download depending on the needs and requirements of the user.
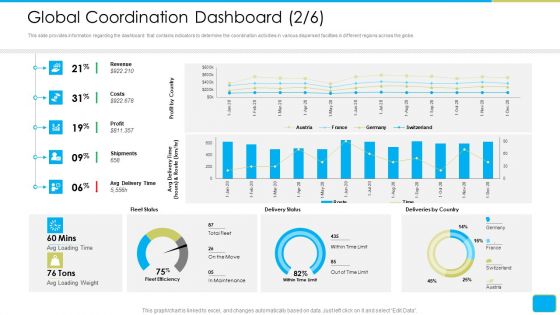
Cross Border Integration In Multinational Corporation Global Coordination Dashboard Revenue Information PDF
This slide provides information regarding the dashboard that contains indicators to determine the coordination activities in various dispersed facilities in different regions across the globe. Deliver and pitch your topic in the best possible manner with this cross border integration in multinational corporation global coordination dashboard revenue information pdf. Use them to share invaluable insights on revenue, costs, profit, shipments, avg delivery time and impress your audience. This template can be altered and modified as per your expectations. So, grab it now.
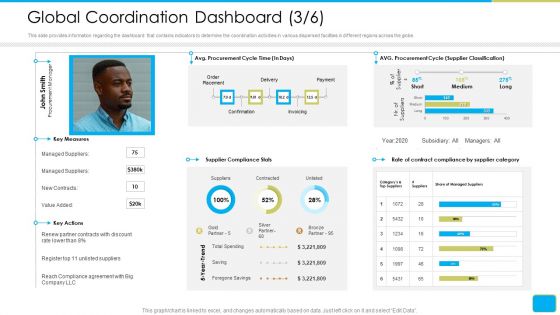
Cross Border Integration In Multinational Corporation Global Coordination Dashboard Time Rules PDF
This slide provides information regarding the dashboard that contains indicators to determine the coordination activities in various dispersed facilities in different regions across the globe. Deliver an awe-inspiring pitch with this creative cross border integration in multinational corporation global coordination dashboard time rules pdf bundle. Topics like avg procurement cycle time, supplier classification, supplier compliance stats can be discussed with this completely editable template. It is available for immediate download depending on the needs and requirements of the user.
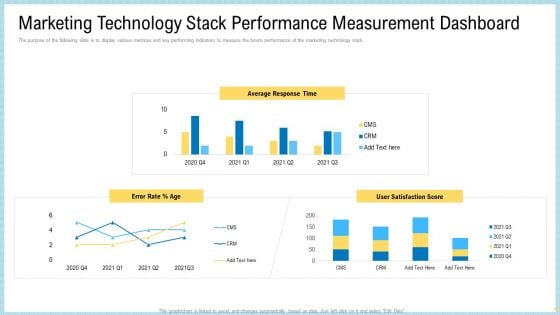
Marketing Technology Stack Performance Measurement Dashboard Demonstration PDF
The purpose of the following slide is to display various metrices and key performing indicators to measure the future performance of the marketing technology stack. Deliver and pitch your topic in the best possible manner with this marketing technology stack performance measurement dashboard demonstration pdf. Use them to share invaluable insights on average response time, user satisfaction score, error rate and impress your audience. This template can be altered and modified as per your expectations. So, grab it now.
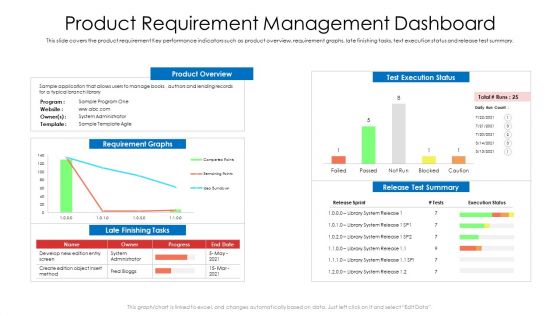
Product Requirement Management Dashboard Ppt Portfolio Clipart PDF
This slide covers the product requirement Key performance indicators such as product overview, requirement graphs, late finishing tasks, text execution status and release test summary. Deliver an awe-inspiring pitch with this creative product requirement management dashboard ppt portfolio clipart pdf bundle. Topics like product overview, requirement graphs, develop can be discussed with this completely editable template. It is available for immediate download depending on the needs and requirements of the user.
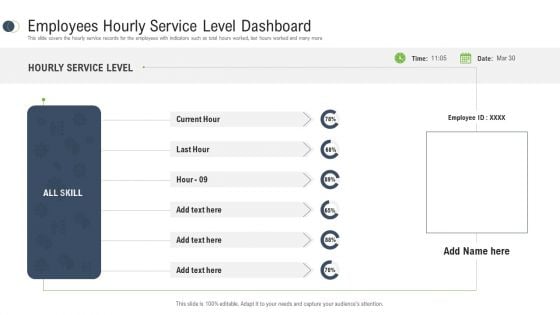
Consumer Complaint Procedure Employees Hourly Service Level Dashboard Ppt Infographics Professional PDF
This slide covers the hourly service records for the employees with indicators such as total hours worked, last hours worked and many more. Deliver and pitch your topic in the best possible manner with this consumer complaint procedure employees hourly service level dashboard ppt infographics professional pdf. Use them to share invaluable insights on employees hourly service level dashboard, hourly service level, skill and impress your audience. This template can be altered and modified as per your expectations. So, grab it now.
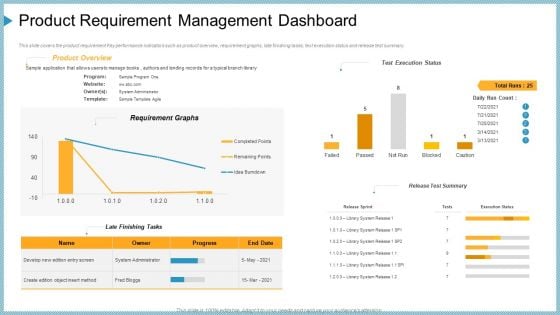
Product Requirement Management Dashboard Ppt File Slide PDF
This slide covers the product requirement Key performance indicators such as product overview, requirement graphs, late finishing tasks, text execution status and release test summary. Deliver an awe-inspiring pitch with this creative product requirement management dashboard ppt file slide pdf bundle. Topics like product requirement management dashboard can be discussed with this completely editable template. It is available for immediate download depending on the needs and requirements of the user.
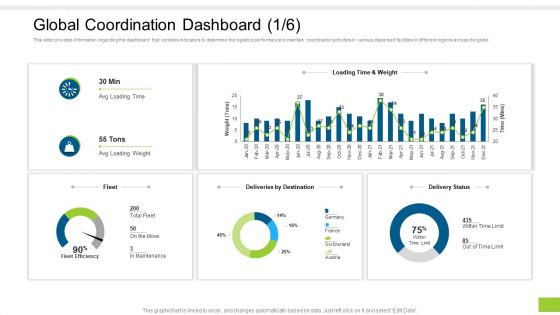
Enterprise Collaboration Global Scale Global Coordination Dashboard Avg Clipart PDF
This slide provides information regarding the dashboard that contains indicators to determine the logistics performance to maintain coordination activities in various dispersed facilities in different regions across the globe. Deliver an awe-inspiring pitch with this creative enterprise collaboration global scale global coordination dashboard avg clipart pdf bundle. Topics like global coordination dashboard can be discussed with this completely editable template. It is available for immediate download depending on the needs and requirements of the user.
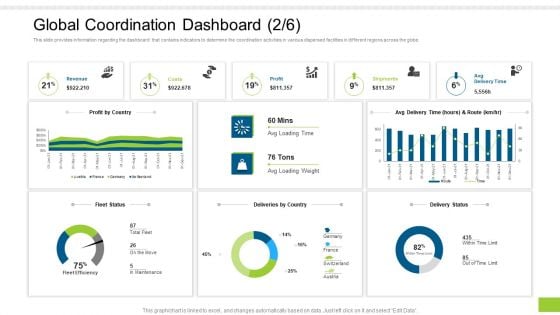
Enterprise Collaboration Global Scale Global Coordination Dashboard By Guidelines PDF
This slide provides information regarding the dashboard that contains indicators to determine the coordination activities in various dispersed facilities in different regions across the globe. Deliver and pitch your topic in the best possible manner with this enterprise collaboration global scale global coordination dashboard by guidelines pdf. Use them to share invaluable insights on revenue, costs, profit and impress your audience. This template can be altered and modified as per your expectations. So, grab it now.
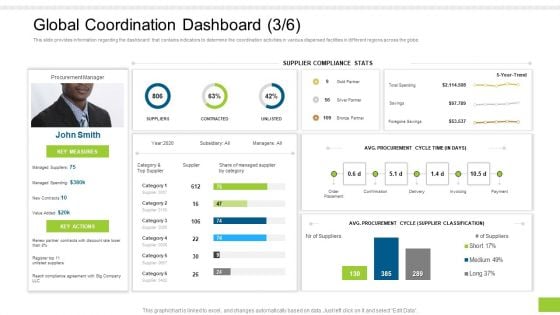
Enterprise Collaboration Global Scale Global Coordination Dashboard Gold Download PDF
This slide provides information regarding the dashboard that contains indicators to determine the coordination activities in various dispersed facilities in different regions across the globe. Deliver an awe-inspiring pitch with this creative enterprise collaboration global scale global coordination dashboard gold download pdf bundle. Topics like supplier compliance, procurement cycle, procurement cycle time can be discussed with this completely editable template. It is available for immediate download depending on the needs and requirements of the user.
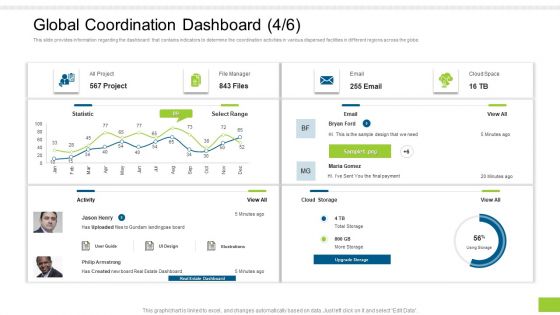
Enterprise Collaboration Global Scale Global Coordination Dashboard Has Formats PDF
This slide provides information regarding the dashboard that contains indicators to determine the coordination activities in various dispersed facilities in different regions across the globe. Deliver and pitch your topic in the best possible manner with this enterprise collaboration global scale global coordination dashboard has formats pdf. Use them to share invaluable insights on global coordination dashboard and impress your audience. This template can be altered and modified as per your expectations. So, grab it now.
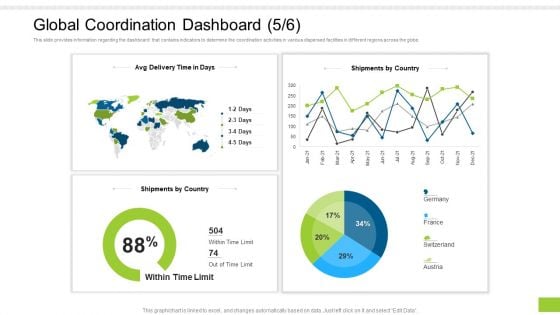
Enterprise Collaboration Global Scale Global Coordination Dashboard Limit Pictures PDF
This slide provides information regarding the dashboard that contains indicators to determine the coordination activities in various dispersed facilities in different regions across the globe. Deliver an awe-inspiring pitch with this creative enterprise collaboration global scale global coordination dashboard limit pictures pdf bundle. Topics like global coordination dashboard can be discussed with this completely editable template. It is available for immediate download depending on the needs and requirements of the user.
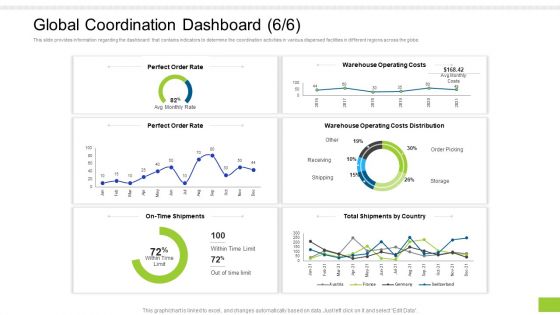
Enterprise Collaboration Global Scale Global Coordination Dashboard Rate Professional PDF
This slide provides information regarding the dashboard that contains indicators to determine the coordination activities in various dispersed facilities in different regions across the globe. Deliver and pitch your topic in the best possible manner with this enterprise collaboration global scale global coordination dashboard rate professional pdf. Use them to share invaluable insights on perfect order rate, warehouse operating costs, operating costs distribution and impress your audience. This template can be altered and modified as per your expectations. So, grab it now.
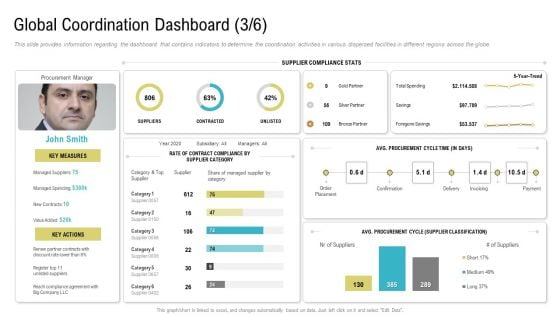
Global Coordination Dashboard Category Ppt Professional Outline PDF
This slide provides information regarding the dashboard that contains indicators to determine the coordination activities in various dispersed facilities in different regions across the globe.Deliver an awe-inspiring pitch with this creative global coordination dashboard category ppt professional outline pdf. bundle. Topics like supplier compliance stats, rate of contract compliance by supplier category can be discussed with this completely editable template. It is available for immediate download depending on the needs and requirements of the user.

Global Coordination Dashboard Deliveries By Country Ppt Gallery File Formats PDF
This slide provides information regarding the dashboard that contains indicators to determine the coordination activities in various dispersed facilities in different regions across the globe.Deliver and pitch your topic in the best possible manner with this global coordination dashboard deliveries by country ppt gallery file formats pdf. Use them to share invaluable insights on revenue, costs, profit, shipments and impress your audience. This template can be altered and modified as per your expectations. So, grab it now.
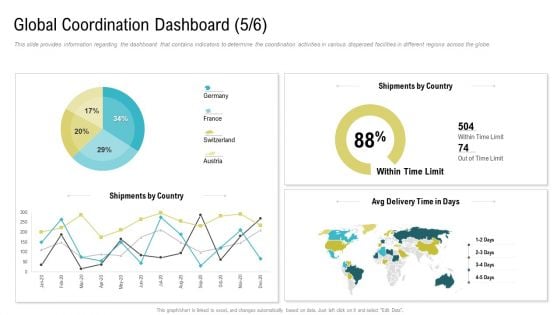
Global Coordination Dashboard France Ppt Inspiration Rules PDF
This slide provides information regarding the dashboard that contains indicators to determine the coordination activities in various dispersed facilities in different regions across the globe.Deliver an awe-inspiring pitch with this creative global coordination dashboard france ppt inspiration rules pdf. bundle. Topics like shipments by country, shipments by country can be discussed with this completely editable template. It is available for immediate download depending on the needs and requirements of the user.
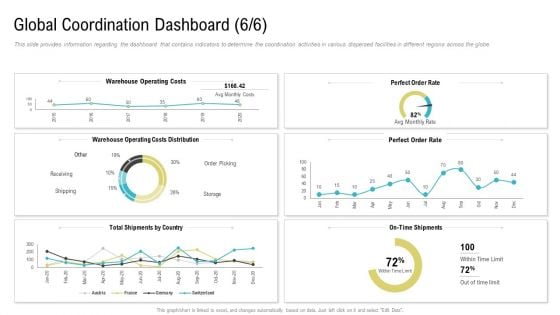
Global Coordination Dashboard Operating Costs Ppt Layouts Graphic Images PDF
This slide provides information regarding the dashboard that contains indicators to determine the coordination activities in various dispersed facilities in different regions across the globe. Deliver and pitch your topic in the best possible manner with this global coordination dashboard operating costs ppt layouts graphic images pdf. Use them to share invaluable insights on warehouse operating costs, warehouse operating costs distribution, perfect order rate and impress your audience. This template can be altered and modified as per your expectations. So, grab it now.
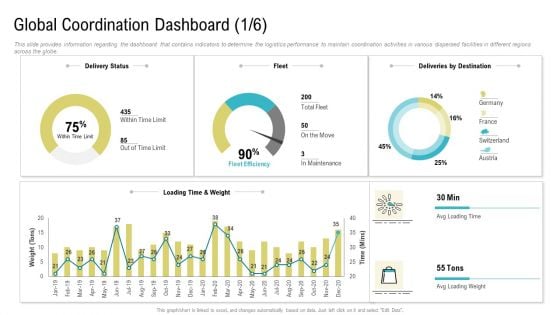
Global Coordination Dashboard Project Ppt Gallery Clipart PDF
This slide provides information regarding the dashboard that contains indicators to determine the logistics performance to maintain coordination activities in various dispersed facilities in different regions across the globe. Deliver an awe-inspiring pitch with this creative global coordination dashboard project ppt gallery clipart pdf. bundle. Topics like global coordination dashboard can be discussed with this completely editable template. It is available for immediate download depending on the needs and requirements of the user.
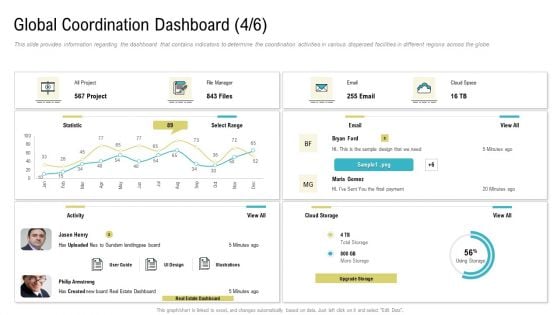
Global Coordination Dashboard Ppt Styles Graphics Download PDF
This slide provides information regarding the dashboard that contains indicators to determine the coordination activities in various dispersed facilities in different regions across the globe. Deliver and pitch your topic in the best possible manner with this global coordination dashboard ppt styles graphics download pdf. Use them to share invaluable insights on project, global coordination dashboard and impress your audience. This template can be altered and modified as per your expectations. So, grab it now.
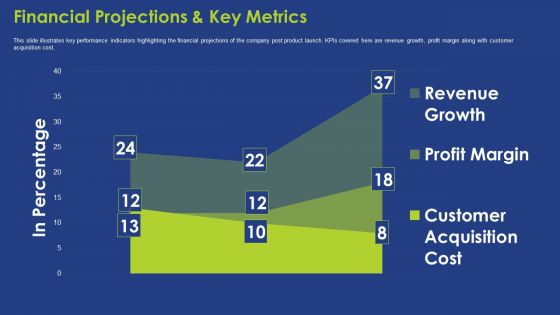
Financial Projections And Key Metrics Ppt Summary Background PDF
This slide illustrates key performance indicators highlighting the financial projections of the company post product launch. KPIs covered here are revenue growth, profit margin along with customer acquisition cost. Deliver an awe inspiring pitch with this creative financial projections and key metrics ppt summary background pdf bundle. Topics like financial projections and key metrics can be discussed with this completely editable template. It is available for immediate download depending on the needs and requirements of the user.
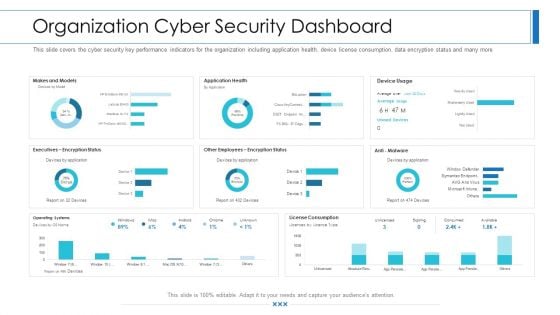
Workforce Security Realization Coaching Plan Organization Cyber Security Dashboard Template PDF
This slide covers the cyber security key performance indicators for the organization including application health, device license consumption, data encryption status and many more. Deliver an awe-inspiring pitch with this creative workforce security realization coaching plan organization cyber security dashboard template pdf bundle. Topics like makes and models, operating systems, encryption status, application health, license consumption can be discussed with this completely editable template. It is available for immediate download depending on the needs and requirements of the user.
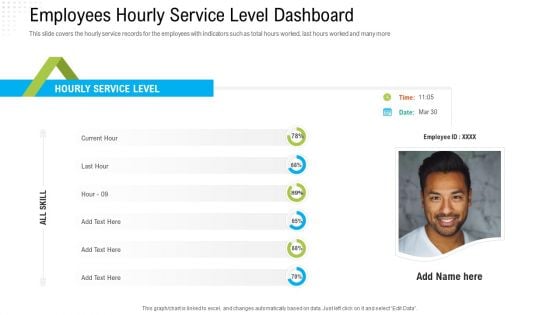
Robotization In Issues Management Employees Hourly Service Level Dashboard Ppt Pictures Maker PDF
This slide covers the hourly service records for the employees with indicators such as total hours worked, last hours worked and many more. Deliver and pitch your topic in the best possible manner with this robotization in issues management employees hourly service level dashboard ppt pictures maker pdf. Use them to share invaluable insights on employees hourly service level dashboard and impress your audience. This template can be altered and modified as per your expectations. So, grab it now.
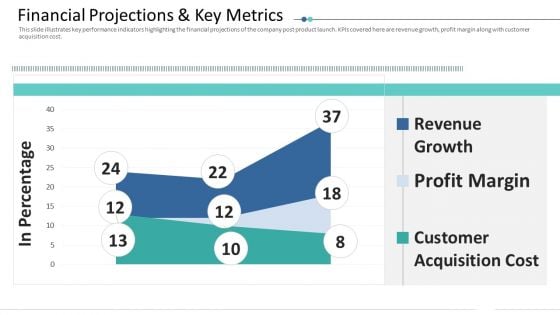
Ten Slides Guy Kawasaki Investor Deck Financial Projections And Key Metrics Structure PDF
This slide illustrates key performance indicators highlighting the financial projections of the company post product launch. KPIs covered here are revenue growth, profit margin along with customer acquisition cost. Deliver an awe-inspiring pitch with this creative ten slides guy kawasaki investor deck financial projections and key metrics structure pdf. bundle. Topics like financial projections and key metrics can be discussed with this completely editable template. It is available for immediate download depending on the needs and requirements of the user.
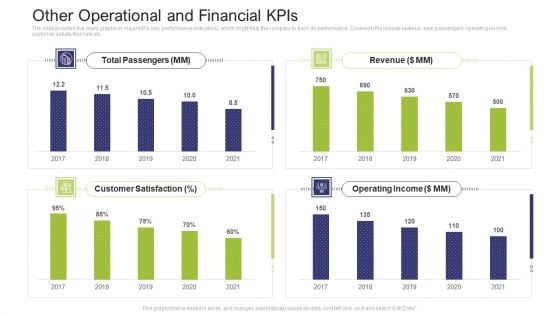
Other Operational And Financial Kpis Inspiration PDF
The slide provides five years graphs of major KPIs key performance indicators, which might help the company to track its performance. Covered KPIs include revenue, total passengers, operating income, customer satisfaction rate etc.Deliver an awe-inspiring pitch with this creative other operational and financial KPIs inspiration pdf. bundle. Topics like total passengers, operating income, revenue, 2017 to 2021 can be discussed with this completely editable template. It is available for immediate download depending on the needs and requirements of the user.
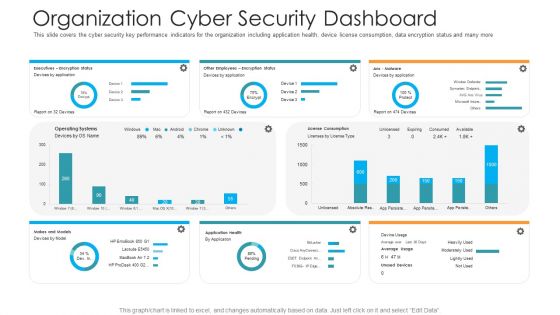
Organization Cyber Security Dashboard Hacking Prevention Awareness Training For IT Security Professional PDF
This slide covers the cyber security key performance indicators for the organization including application health, device license consumption, data encryption status and many more. Deliver and pitch your topic in the best possible manner with this organization cyber security dashboard hacking prevention awareness training for it security professional pdf. Use them to share invaluable insights on executives, license consumption, operating systems and impress your audience. This template can be altered and modified as per your expectations. So, grab it now.
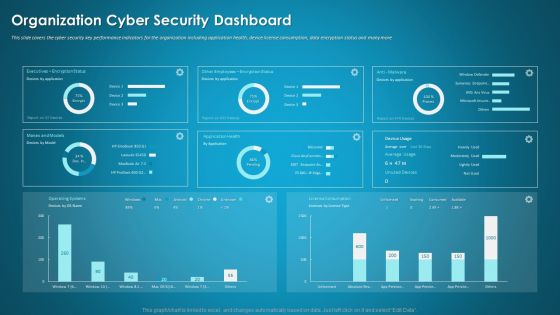
Organizational Network Security Awareness Staff Learning Organization Cyber Security Dashboard Elements PDF
This slide covers the cyber security key performance indicators for the organization including application health, device license consumption, data encryption status and many more. Deliver and pitch your topic in the best possible manner with this organizational network security awareness staff learning organization cyber security dashboard elements pdf. Use them to share invaluable insights on organization cyber security dashboard and impress your audience. This template can be altered and modified as per your expectations. So, grab it now.
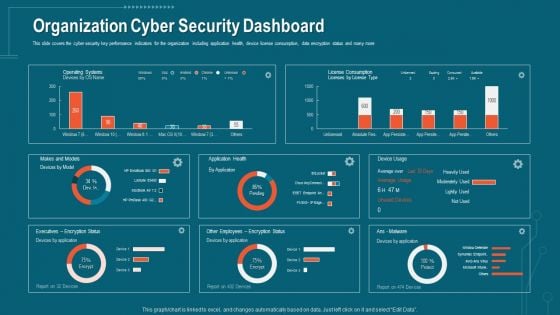
Companys Data Safety Recognition Organization Cyber Security Dashboard Pictures PDF
This slide covers the cyber security key performance indicators for the organization including application health, device license consumption, data encryption status and many more. Deliver an awe-inspiring pitch with this creative companys data safety recognition organization cyber security dashboard pictures pdf bundle. Topics like application health, operating systems, encryption status can be discussed with this completely editable template. It is available for immediate download depending on the needs and requirements of the user.
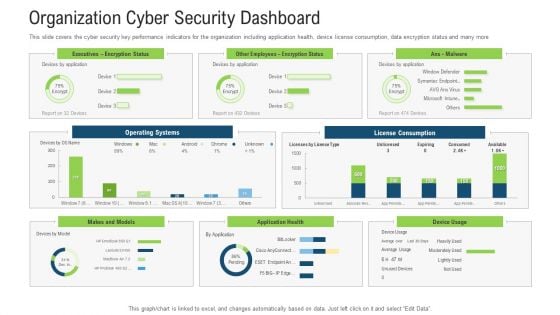
Organization Cyber Security Dashboard Ppt Show Outfit PDF
This slide covers the cyber security key performance indicators for the organization including application health, device license consumption, data encryption status and many more. Deliver an awe inspiring pitch with this creative organization cyber security dashboard ppt show outfit pdf bundle. Topics like operating systems, license consumption, makes and models, other employees can be discussed with this completely editable template. It is available for immediate download depending on the needs and requirements of the user.
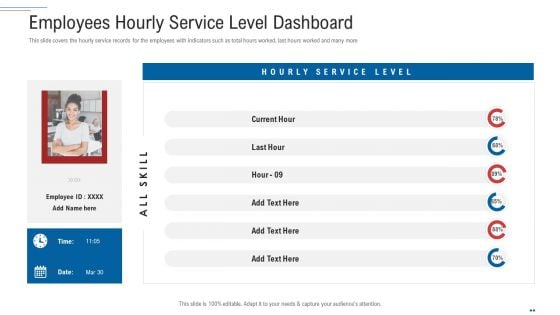
Customer Complaint Handling Process Employees Hourly Service Level Dashboard Rules PDF
This slide covers the hourly service records for the employees with indicators such as total hours worked, last hours worked and many more. Deliver and pitch your topic in the best possible manner with this customer complaint handling process employees hourly service level dashboard rules pdf. Use them to share invaluable insights on employees hourly service level dashboard and impress your audience. This template can be altered and modified as per your expectations. So, grab it now.
Waste Management Tracking Dashboard Ppt PowerPoint Presentation File Information PDF
This slide covers the key performance indicators for waste management including waste trucks tracker, green house gasses emissions, energy used and many more. Deliver an awe inspiring pitch with this creative waste management tracking dashboard ppt powerpoint presentation file information pdf bundle. Topics like waste management tracking dashboard can be discussed with this completely editable template. It is available for immediate download depending on the needs and requirements of the user.
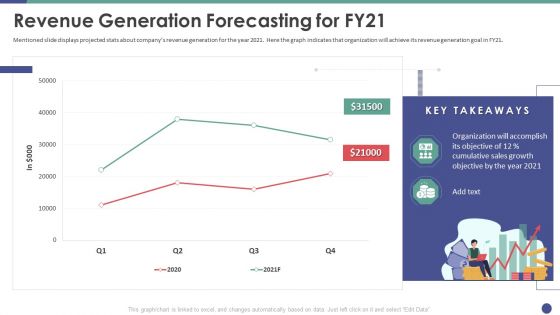
QC Engineering Revenue Generation Forecasting For FY21 Ppt Layouts Show PDF
Mentioned slide displays projected stats about companys revenue generation for the year 2021. Here the graph indicates that organization will achieve its revenue generation goal in FY21. Deliver and pitch your topic in the best possible manner with this qc engineering revenue generation forecasting for fy21 ppt layouts show pdf. Use them to share invaluable insights on organization, cumulative, sales, growth, objective and impress your audience. This template can be altered and modified as per your expectations. So, grab it now.
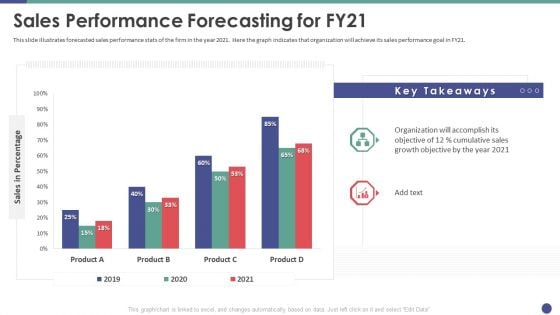
QC Engineering Sales Performance Forecasting For FY21 Ppt Styles Graphics Download PDF
This slide illustrates forecasted sales performance stats of the firm in the year 2021. Here the graph indicates that organization will achieve its sales performance goal in FY21. Deliver and pitch your topic in the best possible manner with this qc engineering sales performance forecasting for fy21 ppt styles graphics download pdf. Use them to share invaluable insights on organization, cumulative, sales, growth, objective and impress your audience. This template can be altered and modified as per your expectations. So, grab it now.
Environmental Assessment Financial Dashboard For Business Impact Tracking Ppt Layouts Guidelines PDF
This slide shows financial dashboard for business impact tracking with key performance indicators like quick ratio, current ratio, monthly cash flow etc Deliver and pitch your topic in the best possible manner with this environmental assessment financial dashboard for business impact tracking ppt layouts guidelines pdf. Use them to share invaluable insights on sales outstanding, cash balance, accounts payable and impress your audience. This template can be altered and modified as per your expectations. So, grab it now.
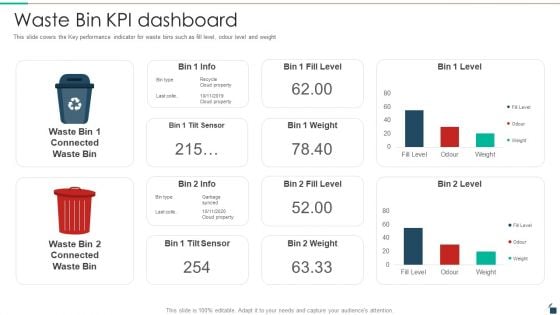
Waste Bin KPI Dashboard Resources Recycling And Waste Management Template PDF
This slide covers the Key performance indicator for waste bins such as fill level, odour level and weight. Deliver an awe inspiring pitch with this creative waste bin kpi dashboard resources recycling and waste management template pdf bundle. Topics like waste bin kpi dashboard can be discussed with this completely editable template. It is available for immediate download depending on the needs and requirements of the user.
Waste Management Tracking Dashboard Resources Recycling And Waste Management Pictures PDF
This slide covers the key performance indicators for waste management including waste trucks tracker, green house gasses emissions, energy used and many more. Deliver an awe inspiring pitch with this creative waste management tracking dashboard resources recycling and waste management pictures pdf bundle. Topics like waste management tracking dashboard can be discussed with this completely editable template. It is available for immediate download depending on the needs and requirements of the user.
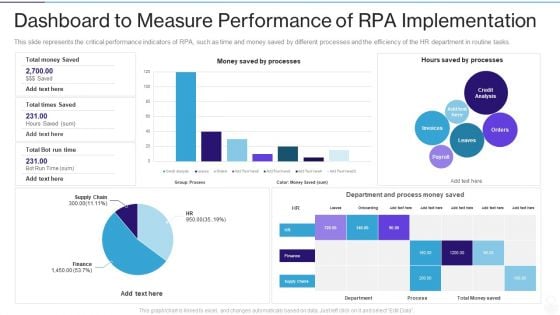
RPA IT Dashboard To Measure Performance Of RPA Implementation Ppt Professional Pictures PDF
This slide represents the critical performance indicators of RPA, such as time and money saved by different processes and the efficiency of the HR department in routine tasks. Deliver an awe inspiring pitch with this creative rpa it dashboard to measure performance of rpa implementation ppt professional pictures pdf bundle. Topics like processes, finance, supply chain, analysis, payroll can be discussed with this completely editable template. It is available for immediate download depending on the needs and requirements of the user.
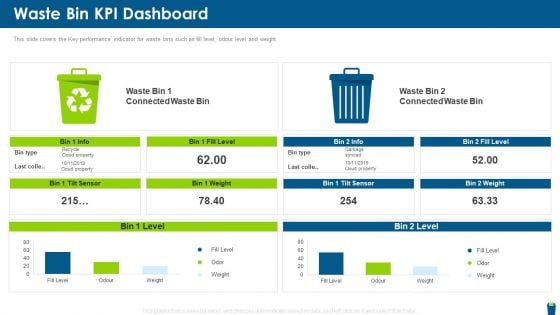
Dangerous Waste Management Waste Bin KPI Dashboard Formats PDF
This slide covers the Key performance indicator for waste bins such as fill level, odour level and weight. Deliver and pitch your topic in the best possible manner with this dangerous waste management waste bin kpi dashboard formats pdf. Use them to share invaluable insights on waste bin kpi dashboard and impress your audience. This template can be altered and modified as per your expectations. So, grab it now.
Dangerous Waste Management Waste Management Tracking Dashboard Summary PDF
This slide covers the key performance indicators for waste management including waste trucks tracker, green house gasses emissions, energy used and many more Deliver and pitch your topic in the best possible manner with this dangerous waste management waste management tracking dashboard summary pdf. Use them to share invaluable insights on waste management tracking dashboard and impress your audience. This template can be altered and modified as per your expectations. So, grab it now.
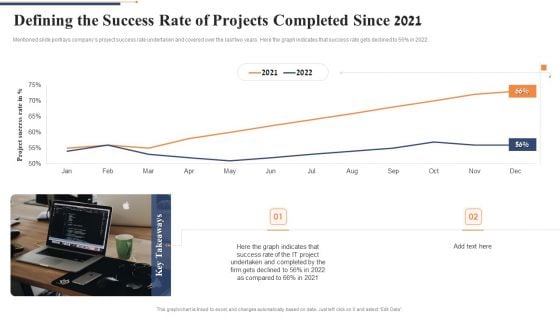
Defining The Success Rate Of Projects Completed Since 2021 Pictures PDF
Mentioned slide portrays companys project success rate undertaken and covered over the last two years. Here the graph indicates that success rate gets declined to 56percentsge in 2022. Deliver an awe inspiring pitch with this creative defining the success rate of projects completed since 2021 pictures pdf bundle. Topics like project success rate can be discussed with this completely editable template. It is available for immediate download depending on the needs and requirements of the user.
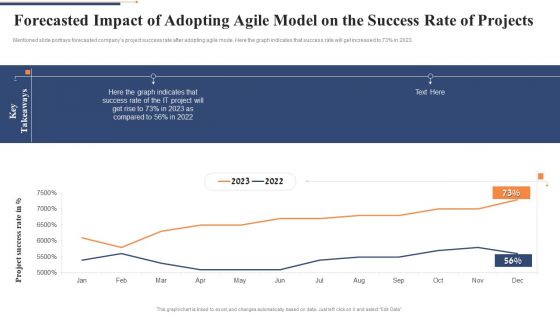
Forecasted Impact Of Adopting Agile Model On The Success Rate Of Projects Inspiration PDF
Mentioned slide portrays forecasted companys project success rate after adopting agile mode. Here the graph indicates that success rate will get increased to 73percentage in 2023. Deliver an awe inspiring pitch with this creative forecasted impact of adopting agile model on the success rate of projects inspiration pdf bundle. Topics like project success rate can be discussed with this completely editable template. It is available for immediate download depending on the needs and requirements of the user.
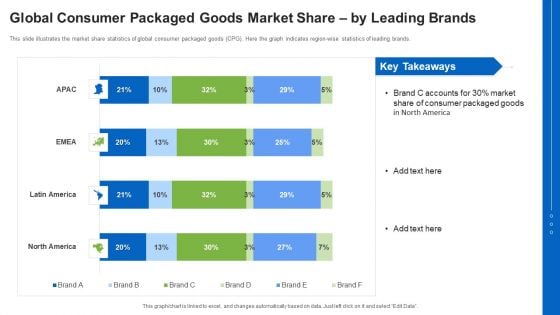
Global Consumer Packaged Goods Market Share By Leading Brands Ppt Portfolio Aids PDF
This slide illustrates the market share statistics of global consumer packaged goods CPG. Here the graph indicates region-wise statistics of leading brands. Deliver an awe inspiring pitch with this creative global consumer packaged goods market share by leading brands ppt portfolio aids pdf bundle. Topics like global consumer packaged goods market share by leading brands can be discussed with this completely editable template. It is available for immediate download depending on the needs and requirements of the user.
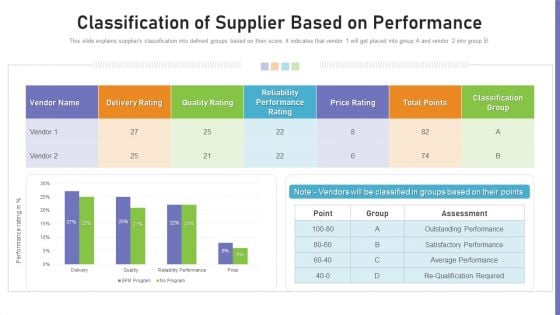
Benchmarking Supplier Operation Control Procedure Classification Of Supplier Based On Performance Ideas PDF
This slide explains suppliers classification into defined groups based on their score. It indicates that vendor 1 will get placed into group A and vendor 2 into group B. Deliver an awe-inspiring pitch with this creative benchmarking supplier operation control procedure classification of supplier based on performance ideas pdf bundle. Topics like classification of supplier based on performance can be discussed with this completely editable template. It is available for immediate download depending on the needs and requirements of the user.
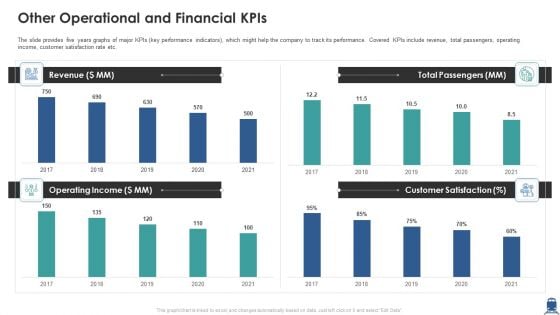
Other Operational And Financial Kpis Information PDF
The slide provides five years graphs of major KPIs key performance indicators, which might help the company to track its performance. Covered KPIs include revenue, total passengers, operating income, customer satisfaction rate etc. Deliver an awe inspiring pitch with this creative other operational and financial kpis information pdf bundle. Topics like revenue, operating income, customer satisfaction can be discussed with this completely editable template. It is available for immediate download depending on the needs and requirements of the user.
Factory Waste Management Tracking Dashboard Inspiration PDF
This slide covers the key performance indicators for waste management including waste trucks tracker, green house gasses emissions, energy used and many more Deliver and pitch your topic in the best possible manner with this factory waste management tracking dashboard inspiration pdf. Use them to share invaluable insights on factory waste management tracking dashboard and impress your audience. This template can be altered and modified as per your expectations. So, grab it now.
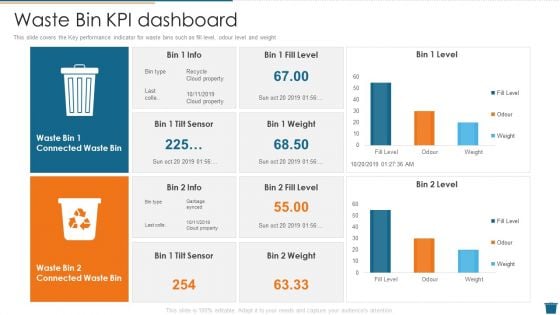
Factory Waste Management Waste Bin Kpi Dashboard Demonstration PDF
This slide covers the Key performance indicator for waste bins such as fill level, odour level and weight Deliver and pitch your topic in the best possible manner with this factory waste management waste bin kpi dashboard demonstration pdf. Use them to share invaluable insights on waste bin kpi dashboard and impress your audience. This template can be altered and modified as per your expectations. So, grab it now.
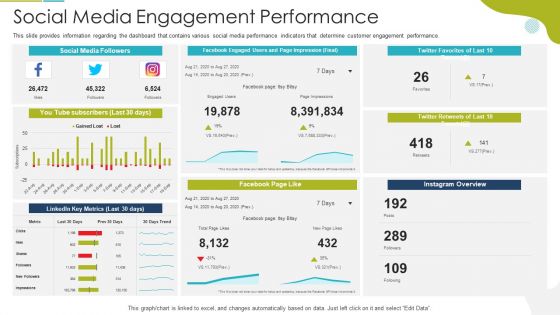
Social Media Engagement Performance Demonstration PDF
This slide provides information regarding the dashboard that contains various social media performance indicators that determine customer engagement performance. Deliver and pitch your topic in the best possible manner with this social media engagement performance demonstration pdf. Use them to share invaluable insights on social media engagement performance and impress your audience. This template can be altered and modified as per your expectations. So, grab it now.
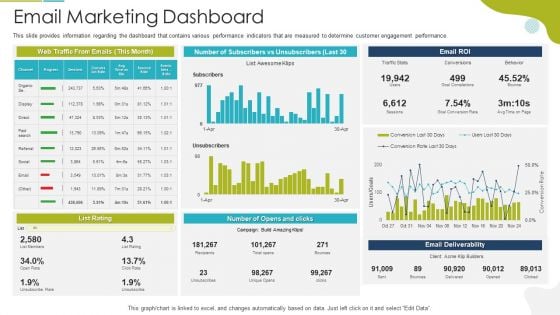
Tactical Marketing Strategy For Customer Engagement Email Marketing Dashboard Topics PDF
This slide provides information regarding the dashboard that contains various performance indicators that are measured to determine customer engagement performance. Deliver and pitch your topic in the best possible manner with this tactical marketing strategy for customer engagement email marketing dashboard topics pdf. Use them to share invaluable insights on email marketing dashboard and impress your audience. This template can be altered and modified as per your expectations. So, grab it now.
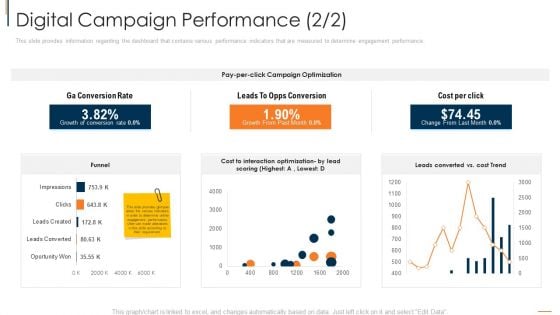
Online Consumer Engagement Digital Campaign Performance Rate Guidelines PDF
This slide provides information regarding the dashboard that contains various performance indicators that are measured to determine engagement performance. Deliver and pitch your topic in the best possible manner with this online consumer engagement digital campaign performance rate guidelines pdf. Use them to share invaluable insights on optimization, cost, rate and impress your audience. This template can be altered and modified as per your expectations. So, grab it now.
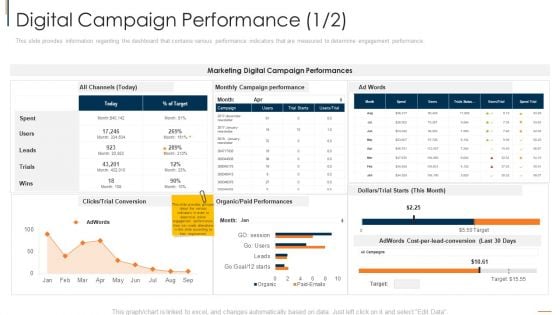
Online Consumer Engagement Digital Campaign Performance Target Graphics PDF
This slide provides information regarding the dashboard that contains various performance indicators that are measured to determine engagement performance. Deliver an awe inspiring pitch with this creative online consumer engagement digital campaign performance target graphics pdf bundle. Topics like performances, marketing digital, target can be discussed with this completely editable template. It is available for immediate download depending on the needs and requirements of the user.
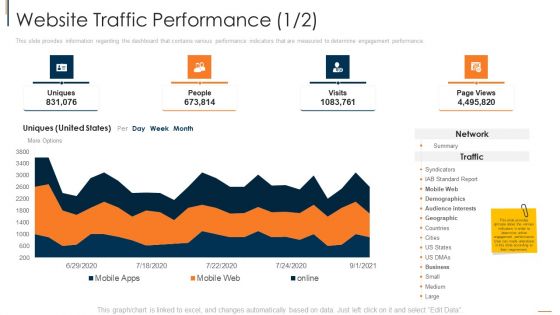
Online Consumer Engagement Website Traffic Performance Web Portrait PDF
This slide provides information regarding the dashboard that contains various performance indicators that are measured to determine engagement performance. Deliver an awe inspiring pitch with this creative online consumer engagement website traffic performance web portrait pdf bundle. Topics like network, demographics, geographic can be discussed with this completely editable template. It is available for immediate download depending on the needs and requirements of the user.
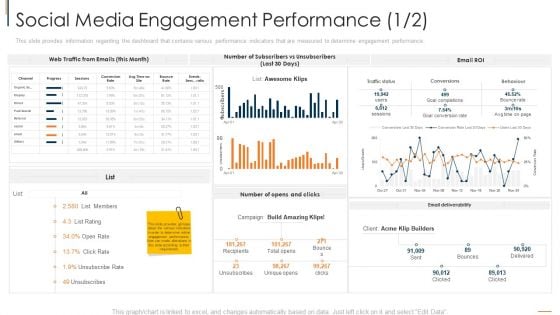
Social Media Engagement Performance Emails Summary PDF
This slide provides information regarding the dashboard that contains various performance indicators that are measured to determine engagement performance. Deliver and pitch your topic in the best possible manner with this social media engagement performance emails summary pdf. Use them to share invaluable insights on social media engagement performance and impress your audience. This template can be altered and modified as per your expectations. So, grab it now.
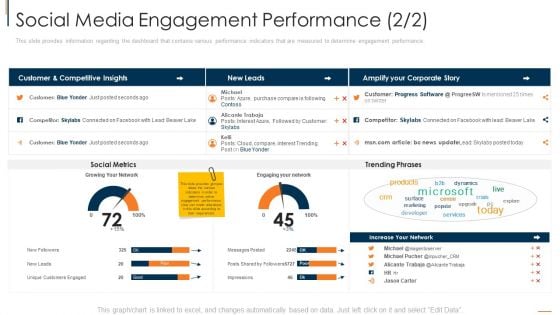
Social Media Engagement Performance Network Introduction PDF
This slide provides information regarding the dashboard that contains various performance indicators that are measured to determine engagement performance. Deliver an awe inspiring pitch with this creative social media engagement performance network introduction pdf bundle. Topics like purchase, social metrics, network, customers can be discussed with this completely editable template. It is available for immediate download depending on the needs and requirements of the user.
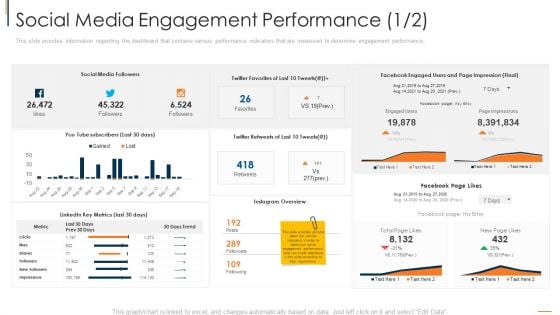
Social Media Engagement Performance Social Summary PDF
This slide provides information regarding the dashboard that contains various performance indicators that are measured to determine engagement performance. Deliver and pitch your topic in the best possible manner with this social media engagement performance social summary pdf. Use them to share invaluable insights on social media engagement performance and impress your audience. This template can be altered and modified as per your expectations. So, grab it now.
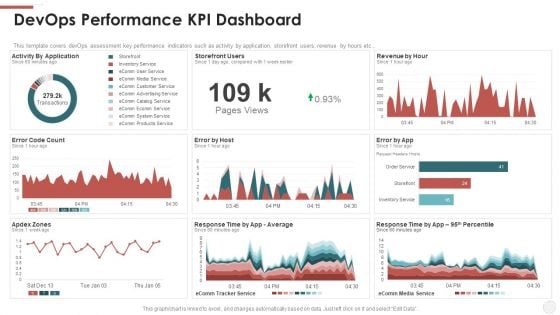
Devops Performance KPI Dashboard Ppt File Example Topics PDF
This template covers devOps assessment key performance indicators such as activity by application, storefront users, revenue by hours etc. Deliver and pitch your topic in the best possible manner with this devops performance kpi dashboard ppt file example topics pdf. Use them to share invaluable insights on revenue, application and impress your audience. This template can be altered and modified as per your expectations. So, grab it now.
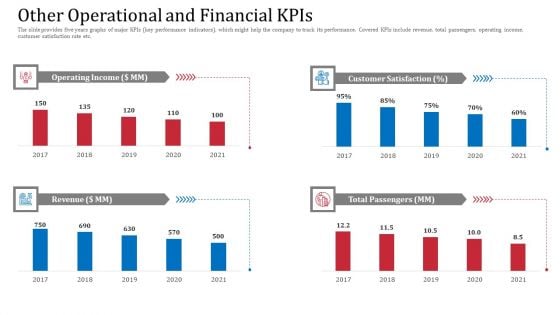
Other Operational And Financial Kpis Demonstration PDF
The slide provides five years graphs of major KPIs key performance indicators, which might help the company to track its performance. Covered KPIs include revenue, total passengers, operating income, customer satisfaction rate etc.Deliver and pitch your topic in the best possible manner with this other operational and financial kpis demonstration pdf. Use them to share invaluable insights on customer satisfaction, operating income, total passengers and impress your audience. This template can be altered and modified as per your expectations. So, grab it now.
Database Expansion And Optimization Tracking Dashboard For Data Repository Ppt Gallery Example
This slide indicates the tracking dashboard for data repository. It includes information regarding sever health, query response time, average number of active connections, load and time spent in database. Deliver an awe inspiring pitch with this creative database expansion and optimization tracking dashboard for data repository ppt gallery example bundle. Topics like tracking dashboard for data repository can be discussed with this completely editable template. It is available for immediate download depending on the needs and requirements of the user.
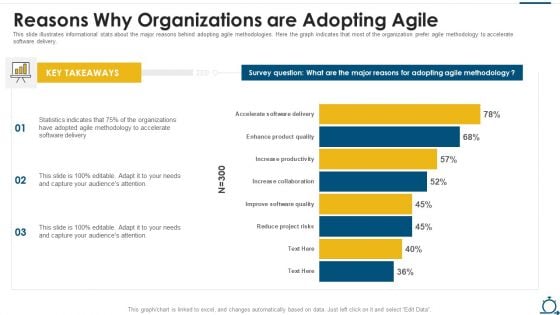
Agile SDLC IT Reasons Why Organizations Are Adopting Agile Demonstration PDF
This slide illustrates informational stats about the major reasons behind adopting agile methodologies. Here the graph indicates that most of the organization prefer agile methodology to accelerate software delivery. Deliver an awe inspiring pitch with this creative agile sdlc it reasons why organizations are adopting agile demonstration pdf bundle. Topics like organizations, methodology, collaboration can be discussed with this completely editable template. It is available for immediate download depending on the needs and requirements of the user.
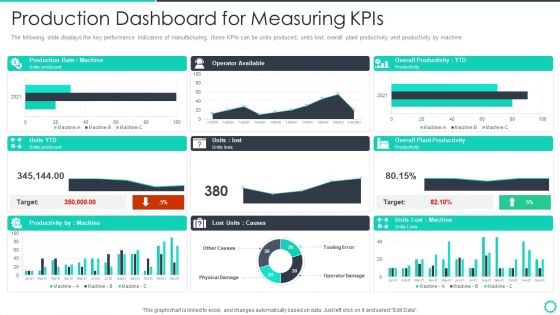
Manufacturing Operation Quality Improvement Practices Tools Templates Production Dashboard For Mockup PDF
The following slide displays the key performance Indicators of manufacturing, these KPIs can be units produced, units lost, overall plant productivity and productivity by machine. Deliver an awe inspiring pitch with this creative manufacturing operation quality improvement practices tools templates production dashboard for mockup pdf bundle. Topics like production dashboard for measuring kpis can be discussed with this completely editable template. It is available for immediate download depending on the needs and requirements of the user.
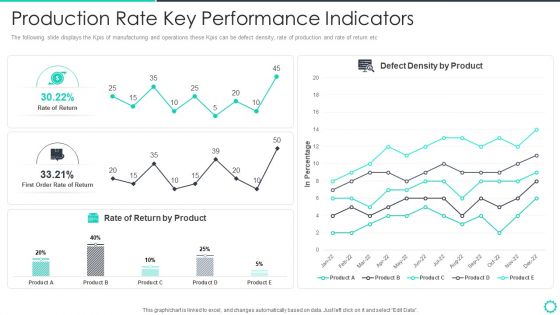
Manufacturing Operation Quality Improvement Practices Tools Templates Production Rate Key Performance Portrait PDF
The following slide displays the Kpis of manufacturing and operations these Kpis can be defect density, rate of production and rate of return etc. Deliver and pitch your topic in the best possible manner with this manufacturing operation quality improvement practices tools templates production rate key performance portrait pdf. Use them to share invaluable insights on production rate key performance indicators and impress your audience. This template can be altered and modified as per your expectations. So, grab it now.
Tactical Plan For Upgrading DBMS Tracking Dashboard For Data Repository Designs PDF
This slide indicates the tracking dashboard for data repository. It includes information regarding sever health, query response time, average number of active connections, load and time spent in database. Deliver an awe inspiring pitch with this creative tactical plan for upgrading dbms tracking dashboard for data repository designs pdf bundle. Topics like tracking dashboard for data repository can be discussed with this completely editable template. It is available for immediate download depending on the needs and requirements of the user.
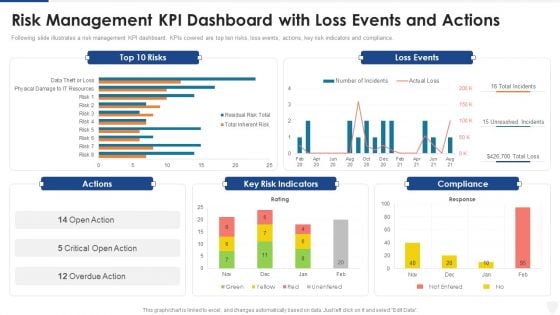
Risk Management KPI Dashboard With Loss Events And Actions Ppt Backgrounds PDF
Following slide illustrates a risk management KPI dashboard. KPIs covered are top ten risks, loss events, actions, key risk indicators and compliance. Deliver and pitch your topic in the best possible manner with this risk management kpi dashboard with loss events and actions ppt backgrounds pdf. Use them to share invaluable insights on risk management kpi dashboard with loss events and actions and impress your audience. This template can be altered and modified as per your expectations. So, grab it now.
AI And ML Driving Monetary Value For Organization Customer Engagement Tracking Kpi Dashboard Pictures PDF
This slide displays customer engagement dashboard. It include key performance indicators namely median lifetime spend. Average churn risk, brand affinities and highly engaged customers. Deliver an awe inspiring pitch with this creative ai and ml driving monetary value for organization customer engagement tracking kpi dashboard pictures pdf bundle. Topics like high earners, high engaged customers, return customers, brand affinities, interests can be discussed with this completely editable template. It is available for immediate download depending on the needs and requirements of the user.
MSW Management Waste Management Tracking Dashboard Rules PDF
This slide covers the key performance indicators for waste management including waste trucks tracker, green house gasses emissions, energy used and many more. Deliver an awe inspiring pitch with this creative MSW Management Waste Management Tracking Dashboard Rules Pdf bundle. Topics like waste management manpower budget can be discussed with this completely editable template. It is available for immediate download depending on the needs and requirements of the user.
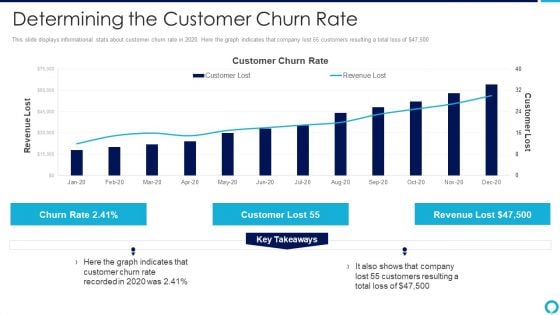
Partnership Management Strategies Determining The Customer Churn Rate Guidelines PDF
This slide displays informational stats about customer churn rate in 2020. Here the graph indicates that company lost 55 customers resulting a total loss of dollar47,500 Deliver and pitch your topic in the best possible manner with this partnership management strategies determining the customer churn rate guidelines pdf Use them to share invaluable insights on determining the customer churn rate and impress your audience. This template can be altered and modified as per your expectations. So, grab it now.
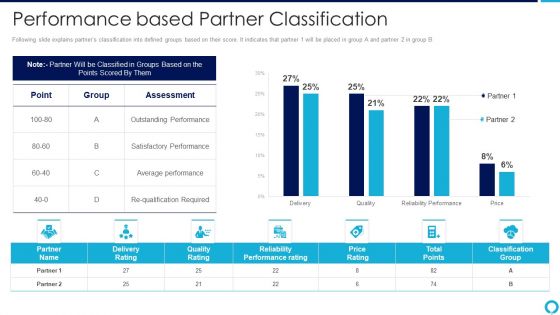
Partnership Management Strategies Performance Based Partner Classification Clipart PDF
Following slide explains partners classification into defined groups based on their score. It indicates that partner 1 will be placed in group A and partner 2 in group B. Deliver an awe inspiring pitch with this creative partnership management strategies performance based partner classification clipart pdf bundle. Topics like outstanding performance, satisfactory performance, average performance can be discussed with this completely editable template. It is available for immediate download depending on the needs and requirements of the user.
Developing Organization Primary Data Storage Action Plan Tracking Dashboard For Data Repository Background PDF
This slide indicates the tracking dashboard for data repository. It includes information regarding sever health, query response time, average number of active connections, load and time spent in database. Deliver an awe inspiring pitch with this creative developing organization primary data storage action plan tracking dashboard for data repository background pdf bundle. Topics like tracking dashboard for data repository can be discussed with this completely editable template. It is available for immediate download depending on the needs and requirements of the user.
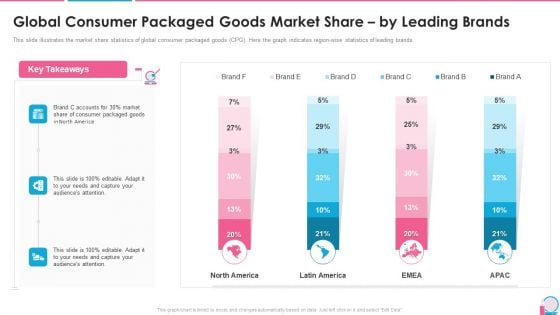
Investor Pitch Presentation For Beauty Product Brands Global Consumer Packaged Goods Market Share By Leading Brands Structure PDF
This slide illustrates the market share statistics of global consumer packaged goods CPG. Here the graph indicates region-wise statistics of leading brands. Deliver an awe inspiring pitch with this creative investor pitch presentation for beauty product brands global consumer packaged goods market share by leading brands structure pdf bundle. Topics like global consumer packaged goods market share by leading brands can be discussed with this completely editable template. It is available for immediate download depending on the needs and requirements of the user.
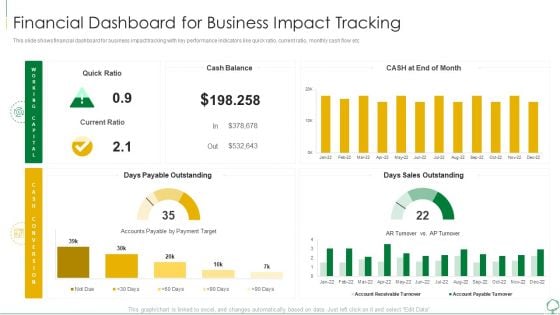
Environmental Examination Tools And Approaches Financial Dashboard For Business Professional PDF
This slide shows financial dashboard for business impact tracking with key performance indicators like quick ratio, current ratio, monthly cash flow etc. Deliver an awe inspiring pitch with this creative environmental examination tools and approaches financial dashboard for business professional pdf bundle. Topics like financial dashboard for business impact tracking can be discussed with this completely editable template. It is available for immediate download depending on the needs and requirements of the user.
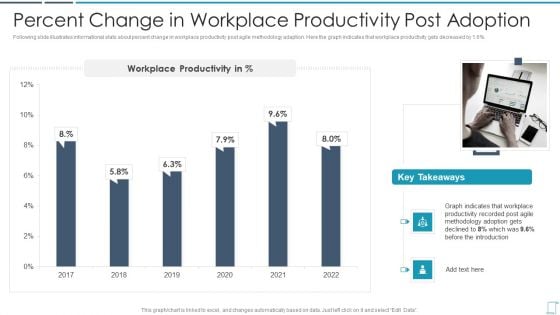
Professional Scrum Master Certification Training Program IT Percent Change In Workplace Template PDF
Following slide illustrates informational stats about percent change in workplace productivity post agile methodology adaption. Here the graph indicates that workplace productivity gets decreased by 1.6persent.Deliver and pitch your topic in the best possible manner with this professional scrum master certification training program it percent change in workplace template pdf Use them to share invaluable insights on productivity, methodology adoption, before the introduction and impress your audience. This template can be altered and modified as per your expectations. So, grab it now.
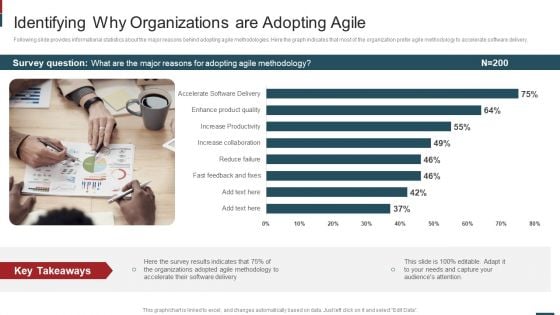
Cost Saving With Agile Methodology IT Identifying Why Organizations Elements PDF
Following slide provides informational statistics about the major reasons behind adopting agile methodologies. Here the graph indicates that most of the organization prefer agile methodology to accelerate software delivery.Deliver an awe inspiring pitch with this creative cost saving with agile methodology it identifying why organizations elements pdf bundle. Topics like reduce failure, increase collaboration, enhance product quality can be discussed with this completely editable template. It is available for immediate download depending on the needs and requirements of the user.
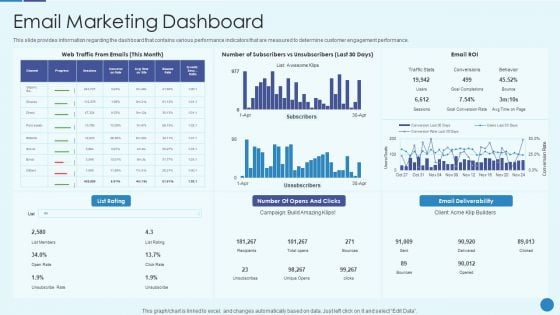
Implementing Successful Strategic Marketing Plan To Increase ROI Email Marketing Dashboard Microsoft PDF
This slide provides information regarding the dashboard that contains various performance indicators that are measured to determine customer engagement performance. Deliver an awe inspiring pitch with this creative implementing successful strategic marketing plan to increase roi email marketing dashboard microsoft pdf bundle. Topics like email marketing dashboard can be discussed with this completely editable template. It is available for immediate download depending on the needs and requirements of the user.
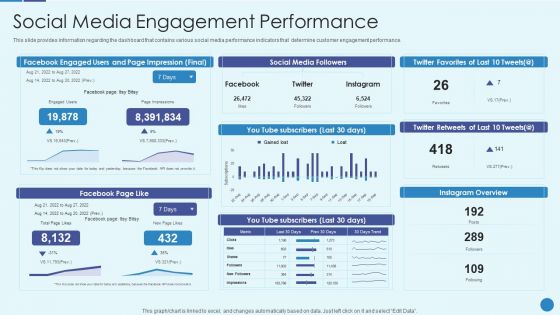
Implementing Successful Strategic Marketing Plan To Increase ROI Social Media Engagement Performance Infographics PDF
This slide provides information regarding the dashboard that contains various social media performance indicators that determine customer engagement performance. Deliver an awe inspiring pitch with this creative implementing successful strategic marketing plan to increase roi social media engagement performance infographics pdf bundle. Topics like social media engagement performance can be discussed with this completely editable template. It is available for immediate download depending on the needs and requirements of the user.

 Home
Home