Meter Icon
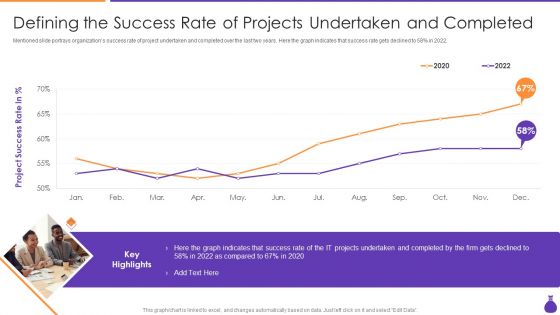
Why Is Agile Cost Effective IT Defining The Success Rate Of Projects Undertaken Mockup PDF
Mentioned slide portrays organizations success rate of project undertaken and completed over the last two years. Here the graph indicates that success rate gets declined to 58 percent in 2022. Deliver an awe inspiring pitch with this creative Why Is Agile Cost Effective IT Defining The Success Rate Of Projects Undertaken Mockup PDF bundle. Topics like Project Success Rate, IT Projects, 2020 To 2022 can be discussed with this completely editable template. It is available for immediate download depending on the needs and requirements of the user.
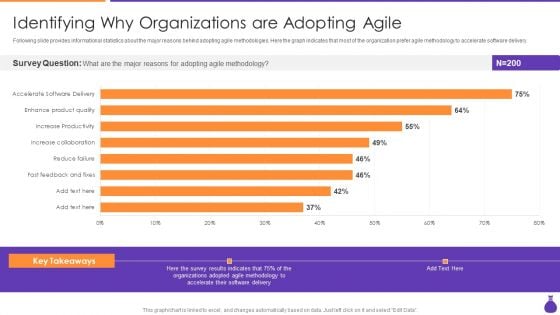
Why Is Agile Cost Effective IT Dentifying Why Organizations Are Adopting Agile Guidelines PDF
Following slide provides informational statistics about the major reasons behind adopting agile methodologies. Here the graph indicates that most of the organization prefer agile methodology to accelerate software delivery. Deliver an awe inspiring pitch with this creative Why Is Agile Cost Effective IT Dentifying Why Organizations Are Adopting Agile Guidelines PDF bundle. Topics like Survey Question, Adopting Agile Methodology, Fast Feedback And Fixes, Reduce Failure can be discussed with this completely editable template. It is available for immediate download depending on the needs and requirements of the user.
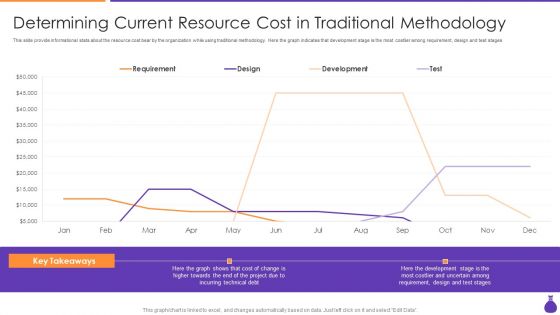
Why Is Agile Cost Effective IT Determining Current Resource Cost In Traditional Methodology Information PDF
This slide provide informational stats about the resource cost bear by the organization while using traditional methodology. Here the graph indicates that development stage is the most costlier among requirement, design and test stages. Deliver an awe inspiring pitch with this creative Why Is Agile Cost Effective IT Determining Current Resource Cost In Traditional Methodology Information PDF bundle. Topics like Requirement, Design, Development, Test can be discussed with this completely editable template. It is available for immediate download depending on the needs and requirements of the user.
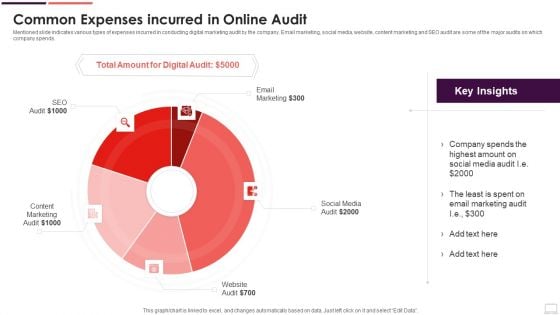
Common Expenses Incurred In Online Audit Clipart PDF
Mentioned slide indicates various types of expenses incurred in conducting digital marketing audit by the company. Email marketing, social media, website, content marketing and SEO audit are some of the major audits on which company spends. Pitch your topic with ease and precision using this Common Expenses Incurred In Online Audit Clipart PDF. This layout presents information on Marketing Audit, Social Media, Email Marketing. It is also available for immediate download and adjustment. So, changes can be made in the color, design, graphics or any other component to create a unique layout.
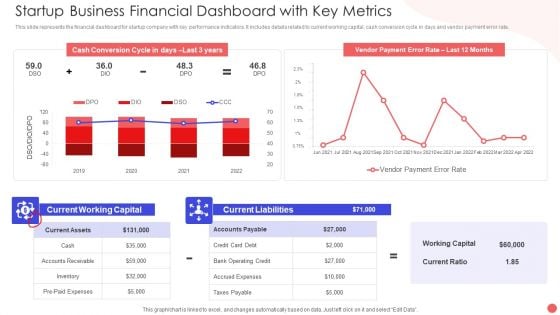
Startup Business Financial Dashboard With Key Metrics Sample PDF
This slide represents the financial dashboard for startup company with key performance indicators. It includes details related to current working capital, cash conversion cycle in days and vendor payment error rate. Pitch your topic with ease and precision using this Startup Business Financial Dashboard With Key Metrics Sample PDF. This layout presents information on Cash Conversion Cycle, Current Working Capital, Current Liabilities Debt. It is also available for immediate download and adjustment. So, changes can be made in the color, design, graphics or any other component to create a unique layout.
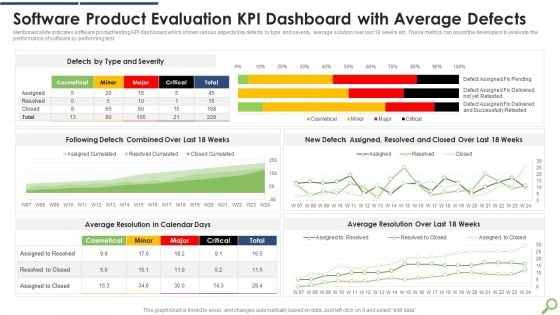
Software Product Evaluation KPI Dashboard With Average Defects Infographics PDF
Mentioned slide indicates software product testing KPI dashboard which shows various aspects like defects by type and severity, average solution over last 18 weeks etc. These metrics can assist the developers to evaluate the performance of software by performing test.Showcasing this set of slides titled Software Product Evaluation KPI Dashboard With Average Defects Infographics PDF The topics addressed in these templates are Software Product, Evaluation Dashboard, Average Defects All the content presented in this PPT design is completely editable. Download it and make adjustments in color, background, font etc. as per your unique business setting.
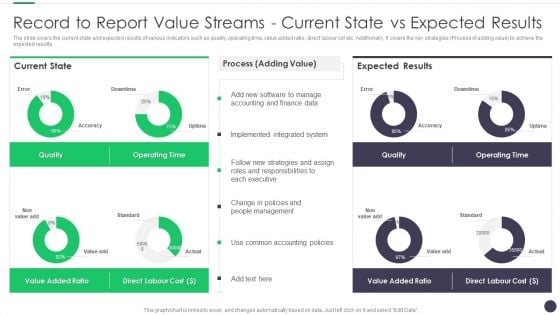
Finance And Accounting Online Conversion Plan Record To Report Value Streams Mockup PDF
The slide covers the current state and expected results of various indicators such as quality, operating time, value added ratio, direct labour cot etc. Additionally, it covers the key strategies Process of adding value to achieve the expected results. Deliver an awe inspiring pitch with this creative Finance And Accounting Online Conversion Plan Record To Report Value Streams Mockup PDF bundle. Topics like Operating Time, Process, Expected Results can be discussed with this completely editable template. It is available for immediate download depending on the needs and requirements of the user.
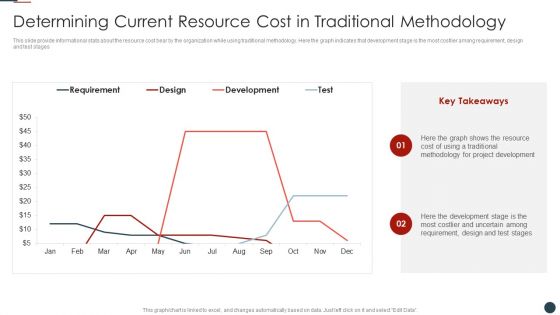
Implementing Agile Software Development Methodology For Cost Cutting IT Determining Current Resource Introduction PDF
This slide provide informational stats about the resource cost bear by the organization while using traditional methodology. Here the graph indicates that development stage is the most costlier among requirement, design and test stages.Deliver and pitch your topic in the best possible manner with this Implementing Agile Software Development Methodology For Cost Cutting IT Determining Current Resource Introduction PDF Use them to share invaluable insights on Project Development, Development Stage, Requirement Design and impress your audience. This template can be altered and modified as per your expectations. So, grab it now.
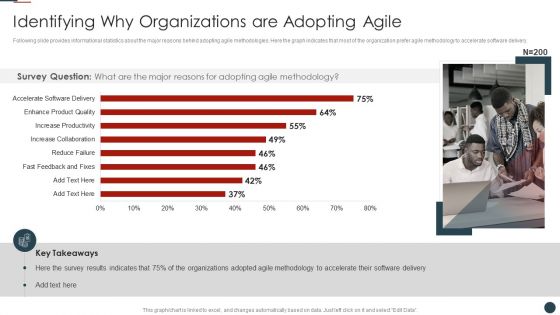
Implementing Agile Software Development Methodology For Cost Cutting IT Identifying Why Organizations Slides PDF
Following slide provides informational statistics about the major reasons behind adopting agile methodologies. Here the graph indicates that most of the organization prefer agile methodology to accelerate software delivery.Deliver and pitch your topic in the best possible manner with this Implementing Agile Software Development Methodology For Cost Cutting IT Identifying Why Organizations Slides PDF Use them to share invaluable insights on Reduce Failure, Increase Collaboration, Increase Productivity and impress your audience. This template can be altered and modified as per your expectations. So, grab it now.
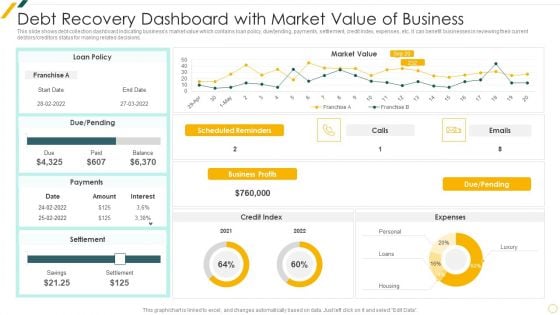
Debt Recovery Dashboard With Market Value Of Business Template PDF
This slide shows debt collection dashboard indicating businesss market value which contains loan policy, due ending, payments, settlement, credit index, expenses, etc. It can benefit businesses in reviewing their current debtors creditors status for making related decisions.Showcasing this set of slides titled Debt Recovery Dashboard With Market Value Of Business Template PDF The topics addressed in these templates are Debt Recovery, Dashboard Market, Value Of Business All the content presented in this PPT design is completely editable. Download it and make adjustments in color, background, font etc. as per your unique business setting.
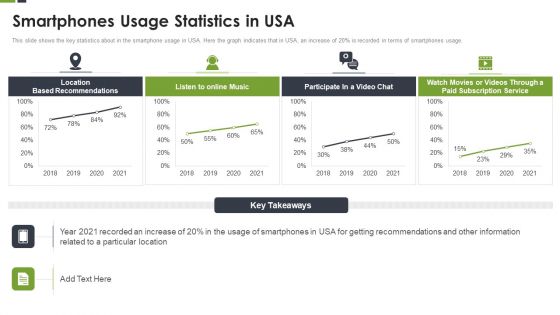
LBS Application Elevator Smartphones Usage Statistics In Usa Ppt Infographics Grid PDF
This slide shows the key statistics about in the smartphone usage in USA. Here the graph indicates that in USA, an increase of 20 percent is recorded in terms of smartphones usage. Deliver and pitch your topic in the best possible manner with this LBS Application Elevator Smartphones Usage Statistics In Usa Ppt Infographics Grid PDF. Use them to share invaluable insights on Location Based, Subscription Service, Particular Location and impress your audience. This template can be altered and modified as per your expectations. So, grab it now.
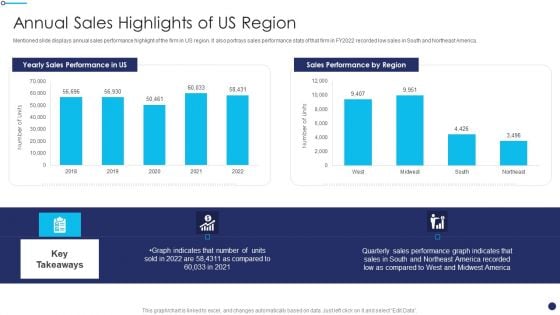
Effective Sales Technique For New Product Launch Annual Sales Highlights Of US Region Inspiration PDF
Mentioned slide displays annual sales performance highlight of the firm in US region. It also portrays sales performance stats of that firm in FY2022 recorded low sales in South and Northeast America. Deliver an awe inspiring pitch with this creative Effective Sales Technique For New Product Launch Annual Sales Highlights Of US Region Inspiration PDF bundle. Topics like Sales Performance, Graph Indicates, Performance Graph can be discussed with this completely editable template. It is available for immediate download depending on the needs and requirements of the user.

Effective Sales Plan For New Product Introduction In Market Annual Sales Highlights Template PDF
Mentioned slide displays annual sales performance highlight of the firm in US region. It also portrays sales performance stats of that firm in FY2020 recorded low sales in South and Northeast America. Deliver an awe inspiring pitch with this creative Effective Sales Plan For New Product Introduction In Market Annual Sales Highlights Template PDF bundle. Topics like Sales Performance, Graph Indicates, Key Takeaways can be discussed with this completely editable template. It is available for immediate download depending on the needs and requirements of the user.
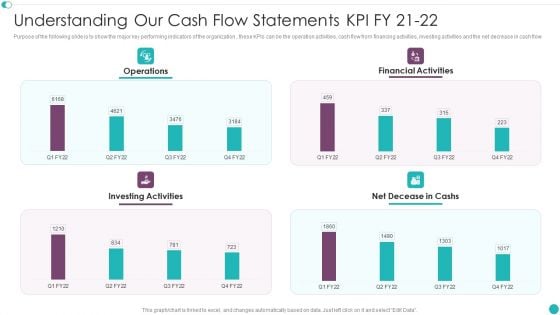
Credit Management And Recovery Policies Understanding Our Cash Flow Statements KPI Portrait PDF
Purpose of the following slide is to show the major key performing indicators of the organization , these KPIs can be the operation activities, cash flow from financing activities, investing activities and the net decrease in cash flow. Deliver an awe inspiring pitch with this creative Credit Management And Recovery Policies Understanding Our Cash Flow Statements KPI Portrait PDF bundle. Topics like Financial Activities, Investing Activities, Net Decease can be discussed with this completely editable template. It is available for immediate download depending on the needs and requirements of the user.
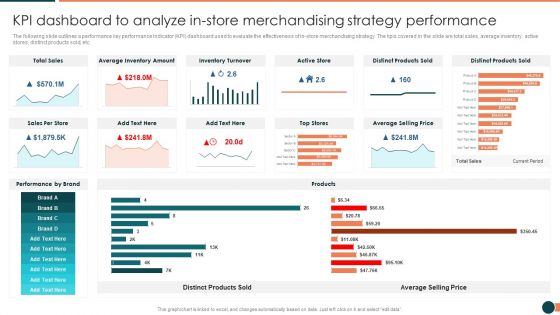
Developing Retail Marketing Strategies To Increase Revenue KPI Dashboard To Analyze Instore Information PDF
The following slide outlines a performance key performance indicator KPI dashboard used to evaluate the effectiveness of in store merchandising strategy. The kpis covered in the slide are total sales, average inventory, active stores, distinct products sold, etc.Deliver an awe inspiring pitch with this creative Developing Retail Marketing Strategies To Increase Revenue KPI Dashboard To Analyze Instore Information PDF bundle. Topics like Inventory Turnover, Distinct Products, Average Inventory can be discussed with this completely editable template. It is available for immediate download depending on the needs and requirements of the user.
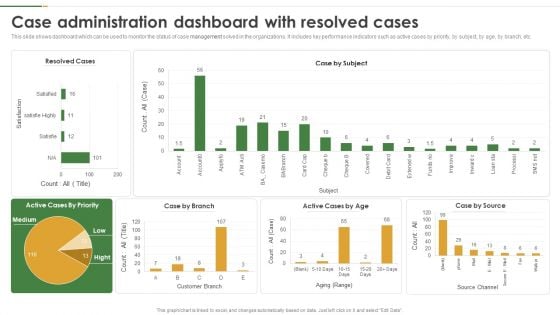
Case Administration Dashboard With Resolved Cases Graphics PDF
This slide shows dashboard which can be used to monitor the status of case management solved in the organizations. It includes key performance indicators such as active cases by priority, by subject, by age, by branch, etc. Pitch your topic with ease and precision using this Case Administration Dashboard With Resolved Cases Graphics PDF. This layout presents information on Case Administration Dashboard, Resolved Cases. It is also available for immediate download and adjustment. So, changes can be made in the color, design, graphics or any other component to create a unique layout.
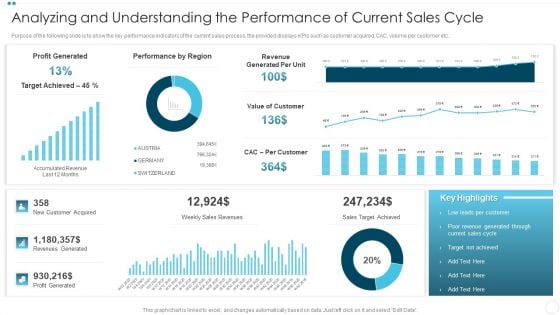
Analyzing And Understanding The Performance Of Current Sales Cycle Background PDF
Purpose of the following slide is to show the key performance indicators of the current sales process, the provided displays KPIs such as customer acquired, CAC, volume per customer etc.Deliver and pitch your topic in the best possible manner with this Analyzing And Understanding The Performance Of Current Sales Cycle Background PDF Use them to share invaluable insights on Profit Generated, Performance By Region, Customer Acquired and impress your audience. This template can be altered and modified as per your expectations. So, grab it now.
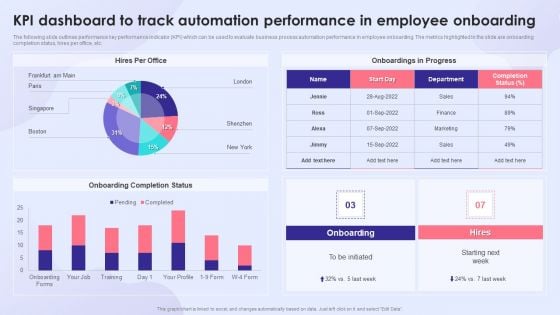
KPI Dashboard To Track Automation Performance In Employee Onboarding Introduction PDF
The following slide outlines performance key performance indicator KPI which can be used to evaluate business process automation performance in employee onboarding. The metrics highlighted in the slide are onboarding completion status, hires per office, etc. Deliver an awe inspiring pitch with this creative KPI Dashboard To Track Automation Performance In Employee Onboarding Introduction PDF bundle. Topics like Onboarding Completion Status, Onboardings In Progress, Employee Onboarding can be discussed with this completely editable template. It is available for immediate download depending on the needs and requirements of the user.
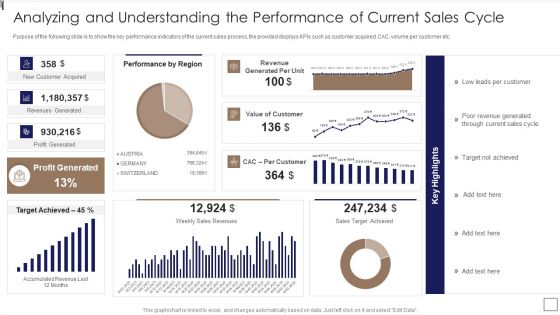
Sales Lead Qualification Procedure And Parameter Analyzing And Understanding Sample PDF
Purpose of the following slide is to show the key performance indicators of the current sales process, the provided displays KPIs such as customer acquired, CAC, volume per customer etc.Deliver and pitch your topic in the best possible manner with this Sales Lead Qualification Procedure And Parameter Analyzing And Understanding Sample PDF Use them to share invaluable insights on Performance By Region, Value Of Customer, Profit Generated and impress your audience. This template can be altered and modified as per your expectations. So, grab it now.
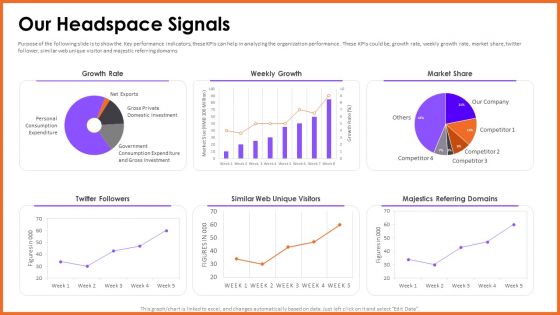
Headspace Fund Raising Pitch Deck Our Headspace Signals Microsoft PDF
Purpose of the following slide is to show the Key performance indicators, these KPIs can help in analyzing the organization performance . These KPIs could be growth rate, weekly growth rate, market share, twitter follower, similar web unique visitor and majestic referring domains.Deliver and pitch your topic in the best possible manner with this Headspace Fund Raising Pitch Deck Our Headspace Signals Microsoft PDF. Use them to share invaluable insights on Growth Rate, Weekly Growth, Referring Domains and impress your audience. This template can be altered and modified as per your expectations. So, grab it now.
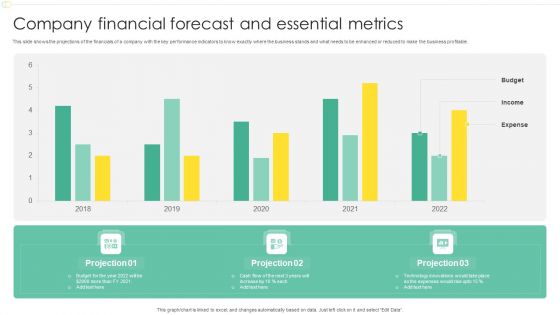
Company Financial Forecast And Essential Metrics Ppt Model Design Templates PDF
This slide shows the projections of the financials of a company with the key performance indicators to know exactly where the business stands and what needs to be enhanced or reduced to make the business profitable. Showcasing this set of slides titled Company Financial Forecast And Essential Metrics Ppt Model Design Templates PDF. The topics addressed in these templates are Budget, Income, Expense, 2018 To 2022. All the content presented in this PPT design is completely editable. Download it and make adjustments in color, background, font etc. as per your unique business setting.
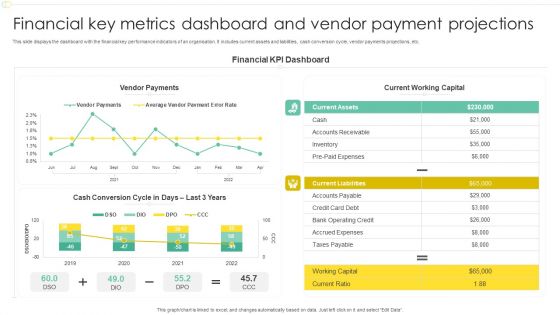
Financial Key Metrics Dashboard And Vendor Payment Projections Professional PDF
This slide displays the dashboard with the financial key performance indicators of an organisation. It includes current assets and liabilities, cash conversion cycle, vendor payments projections, etc. Pitch your topic with ease and precision using this Financial Key Metrics Dashboard And Vendor Payment Projections Professional PDF. This layout presents information on Financial KPI Dashboard, Current Working Capital, Vendor Payments. It is also available for immediate download and adjustment. So, changes can be made in the color, design, graphics or any other component to create a unique layout.
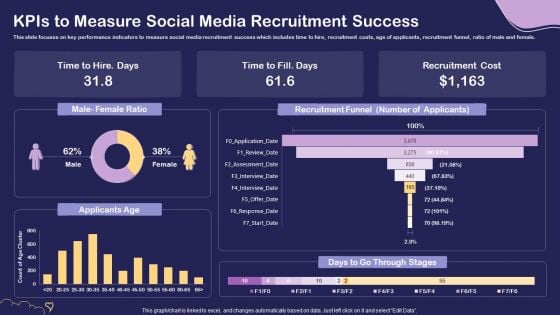
Social Media Hiring For Potential Candidate Kpis To Measure Social Media Recruitment Success Clipart PDF
This slide focuses on key performance indicators to measure social media recruitment success which includes time to hire, recruitment costs, age of applicants, recruitment funnel, ratio of male and female. Deliver and pitch your topic in the best possible manner with this Social Media Hiring For Potential Candidate Kpis To Measure Social Media Recruitment Success Clipart PDF. Use them to share invaluable insights on Recruitment Cost, Applicants Age, Recruitment Funnel and impress your audience. This template can be altered and modified as per your expectations. So, grab it now.
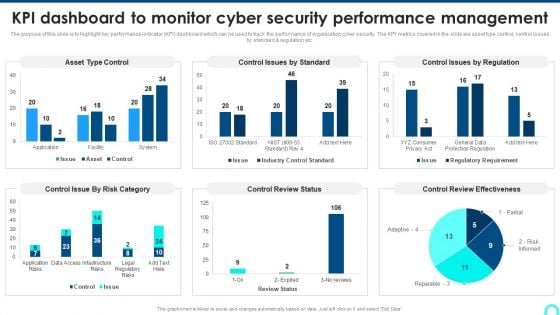
KPI Dashboard To Monitor Cyber Security Performance Management Background PDF
The purpose of this slide is to highlight key performance indicator KPI dashboard which can be used to track the performance of organization cyber security. The KPI metrics covered in the slide are asset type control, control issues by standard and regulation etc.Deliver and pitch your topic in the best possible manner with this KPI Dashboard To Monitor Cyber Security Performance Management Background PDF. Use them to share invaluable insights on Control Issue, Control Review, Review Effectiveness and impress your audience. This template can be altered and modified as per your expectations. So, grab it now.
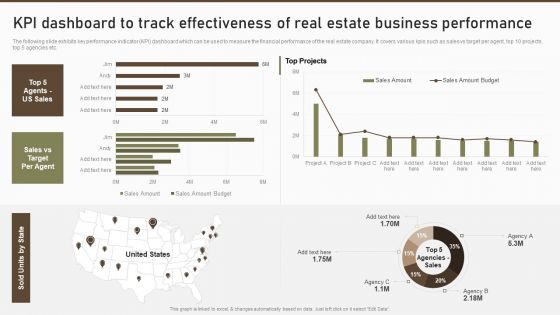
KPI Dashboard To Track Effectiveness Of Real Estate Business Performance Guidelines PDF
The following slide exhibits key performance indicator KPI dashboard which can be used to measure the financial performance of the real estate company. It covers various kpis such as sales vs target per agent, top 10 projects, top 5 agencies etc.Deliver an awe inspiring pitch with this creative KPI Dashboard To Track Effectiveness Of Real Estate Business Performance Guidelines PDF bundle. Topics like Top Projects, Sales Amount, Sales Amount can be discussed with this completely editable template. It is available for immediate download depending on the needs and requirements of the user.
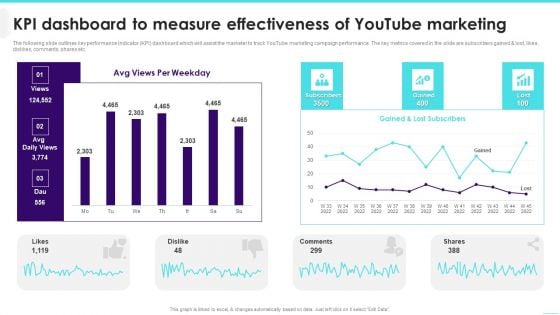
KPI Dashboard To Measure Effectiveness Of Youtube Marketing Inspiration PDF
The following slide outlines key performance indicator KPI dashboard which will assist the marketer to track YouTube marketing campaign performance. The key metrics covered in the slide are subscribers gained lost, likes, dislikes, comments, shares etc.Deliver an awe inspiring pitch with this creative KPI Dashboard To Measure Effectiveness Of Youtube Marketing Inspiration PDF bundle. Topics like Lost Subscribers, Comments, Per Weekday can be discussed with this completely editable template. It is available for immediate download depending on the needs and requirements of the user.
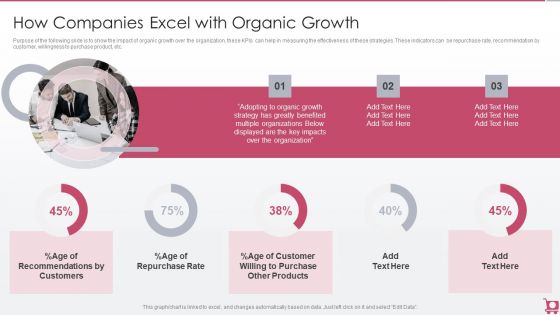
Playbook For Sales Growth Strategies How Companies Excel With Organic Growth Download PDF
Purpose of the following slide is to show the impact of organic growth over the organization, these KPIs can help in measuring the effectiveness of these strategies. These indicators can be repurchase rate, recommendation by customer, willingness to purchase product, etc. Deliver and pitch your topic in the best possible manner with this Playbook For Sales Growth Strategies How Companies Excel With Organic Growth Download PDF. Use them to share invaluable insights on Customers, Purchase Other Products, Organization and impress your audience. This template can be altered and modified as per your expectations. So, grab it now.
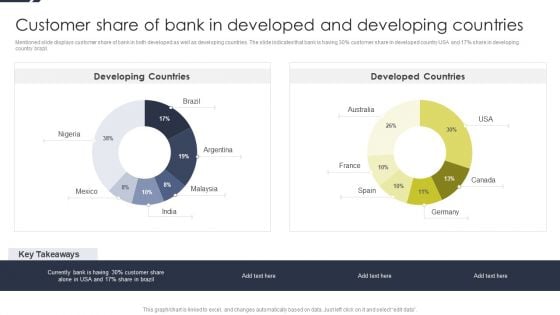
Customer Share Of Bank In Developed And Developing Countries Rules PDF
Mentioned slide displays customer share of bank in both developed as well as developing countries. The slide indicates that bank is having 30persent customer share in developed country USA and 17persent share in developing country brazil. Deliver an awe inspiring pitch with this creative Customer Share Of Bank In Developed And Developing Countries Rules PDF bundle. Topics like Developing Countries, Argentina, Malaysia can be discussed with this completely editable template. It is available for immediate download depending on the needs and requirements of the user.
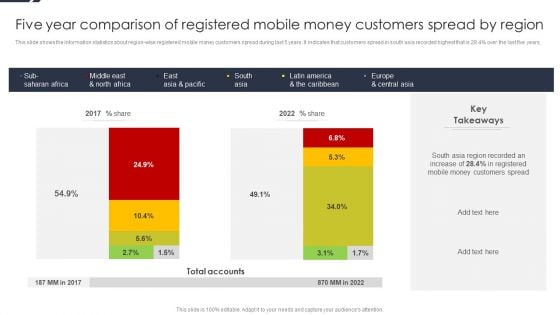
Five Year Comparison Of Registered Mobile Money Customers Spread By Region Introduction PDF
This slide shows the information statistics about region wise registered mobile money customers spread during last 5 years. It indicates that customers spread in south asia recorded highest that is 28.4persent over the last five years.Deliver and pitch your topic in the best possible manner with this Five Year Comparison Of Registered Mobile Money Customers Spread By Region Introduction PDF. Use them to share invaluable insights on Region Recorded, Mobile Money, Customers Spread and impress your audience. This template can be altered and modified as per your expectations. So, grab it now.

Healthcare Big Data Assessment Dashboard Slide2 Introduction PDF
This slide covers the records about the patients used to describe massive volumes of information created by the adoption of digital technologies that collect patients records and help in managing hospital performance. Showcasing this set of slides titled Healthcare Big Data Assessment Dashboard Slide2 Introduction PDF. The topics addressed in these templates are Forecasted Patient Turnover, Service Indicators, Occupancy. All the content presented in this PPT design is completely editable. Download it and make adjustments in color, background, font etc. as per your unique business setting.
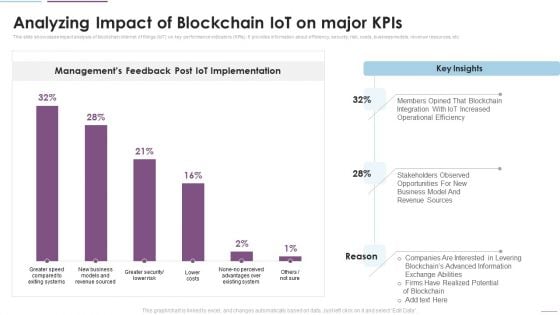
Supply Chain Management Analyzing Impact Of Blockchain Iot On Major Kpis Inspiration PDF
This slide showcases impact analysis of blockchain internet of things IoT on key performance indicators KPIs. It provides information about efficiency, security, risk, costs, business models, revenue resources, etc. Deliver an awe inspiring pitch with this creative Supply Chain Management Analyzing Impact Of Blockchain Iot On Major Kpis Inspiration PDF bundle. Topics like Managements Feedback, Post IoT Implementation, Opportunities For New can be discussed with this completely editable template. It is available for immediate download depending on the needs and requirements of the user.
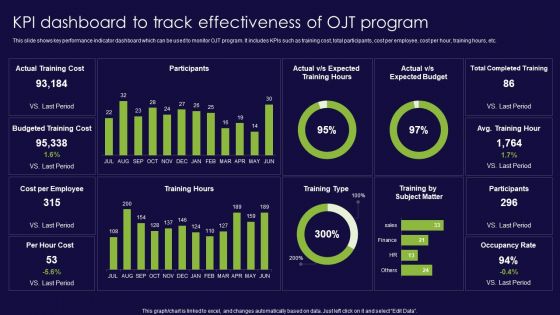
KPI Dashboard To Track Effectiveness Of OJT Program Ppt Gallery Sample PDF
This slide shows key performance indicator dashboard which can be used to monitor OJT program. It includes KPIs such as training cost, total participants, cost per employee, cost per hour, training hours, etc. Showcasing this set of slides titled KPI Dashboard To Track Effectiveness Of OJT Program Ppt Gallery Sample PDF. The topics addressed in these templates are Actual Training Cost, Budgeted Training Cost, Cost per Employee. All the content presented in this PPT design is completely editable. Download it and make adjustments in color, background, font etc. as per your unique business setting.
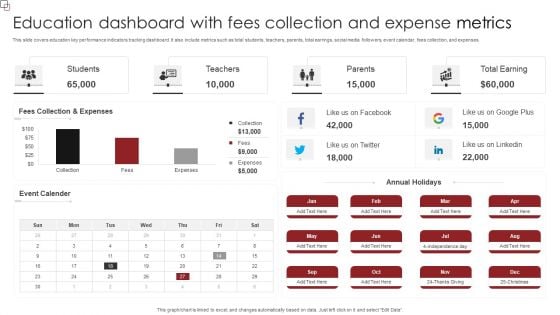
Education Dashboard With Fees Collection And Expense Metrics Demonstration PDF
This slide covers education key performance indicators tracking dashboard. It also include metrics such as total students, teachers, parents, total earrings, social media followers, event calendar, fees collection, and expenses. Showcasing this set of slides titled Education Dashboard With Fees Collection And Expense Metrics Demonstration PDF. The topics addressed in these templates are Event Calender, Annual Holidays, Fees Collection, Expenses. All the content presented in this PPT design is completely editable. Download it and make adjustments in color, background, font etc. as per your unique business setting.
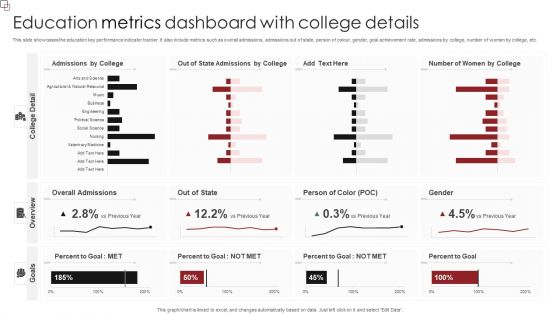
Education Metrics Dashboard With College Details Formats PDF
This slide showcases the education key performance indicator tracker. It also include metrics such as overall admissions, admissions out of state, person of colour, gender, goal achievement rate, admissions by college, number of women by college, etc. Pitch your topic with ease and precision using this Education Metrics Dashboard With College Details Formats PDF. This layout presents information on Overall Admissions, Person Of Color, Percent To Goal. It is also available for immediate download and adjustment. So, changes can be made in the color, design, graphics or any other component to create a unique layout.
Education Metrics Dashboard For Tracking Student Ethnicity And Specially Abled Characteristics Brochure PDF
This slide covers the education key performance indicator tracker. It include metrics such as total applications, conversion rate, offers year to date, applications by ethnicity and disabilities, etc. Showcasing this set of slides titled Education Metrics Dashboard For Tracking Student Ethnicity And Specially Abled Characteristics Brochure PDF. The topics addressed in these templates are Total Applications, Conversion Rate 2022, Ethnicity. All the content presented in this PPT design is completely editable. Download it and make adjustments in color, background, font etc. as per your unique business setting.
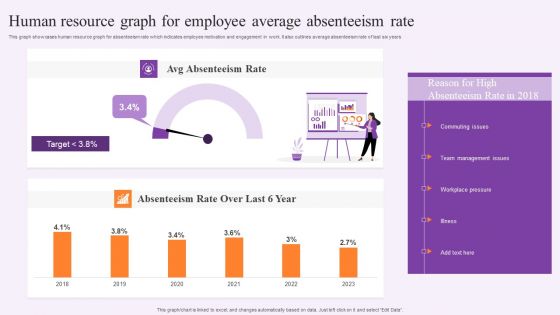
Human Resource Graph For Employee Average Absenteeism Rate Information PDF
This graph showcases human resource graph for absenteeism rate which indicates employee motivation and engagement in work. It also outlines average absenteeism rate of last six years. Showcasing this set of slides titled Human Resource Graph For Employee Average Absenteeism Rate Information PDF. The topics addressed in these templates are Team Management Issues, Workplace Pressure, Absenteeism Rate. All the content presented in this PPT design is completely editable. Download it and make adjustments in color, background, font etc. as per your unique business setting.
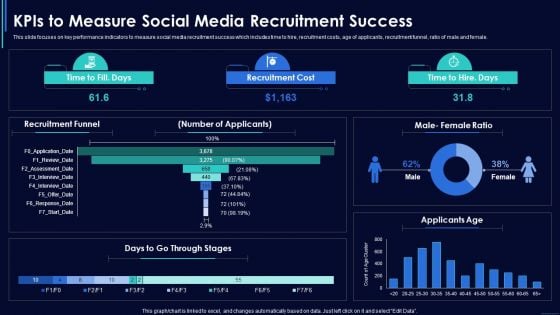
Social Media Hiring Strategic Procedure Kpis To Measure Social Media Recruitment Success Sample PDF
This slide focuses on key performance indicators to measure social media recruitment success which includes time to hire, recruitment costs, age of applicants, recruitment funnel, ratio of male and female. Deliver an awe inspiring pitch with this creative Social Media Hiring Strategic Procedure Kpis To Measure Social Media Recruitment Success Sample PDF bundle. Topics like Recruitment Funnel, Recruitment Cost, Female Ratio can be discussed with this completely editable template. It is available for immediate download depending on the needs and requirements of the user.
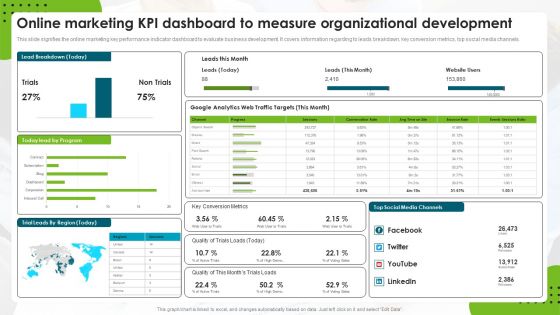
Online Marketing Kpi Dashboard To Measure Organizational Development Rules PDF
This slide signifies the online marketing key performance indicator dashboard to evaluate business development. It covers information regarding to leads breakdown, key conversion metrics, top social media channels. Pitch your topic with ease and precision using this Online Marketing Kpi Dashboard To Measure Organizational Development Rules PDF. This layout presents information on Web Traffic Targets, Google Analytics, Social Media Channels. It is also available for immediate download and adjustment. So, changes can be made in the color, design, graphics or any other component to create a unique layout.
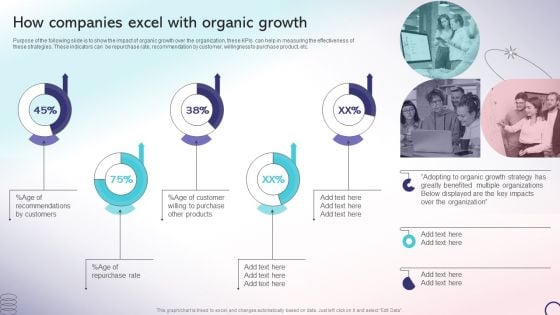
How Companies Excel With Organic Growth Strategic Playbook For Internal Sales Advancement Structure PDF
Purpose of the following slide is to show the impact of organic growth over the organization, these KPIs can help in measuring the effectiveness of these strategies. These indicators can be repurchase rate, recommendation by customer, willingness to purchase product, etc.Deliver an awe inspiring pitch with this creative How Companies Excel With Organic Growth Strategic Playbook For Internal Sales Advancement Structure PDF bundle. Topics like Recommendations, Greatly Benefited, Over Organization can be discussed with this completely editable template. It is available for immediate download depending on the needs and requirements of the user.
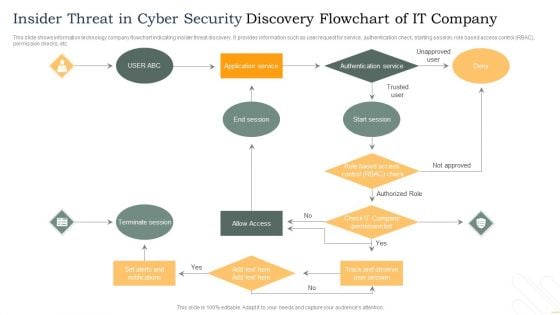
Insider Threat In Cyber Security Discovery Flowchart Of IT Company Template PDF
This slide shows information technology company flowchart indicating insider threat discovery. It provides information such as user request for service, authentication check, starting session, role based access control RBAC, permission checks, etc. Persuade your audience using this Insider Threat In Cyber Security Discovery Flowchart Of IT Company Template PDF. This PPT design covers one stages, thus making it a great tool to use. It also caters to a variety of topics including Terminate Session, Allow Access, Authentication Service. Download this PPT design now to present a convincing pitch that not only emphasizes the topic but also showcases your presentation skills.
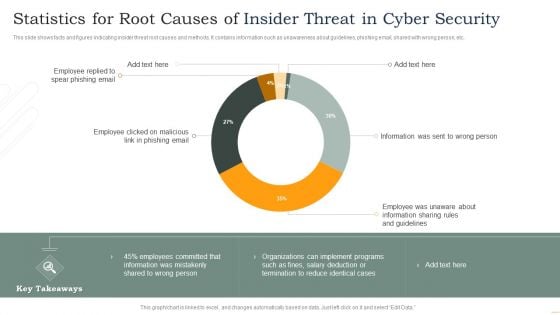
Statistics For Root Causes Of Insider Threat In Cyber Security Inspiration PDF
This slide shows facts and figures indicating insider threat root causes and methods. It contains information such as unawareness about guidelines, phishing email, shared with wrong person, etc. Showcasing this set of slides titled Statistics For Root Causes Of Insider Threat In Cyber Security Inspiration PDF. The topics addressed in these templates are Employee Replied, Spear Phishing Email, Employee Clicked, Phishing Email. All the content presented in this PPT design is completely editable. Download it and make adjustments in color, background, font etc. as per your unique business setting.
Tracking Channel Campaign Metrics To Measure Web Traffic Sample PDF
This slide covers measuring campaign key performance indicators through tracking channel web traffic which includes total visit, cost per click, engagement rate and total impressions. Pitch your topic with ease and precision using this Tracking Channel Campaign Metrics To Measure Web Traffic Sample PDF. This layout presents information on Revenue By Channel, Website Demographics, Product Sales Trend. It is also available for immediate download and adjustment. So, changes can be made in the color, design, graphics or any other component to create a unique layout.
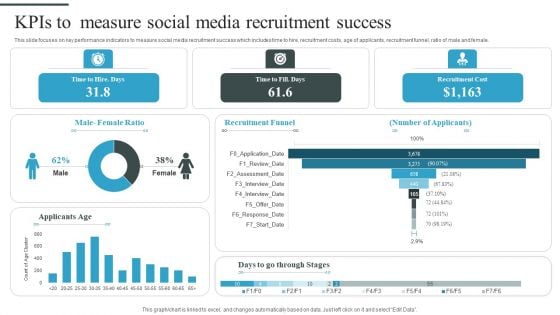
Tactical Process For Social Kpis To Measure Social Media Recruitment Success Demonstration PDF
This slide focuses on key performance indicators to measure social media recruitment success which includes time to hire, recruitment costs, age of applicants, recruitment funnel, ratio of male and female. Deliver an awe inspiring pitch with this creative Tactical Process For Social Kpis To Measure Social Media Recruitment Success Demonstration PDF bundle. Topics like Male Female Ratio, Recruitment Funnel, Number Applicants can be discussed with this completely editable template. It is available for immediate download depending on the needs and requirements of the user.
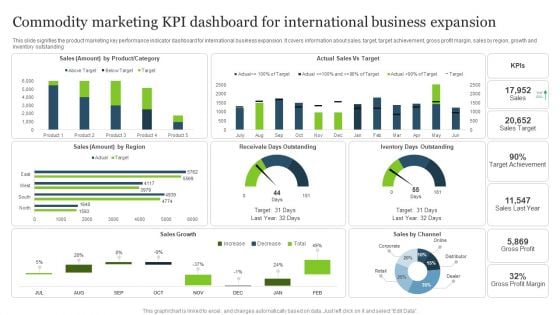
Commodity Marketing KPI Dashboard For International Business Expansion Formats PDF
This slide signifies the product marketing key performance indicator dashboard for international business expansion. It covers information about sales, target, target achievement, gross profit margin, sales by region, growth and inventory outstanding.Pitch your topic with ease and precision using this Commodity Marketing KPI Dashboard For International Business Expansion Formats PDF. This layout presents information on Target Achievement, Receivale Days, Gross Profit. It is also available for immediate download and adjustment. So, changes can be made in the color, design, graphics or any other component to create a unique layout.
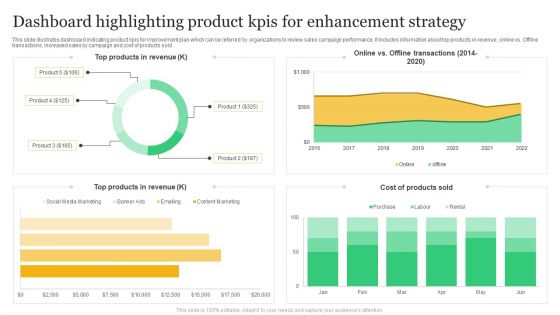
Dashboard Highlighting Product Kpis For Enhancement Strategy Structure PDF
This slide illustrates dashboard indicating product kpis for improvement plan which can be referred by organizations to review sales campaign performance. It includes information about top products in revenue, online vs. Offline transactions, increased sales by campaign and cost of products sold. Showcasing this set of slides titled Dashboard Highlighting Product Kpis For Enhancement Strategy Structure PDF. The topics addressed in these templates are Revenue, Products, Cost. All the content presented in this PPT design is completely editable. Download it and make adjustments in color, background, font etc. as per your unique business setting.
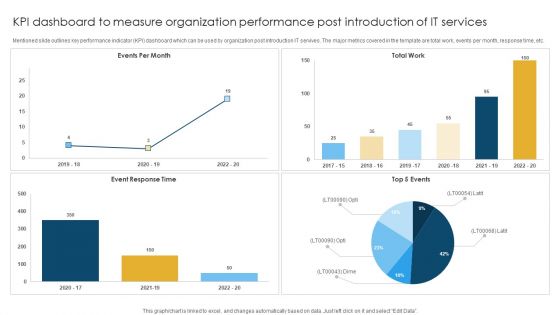
KPI Dashboard To Measure Organization Performance Post Introduction Of IT Services Rules PDF
Mentioned slide outlines key performance indicator KPI dashboard which can be used by organization post introduction IT servives. The major metrics covered in the template are total work, events per month, response time, etc. Showcasing this set of slides titled KPI Dashboard To Measure Organization Performance Post Introduction Of IT Services Rules PDF. The topics addressed in these templates are Event Response, Total Work, Events Per. All the content presented in this PPT design is completely editable. Download it and make adjustments in color, background, font etc. as per your unique business setting.
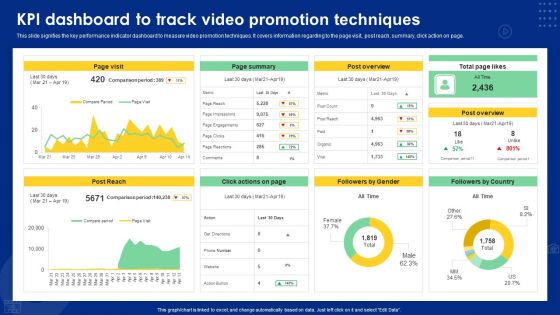
Kpi Dashboard To Track Video Promotion Techniques Ppt Summary Guide PDF
This slide signifies the key performance indicator dashboard to measure video promotion techniques. It covers information regarding to the page visit, post reach, summary, click action on page. Pitch your topic with ease and precision using this Kpi Dashboard To Track Video Promotion Techniques Ppt Summary Guide PDF. This layout presents information on Page Visit, Page Summary, Post Overview. It is also available for immediate download and adjustment. So, changes can be made in the color, design, graphics or any other component to create a unique layout.
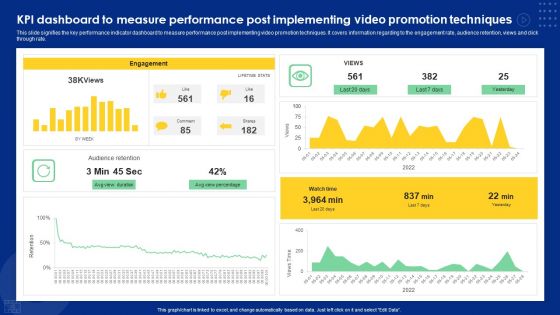
KPI Dashboard To Measure Performance Post Implementing Video Promotion Techniques Ideas PDF
This slide signifies the key performance indicator dashboard to measure performance post implementing video promotion techniques. It covers information regarding to the engagement rate, audience retention, views and click through rate. Pitch your topic with ease and precision using this KPI Dashboard To Measure Performance Post Implementing Video Promotion Techniques Ideas PDF. This layout presents information on Engagement, Audience Retention, Watch Time. It is also available for immediate download and adjustment. So, changes can be made in the color, design, graphics or any other component to create a unique layout.
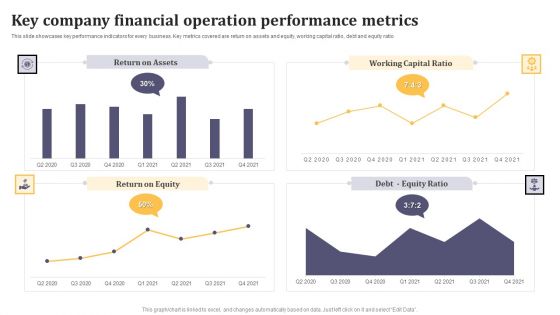
Key Company Financial Operation Performance Metrics Ppt Infographic Template Example Introduction PDF
This slide showcases key performance indicators for every business. Key metrics covered are return on assets and equity, working capital ratio, debt and equity ratio. Showcasing this set of slides titled Key Company Financial Operation Performance Metrics Ppt Infographic Template Example Introduction PDF. The topics addressed in these templates are Return on Assets, Working Capital Ratio, Return on Equity. All the content presented in this PPT design is completely editable. Download it and make adjustments in color, background, font etc. as per your unique business setting.
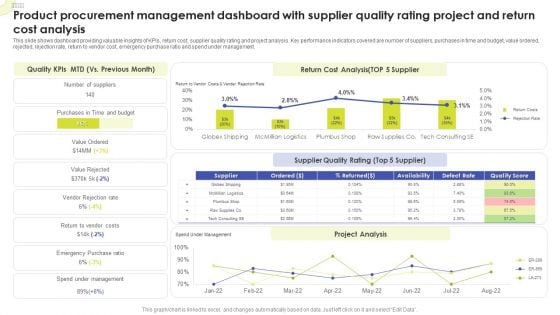
Product Procurement Management Dashboard With Supplier Quality Rating Project And Return Cost Analysis Sample PDF
This slide shows dashboard providing valuable insights of KPIs, return cost, supplier quality rating and project analysis. Key performance indicators covered are number of suppliers, purchases in time and budget, value ordered, rejected, rejection rate, return to vendor cost, emergency purchase ratio and spend under management. Pitch your topic with ease and precision using this Product Procurement Management Dashboard With Supplier Quality Rating Project And Return Cost Analysis Sample PDF. This layout presents information on Quality KPIs, Return Cost Analysis, Supplier Quality Rating. It is also available for immediate download and adjustment. So, changes can be made in the color, design, graphics or any other component to create a unique layout.
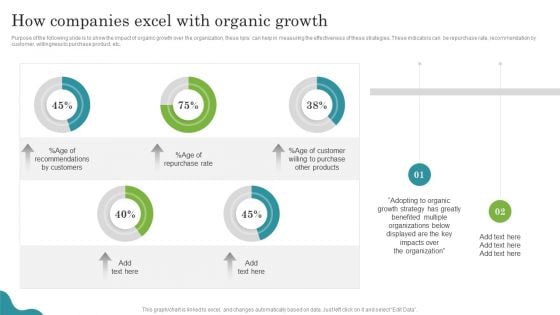
Promoting Growth Internal Operations Techniques Playbook How Companies Excel With Organic Growth Rules PDF
Purpose of the following slide is to show the impact of organic growth over the organization, these kpis can help in measuring the effectiveness of these strategies. These indicators can be repurchase rate, recommendation by customer, willingness to purchase product, etc. Deliver an awe inspiring pitch with this creative Promoting Growth Internal Operations Techniques Playbook How Companies Excel With Organic Growth Rules PDF bundle. Topics like Organizations, Growth Strategy, Purchase can be discussed with this completely editable template. It is available for immediate download depending on the needs and requirements of the user.
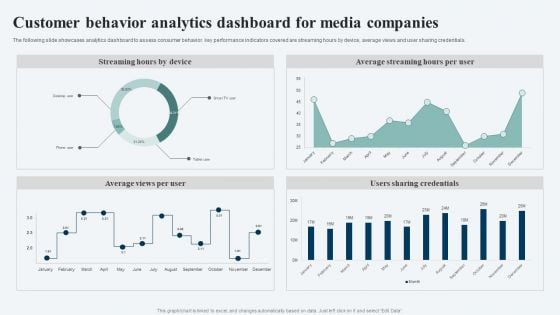
Customer Behavior Analytics Dashboard For Media Companies Ppt Ideas Visuals PDF
The following slide showcases analytics dashboard to assess consumer behavior. key performance indicators covered are streaming hours by device, average views and user sharing credentials. Showcasing this set of slides titled Customer Behavior Analytics Dashboard For Media Companies Ppt Ideas Visuals PDF. The topics addressed in these templates are Streaming Hours Device, Average Streaming Hours, Per User, Users Sharing Credentials. All the content presented in this PPT design is completely editable. Download it and make adjustments in color, background, font etc. as per your unique business setting.
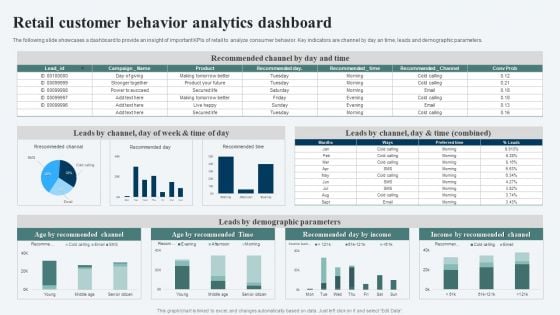
Retail Customer Behavior Analytics Dashboard Ppt Ideas Templates PDF
The following slide showcases a dashboard to provide an insight of important KPIs of retail to analyze consumer behavior. Key indicators are channel by day an time, leads and demographic parameters. Showcasing this set of slides titled Retail Customer Behavior Analytics Dashboard Ppt Ideas Templates PDF. The topics addressed in these templates are Recommended Channel, Leads Demographic Parameters, Income Recommended Channel. All the content presented in this PPT design is completely editable. Download it and make adjustments in color, background, font etc. as per your unique business setting.
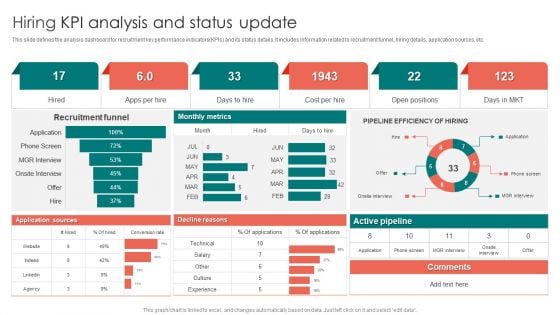
Hiring KPI Analysis And Status Update Ppt PowerPoint Presentation Gallery Show PDF
This slide defines the analysis dashboard for recruitment key performance indicators KPIs and its status details. It includes information related to recruitment funnel, hiring details, application sources, etc. Showcasing this set of slides titled Hiring KPI Analysis And Status Update Ppt PowerPoint Presentation Gallery Show PDF. The topics addressed in these templates are Recruitment Funnel, Monthly Metrics, Active Pipeline. All the content presented in this PPT design is completely editable. Download it and make adjustments in color, background, font etc. as per your unique business setting.
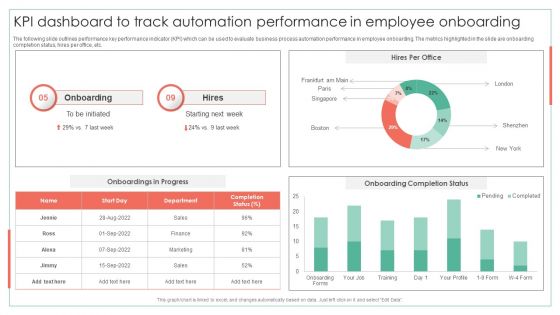
KPI Dashboard To Track Automation Performance In Employee Onboarding Achieving Operational Efficiency Download PDF
The following slide outlines performance key performance indicator KPI which can be used to evaluate business process automation performance in employee onboarding. The metrics highlighted in the slide are onboarding completion status, hires per office, etc.Deliver an awe inspiring pitch with this creative KPI Dashboard To Track Automation Performance In Employee Onboarding Achieving Operational Efficiency Download PDF bundle. Topics like Onboarding Completion, Onboarding, Onboarding Completion can be discussed with this completely editable template. It is available for immediate download depending on the needs and requirements of the user.
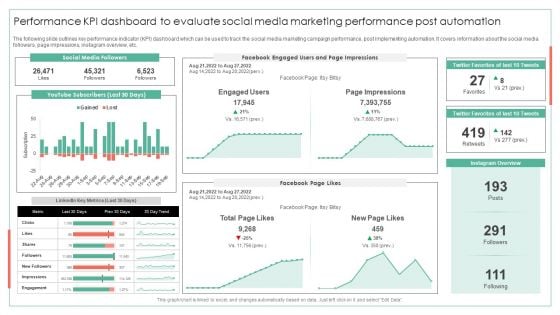
Performance KPI Dashboard To Evaluate Social Media Marketing Performance Post Automation Ideas PDF
The following slide outlines key performance indicator KPI dashboard which can be used to track the social media marketing campaign performance, post implementing automation. It covers information about the social media followers, page impressions, instagram overview, etc.Deliver an awe inspiring pitch with this creative Performance KPI Dashboard To Evaluate Social Media Marketing Performance Post Automation Ideas PDF bundle. Topics like Page Impressions, Twitter Favorites, Instagram Overview can be discussed with this completely editable template. It is available for immediate download depending on the needs and requirements of the user.
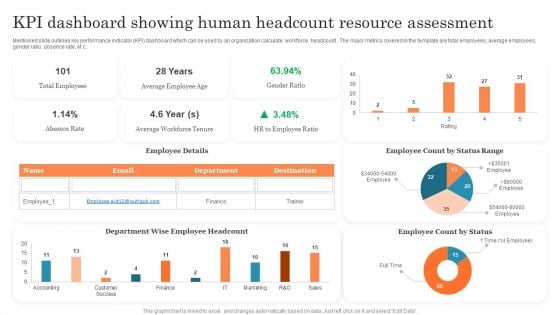
KPI Dashboard Showing Human Headcount Resource Assessment Ppt PowerPoint Presentation Outline PDF
Mentioned slide outlines key performance indicator KPI dashboard which can be used by an organization calculate workforce headcount . The major metrics covered in the template are total employees, average employees, gender ratio, absence rate, etc. Pitch your topic with ease and precision using this KPI Dashboard Showing Human Headcount Resource Assessment Ppt PowerPoint Presentation Outline PDF. This layout presents information on Total Employees, Average Employee, Employee Count. It is also available for immediate download and adjustment. So, changes can be made in the color, design, graphics or any other component to create a unique layout.

Health And Risk KPI Dashboard Ppt Pictures Designs Download PDF
The slide highlights the health and safety key performance indicator dashboard illustrating key headings which includes key objectives, inspections, total reports vs over due reports, injuries by body part and accident trends. Pitch your topic with ease and precision using this Health And Risk KPI Dashboard Ppt Pictures Designs Download PDF. This layout presents information on Key Objectives, Inspections, Accidents Trends. It is also available for immediate download and adjustment. So, changes can be made in the color, design, graphics or any other component to create a unique layout.
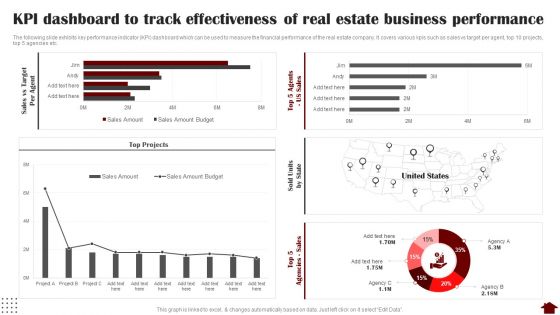
KPI Dashboard To Track Effectiveness Of Real Estate Business Performance Slides PDF
The following slide exhibits key performance indicator KPI dashboard which can be used to measure the financial performance of the real estate company. It covers various kpis such as sales vs target per agent, top 10 projects, top 5 agencies etc. Deliver an awe inspiring pitch with this creative KPI Dashboard To Track Effectiveness Of Real Estate Business Performance Slides PDF bundle. Topics like KPI Dashboard, Track Effectiveness, Real Estate Business Performance can be discussed with this completely editable template. It is available for immediate download depending on the needs and requirements of the user.
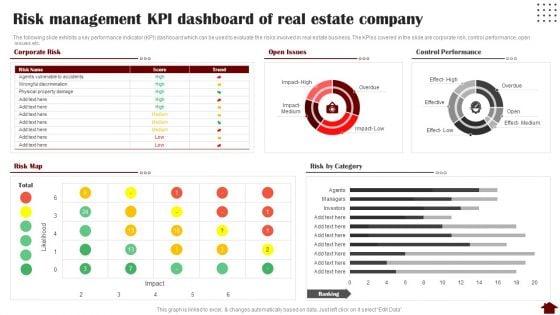
Risk Management KPI Dashboard Of Real Estate Company Rules PDF
The following slide exhibits a key performance indicator KPI dashboard which can be used to evaluate the risks involved in real estate business. The KPIss covered in the slide are corporate risk, control performance, open issues etc. Deliver and pitch your topic in the best possible manner with this Risk Management KPI Dashboard Of Real Estate Company Rules PDF. Use them to share invaluable insights on Risk Management KPI Dashboard, Real Estate Company and impress your audience. This template can be altered and modified as per your expectations. So, grab it now.

 Home
Home