Score Meter

Credit Score Meter Ppt PowerPoint Presentation Complete Deck With Slides
If designing a presentation takes a lot of your time and resources and you are looking for a better alternative, then this Credit Score Meter Ppt PowerPoint Presentation Complete Deck With Slides is the right fit for you. This is a prefabricated set that can help you deliver a great presentation on the topic. All the ten slides included in this sample template can be used to present a birds-eye view of the topic. These slides are also fully editable, giving you enough freedom to add specific details to make this layout more suited to your business setting. Apart from the content, all other elements like color, design, theme are also replaceable and editable. This helps in designing a variety of presentations with a single layout. Not only this, you can use this PPT design in formats like PDF, PNG, and JPG once downloaded. Therefore, without any further ado, download and utilize this sample presentation as per your liking.
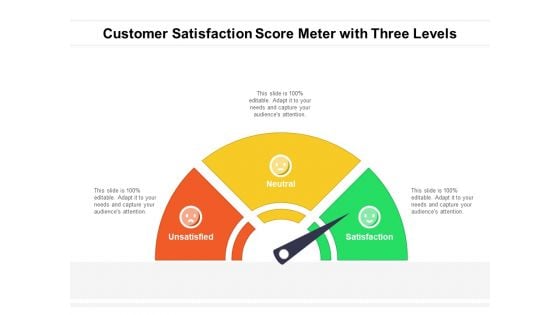
Customer Satisfaction Score Meter With Three Levels Ppt PowerPoint Presentation Gallery Smartart PDF
Presenting customer satisfaction score meter with three levels ppt powerpoint presentation gallery smartart pdf to dispense important information. This template comprises three stages. It also presents valuable insights into the topics including unsatisfied, neutral, satisfaction. This is a completely customizable PowerPoint theme that can be put to use immediately. So, download it and address the topic impactfully.
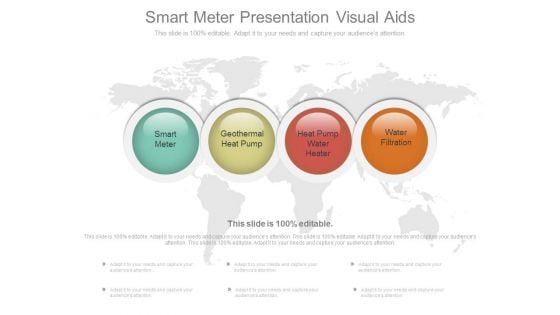
Smart Meter Presentation Visual Aids
This is a smart meter presentation visual aids. This is a four stage process. The stages in this process are smart meter, geothermal heat pump, heat pump water heater, water filtration.
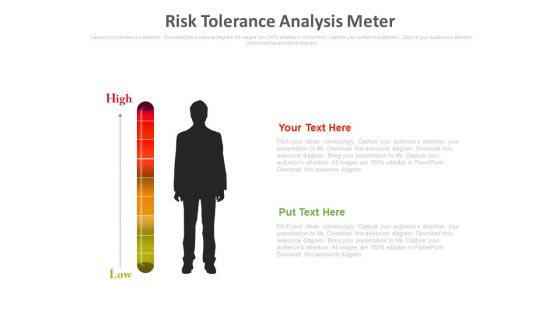
Risk Tolerance Analysis Meter Ppt Slides
This is a risk tolerance analysis meter ppt slides. This is a two stage process. The stages in this process are business, communication, technology.

Product Quality Check Meter Presentation Layouts
This is a product quality check meter presentation layouts. This is a five stage process. The stages in this process are bad, poor, average, good, excellent.
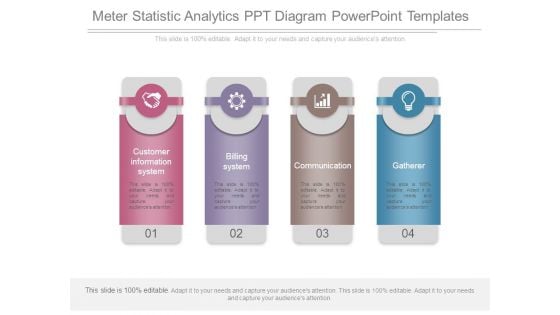
Meter Statistic Analytics Ppt Diagram Powerpoint Templates
This is a meter statistic analytics ppt diagram powerpoint templates. This is a four stage process. The stages in this process are customer information system, billing system, communication, gatherer.

Meter For Speed Control Powerpoint Templates
Our professionally designed business diagram is as an effective tool for communicating business ideas and strategies for corporate planning. It contains graphics of speed control meter. Above slide is suitable to display business options with technology.
Risk Meter Indicating Extreme Level Ppt PowerPoint Presentation Icon Template
This is a risk meter indicating extreme level ppt powerpoint presentation icon template. This is a five stage process. The stages in this process are risk meter, risk speedometer, hazard meter.
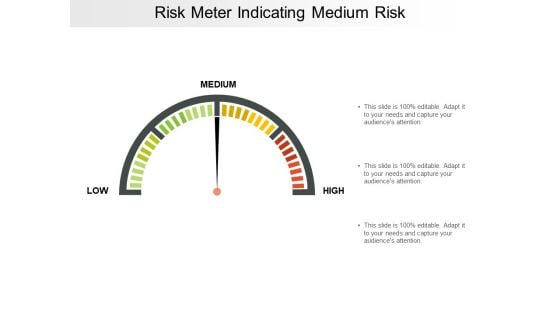
Risk Meter Indicating Medium Risk Ppt PowerPoint Presentation Ideas Graphics
This is a risk meter indicating medium risk ppt powerpoint presentation ideas graphics. This is a three stage process. The stages in this process are risk meter, risk speedometer, hazard meter.
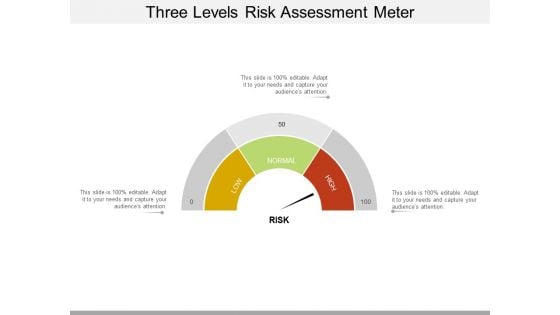
Three Levels Risk Assessment Meter Ppt PowerPoint Presentation Infographics Themes
This is a three levels risk assessment meter ppt powerpoint presentation infographics themes. This is a three stage process. The stages in this process are risk meter, risk speedometer, hazard meter.

Sales Team Performance Meter Ppt PowerPoint Presentation Diagrams
This is a sales team performance meter ppt powerpoint presentation diagrams. This is a five stage process. The stages in this process are business, meter, speed, time, sales.
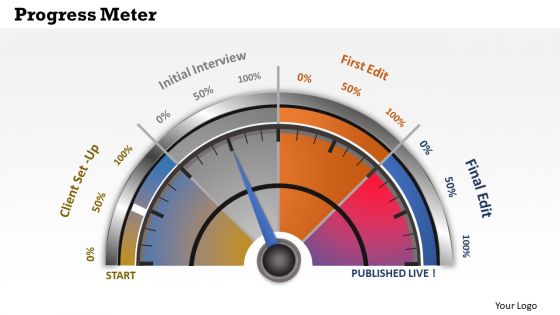
Consulting Diagram Business Dashboard Progress Meter Business Diagram
Be The Doer With Our Consulting Diagram Business Dashboard Progress Meter Business Diagram Powerpoint Templates. Put Your Thoughts Into Practice.
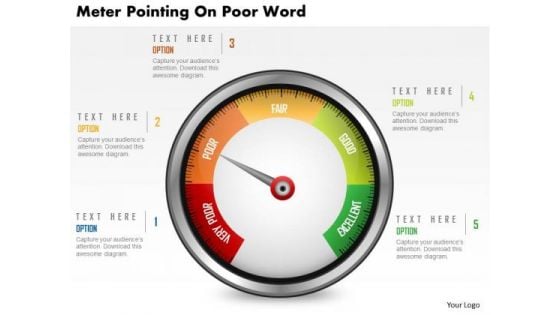
Business Diagram Meter Pointing On Poor Word Presentation Template
Graphic of meter has been used to design this power point template. This diagram contains the graphic of meter to display performance levels. Use this business diagram to make attractive presentations.
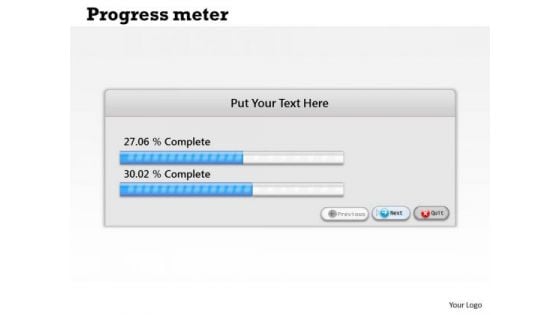
Strategic Management Progress Meter Dashboard Design Marketing Diagram
Be A Donor Of Great Ideas. Display Your Charity On Our Strategic Management Progress Meter Dashboard Design Marketing Diagram Powerpoint Templates.
Employee Work Performance Monitoring Meter Icon Background PDF
Showcasing this set of slides titled Employee Work Performance Monitoring Meter Icon Background PDF. The topics addressed in these templates are Monitoring Meter Icon, Employee Work Performance. All the content presented in this PPT design is completely editable. Download it and make adjustments in color, background, font etc. as per your unique business setting.
Meter Gauge Icon For Energy Consumption Statistics Diagrams PDF
Presenting Meter Gauge Icon For Energy Consumption Statistics Diagrams PDF to dispense important information. This template comprises three stages. It also presents valuable insights into the topics including Meter Gauge, Icon For Energy, Consumption Statistics. This is a completely customizable PowerPoint theme that can be put to use immediately. So, download it and address the topic impactfully.
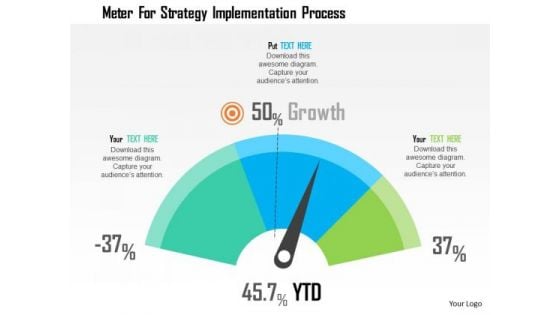
Business Diagram Meter For Strategy Implementation Process Presentation Template
This business diagram has been designed with graphic of meter displaying YTD growth. Use this slide to exhibit strategy implementation process. Use this slide for your business and marketing related presentations.

Product Quality Assurance Meter Ppt PowerPoint Presentation Slide Download
This is a product quality assurance meter ppt powerpoint presentation slide download. This is a five stage process. The stages in this process are bad, poor, average, good, excellent.
Accelerator Meter Speed Icon Ppt Powerpoint Presentation Professional Good
This is a accelerator meter speed icon ppt powerpoint presentation professional good. This is a three stage process. The stages in this process are accelerator, seed accelerators, startup accelerator.
Accelerator Speed Meter Icon Ppt Powerpoint Presentation Outline Layout
This is a accelerator speed meter icon ppt powerpoint presentation outline layout. This is a four stage process. The stages in this process are accelerator, seed accelerators, startup accelerator.
Speed Level Meter Icon Ppt Powerpoint Presentation Inspiration Slides
This is a speed level meter icon ppt powerpoint presentation inspiration slides. This is a four stage process. The stages in this process are accelerator, seed accelerators, startup accelerator.
Speed Meter Vector Icon Ppt Powerpoint Presentation Model Inspiration
This is a speed meter vector icon ppt powerpoint presentation model inspiration. This is a four stage process. The stages in this process are accelerator, seed accelerators, startup accelerator.
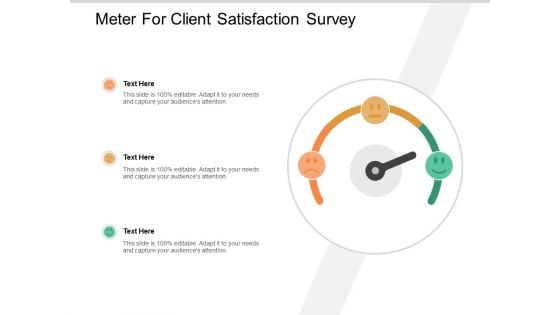
Meter For Client Satisfaction Survey Ppt PowerPoint Presentation Portfolio Outline
Presenting this set of slides with name meter for client satisfaction survey ppt powerpoint presentation portfolio outline. This is a three stage process. The stages in this process are product quality, product improvement, rating scale. This is a completely editable PowerPoint presentation and is available for immediate download. Download now and impress your audience.
Digits Meter Vector Icon Ppt Powerpoint Presentation Inspiration Portfolio
Presenting this set of slides with name digits meter vector icon ppt powerpoint presentation inspiration portfolio. The topics discussed in these slides are number icon, mathematical, number bar vector. This is a completely editable PowerPoint presentation and is available for immediate download. Download now and impress your audience.
Current Detecting Meter Vector Icon Ppt PowerPoint Presentation Introduction
Presenting this set of slides with name current detecting meter vector icon ppt powerpoint presentation introduction. The topics discussed in these slides are Marketing, Business, Management, Planning, Strategy. This is a completely editable PowerPoint presentation and is available for immediate download. Download now and impress your audience.
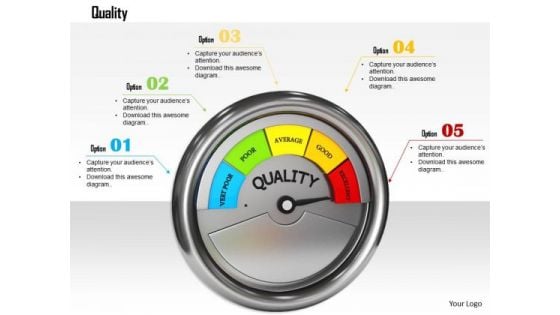
Stock Photo Meter Showing Excellent Level Of Quality PowerPoint Slide
This image is designed with 3d meter with business quality representation. Use this image in any business presentations to display various quality levels. This image is a powerful tool for business processes to exhibit quality and its levels along with its factors.
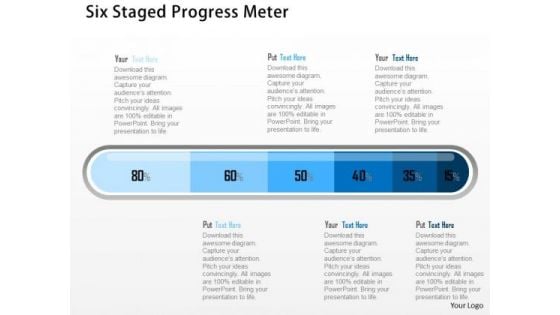
Business Diagram Six Staged Progress Meter Presentation Template
Our above business slide displays graphics of progress meter. This slide can be used as value chain example. This diagram provides an effective way of displaying information you can edit text, color, shade and style as per you need.

Consulting Slides Circular Meter Agenda Diagram Business Presentation
This circular process layout helps to describe the ordered set of steps required to complete a task. You can download this diagram to make awesome presentations in PowerPoint.
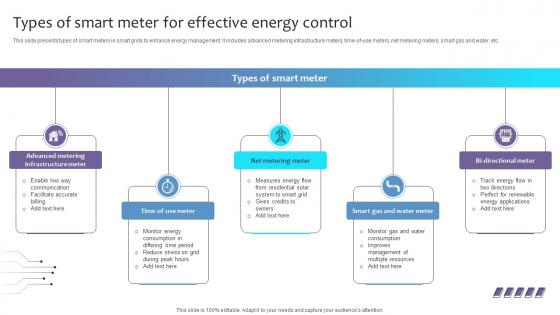
Empowering The Future Types Of Smart Meter For Effective Energy Control IoT SS V
This slide presents types of smart meters in smart grids to enhance energy management. It includes advanced metering infrastructure meters, time-of-use meters, net metering meters, smart gas and water, etc. Here you can discover an assortment of the finest PowerPoint and Google Slides templates. With these templates, you can create presentations for a variety of purposes while simultaneously providing your audience with an eye-catching visual experience. Download Empowering The Future Types Of Smart Meter For Effective Energy Control IoT SS V to deliver an impeccable presentation. These templates will make your job of preparing presentations much quicker, yet still, maintain a high level of quality. Slidegeeks has experienced researchers who prepare these templates and write high-quality content for you. Later on, you can personalize the content by editing the Empowering The Future Types Of Smart Meter For Effective Energy Control IoT SS V. This slide presents types of smart meters in smart grids to enhance energy management. It includes advanced metering infrastructure meters, time-of-use meters, net metering meters, smart gas and water, etc.
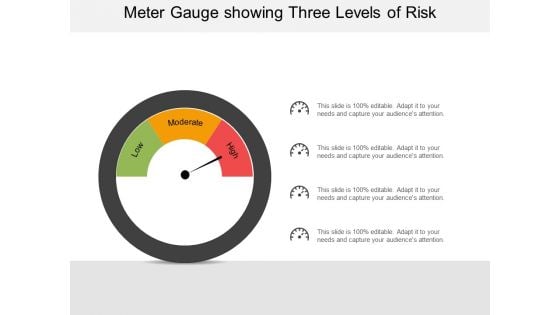
Meter Gauge Showing Three Levels Of Risk Ppt PowerPoint Presentation Pictures Graphics
This is a meter gauge showing three levels of risk ppt powerpoint presentation pictures graphics. This is a four stage process. The stages in this process are risk meter, risk speedometer, hazard meter.

Hazard Meter Showing Three Danger Levels Ppt PowerPoint Presentation Infographic Template Examples
This is a hazard meter showing three danger levels ppt powerpoint presentation infographic template examples. This is a five stage process. The stages in this process are risk meter, risk speedometer, hazard meter.
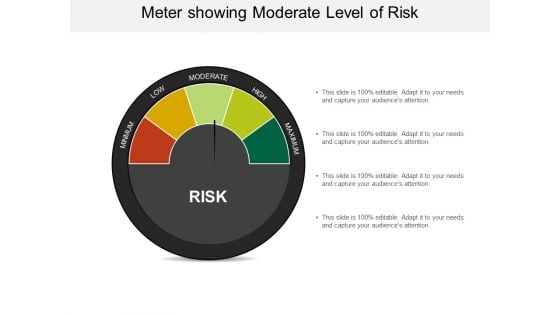
Meter Showing Moderate Level Of Risk Ppt PowerPoint Presentation Model Summary
This is a meter showing moderate level of risk ppt powerpoint presentation model summary. This is a four stage process. The stages in this process are risk meter, risk speedometer, hazard meter.
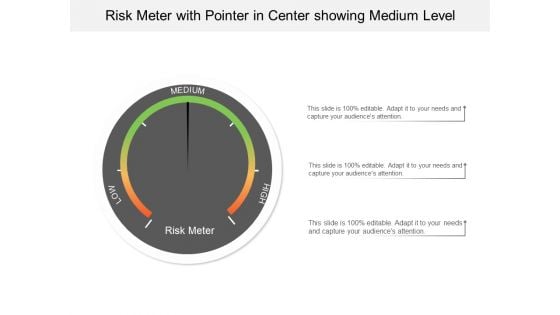
Risk Meter With Pointer In Center Showing Medium Level Ppt PowerPoint Presentation Portfolio Templates
This is a risk meter with pointer in center showing medium level ppt powerpoint presentation portfolio templates. This is a three stage process. The stages in this process are risk meter, risk speedometer, hazard meter.
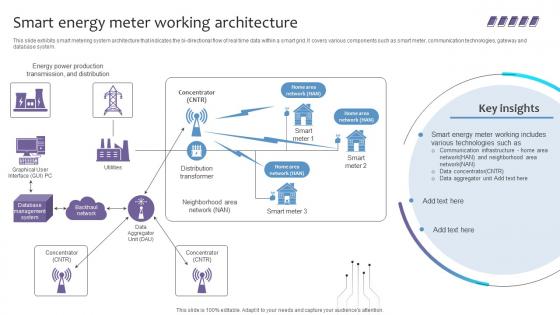
Empowering The Future Smart Energy Meter Working Architecture IoT SS V
This slide exhibits smart metering system architecture that indicates the bi-directional flow of real time data within a smart grid. It covers various components such as smart meter, communication technologies, gateway and database system. Make sure to capture your audiences attention in your business displays with our gratis customizable Empowering The Future Smart Energy Meter Working Architecture IoT SS V. These are great for business strategies, office conferences, capital raising or task suggestions. If you desire to acquire more customers for your tech business and ensure they stay satisfied, create your own sales presentation with these plain slides. This slide exhibits smart metering system architecture that indicates the bi-directional flow of real time data within a smart grid. It covers various components such as smart meter, communication technologies, gateway and database system.
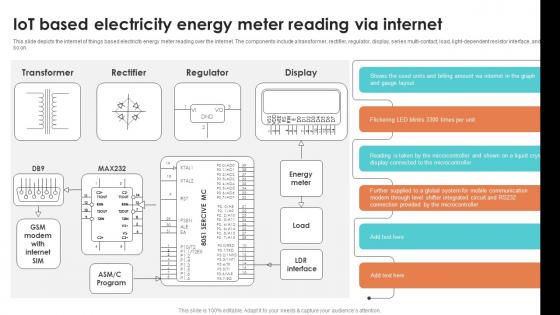
IoT Based Electricity Energy Meter Reading Via Internet Smart Grid Working
This slide depicts the internet of things based electricity energy meter reading over the internet. The components include a transformer, rectifier, regulator, display, series multi contact, load, light dependent resistor interface, and so on. Coming up with a presentation necessitates that the majority of the effort goes into the content and the message you intend to convey. The visuals of a PowerPoint presentation can only be effective if it supplements and supports the story that is being told. Keeping this in mind our experts created IoT Based Electricity Energy Meter Reading Via Internet Smart Grid Working to reduce the time that goes into designing the presentation. This way, you can concentrate on the message while our designers take care of providing you with the right template for the situation. This slide depicts the internet of things based electricity energy meter reading over the internet. The components include a transformer, rectifier, regulator, display, series multi contact, load, light dependent resistor interface, and so on.
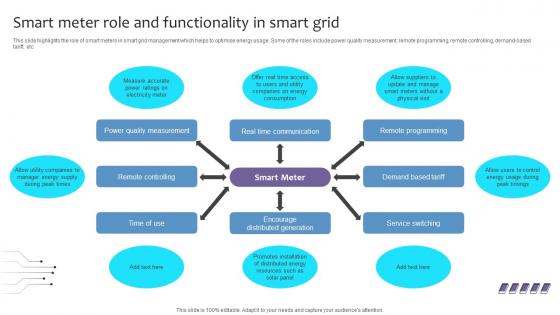
Empowering The Future Smart Meter Role And Functionality In Smart Grid IoT SS V
This slide highlights the role of smart meters in smart grid management which helps to optimise energy usage. Some of the roles include power quality measurement, remote programming, remote controlling, demand-based tariff, etc. This Empowering The Future Smart Meter Role And Functionality In Smart Grid IoT SS V is perfect for any presentation, be it in front of clients or colleagues. It is a versatile and stylish solution for organizing your meetings. The Empowering The Future Smart Meter Role And Functionality In Smart Grid IoT SS V features a modern design for your presentation meetings. The adjustable and customizable slides provide unlimited possibilities for acing up your presentation. Slidegeeks has done all the homework before launching the product for you. So, do not wait, grab the presentation templates today This slide highlights the role of smart meters in smart grid management which helps to optimise energy usage. Some of the roles include power quality measurement, remote programming, remote controlling, demand-based tariff, etc.
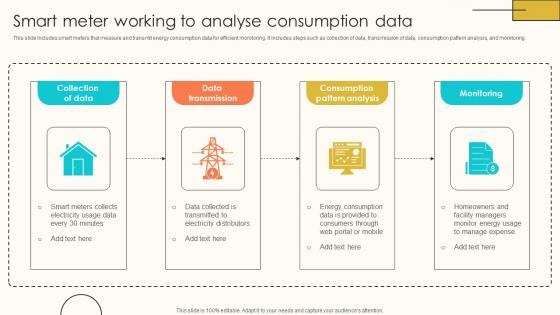
Smart Meter Working To Analyse Consumption Internet Of Things Solutions To Enhance Energy IoT SS V
This slide includes smart meters that measure and transmit energy consumption data for efficient monitoring. It includes steps such as collection of data, transmission of data, consumption pattern analysis, and monitoring. Slidegeeks has constructed Smart Meter Working To Analyse Consumption Internet Of Things Solutions To Enhance Energy IoT SS V after conducting extensive research and examination. These presentation templates are constantly being generated and modified based on user preferences and critiques from editors. Here, you will find the most attractive templates for a range of purposes while taking into account ratings and remarks from users regarding the content. This is an excellent jumping-off point to explore our content and will give new users an insight into our top-notch PowerPoint Templates. This slide includes smart meters that measure and transmit energy consumption data for efficient monitoring. It includes steps such as collection of data, transmission of data, consumption pattern analysis, and monitoring.

Empowering The Future Statistical Graph Showcasing Smart Meter Market Growth IoT SS V
This slide showcases information about the global market size of smart meters. It includes key reasons such as government initiatives to promote energy conversation, smart city initiatives, accurate billing process, etc. The Empowering The Future Statistical Graph Showcasing Smart Meter Market Growth IoT SS V is a compilation of the most recent design trends as a series of slides. It is suitable for any subject or industry presentation, containing attractive visuals and photo spots for businesses to clearly express their messages. This template contains a variety of slides for the user to input data, such as structures to contrast two elements, bullet points, and slides for written information. Slidegeeks is prepared to create an impression. This slide showcases information about the global market size of smart meters. It includes key reasons such as government initiatives to promote energy conversation, smart city initiatives, accurate billing process, etc.
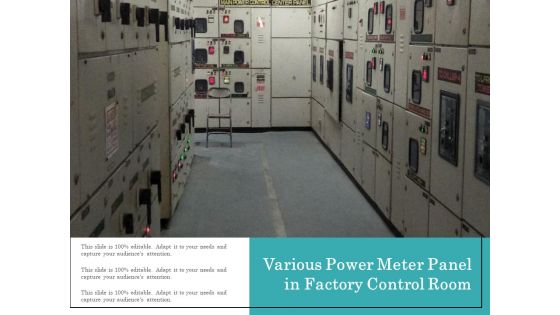
Various Power Meter Panel In Factory Control Room Ppt PowerPoint Presentation Gallery Smartart PDF
Pitch your topic with ease and precision using this various power meter panel in factory control room ppt powerpoint presentation gallery smartart pdf. This layout presents information on various power meter panel in factory control room. It is also available for immediate download and adjustment. So, changes can be made in the color, design, graphics or any other component to create a unique layout.
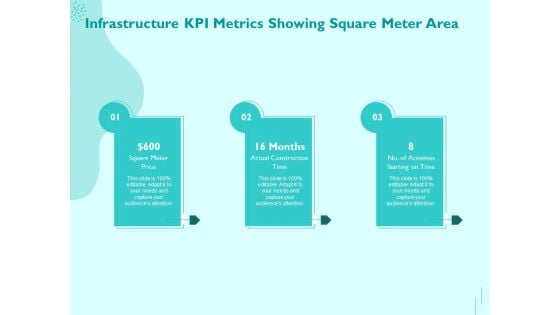
Managing IT Operating System Infrastructure KPI Metrics Showing Square Meter Area Infographics PDF
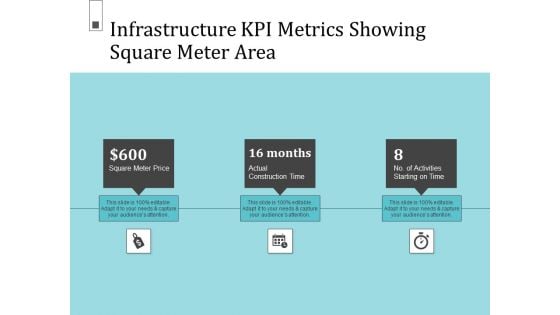
Presenting this set of slides with name managing it operating system infrastructure kpi metrics showing square meter area infographics pdf. This is a three stage process. The stages in this process are square meter price, actual construction time, no. of activities starting on time. This is a completely editable PowerPoint presentation and is available for immediate download. Download now and impress your audience.
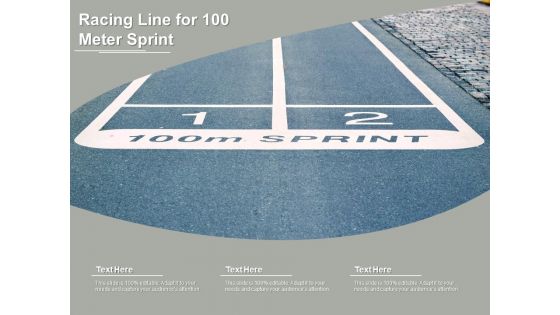
Racing Line For 100 Meter Sprint Ppt PowerPoint Presentation Gallery Picture PDF
Presenting this set of slides with name racing line for 100 meter sprint ppt powerpoint presentation gallery picture pdf. The topics discussed in these slide is racing line for 100 meter sprint. This is a completely editable PowerPoint presentation and is available for immediate download. Download now and impress your audience.
Circular Meter For Progress Status Vector Icon Ppt Inspiration Template PDF
Presenting circular meter for progress status vector icon ppt inspiration template pdf to dispense important information. This template comprises three stages. It also presents valuable insights into the topics including circular meter for progress status vector icon. This is a completely customizable PowerPoint theme that can be put to use immediately. So, download it and address the topic impactfully.
Client Satisfaction Level Meter Vector Icon Ppt PowerPoint Presentation Gallery Structure PDF
Presenting this set of slides with name client satisfaction level meter vector icon ppt powerpoint presentation gallery structure pdf. This is a three stage process. The stages in this process are client satisfaction level meter vector icon. This is a completely editable PowerPoint presentation and is available for immediate download. Download now and impress your audience.
Meter Showing High Risk Level Vector Icon Ppt PowerPoint Presentation Gallery Clipart PDF
Presenting this set of slides with name meter showing high risk level vector icon ppt powerpoint presentation gallery clipart pdf. This is a one stage process. The stage in this process is meter showing high risk level vector icon. This is a completely editable PowerPoint presentation and is available for immediate download. Download now and impress your audience.
Meter Performance Dashboard Vector Icon Ppt PowerPoint Presentation Gallery Backgrounds PDF
Presenting this set of slides with name meter performance dashboard vector icon ppt powerpoint presentation gallery backgrounds pdf. This is a three stage process. The stages in this process are meter performance dashboard vector icon. This is a completely editable PowerPoint presentation and is available for immediate download. Download now and impress your audience.
Production Department Efficiency Overview Meter Icon Ppt PowerPoint Presentation Ideas PDF
Presenting production department efficiency overview meter icon ppt powerpoint presentation ideas pdf to dispense important information. This template comprises three stages. It also presents valuable insights into the topics including production department efficiency overview meter icon. This is a completely customizable PowerPoint theme that can be put to use immediately. So, download it and address the topic impactfully.
Water Meter With Arrow Vector Icon Ppt PowerPoint Presentation Summary PDF
Presenting water meter with arrow vector icon ppt powerpoint presentation summary pdf to dispense important information. This template comprises three stages. It also presents valuable insights into the topics including water meter with arrow vector icon. This is a completely customizable PowerPoint theme that can be put to use immediately. So, download it and address the topic impactfully.

Facility Operations Contol Infrastructure Kpi Metrics Showing Square Meter Area Background PDF
Presenting this set of slides with name facility operations contol infrastructure kpi metrics showing square meter area background pdf. This is a three stage process. The stages in this process are square meter price, actual construction time, no. of activities starting on time . This is a completely editable PowerPoint presentation and is available for immediate download. Download now and impress your audience.
Construction Production Facilities Infrastructure KPI Metrics Showing Square Meter Area Rules PDF
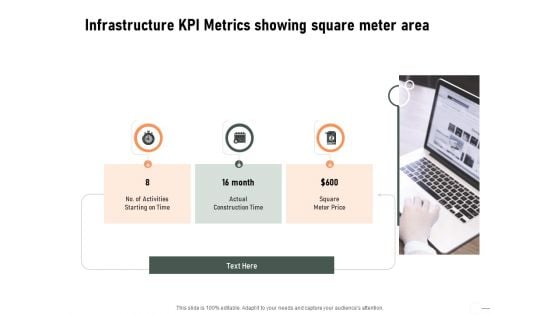
Presenting this set of slides with name construction production facilities infrastructure kpi metrics showing square meter area rules pdf. This is a three stage process. The stages in this process are square meter price, actual construction time, no. of activities starting on time . This is a completely editable PowerPoint presentation and is available for immediate download. Download now and impress your audience.
Electricity Meter With Gear Vector Icon Ppt PowerPoint Presentation File Icons PDF
Presenting this set of slides with name electricity meter with gear vector icon ppt powerpoint presentation file icons pdf. This is a three stage process. The stages in this process are electricity meter with gear vector icon. This is a completely editable PowerPoint presentation and is available for immediate download. Download now and impress your audience.
Performance Measuement Of Infrastructure Project Infrastructure KPI Metrics Showing Square Meter Area Download PDF
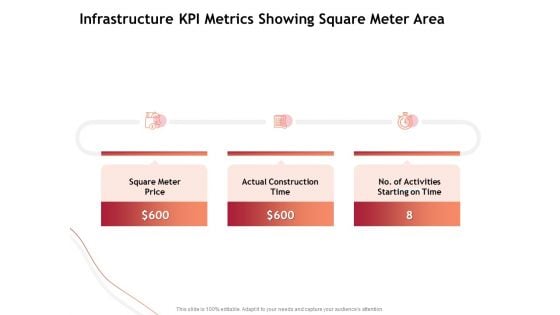
Presenting this set of slides with name performance measuement of infrastructure project infrastructure kpi metrics showing square meter area download pdf. This is a three stage process. The stages in this process are square meter price, actual construction time, number of activities starting on time. This is a completely editable PowerPoint presentation and is available for immediate download. Download now and impress your audience.
Functional Analysis Of Business Operations Infrastructure KPI Metrics Showing Square Meter Area Mockup PDF
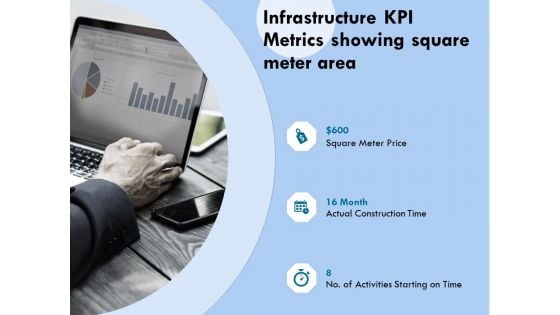
Presenting this set of slides with name functional analysis of business operations infrastructure kpi metrics showing square meter area mockup pdf. This is a three stage process. The stages in this process are square meter price, construction time, activities starting. This is a completely editable PowerPoint presentation and is available for immediate download. Download now and impress your audience.
Good Better Best Rating Meter With Icons Ppt Powerpoint Presentation Outline Vector
This is a good better best rating meter with icons ppt powerpoint presentation outline vector. This is a three stage process. The stages in this process are good better best, good great superb, good great excellent.
Facility Management Infrastructure KPI Metrics Showing Square Meter Area Ppt Inspiration Example PDF
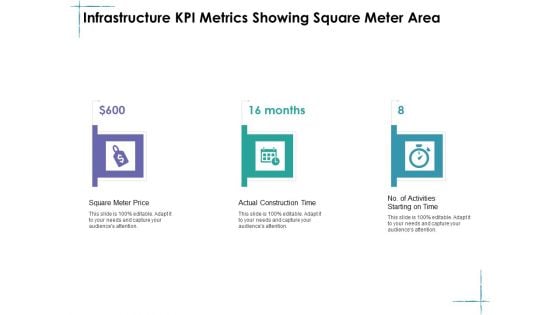
Presenting facility management infrastructure kpi metrics showing square meter area ppt inspiration example pdf to provide visual cues and insights. Share and navigate important information on three stages that need your due attention. This template can be used to pitch topics like square meter price, actual construction time, no of activities starting on time. In addtion, this PPT design contains high resolution images, graphics, etc, that are easily editable and available for immediate download.
Infrastructure Project Management In Construction Infrastructure KPI Metrics Showing Square Meter Area Portrait PDF
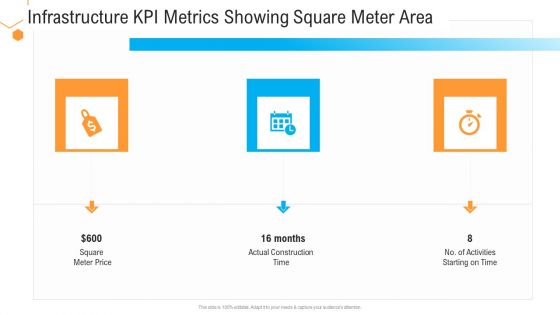
Presenting infrastructure project management in construction infrastructure kpi metrics showing square meter area portrait pdf. to provide visual cues and insights. Share and navigate important information on three stages that need your due attention. This template can be used to pitch topics like Square Meter Price, Actual Construction Time. In addtion, this PPT design contains high resolution images, graphics, etc, that are easily editable and available for immediate download.
Civil Infrastructure Designing Services Management Infrastructure Kpi Metrics Showing Square Meter Area Slides PDF
Presenting civil infrastructure designing services management infrastructure kpi metrics showing square meter area slides pdf to provide visual cues and insights. Share and navigate important information on three stages that need your due attention. This template can be used to pitch topics like infrastructure kpi metrics showing square meter area. In addtion, this PPT design contains high resolution images, graphics, etc, that are easily editable and available for immediate download.
Support Services Management Infrastructure KPI Metrics Showing Square Meter Area Ideas PDF
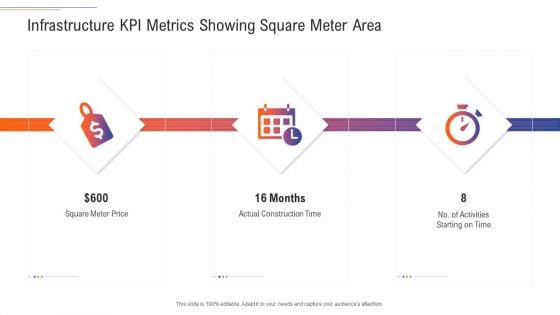
Presenting support services management infrastructure kpi metrics showing square meter area ideas pdf to provide visual cues and insights. Share and navigate important information on three stages that need your due attention. This template can be used to pitch topics like square meter price, actual construction time, no of activities starting on time. In addtion, this PPT design contains high resolution images, graphics, etc, that are easily editable and available for immediate download.
IT And Cloud Facilities Management Infrastructure KPI Metrics Showing Square Meter Area Designs PDF
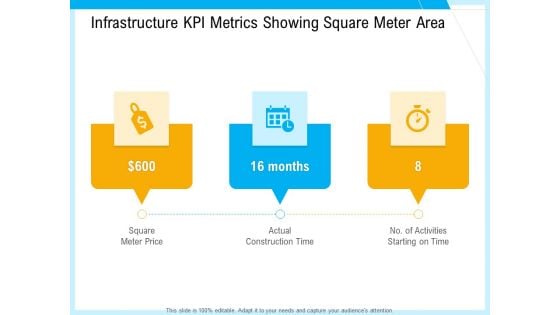
Presenting it and cloud facilities management infrastructure kpi metrics showing square meter area designs pdf to provide visual cues and insights. Share and navigate important information on three stages that need your due attention. This template can be used to pitch topics like square meter, price actual, construction time, activities starting time. In addition, this PPT design contains high-resolution images, graphics, etc, that are easily editable and available for immediate download.

Information Technology Functions Management Infrastructure KPI Metrics Showing Square Meter Area Summary PDF
Presenting information technology functions management infrastructure kpi metrics showing square meter area summary pdf to provide visual cues and insights. Share and navigate important information on three stages that need your due attention. This template can be used to pitch topics like square meter price, actual construction time, no activities starting time. In addition, this PPT design contains high-resolution images, graphics, etc, that are easily editable and available for immediate download.
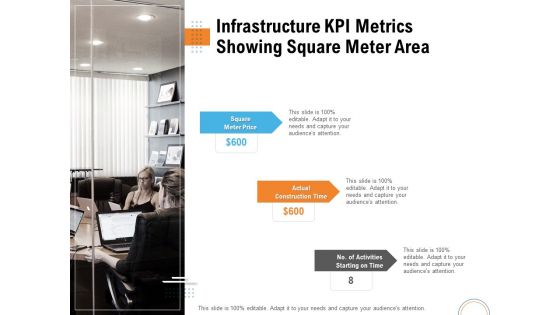
Utilizing Infrastructure Management Using Latest Methods Infrastructure KPI Metrics Showing Square Meter Area Summary PDF
Presenting utilizing infrastructure management using latest methods infrastructure kpi metrics showing square meter area summary pdf to provide visual cues and insights. Share and navigate important information on three stages that need your due attention. This template can be used to pitch topics like square meter price, actual construction time, no activities starting time. In addition, this PPT design contains high-resolution images, graphics, etc, that are easily editable and available for immediate download.


 Continue with Email

 Home
Home


