Meter Icon
KPI Framework For Quality Assurance Management Ppt PowerPoint Presentation File Icons PDF
This slide illustrates multiple key performance indicator framework for quality assurance management such as customer complaints, scrap rate, defects and yield. Quality assurance department plays a critical role in maintaining the superior quality of products. Pitch your topic with ease and precision using this kpi framework for quality assurance management ppt powerpoint presentation file icons pdf This layout presents information on kpi framework for quality assurance management . It is also available for immediate download and adjustment. So, changes can be made in the color, design, graphics or any other component to create a unique layout.
Health And Fitness Playbook Healthy Eating Meal Plan For Weight Management Icons PDF
Following slide displays health food indicator that can be used by employees for developing healthy eating habits. It also includes daily meal plan that will assist employees in successfully managing their body weight. Deliver an awe inspiring pitch with this creative health and fitness playbook healthy eating meal plan for weight management icons pdf bundle. Topics like healthy eating meal plan, weight management can be discussed with this completely editable template. It is available for immediate download depending on the needs and requirements of the user.
Kaizen Process Report With Improvement Metrics Ppt PowerPoint Presentation File Icons PDF
This slide focuses on the kaizen event report which covers process owner, key performance indicators, summary, problem description, improvement metrics, goals, daily milestones, team members and other considerations, etc. Pitch your topic with ease and precision using this Kaizen Process Report With Improvement Metrics Ppt PowerPoint Presentation File Icons PDF. This layout presents information on Key Performance Indoctrinator, Improvement Goal, Improvement Metric. It is also available for immediate download and adjustment. So, changes can be made in the color, design, graphics or any other component to create a unique layout.
Types Of Corporate Communication Techniques Kpis To Measure Communication Success Icons PDF
This template covers key performance indicator that can be utilized by the organization to measure their communication strategy performance. It includes various KPIs such as employee engagement rate, employee feedback, adoption rate etc. Presenting Types Of Corporate Communication Techniques Kpis To Measure Communication Success Icons PDF to provide visual cues and insights. Share and navigate important information on ten stages that need your due attention. This template can be used to pitch topics like Customer Satisfaction Rates, Employee Advocacy, Organization. In addtion, this PPT design contains high resolution images, graphics, etc, that are easily editable and available for immediate download.
KPIs And Metrics To Measure Pharmaceutical Drug Of Pharmaceutical Company Icons PDF
Mentioned slide showcases various key performance indicators KPIs which can be used to measure the development of pharmaceutical companies in different years. The key metrics are productivity, competency, quality of care and financial. Showcasing this set of slides titled KPIs And Metrics To Measure Pharmaceutical Drug Of Pharmaceutical Company Icons PDF. The topics addressed in these templates are Productivity, Competency, Quality Of Care. All the content presented in this PPT design is completely editable. Download it and make adjustments in color, background, font etc. as per your unique business setting.
Analyzing And Deploying Effective CMS Impact Of Ecommerce Management System Post Implementation Icons PDF
This slide represents the key performance indicators to measure the impact of ecommerce management system on ecommerce business operations. It includes KPIs to such as average order value, gross profit, conversion rate, shopping cart abandonment rate, shopping cart conversion rate etc. Make sure to capture your audiences attention in your business displays with our gratis customizable Analyzing And Deploying Effective CMS Impact Of Ecommerce Management System Post Implementation Icons PDF. These are great for business strategies, office conferences, capital raising or task suggestions. If you desire to acquire more customers for your tech business and ensure they stay satisfied, create your own sales presentation with these plain slides.
Advertising New Commodities Through Affect Of Extension Strategies On Brands Icons PDF
This slide showcases affect of key extension strategies on major key performance indicators KPI and market insights. It provides details about lifetime value, audience share, customer retention rate, customer engagement, online promotion, etc. Find a pre-designed and impeccable Advertising New Commodities Through Affect Of Extension Strategies On Brands Icons PDF. The templates can ace your presentation without additional effort. You can download these easy-to-edit presentation templates to make your presentation stand out from others. So, what are you waiting for Download the template from Slidegeeks today and give a unique touch to your presentation.
Implementing Cybersecurity Awareness Program To Prevent Attacks Measuring Security Awareness Campaign Icons PDF
The purpose of this slide is to showcase various key performance indicator KPIs which can assist the company to effectively track cyber security awareness campaign results. The KPIs are phishing rate, self-reported incidents, security breaches, cost of security breach and campaign participation rate. The best PPT templates are a great way to save time, energy, and resources. Slidegeeks have 100 percent editable powerpoint slides making them incredibly versatile. With these quality presentation templates, you can create a captivating and memorable presentation by combining visually appealing slides and effectively communicating your message. Download Implementing Cybersecurity Awareness Program To Prevent Attacks Measuring Security Awareness Campaign Icons PDF from Slidegeeks and deliver a wonderful presentation.
Steps To Effectively Conduct Market Research Measuring Brand Awareness Through Social Media Platforms Icons PDF
The following slide outlines various key performance indicators KPIs through which marketers can evaluate brand awareness on social media channels such as Facebook, Instagram, LinkedIn, Twitter, and YouTube. The metrics mentioned are brand impressions, reach, engagement rate, followers growth, story views, etc. Find a pre designed and impeccable Steps To Effectively Conduct Market Research Measuring Brand Awareness Through Social Media Platforms Icons PDF. The templates can ace your presentation without additional effort. You can download these easy to edit presentation templates to make your presentation stand out from others. So, what are you waiting for Download the template from Slidegeeks today and give a unique touch to your presentation.
Steps To Effectively Conduct Market Research Product Launch Campaign To Capture New Customers Icons PDF
The following slide outlines overview of product launch campaign through which firms can successfully acquire new clients and increase sales. Information covered in this slide is related to product and campaign details, target audience, techniques, and key performance indicators KPIs. There are so many reasons you need a Steps To Effectively Conduct Market Research Product Launch Campaign To Capture New Customers Icons PDF. The first reason is you cannot spend time making everything from scratch, Thus, Slidegeeks has made presentation templates for you too. You can easily download these templates from our website easily.
Understanding Cost Management And Optimization Levers Guide To Corporate Financial Growth Plan Icons Pdf
This slide provides glimpse about need and key indicators of cost management that helps our business to increase business efficiency and relevance. It includes cost management levers, levels of strategic cost optimization, etc.Do you have to make sure that everyone on your team knows about any specific topic I yes, then you should give Understanding Cost Management And Optimization Levers Guide To Corporate Financial Growth Plan Icons Pdf a try. Our experts have put a lot of knowledge and effort into creating this impeccable Understanding Cost Management And Optimization Levers Guide To Corporate Financial Growth Plan Icons Pdf. You can use this template for your upcoming presentations, as the slides are perfect to represent even the tiniest detail. You can download these templates from the Slidegeeks website and these are easy to edit. So grab these today. This slide provides glimpse about need and key indicators of cost management that helps our business to increase business efficiency and relevance. It includes cost management levers, levels of strategic cost optimization, etc.
Global Islamic Finance Industry Analysis A Detailed Knowledge Of Islamic Finance Icons Pdf
This slide consists of a dashboard used for analyzing Islamic finance development from 2014 to 2020. It includes key performance indicators such as asset growth, components of Islamic finance, and asset distribution. Coming up with a presentation necessitates that the majority of the effort goes into the content and the message you intend to convey. The visuals of a PowerPoint presentation can only be effective if it supplements and supports the story that is being told. Keeping this in mind our experts created Global Islamic Finance Industry Analysis A Detailed Knowledge Of Islamic Finance Icons Pdf to reduce the time that goes into designing the presentation. This way, you can concentrate on the message while our designers take care of providing you with the right template for the situation. This slide consists of a dashboard used for analyzing Islamic finance development from 2014 to 2020. It includes key performance indicators such as asset growth, components of Islamic finance, and asset distribution.
Strategic Guide To Attract Viral Marketing Campaign Plan With Kpi Assessment Icons Pdf
The following slide shows viral marketing campaign plan with KPI analysis. It provides details about buzz, online, offline, word of mouth, team, goals, budget, call-to-action, key performance indicators, fear of missing out FOMO, etc. Find a pre-designed and impeccable Strategic Guide To Attract Viral Marketing Campaign Plan With Kpi Assessment Icons Pdf. The templates can ace your presentation without additional effort. You can download these easy-to-edit presentation templates to make your presentation stand out from others. So, what are you waiting for Download the template from Slidegeeks today and give a unique touch to your presentation. The following slide shows viral marketing campaign plan with KPI analysis. It provides details about buzz, online, offline, word of mouth, team, goals, budget, call-to-action, key performance indicators, fear of missing out FOMO, etc.
Brand Improvement Techniques To Build Consumer Loyalty Evaluating The Impact Of Marketing Strategies Icons PDF
The following slide outlines a comprehensive line chart indicating the market share of our company and the most successful competitor. Information covered in this slide is related to four quarters. Retrieve professionally designed Brand Improvement Techniques To Build Consumer Loyalty Evaluating The Impact Of Marketing Strategies Icons PDF to effectively convey your message and captivate your listeners. Save time by selecting pre made slideshows that are appropriate for various topics, from business to educational purposes. These themes come in many different styles, from creative to corporate, and all of them are easily adjustable and can be edited quickly. Access them as PowerPoint templates or as Google Slides themes. You do not have to go on a hunt for the perfect presentation because Slidegeeks got you covered from everywhere.
Adopting Flexible Work Policy KPI Metrics To Measure Success Of Flexible Icons PDF
The following slide showcases different key performance indicators KPIs that can be used by managers to analyze the success rate of flexible work policy. Employee retention rate, absenteeism, workplace diversity, employee productivity and employee engagement are the key metrics which are mentioned in the slide. Welcome to our selection of the Adopting Flexible Work Policy KPI Metrics To Measure Success Of Flexible Icons PDF. These are designed to help you showcase your creativity and bring your sphere to life. Planning and Innovation are essential for any business that is just starting out. This collection contains the designs that you need for your everyday presentations. All of our PowerPoints are 100 percent editable, so you can customize them to suit your needs. This multi-purpose template can be used in various situations. Grab these presentation templates today.
Comprehensive Market Research Guide Measuring Brand Awareness Through Social Media Icons PDF
The following slide outlines various key performance indicators KPIs through which marketers can evaluate brand awareness on social media channels such as Facebook, Instagram, LinkedIn, Twitter, and YouTube. The metrics mentioned are brand impressions, reach, engagement rate, followers growth, story views, etc. Slidegeeks is one of the best resources for PowerPoint templates. You can download easily and regulate Comprehensive Market Research Guide Measuring Brand Awareness Through Social Media Icons PDF for your personal presentations from our wonderful collection. A few clicks is all it takes to discover and get the most relevant and appropriate templates. Use our Templates to add a unique zing and appeal to your presentation and meetings. All the slides are easy to edit and you can use them even for advertisement purposes.
Workforce Productivity Improvement Impact Of Company Wellness Programs On Employees Icons Pdf
The slide shows that company wellness programs has increased employees productivity, reduced absenteeism rate, reduced company health care cost, and increased retention rate. These are important indicators of employees satisfaction with the company and its culture. This Workforce Productivity Improvement Impact Of Company Wellness Programs On Employees Icons Pdf from Slidegeeks makes it easy to present information on your topic with precision. It provides customization options, so you can make changes to the colors, design, graphics, or any other component to create a unique layout. It is also available for immediate download, so you can begin using it right away. Slidegeeks has done good research to ensure that you have everything you need to make your presentation stand out. Make a name out there for a brilliant performance. The slide shows that company wellness programs has increased employees productivity, reduced absenteeism rate, reduced company health care cost, and increased retention rate. These are important indicators of employees satisfaction with the company and its culture.
Key Metrics To Measure Success Digital Marketing Strategies Improve Enterprise Sales Icons Pdf
The following slide showcases key performance indicators KPIs through which marketers can evaluate the effectiveness of marketing tactics. The KPIs covered in the slide are website traffic, brand impressions, annual contract value, new leads in pipeline, gross profit, net profit, market share, attrition rate, and monthly active users. Do you know about Slidesgeeks Key Metrics To Measure Success Digital Marketing Strategies Improve Enterprise Sales Icons Pdf These are perfect for delivering any kind od presentation. Using it, create PowerPoint presentations that communicate your ideas and engage audiences. Save time and effort by using our pre designed presentation templates that are perfect for a wide range of topic. Our vast selection of designs covers a range of styles, from creative to business, and are all highly customizable and easy to edit. Download as a PowerPoint template or use them as Google Slides themes. The following slide showcases key performance indicators KPIs through which marketers can evaluate the effectiveness of marketing tactics. The KPIs covered in the slide are website traffic, brand impressions, annual contract value, new leads in pipeline, gross profit, net profit, market share, attrition rate, and monthly active users.
Analysis Plan For E Commerce Promotion Tactics Content Performance Tracking Dashboard For Social Media Channels Icons PDF
This slide indicates the content performance tracking dashboard for social media channels providing information regarding the total number of posts, engagement rate, audience sentiments and multiple hashtags performance. Formulating a presentation can take up a lot of effort and time, so the content and message should always be the primary focus. The visuals of the PowerPoint can enhance the presenters message, so our Analysis Plan For E Commerce Promotion Tactics Content Performance Tracking Dashboard For Social Media Channels Icons PDF was created to help save time. Instead of worrying about the design, the presenter can concentrate on the message while our designers work on creating the ideal templates for whatever situation is needed. Slidegeeks has experts for everything from amazing designs to valuable content, we have put everything into Analysis Plan For E Commerce Promotion Tactics Content Performance Tracking Dashboard For Social Media Channels Icons PDF
Registrants And Attendees KPIS To Track Success Of Event Stakeholder Engagement Plan For Launch Event Icons PDF
This slide provides an overview of attendee related key metrics. The indicators covered are number of total registrants, attendee retention, turnout percentage, pageviews on microsite and device usage. Whether you have daily or monthly meetings, a brilliant presentation is necessary. Registrants And Attendees KPIS To Track Success Of Event Stakeholder Engagement Plan For Launch Event Icons PDF can be your best option for delivering a presentation. Represent everything in detail using Registrants And Attendees KPIS To Track Success Of Event Stakeholder Engagement Plan For Launch Event Icons PDF and make yourself stand out in meetings. The template is versatile and follows a structure that will cater to your requirements. All the templates prepared by Slidegeeks are easy to download and edit. Our research experts have taken care of the corporate themes as well. So, give it a try and see the results.
Online PR Techniques To Boost Brands Online Visibility Comparison Of Actual And Expected PR Strategy Icons PDF
This slide shows comparative analysis of actual and expected PR metrics to track the performance of PR strategy. It includes key performance indicators such as media coverage, brand mentions, social media engagement rate, conversion rate, etc. Crafting an eye catching presentation has never been more straightforward. Let your presentation shine with this tasteful yet straightforward Online PR Techniques To Boost Brands Online Visibility Comparison Of Actual And Expected PR Strategy Icons PDF template. It offers a minimalistic and classy look that is great for making a statement. The colors have been employed intelligently to add a bit of playfulness while still remaining professional. Construct the ideal Online PR Techniques To Boost Brands Online Visibility Comparison Of Actual And Expected PR Strategy Icons PDF that effortlessly grabs the attention of your audience. Begin now and be certain to wow your customers.
Formulating Branding Strategy To Enhance Revenue And Sales Kpis To Measure The Success Rate Of Advertising Icons PDF
The following slide outlines multiple key performance indicators used by the marketer to evaluate the effectiveness of an online advertisement campaign. The KPIs are likes, comments, shares, clickthrough rate CTR, open rate, bounce rate, article views, audience engagement rate and subscriber growth. Do you have to make sure that everyone on your team knows about any specific topic I yes, then you should give Formulating Branding Strategy To Enhance Revenue And Sales Kpis To Measure The Success Rate Of Advertising Icons PDF a try. Our experts have put a lot of knowledge and effort into creating this impeccable Formulating Branding Strategy To Enhance Revenue And Sales Kpis To Measure The Success Rate Of Advertising Icons PDF. You can use this template for your upcoming presentations, as the slides are perfect to represent even the tiniest detail. You can download these templates from the Slidegeeks website and these are easy to edit. So grab these today.
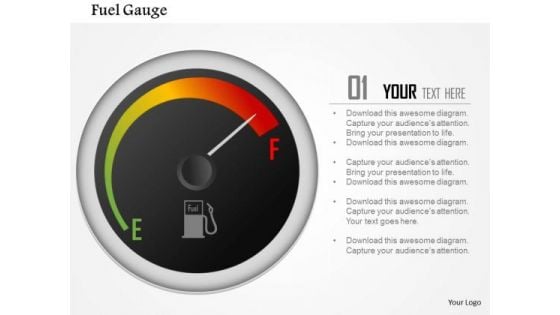
Business Framework Fuel Gauge Indicator PowerPoint Presentation
This diagram displays framework of fuel gauge indicator. It contains graphic of black meter indicating the fuel gauge. Use this editable diagram for your business and technology related presentations.
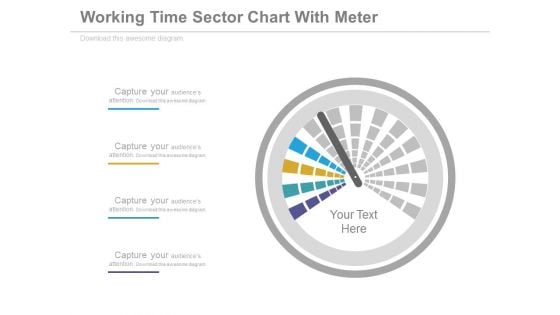
Dashboard Performance Analysis Chart Powerpoint Slides
This PowerPoint template graphics of meter chart. Download this PPT chart for business performance analysis. This PowerPoint slide is of great help in the business sector to make realistic presentations and provides effective way of presenting your newer thoughts.
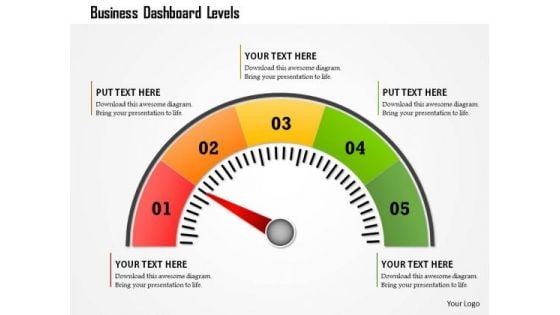
Business Framework Business Dashboard Levels PowerPoint Presentation
This business diagram displays colored meter with multiple levels. Use this diagram to display business process. This diagram can be used to indicate performance measures. This is an excellent diagram to impress your audiences.
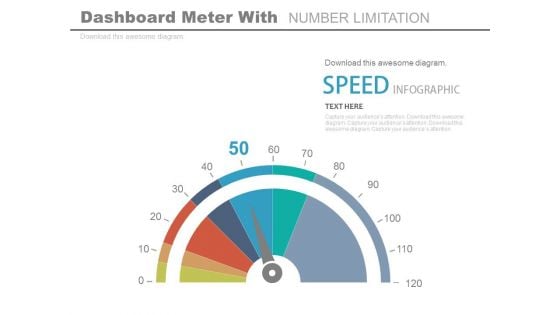
Dashboard To Impact The Performance Powerpoint Slides
This PowerPoint template graphics of meter chart. Download this PPT chart for business performance analysis. This PowerPoint slide is of great help in the business sector to make realistic presentations and provides effective way of presenting your newer thoughts.
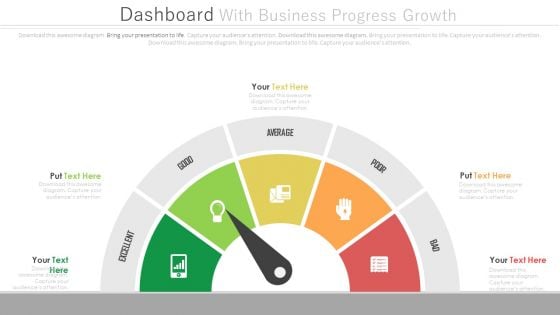
Dashboard To Simplify Business Data Analysis Powerpoint Slides
This PowerPoint template graphics of meter chart. Download this PPT chart to simplify business data analysis. This PowerPoint slide is of great help in the business sector to make realistic presentations and provides effective way of presenting your newer thoughts.
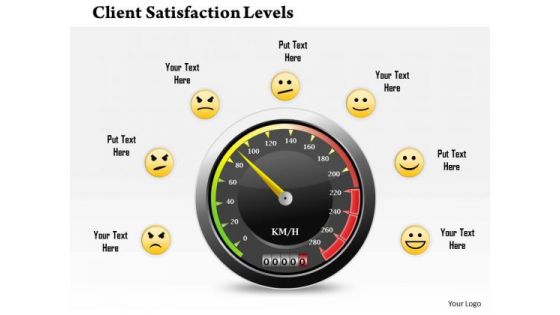
Business Framework Client Satisfaction Levels PowerPoint Presentation
Graphic of black meter has been used to design this business diagram. This business slide displays the concept of client satisfaction with different levels. Use this editable diagram for customer and business related presentations.
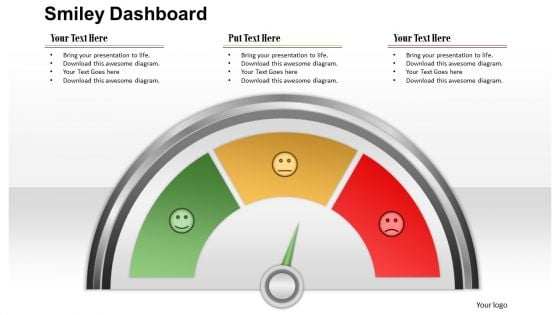
Business Framework Smiley Dashboard PowerPoint Presentation
This Power Point template slide has been designed with graphic of dashboard with meter diagram. This PPT slide contains the concept of maximum achievement. Use this PPT slide in your business presentations.
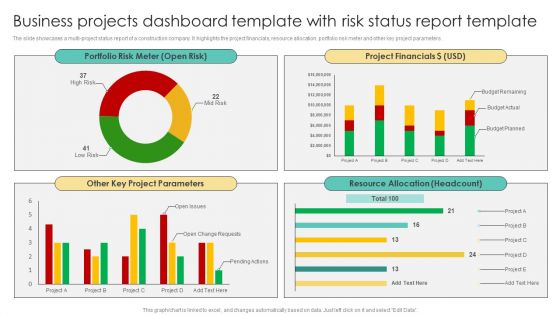
Business Projects Dashboard Template With Risk Status Report Template Topics PDF
The slide showcases a multi-project status report of a construction company. It highlights the project financials, resource allocation, portfolio risk meter and other key project parameters. Pitch your topic with ease and precision using this Business Projects Dashboard Template With Risk Status Report Template Topics PDF. This layout presents information on Portfolio Risk Meter, Project Financials, Project Parameters, Resource Allocation. It is also available for immediate download and adjustment. So, changes can be made in the color, design, graphics or any other component to create a unique layout.
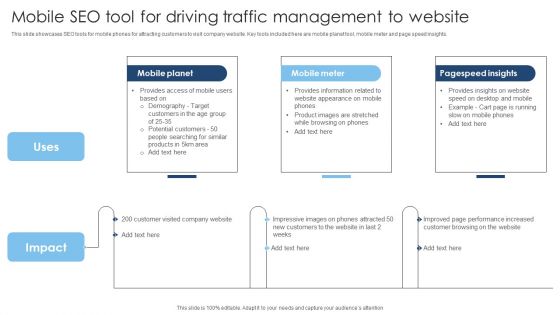
Mobile SEO Tool For Driving Traffic Management To Website Demonstration PDF
This slide showcases SEO tools for mobile phones for attracting customers to visit company website. Key tools included here are mobile planet tool, mobile meter and page speed insights. Presenting Mobile SEO Tool For Driving Traffic Management To Website Demonstration PDF to dispense important information. This template comprises three stages. It also presents valuable insights into the topics including Mobile Planet, Mobile Meter, Pagespeed Insights . This is a completely customizable PowerPoint theme that can be put to use immediately. So, download it and address the topic impactfully.
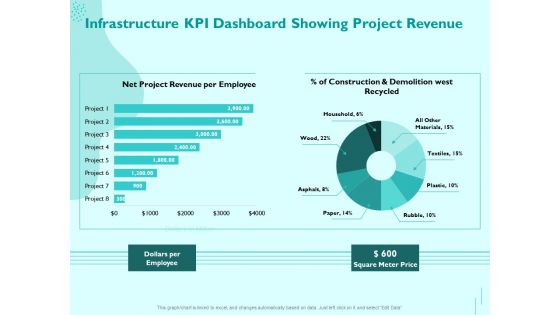
Managing IT Operating System Infrastructure KPI Dashboard Showing Project Revenue Diagrams PDF
Presenting this set of slides with name managing it operating system infrastructure kpi dashboard showing project revenue diagrams pdf. The topics discussed in these slides are dollars per employee, square meter price. This is a completely editable PowerPoint presentation and is available for immediate download. Download now and impress your audience.
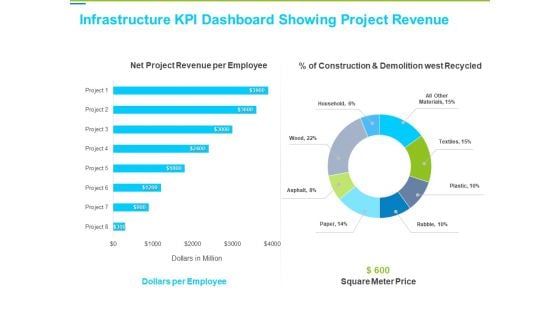
Framework Administration Infrastructure KPI Dashboard Showing Project Revenue Background PDF
Deliver an awe-inspiring pitch with this creative framework administration infrastructure kpi dashboard showing project revenue background pdf bundle. Topics like net project revenue per employee, dollars per employee, square meter price can be discussed with this completely editable template. It is available for immediate download depending on the needs and requirements of the user.
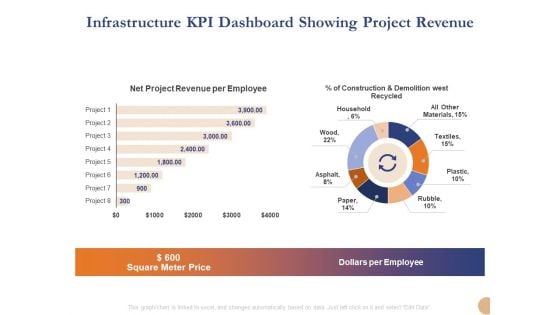
Substructure Segment Analysis Infrastructure KPI Dashboard Showing Project Revenue Summary PDF
Deliver and pitch your topic in the best possible manner with this substructure segment analysis infrastructure kpi dashboard showing project revenue summary pdf. Use them to share invaluable insights on square meter price, dollars per employee, net project revenue per employee and impress your audience. This template can be altered and modified as per your expectations. So, grab it now.
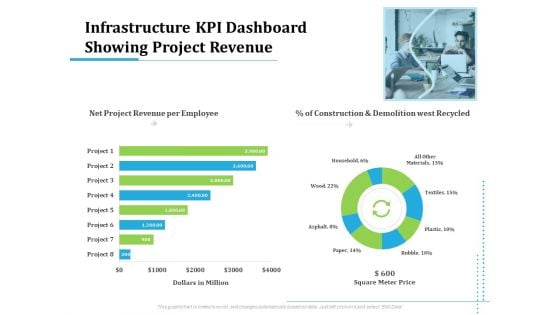
Information Technology Functions Management Infrastructure KPI Dashboard Showing Project Revenue Ppt Show Information PDF
Deliver an awe-inspiring pitch with this creative information technology functions management infrastructure kpi dashboard showing project revenue ppt show information pdf bundle. Topics like net project revenue per employee, construction and demolition west recycled, dollars million, square meter price, project can be discussed with this completely editable template. It is available for immediate download depending on the needs and requirements of the user.
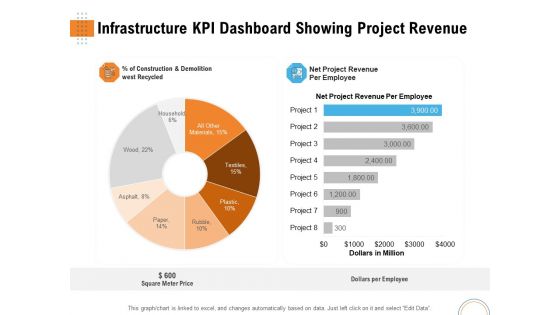
Utilizing Infrastructure Management Using Latest Methods Infrastructure KPI Dashboard Showing Project Revenue Background PDF
Deliver an awe-inspiring pitch with this creative utilizing infrastructure management using latest methods infrastructure kpi dashboard showing project revenue background pdf bundle. Topics like net project revenue per employee, construction and demolition west recycled, dollars million, square meter price, project can be discussed with this completely editable template. It is available for immediate download depending on the needs and requirements of the user.
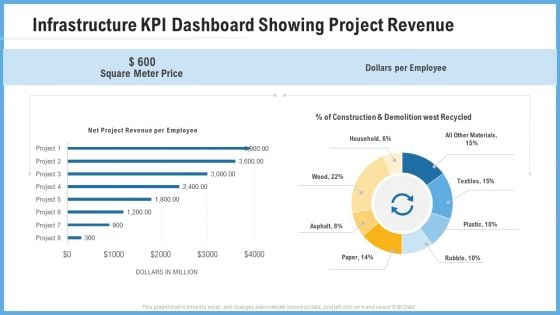
Improving Operational Activities Enterprise Infrastructure Kpi Dashboard Showing Project Revenue Professional PDF
Deliver an awe inspiring pitch with this creative improving operational activities enterprise infrastructure kpi dashboard showing project revenue professional pdf bundle. Topics like square meter price, dollars per employee can be discussed with this completely editable template. It is available for immediate download depending on the needs and requirements of the user.
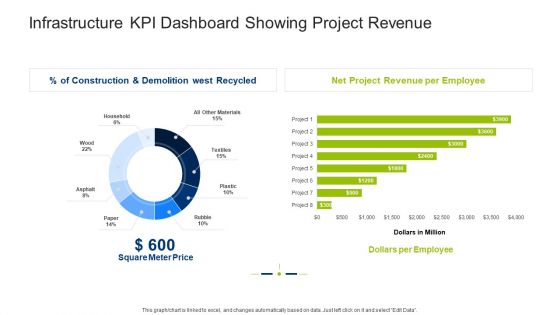
Infrastructure Building Administration Infrastructure KPI Dashboard Showing Project Revenue Clipart PDF
Deliver an awe inspiring pitch with this creative infrastructure building administration infrastructure kpi dashboard showing project revenue clipart pdf bundle. Topics like square meter price, net project revenue per employee, dollars per employee can be discussed with this completely editable template. It is available for immediate download depending on the needs and requirements of the user.
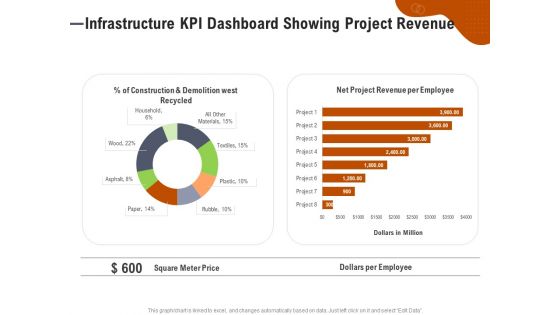
Key Features For Effective Business Management Infrastructure KPI Dashboard Showing Project Revenue Ppt Ideas File Formats PDF
Presenting this set of slides with name key features for effective business management infrastructure kpi dashboard showing project revenue ppt ideas file formats pdf. The topics discussed in these slides are construction and demolition west recycled, net project revenue per employee, square meter price, dollars per employee. This is a completely editable PowerPoint presentation and is available for immediate download. Download now and impress your audience.
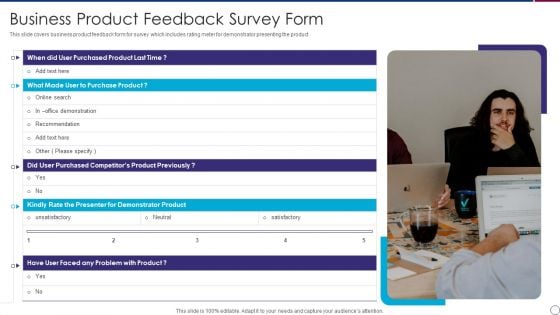
Business Product Feedback Survey Form Slides PDF
This slide covers business product feedback form for survey which includes rating meter for demonstrator presenting the product.Presenting Business Product Feedback Survey Form Slides PDF to dispense important information. This template comprises one stage. It also presents valuable insights into the topics including Purchased Product, Purchased Competitors, unsatisfactory This is a completely customizable PowerPoint theme that can be put to use immediately. So, download it and address the topic impactfully.
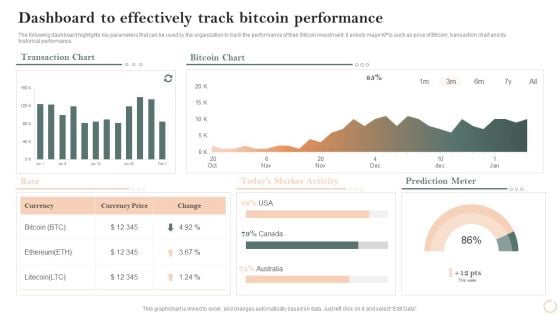
Virtual Assets Investment Guide Dashboard To Effectively Track Bitcoin Performance Rules PDF
The following dashboard highlights key parameters that can be used by the organization to track the performance of their Bitcoin investment, it enlists major KPIs such as price of Bitcoin, transaction chart and its historical performance. Deliver an awe inspiring pitch with this creative Virtual Assets Investment Guide Dashboard To Effectively Track Bitcoin Performance Rules PDF bundle. Topics like Bitcoin Chart, Transaction Chart, Prediction Meter can be discussed with this completely editable template. It is available for immediate download depending on the needs and requirements of the user.
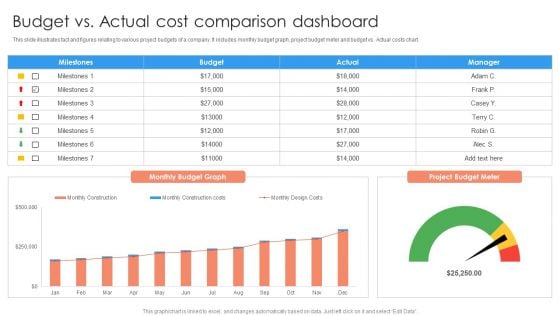
Budget Vs Actual Cost Comparison Dashboard Ppt PowerPoint Presentation Professional Format Ideas PDF
This slide illustrates fact and figures relating to various project budgets of a company. It includes monthly budget graph, project budget meter and budget vs. Actual costs chart.Pitch your topic with ease and precision using this Budget Vs Actual Cost Comparison Dashboard Ppt PowerPoint Presentation Professional Format Ideas PDF. This layout presents information on Milestones, Budget Graph, Manager. It is also available for immediate download and adjustment. So, changes can be made in the color, design, graphics or any other component to create a unique layout.
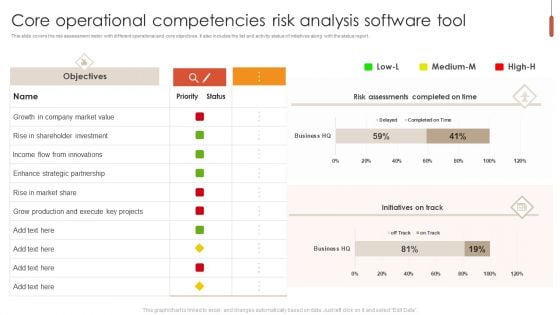
Core Operational Competencies Risk Analysis Software Tool Graphics PDF
This slide covers the risk assessment meter with different operational and core objectives. It also includes the list and activity status of initiatives along with the status report. Pitch your topic with ease and precision using this Core Operational Competencies Risk Analysis Software Tool Graphics PDF. This layout presents information on Strategic Partnership, Market Value, Shareholder Investment. It is also available for immediate download and adjustment. So, changes can be made in the color, design, graphics or any other component to create a unique layout.
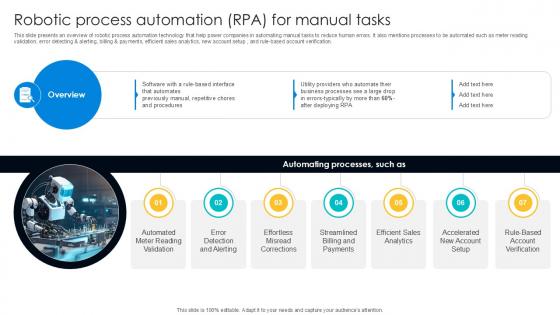
Robotic Process Automation RPA For Digital Transformation Journey PPT Slide DT SS V
This slide presents an overview of robotic process automation technology that help power companies in automating manual tasks to reduce human errors. It also mentions processes to be automated such as meter reading validation, error detecting and alerting, billing and payments, efficient sales analytics, new account setup , and rule-based account verification. Retrieve professionally designed Rule-Based Account Verification, Accelerated New Account Setup, Efficient Sales Analytics to effectively convey your message and captivate your listeners. Save time by selecting pre-made slideshows that are appropriate for various topics, from business to educational purposes. These themes come in many different styles, from creative to corporate, and all of them are easily adjustable and can be edited quickly. Access them as PowerPoint templates or as Google Slides themes. You do not have to go on a hunt for the perfect presentation because Slidegeeks got you covered from everywhere. This slide presents an overview of robotic process automation technology that help power companies in automating manual tasks to reduce human errors. It also mentions processes to be automated such as meter reading validation, error detecting and alerting, billing and payments, efficient sales analytics, new account setup , and rule-based account verification.

Machine To Machine Communication Outline Iot Energy Domain Ppt Ideas Design Ideas PDF
The slide shows usage of IoT in Energy Domain. Presenting machine to machine communication outline iot energy domain ppt ideas design ideas pdf to provide visual cues and insights. Share and navigate important information on ten stages that need your due attention. This template can be used to pitch topics like voice assistants, smart fashions, hearables, entertainment devices, lightning and climate, wearables, smartphones, hubs and controllers, home appliances, smart plugs, meters and charging. In addition, this PPT design contains high-resolution images, graphics, etc, that are easily editable and available for immediate download.
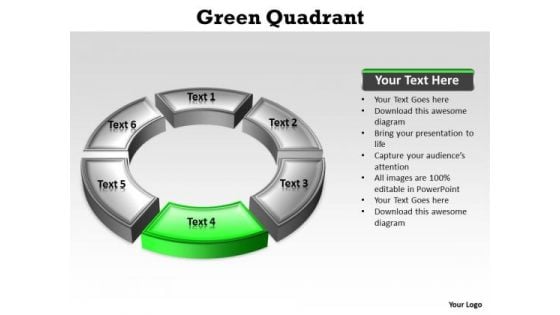
Ppt Circular PowerPoint Menu Template Description Green Stage Templates
PPT circular powerpoint menu template description green stage Templates-Select the key concepts of the topic under study use this slide to discuss that topic with your team. This Diagram is an effective way of displaying information. You can edit text, color, shade and style as per you need.-PPT circular powerpoint menu template description green stage Templates-arrow, blue, business, button, chronometer, circle, clock, concept, countdown, day, design, dial, display, electronics, element, future, futuristic, green, group, hour, icon, illustration, instrument, interval, measure, measurement, metering, minute, numbers, object, precision, quadrant, quick, race, red, round, second, set, shadow, speed, sphere, sport, start, stop Some in your community may have fallen on bad times. Comfort them with our Ppt Circular PowerPoint Menu Template Description Green Stage Templates.
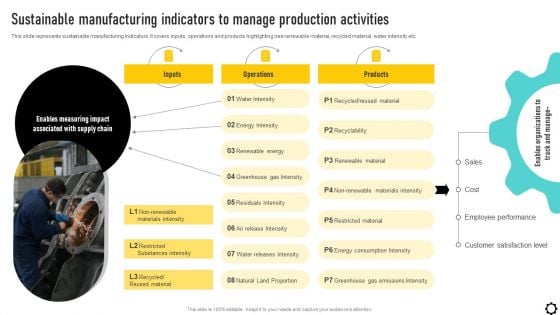
Optimizing Production Process Sustainable Manufacturing Indicators To Manage Themes PDF
This slide represents sustainable manufacturing indicators. It covers inputs, operations and products highlighting nee renewable material, recycled material, water intensity etc. Formulating a presentation can take up a lot of effort and time, so the content and message should always be the primary focus. The visuals of the PowerPoint can enhance the presenters message, so our Optimizing Production Process Sustainable Manufacturing Indicators To Manage Themes PDF was created to help save time. Instead of worrying about the design, the presenter can concentrate on the message while our designers work on creating the ideal templates for whatever situation is needed. Slidegeeks has experts for everything from amazing designs to valuable content, we have put everything into Optimizing Production Process Sustainable Manufacturing Indicators To Manage Themes PDF.
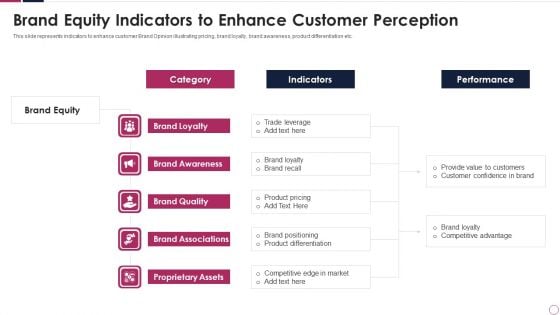
brand equity indicators to enhance customer perception infographics pdf
This slide represents indicators to enhance customer Brand Opinion illustrating pricing, brand loyalty, brand awareness, product differentiation etc. Showcasing this set of slides titled brand equity indicators to enhance customer perception infographics pdf. The topics addressed in these templates are brand awareness, brand quality, brand associations. All the content presented in this PPT design is completely editable. Download it and make adjustments in color, background, font etc. as per your unique business setting.
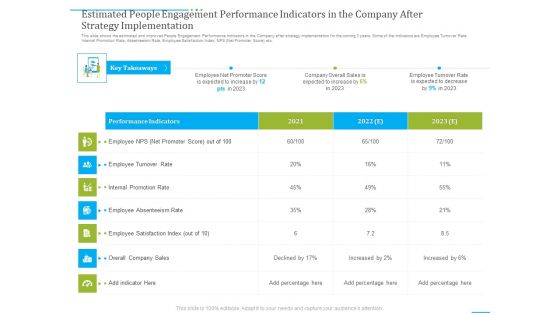
Estimated People Engagement Performance Indicators In The Company After Strategy Implementation Download PDF
Deliver and pitch your topic in the best possible manner with this estimated people engagement performance indicators in the company after strategy implementation download pdf. Use them to share invaluable insights on estimated people engagement performance indicators in the company after strategy implementation and impress your audience. This template can be altered and modified as per your expectations. So, grab it now.
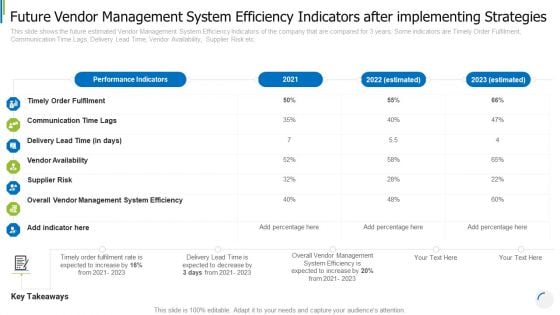
Future Vendor Management System Efficiency Indicators After Implementing Strategies Portrait PDF
This slide shows the future estimated Vendor Management System Efficiency Indicators of the company that are compared for 3 years. Some indicators are Timely Order Fulfilment, Communication Time Lags, Delivery Lead Time, Vendor Availability, Supplier Risk etc. Deliver and pitch your topic in the best possible manner with this future vendor management system efficiency indicators after implementing strategies portrait pdf. Use them to share invaluable insights on timely order fulfilment, communication time lags, vendor availability and impress your audience. This template can be altered and modified as per your expectations. So, grab it now.

Key Performance Indicators Of Hcl Plus Logistics Company With Future Targets Rules PDF
The slide shows the key Performance Indicator KPIs which will help the company to track the success rate of implemented strategies. Some of the KPIs are On Time Shipping, Average Carrier Waiting Time, Cash to Cash Cycle Time, Fright Payment Accuracy, Inventory Turnover, On Time Delivery etc. Deliver an awe inspiring pitch with this creative key performance indicators of hcl plus logistics company with future targets rules pdf bundle. Topics like key performance indicators of hcl plus logistics company with future targets can be discussed with this completely editable template. It is available for immediate download depending on the needs and requirements of the user.
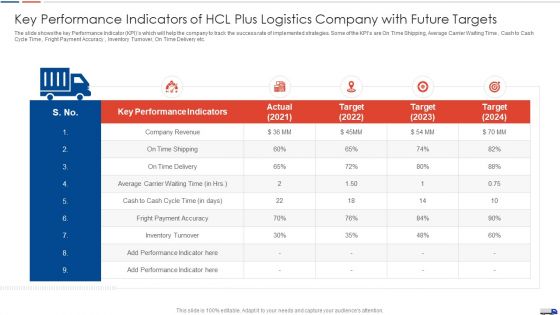
Strategies Create Good Proposition Key Performance Indicators Of Hcl Plus Logistics Company Mockup PDF
The slide shows the key Performance Indicator KPIs which will help the company to track the success rate of implemented strategies. Some of the KPIs are On Time Shipping, Average Carrier Waiting Time, Cash to Cash Cycle Time, Fright Payment Accuracy, Inventory Turnover, On Time Delivery etc. Deliver an awe inspiring pitch with this creative strategies create good proposition key performance indicators of hcl plus logistics company mockup pdf bundle. Topics like key performance indicators of hcl plus logistics company with future targets can be discussed with this completely editable template. It is available for immediate download depending on the needs and requirements of the user.
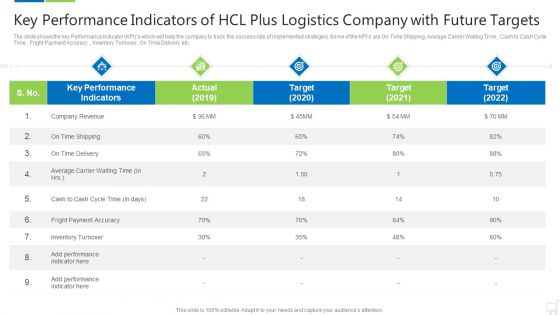
Key Performance Indicators Of Hcl Plus Logistics Company With Future Targets Brochure PDF
The slide shows the key Performance Indicator KPIs which will help the company to track the success rate of implemented strategies. Some of the KPIs are On Time Shipping, Average Carrier Waiting Time, Cash to Cash Cycle Time, Fright Payment Accuracy, Inventory Turnover, On Time Delivery etc. Deliver an awe inspiring pitch with this creative key performance indicators of hcl plus logistics company with future targets brochure pdf bundle. Topics like company revenue, average carrier waiting time, fright payment accuracy can be discussed with this completely editable template. It is available for immediate download depending on the needs and requirements of the user.
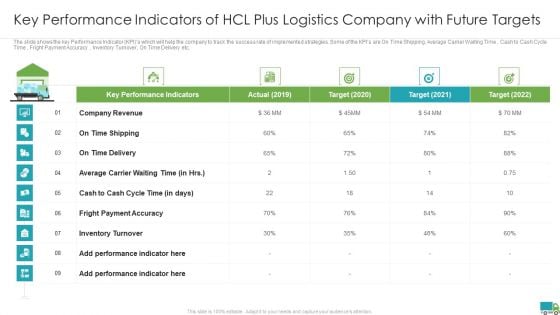
Generating Logistics Value Business Key Performance Indicators Of Hcl Plus Logistics Company With Future Sample PDF
The slide shows the key Performance Indicator KPIs which will help the company to track the success rate of implemented strategies. Some of the KPIs are On Time Shipping, Average Carrier Waiting Time, Cash to Cash Cycle Time, Fright Payment Accuracy, Inventory Turnover, On Time Delivery etc. Deliver and pitch your topic in the best possible manner with this generating logistics value business hcl plus logistics company business details with surplus funds elements pdf. Use them to share invaluable insights on company revenue, fright payment accuracy, inventory turnover and impress your audience. This template can be altered and modified as per your expectations. So, grab it now.
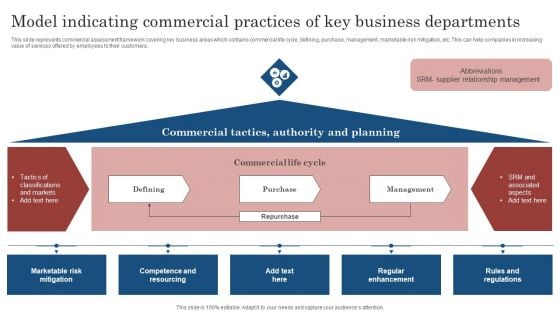
Model Indicating Commercial Practices Of Key Business Departments Ppt File Graphics Design PDF
This slide represents commercial assessment framework covering key business areas which contains commercial life cycle, defining, purchase, management, marketable risk mitigation, etc. This can help companies in increasing value of services offered by employees to their customers. Showcasing this set of slides titled Model Indicating Commercial Practices Of Key Business Departments Ppt File Graphics Design PDF. The topics addressed in these templates are Commercial Tactics, Authority And Planning, Management. All the content presented in this PPT design is completely editable. Download it and make adjustments in color, background, font etc. as per your unique business setting.

Case Competition Reduction In Existing Customer Of Telecommunication Company Key Performance Indicators Ppt Layouts Graphics Pictures PDF
This is a case competition reduction in existing customer of telecommunication company key performance indicators ppt layouts graphics pictures pdf template with various stages. Focus and dispense information on seven stages using this creative set, that comes with editable features. It contains large content boxes to add your information on topics like key performance indicator, subscribers, technology users, average revenue, customer satisfaction level . You can also showcase facts, figures, and other relevant content using this PPT layout. Grab it now.
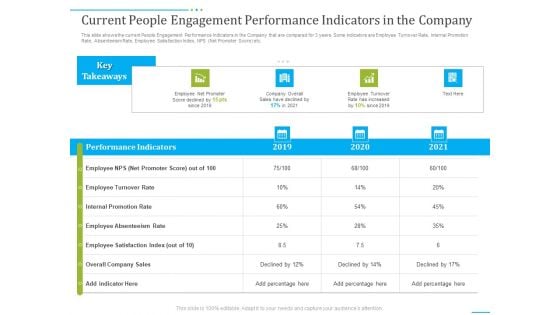
Tactics To Develop People Engagement In Organization Current People Engagement Performance Indicators In The Company Slides PDF
Deliver an awe inspiring pitch with this creative tactics to develop people engagement in organization current people engagement performance indicators in the company slides pdf bundle. Topics like employee turnover rate, internal promotion rate, employee absenteeism rate can be discussed with this completely editable template. It is available for immediate download depending on the needs and requirements of the user.
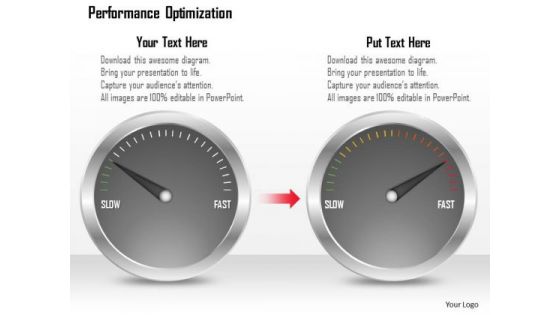
Business Framework Performance Optimization PowerPoint Presentation
Explain the concept of performance optimization with this exclusive template slide. This PPT diagram slide contains the graphic of two meters with maximum ratings. Use this PPT diagram slide and build exclusive presentation for your viewers.
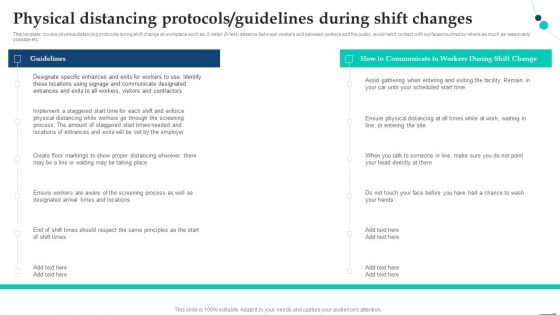
Physical Distancing Protocols Guidelines During Shift Changes Pandemic Company Playbook Diagrams PDF
This template covers physical distancing protocols during shift change at workplace such as 2 meter 6 feet distance between workers and between workers and the public, avoid hand contact with surfaces touched by others as much as reasonably possible etc. Formulating a presentation can take up a lot of effort and time, so the content and message should always be the primary focus. The visuals of the PowerPoint can enhance the presenters message, so our Physical Distancing Protocols Guidelines During Shift Changes Pandemic Company Playbook Diagrams PDF was created to help save time. Instead of worrying about the design, the presenter can concentrate on the message while our designers work on creating the ideal templates for whatever situation is needed. Slidegeeks has experts for everything from amazing designs to valuable content, we have put everything into Physical Distancing Protocols Guidelines During Shift Changes Pandemic Company Playbook Diagrams PDF.
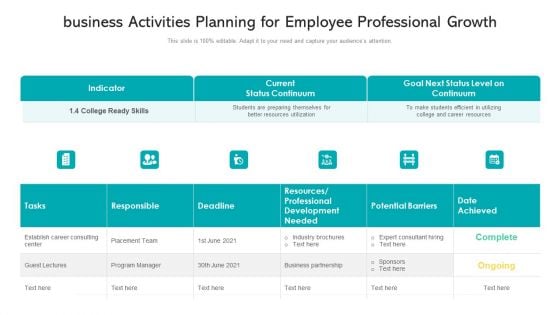
Business Activities Planning For Employee Professional Growth Ppt PowerPoint Presentation Gallery Ideas PDF
Pitch your topic with ease and precision using this business activities planning for employee professional growth ppt powerpoint presentation gallery ideas pdf. This layout presents information on indicator, current status continuum, goal next status level on continuum. It is also available for immediate download and adjustment. So, changes can be made in the color, design, graphics or any other component to create a unique layout.


 Continue with Email

 Home
Home


