Meter Icon
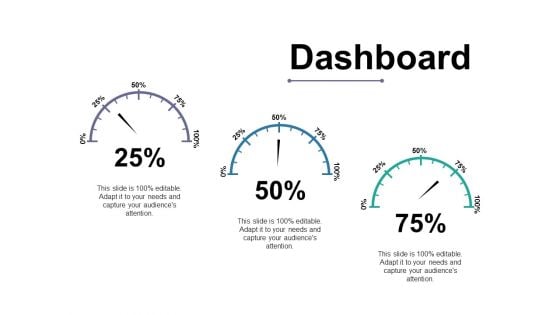
Dashboard Ppt PowerPoint Presentation Styles Themes
This is a dashboard ppt powerpoint presentation styles themes. This is a three stage process. The stages in this process are dashboard, speed, meter, business, marketing.
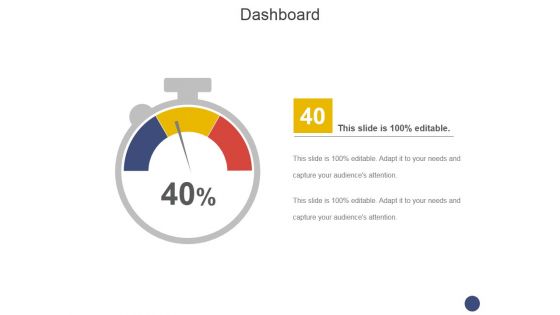
Dashboard Ppt PowerPoint Presentation Layouts Diagrams
This is a dashboard ppt powerpoint presentation layouts diagrams. This is a one stage process. The stages in this process are speed, meter, business, marketing, equipment.
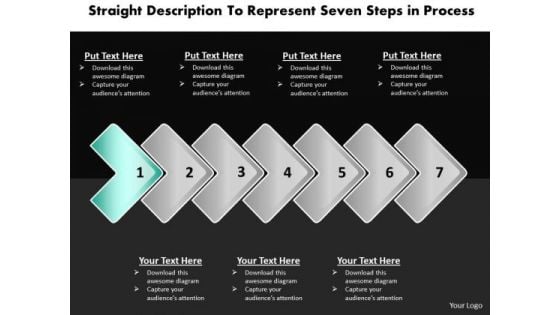
Ppt Direct Description To Represent Seven Steps In Process PowerPoint Templates
PPT direct description to represent seven steps in process PowerPoint Templates-This diagram helps you to analyze all the connected ideas and also can be used to show seven aspects of an issue. This PowerPoint Linear process diagram is used to show interrelated ideas or concepts. This diagram is useful in just about any type of presentation. You can change color, size and orientation of any icon to your liking. -PPT direct description to represent seven steps in process PowerPoint Templates-Aim, Arrow, Arrowheads, Badge, Border, Click, Connection, Curve, Design, Direction, Download, Element, Fuchsia, Icon, Illustration, Indicator, Internet, Magenta, Mark, Object, Orientation, Pointer, Shadow, Shape, Sign Our Ppt Direct Description To Represent Seven Steps In Process PowerPoint Templates are designed by an avant-garde team. They are always abreast of the state of the art.
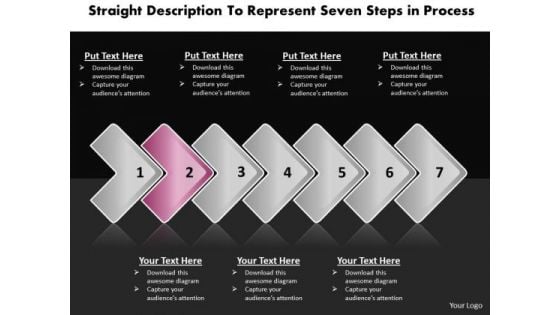
Ppt Continuous Description To Represent Seven Steps Process PowerPoint Templates
PPT continuous description to represent seven steps process PowerPoint Templates-Use this layout to define the outcome and the multiple possibilities in a way that is used in calculation of probabilities, genetics and strategic reasoning. This chart visualizes the concept of process steps, reoccurrences and components or of your company structure or product features. You can change color, size and orientation of any icon to your liking. -PPT continuous description to represent seven steps process PowerPoint Templates-Aim, Arrow, Arrowheads, Badge, Border, Click, Connection, Curve, Design, Direction, Download, Element, Fuchsia, Icon, Illustration, Indicator, Internet, Magenta, Mark, Object, Orientation, Pointer, Shadow, Shape, Sign Carry it off elegantly with our Ppt Continuous Description To Represent Seven Steps Process PowerPoint Templates. Get your thoughts into fashion.
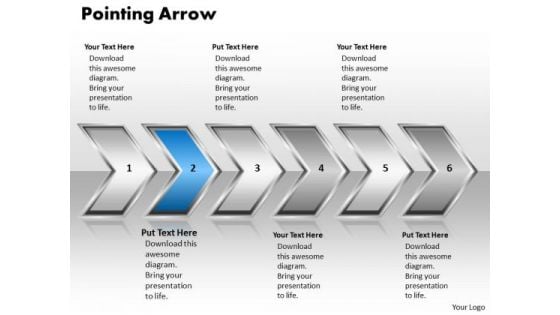
Ppt Pointing Arrow Communication Process PowerPoint Presentation 6 Stages Templates
PPT pointing arrow communication process powerpoint presentation 6 stages Templates-Use this PowerPoint Diagram to represent the layers of Linear Process model Graphically. It shows the Second stage in an animated manner through an Arrow. It is a useful captivating tool enables you to define your message in your Marketing PPT presentations. You can change color, size and orientation of any icon to your liking.-PPT pointing arrow communication process powerpoint presentation 6 stages Templates-Aim, Arrow, Arrowheads, Badge, Border, Click, Connection, Curve, Design, Direction, Download, Element, Fuchsia, Icon, Illustration, Indicator, Internet, Magenta, Mark, Object, Orientation, Pointer, Shadow, Shape, Sign Our graphice have been selected by professionals. Use them in your presentations with our Ppt Pointing Arrow Communication Process PowerPoint Presentation 6 Stages Templates. You'll always stay ahead of the game.
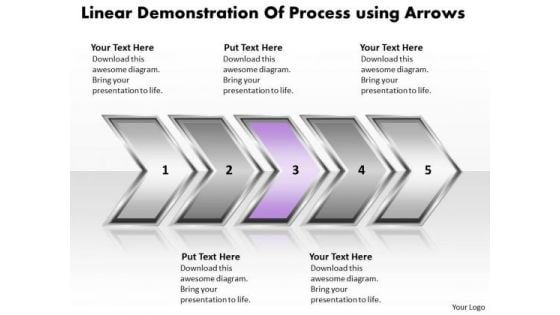
Ppt Linear Demonstration Of Business Forging Process PowerPoint Slides Templates
PPT linear demonstration of business forging process powerpoint slides Templates-Use this PowerPoint Diagram to represent the layers of Linear Process model Graphically. It shows the third stage in an animated manner through an Arrow. It is a useful captivating tool enables you to define your message in your Marketing PPT presentations. You can change color, size and orientation of any icon to your liking.-PPT linear demonstration of business forging process powerpoint slides Templates-Aim, Arrow, Arrowheads, Badge, Border, Click, Connection, Curve, Design, Direction, Download, Element, Fuchsia, Icon, Illustration, Indicator, Internet, Magenta, Mark, Object, Orientation, Pointer, Shadow, Shape, Sign Break throughthe fence with our Ppt Linear Demonstration Of Business Forging Process PowerPoint Slides Templates. Your ideas will bring down all barriers.
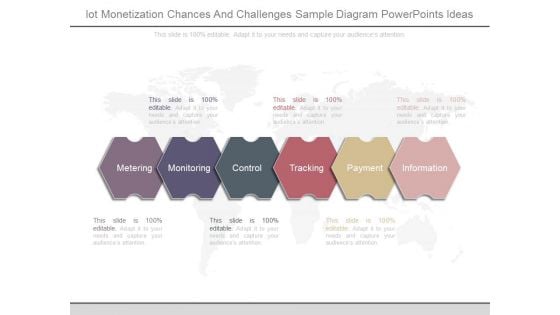
Iot Monetization Chances And Challenges Sample Diagram Powerpoints Ideas
This is a iot monetization chances and challenges sample diagram powerpoints ideas. This is a six stage process. The stages in this process are metering, monitoring, control, tracking, payment, information.

Low High Performance Measurement Indicator Dashboard Ppt PowerPoint Presentation Summary Images
This is a low high performance measurement indicator dashboard ppt powerpoint presentation summary images. This is a five stage process. The stages in this process are performance dashboard, performance meter, performance kpi.
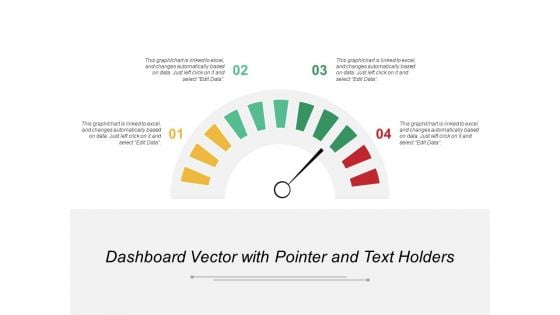
Dashboard Vector With Pointer And Text Holders Ppt PowerPoint Presentation Portfolio Format Ideas
This is a dashboard vector with pointer and text holders ppt powerpoint presentation portfolio format ideas. This is a four stage process. The stages in this process are performance dashboard, performance meter, performance kpi.
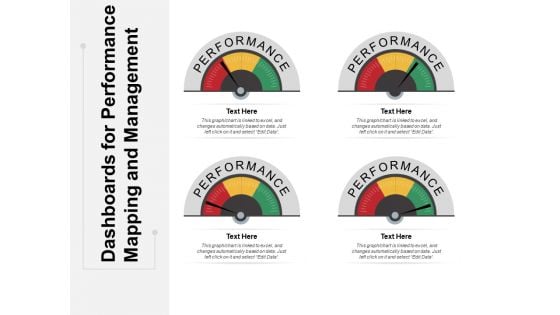
Dashboards For Performance Mapping And Management Ppt PowerPoint Presentation Ideas File Formats
This is a dashboards for performance mapping and management ppt powerpoint presentation ideas file formats. This is a four stage process. The stages in this process are performance dashboard, performance meter, performance kpi.
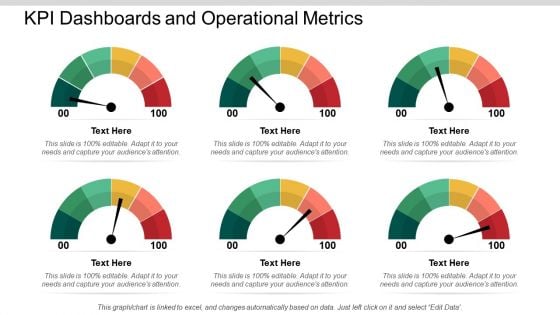
KPI Dashboards And Operational Metrics Ppt PowerPoint Presentation Portfolio Infographics

Liquid Gauge Symbol Digital Water Digital Reading Control Gauge Ppt PowerPoint Presentation Complete Deck
Presenting this set of slides with name liquid gauge symbol digital water digital reading control gauge ppt powerpoint presentation complete deck. The topics discussed in these slides are digital water, digital reading, control gauge, water meter. This is a completely editable PowerPoint presentation and is available for immediate download. Download now and impress your audience.
Folder Download Internet PowerPoint Templates And PowerPoint Themes 1012
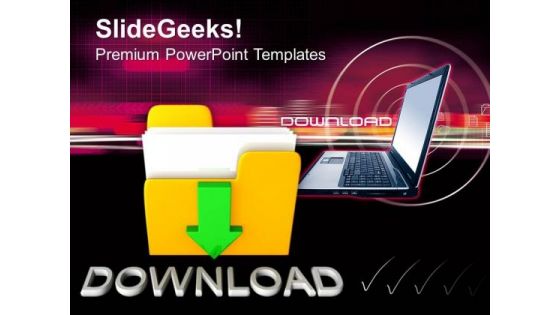
Folder Download Internet PowerPoint Templates And PowerPoint Themes 1012-This Template shows the download folder along with the Laptop. It indicates the downloaded data from the Internet. It signifies transfer, copy, move, take and cyberspace. Your brain is always churning out ideas like cogs in a wheel. The mind is always whirring with new ideas. Put them down and present them using our innovative templates-Folder Download Internet PowerPoint Templates And PowerPoint Themes 1012-This PowerPoint template can be used for presentations relating to-Folder Icon With Arrow, Communication, Internet, Computer, Symbol, Technology Debates often go to a fever pitch. Cool down the environment with our Folder Download Internet PowerPoint Templates And PowerPoint Themes 1012.
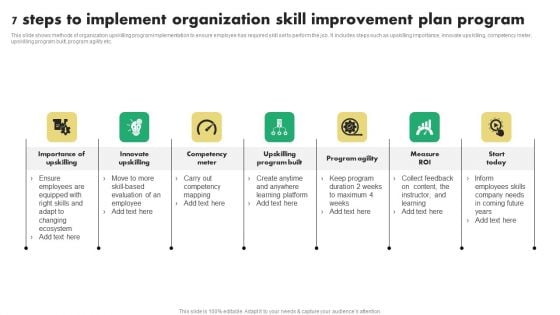
7 Steps To Implement Organization Skill Improvement Plan Program Infographics PDF
This slide shows methods of organization upskilling program implementation to ensure employee has required skill set to perform the job. It includes steps such as upskilling importance, innovate upskilling, competency meter, upskilling program built, program agility etc. Presenting 7 Steps To Implement Organization Skill Improvement Plan Program Infographics PDF to dispense important information. This template comprises seven stages. It also presents valuable insights into the topics including Competency Meter, Innovate Upskilling, Program Agility. This is a completely customizable PowerPoint theme that can be put to use immediately. So, download it and address the topic impactfully.
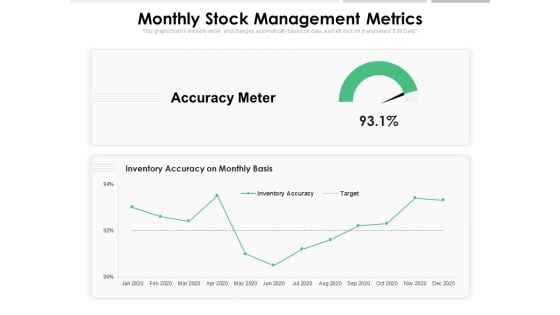
Monthly Stock Management Metrics Ppt PowerPoint Presentation Inspiration Format PDF
Presenting this set of slides with name monthly stock management metrics ppt powerpoint presentation inspiration format pdf. The topics discussed in these slides are accuracy meter, inventory accuracy on monthly basis, target. This is a completely editable PowerPoint presentation and is available for immediate download. Download now and impress your audience.
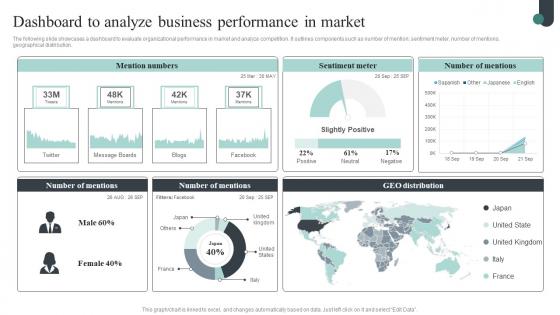
Competitive Intelligence Guide To Determine Market Dashboard To Analyze Business Pictures Pdf
The following slide showcases a dashboard to evaluate organizational performance in market and analyze competition. It outlines components such as number of mention, sentiment meter, number of mentions, geographical distribution. Do you have to make sure that everyone on your team knows about any specific topic I yes, then you should give Competitive Intelligence Guide To Determine Market Dashboard To Analyze Business Pictures Pdf a try. Our experts have put a lot of knowledge and effort into creating this impeccable Competitive Intelligence Guide To Determine Market Dashboard To Analyze Business Pictures Pdf. You can use this template for your upcoming presentations, as the slides are perfect to represent even the tiniest detail. You can download these templates from the Slidegeeks website and these are easy to edit. So grab these today. The following slide showcases a dashboard to evaluate organizational performance in market and analyze competition. It outlines components such as number of mention, sentiment meter, number of mentions, geographical distribution.
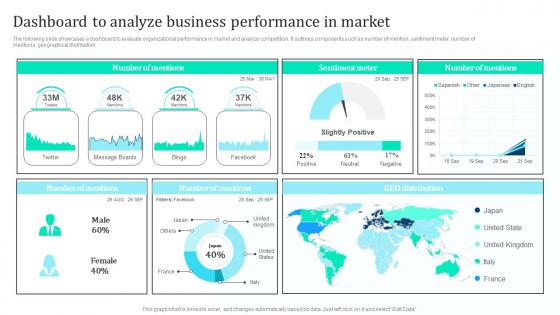
Dashboard Analyze Business Performance Marketing Intelligence Guide Data Gathering Microsoft Pdf
The following slide showcases a dashboard to evaluate organizational performance in market and analyze competition. It outlines components such as number of mention, sentiment meter, number of mentions, geographical distribution. Do you have to make sure that everyone on your team knows about any specific topic I yes, then you should give Dashboard Analyze Business Performance Marketing Intelligence Guide Data Gathering Microsoft Pdf a try. Our experts have put a lot of knowledge and effort into creating this impeccable Dashboard Analyze Business Performance Marketing Intelligence Guide Data Gathering Microsoft Pdf. You can use this template for your upcoming presentations, as the slides are perfect to represent even the tiniest detail. You can download these templates from the Slidegeeks website and these are easy to edit. So grab these today The following slide showcases a dashboard to evaluate organizational performance in market and analyze competition. It outlines components such as number of mention, sentiment meter, number of mentions, geographical distribution.
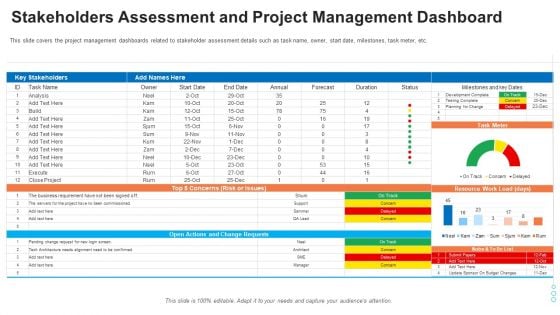
Evaluation Mapping Stakeholders Assessment And Project Management Dashboard Structure PDF
This slide covers the project management dashboards related to stakeholder assessment details such as task name, owner, start date, milestones, task meter, etc. Deliver an awe-inspiring pitch with this creative evaluation mapping stakeholders assessment and project management dashboard structure pdf bundle. Topics like stakeholders assessment and project management dashboard can be discussed with this completely editable template. It is available for immediate download depending on the needs and requirements of the user.
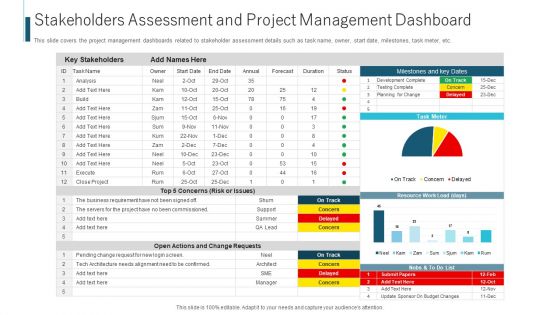
Stakeholders Assessment And Project Management Dashboard Ppt Ideas Outline PDF
This slide covers the project management dashboards related to stakeholder assessment details such as task name, owner, start date, milestones, task meter, etc. Deliver and pitch your topic in the best possible manner with this stakeholders assessment and project management dashboard ppt ideas outline pdf. Use them to share invaluable insights on risk or issues, business requirement, analysis and impress your audience. This template can be altered and modified as per your expectations. So, grab it now.
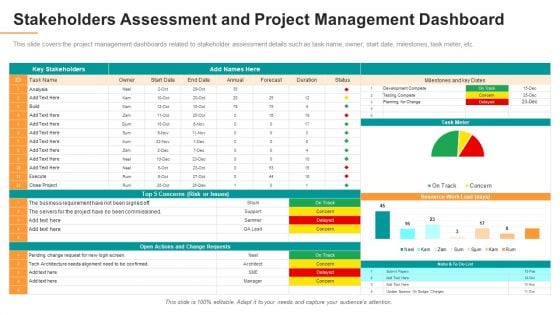
Stakeholders Assessment And Project Management Dashboard Formats PDF
This slide covers the project management dashboards related to stakeholder assessment details such as task name, owner, start date, milestones, task meter, etc. Deliver an awe inspiring pitch with this creative stakeholders assessment and project management dashboard formats pdf bundle. Topics like resource, stakeholders, analysis can be discussed with this completely editable template. It is available for immediate download depending on the needs and requirements of the user.
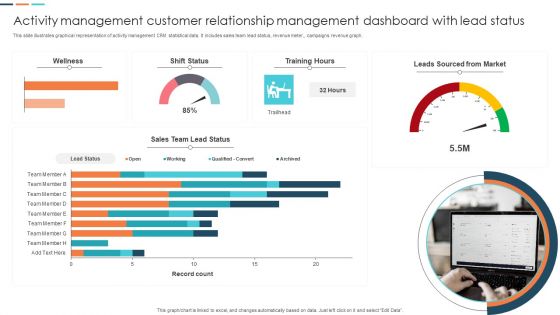
Activity Management Customer Relationship Management Dashboard With Lead Status Portrait PDF
This slide illustrates graphical representation of activity management CRM statistical data. It includes sales team lead status, revenue meter, campaigns revenue graph. Showcasing this set of slides titled Activity Management Customer Relationship Management Dashboard With Lead Status Portrait PDF. The topics addressed in these templates are Sales Team Lead Status, Leads Sourced From Market. All the content presented in this PPT design is completely editable. Download it and make adjustments in color, background, font etc. as per your unique business setting.
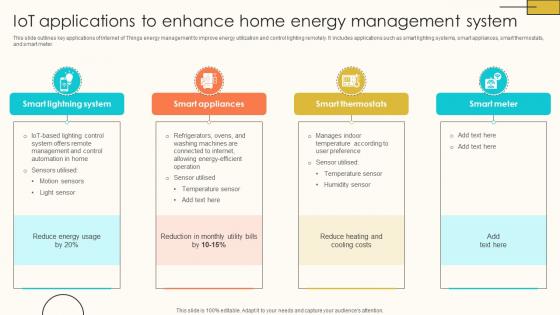
IoT Applications To Enhance Home Energy Internet Of Things Solutions To Enhance Energy IoT SS V
This slide outlines key applications of Internet of Things energy management to improve energy utilization and control lighting remotely. It includes applications such as smart lighting systems, smart appliances, smart thermostats, and smart meter. If you are looking for a format to display your unique thoughts, then the professionally designed IoT Applications To Enhance Home Energy Internet Of Things Solutions To Enhance Energy IoT SS V is the one for you. You can use it as a Google Slides template or a PowerPoint template. Incorporate impressive visuals, symbols, images, and other charts. Modify or reorganize the text boxes as you desire. Experiment with shade schemes and font pairings. Alter, share or cooperate with other people on your work. Download IoT Applications To Enhance Home Energy Internet Of Things Solutions To Enhance Energy IoT SS V and find out how to give a successful presentation. Present a perfect display to your team and make your presentation unforgettable. This slide outlines key applications of Internet of Things energy management to improve energy utilization and control lighting remotely. It includes applications such as smart lighting systems, smart appliances, smart thermostats, and smart meter.
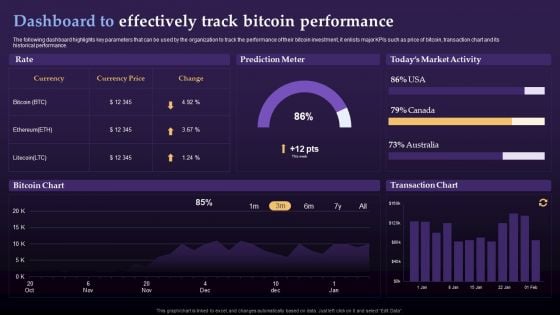
Virtual Currency Investment Guide For Companies Dashboard To Effectively Track Bitcoin Diagrams PDF
The following dashboard highlights key parameters that can be used by the organization to track the performance of their bitcoin investment, it enlists major KPIs such as price of bitcoin, transaction chart and its historical performance. Deliver an awe inspiring pitch with this creative Virtual Currency Investment Guide For Companies Dashboard To Effectively Track Bitcoin Diagrams PDF bundle. Topics like Prediction Meter, Todays Market Activity, Transaction Chart can be discussed with this completely editable template. It is available for immediate download depending on the needs and requirements of the user.
Gamification Strategy For Business Promotion Measuring ROI Of Gamification Strategy Diagrams PDF
Websites like LinkedIn are using badges to encourage users to keep updating their profiles. It encourages readers to complete all steps add their picture, work experience, location, education, and so on thereby filling the meter.Deliver an awe inspiring pitch with this creative Gamification Strategy For Business Promotion Measuring ROI Of Gamification Strategy Diagrams PDF bundle. Topics like Measuring ROI, Gamification Strategy can be discussed with this completely editable template. It is available for immediate download depending on the needs and requirements of the user.

Software Development Project Task Progress Scorecard Ideas PDF
This slide covers status summary of software development project and task allotment report. It includes details such as key stakeholders, tasks list, assigned person, start dates, top concerns, open actions, task meter,milestones, etc. Pitch your topic with ease and precision using this Software Development Project Task Progress Scorecard Ideas PDF. This layout presents information on Performance Analysis, Document Generation, Change Requests. It is also available for immediate download and adjustment. So, changes can be made in the color, design, graphics or any other component to create a unique layout.
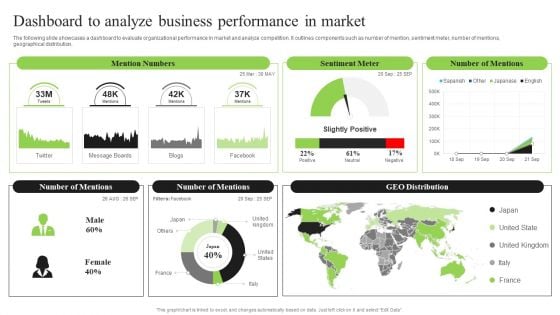
Guidebook For Executing Business Market Intelligence Dashboard To Analyze Business Brochure PDF
The following slide showcases a dashboard to evaluate organizational performance in market and analyze competition. It outlines components such as number of mention, sentiment meter, number of mentions, geographical distribution. Find a pre designed and impeccable Guidebook For Executing Business Market Intelligence Dashboard To Analyze Business Brochure PDF. The templates can ace your presentation without additional effort. You can download these easy to edit presentation templates to make your presentation stand out from others. So, what are you waiting for Download the template from Slidegeeks today and give a unique touch to your presentation.
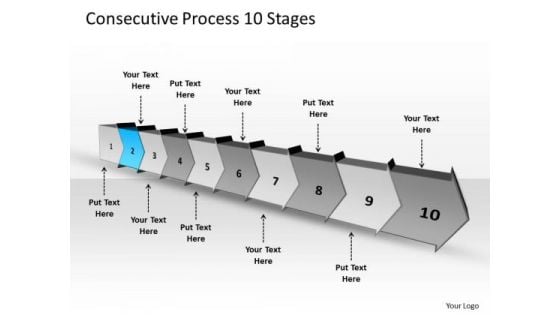
Consecutive Process 10 Stages Creating Flowchart PowerPoint Templates
We present our consecutive process 10 stages creating flowchart PowerPoint templates. Use our Arrows PowerPoint Templates because; you have the ideas to develop the teams vision of where they need to be in the future. Use our Business PowerPoint Templates because, you have played a stellar role and have a few ideas. Use our Shapes PowerPoint Templates because, prove how they mesh to motivate the company team and provide the steam to activate the composite machine. Use our Finance PowerPoint Templates because, our presentation designs are for those on the go. Use our Process and Flows PowerPoint Templates because, they are indicators of the path you have in mind. Use these PowerPoint slides for presentations relating to abstract arrow blank business chart circular circulation concept conceptual consecutive design diagram executive flow icon idea illustration management model numbers organization procedure process. The prominent colors used in the PowerPoint template are Blue, Gray, and Black Get the value of a lifetime with our Consecutive Process 10 Stages Creating Flowchart PowerPoint Templates. Dont waste time struggling with PowerPoint. Let us do it for you.
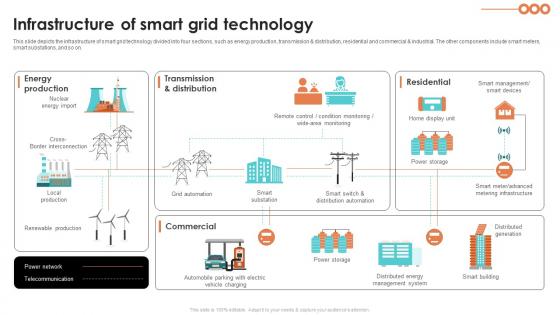
Infrastructure Of Smart Grid Technology Smart Grid Working
This slide depicts the infrastructure of smart grid technology divided into four sections, such as energy production, transmission and distribution, residential and commercial and industrial. The other components include smart meters, smart substations, and so on. Are you in need of a template that can accommodate all of your creative concepts This one is crafted professionally and can be altered to fit any style. Use it with Google Slides or PowerPoint. Include striking photographs, symbols, depictions, and other visuals. Fill, move around, or remove text boxes as desired. Test out color palettes and font mixtures. Edit and save your work, or work with colleagues. Download Infrastructure Of Smart Grid Technology Smart Grid Working and observe how to make your presentation outstanding. Give an impeccable presentation to your group and make your presentation unforgettable. This slide depicts the infrastructure of smart grid technology divided into four sections, such as energy production, transmission and distribution, residential and commercial and industrial. The other components include smart meters, smart substations, and so on.

Positive Impact Of Smart Home Systems Utilizing Smart Appliances IoT SS V
This slide provides an overview of the various smart systems used in homes and their benefits. It includes solar panels, home energy storage, electric vehicle, smart camera, speaker, blinds, water heater, thermostat, plugs, appliances, lights and meter. Retrieve professionally designed Positive Impact Of Smart Home Systems Utilizing Smart Appliances IoT SS V to effectively convey your message and captivate your listeners. Save time by selecting pre-made slideshows that are appropriate for various topics, from business to educational purposes. These themes come in many different styles, from creative to corporate, and all of them are easily adjustable and can be edited quickly. Access them as PowerPoint templates or as Google Slides themes. You do not have to go on a hunt for the perfect presentation because Slidegeeks got you covered from everywhere. This slide provides an overview of the various smart systems used in homes and their benefits. It includes solar panels, home energy storage, electric vehicle, smart camera, speaker, blinds, water heater, thermostat, plugs, appliances, lights and meter.
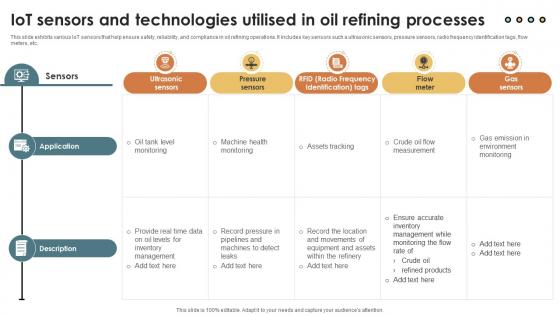
IoT Solutions For Oil IoT Sensors And Technologies Utilised In Oil Refining IoT SS V
This slide exhibits various IoT sensors that help ensure safety, reliability, and compliance in oil refining operations. It includes key sensors such a ultrasonic sensors, pressure sensors, radio frequency identification tags, flow meters, etc. Retrieve professionally designed IoT Solutions For Oil IoT Sensors And Technologies Utilised In Oil Refining IoT SS V to effectively convey your message and captivate your listeners. Save time by selecting pre-made slideshows that are appropriate for various topics, from business to educational purposes. These themes come in many different styles, from creative to corporate, and all of them are easily adjustable and can be edited quickly. Access them as PowerPoint templates or as Google Slides themes. You do not have to go on a hunt for the perfect presentation because Slidegeeks got you covered from everywhere. This slide exhibits various IoT sensors that help ensure safety, reliability, and compliance in oil refining operations. It includes key sensors such a ultrasonic sensors, pressure sensors, radio frequency identification tags, flow meters, etc.
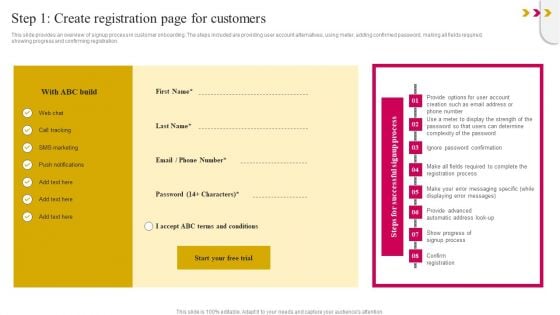
Step 1 Create Registration Page For Customers Guidelines PDF
This slide provides an overview of signup process in customer onboarding. The steps included are providing user account alternatives, using meter, adding confirmed password, making all fields required, showing progress and confirming registration. If you are looking for a format to display your unique thoughts, then the professionally designed Step 1 Create Registration Page For Customers Guidelines PDF is the one for you. You can use it as a Google Slides template or a PowerPoint template. Incorporate impressive visuals, symbols, images, and other charts. Modify or reorganize the text boxes as you desire. Experiment with shade schemes and font pairings. Alter, share or cooperate with other people on your work. Download Step 1 Create Registration Page For Customers Guidelines PDF and find out how to give a successful presentation. Present a perfect display to your team and make your presentation unforgettable.
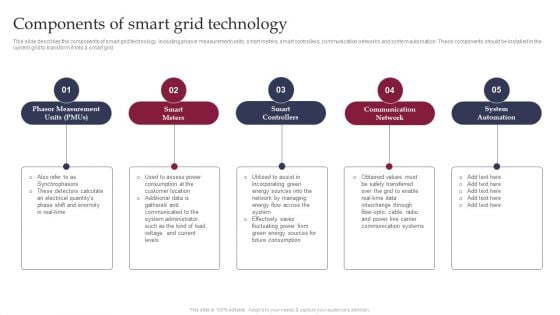
Smart Grid Technology Components Of Smart Grid Technology Rules PDF

Calculate Facebook Key Performance Indicator Ppt PowerPoint Presentation Complete Deck With Slides
This complete deck acts as a great communication tool. It helps you in conveying your business message with personalized sets of graphics, icons etc. Comprising a set of eleven slides, this complete deck can help you persuade your audience. It also induces strategic thinking as it has been thoroughly researched and put together by our experts. Not only is it easily downloadable but also editable. The color, graphics, theme any component can be altered to fit your individual needs. So grab it now.
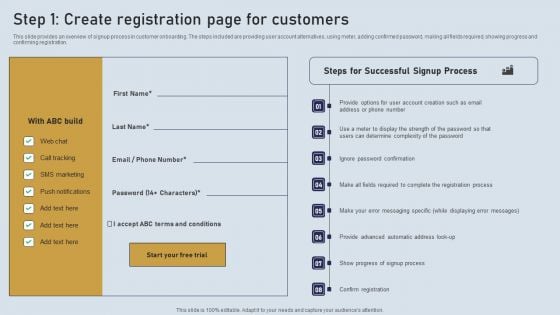
Onboarding Journey For Effective Client Communication Step 1 Create Registration Page For Customers Themes PDF
This slide provides an overview of signup process in customer onboarding. The steps included are providing user account alternatives, using meter, adding confirmed password, making all fields required, showing progress and confirming registration. Formulating a presentation can take up a lot of effort and time, so the content and message should always be the primary focus. The visuals of the PowerPoint can enhance the presenters message, so our Onboarding Journey For Effective Client Communication Step 1 Create Registration Page For Customers Themes PDF was created to help save time. Instead of worrying about the design, the presenter can concentrate on the message while our designers work on creating the ideal templates for whatever situation is needed. Slidegeeks has experts for everything from amazing designs to valuable content, we have put everything into Onboarding Journey For Effective Client Communication Step 1 Create Registration Page For Customers Themes PDF
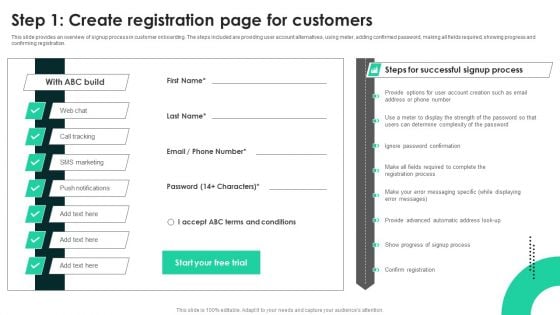
Techniques To Enhance User Onboarding Journey Step 1 Create Registration Page For Customers Themes PDF
This slide provides an overview of signup process in customer onboarding. The steps included are providing user account alternatives, using meter, adding confirmed password, making all fields required, showing progress and confirming registration. Welcome to our selection of the Techniques To Enhance User Onboarding Journey Step 1 Create Registration Page For Customers Themes PDF. These are designed to help you showcase your creativity and bring your sphere to life. Planning and Innovation are essential for any business that is just starting out. This collection contains the designs that you need for your everyday presentations. All of our PowerPoints are 100 percent editable, so you can customize them to suit your needs. This multi purpose template can be used in various situations. Grab these presentation templates today.
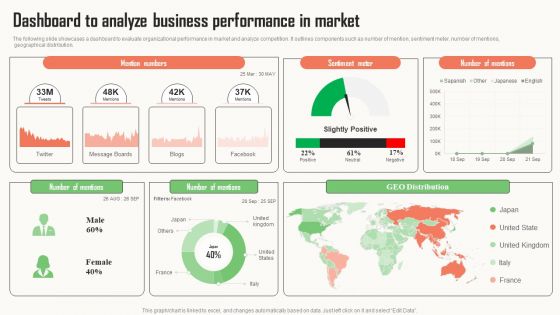
Strategic Market Insight Implementation Guide Dashboard To Analyze Business Performance In Market Slides PDF
The following slide showcases a dashboard to evaluate organizational performance in market and analyze competition. It outlines components such as number of mention, sentiment meter, number of mentions, geographical distribution. Get a simple yet stunning designed Strategic Market Insight Implementation Guide Dashboard To Analyze Business Performance In Market Slides PDF. It is the best one to establish the tone in your meetings. It is an excellent way to make your presentations highly effective. So, download this PPT today from Slidegeeks and see the positive impacts. Our easy to edit Strategic Market Insight Implementation Guide Dashboard To Analyze Business Performance In Market Slides PDF can be your go to option for all upcoming conferences and meetings. So, what are you waiting for Grab this template today.
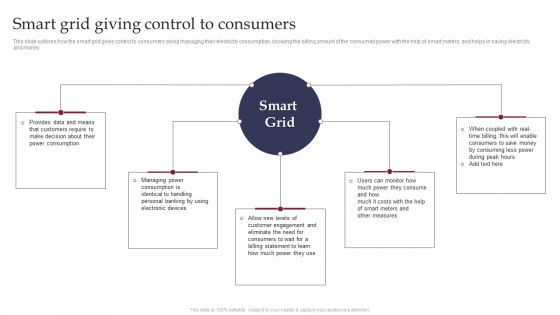
Smart Grid Technology Smart Grid Giving Control To Consumers Ideas PDF

Advance IT Service Delivery Methods To Drive Key Performance Indicators Related Business Results Complete Deck
This complete deck acts as a great communication tool. It helps you in conveying your business message with personalized sets of graphics, icons etc. Comprising a set of fifty six slides, this complete deck can help you persuade your audience. It also induces strategic thinking as it has been thoroughly researched and put together by our experts. Not only is it easily downloadable but also editable. The color, graphics, theme any component can be altered to fit your individual needs. So grab it now.
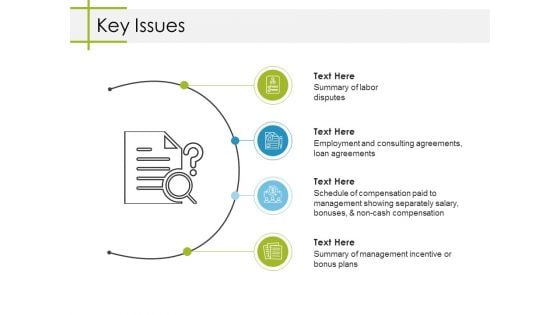
Key Issues Ppt PowerPoint Presentation Slides Deck
This is a key issues ppt powerpoint presentation slides deck. This is a four stage process. The stages in this process are key issues, business, marketing, icons, strategy.

The Problem Analysis And Solution Indication Ppt Examples
This is a the problem analysis and solution indication ppt examples. This is a four stage process. The stages in this process are icons, problem, business, management, finding.
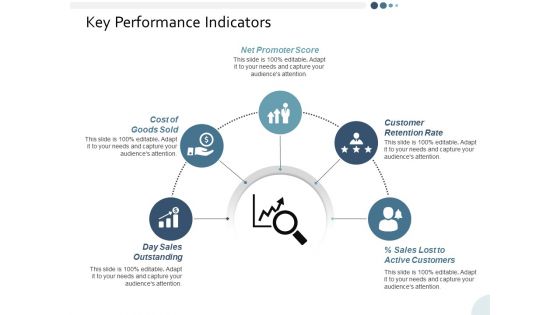
Key Performance Indicators Ppt PowerPoint Presentation Gallery Gridlines
This is a key performance indicators ppt powerpoint presentation gallery gridlines. This is a five stage process. The stages in this process are business, management, strategy, analysis, icons.
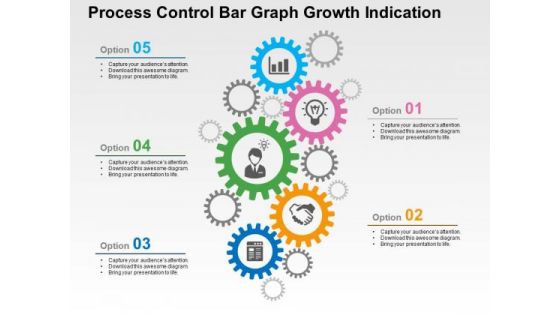
Process Control Bar Graph Growth Indication PowerPoint Template
Download our business slide with gear graphics to convincingly convey your important ideas in presentations. It also contains graphics of business icons. Create captivating presentations using this template
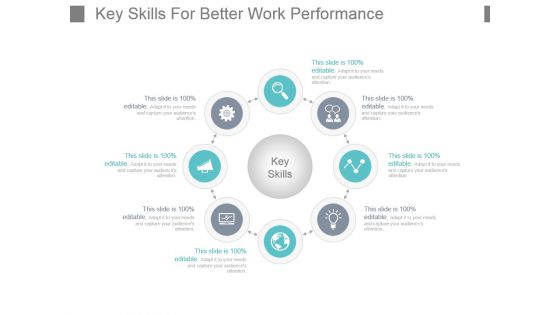
Key Skills For Better Work Performance Powerpoint Shapes
This is a key skills for better work performance powerpoint shapes. This is a four stage process. The stages in this process are key skills, flow, process, circle, icons.
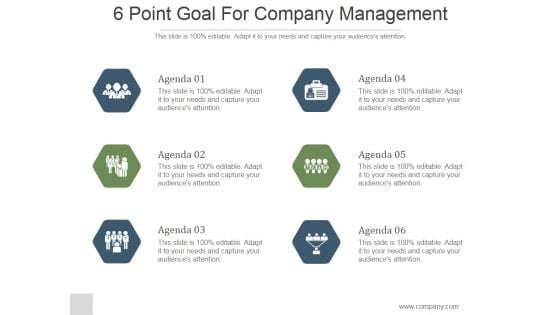
6 Point Goal For Company Management Ppt PowerPoint Presentation Slide
This is a 6 point goal for company management ppt powerpoint presentation slide. This is a six stage process. The stages in this process are agenda, business, strategy, icons, hexagon, marketing.
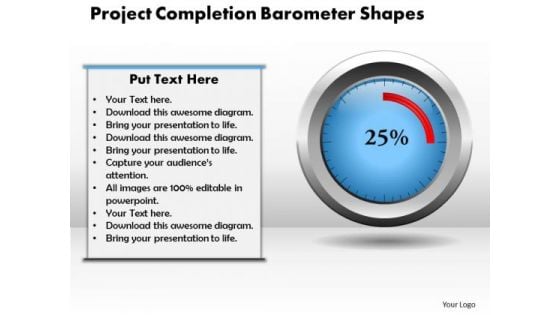
Project Completion Barometer PowerPoint Template
Draw On The Experience Of Our Project Completion Barometer PowerPoint Template Powerpoint Templates. They Imbibe From Past Masters. Drink The Nectar Of Our Business Charts Powerpoint Templates. Give Your Thoughts A Long Life.
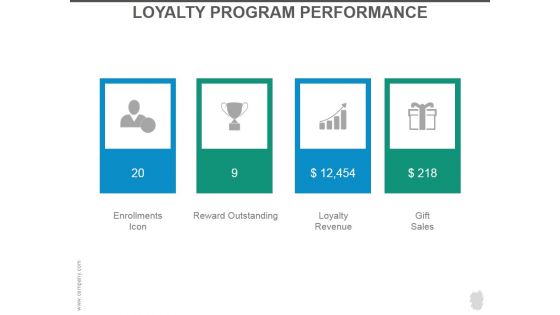
Loyalty Program Performance Ppt PowerPoint Presentation Slides
This is a loyalty program performance ppt powerpoint presentation slides. This is a four stage process. The stages in this process are enrollments icon, reward outstanding, loyalty revenue, gift sales.
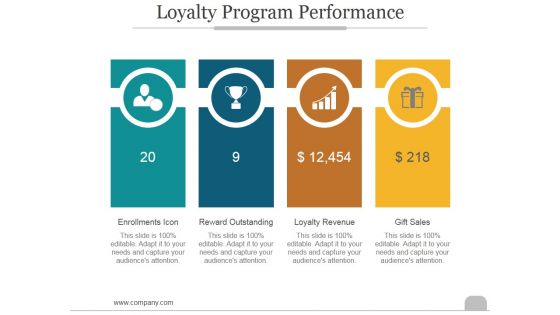
Loyalty Program Performance Ppt PowerPoint Presentation Introduction
This is a loyalty program performance ppt powerpoint presentation introduction. This is a four stage process. The stages in this process are enrollments icon, reward outstanding, loyalty revenue, gift sales.
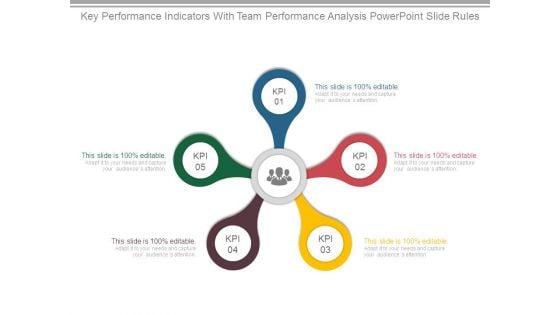
Key Performance Indicators With Team Performance Analysis Powerpoint Slide Rules
This is a key performance indicators with team performance analysis powerpoint slide rules. This is a five stage process. The stages in this process are business, strategy, marketing, success, process, icons.

Three Arrows For Business Process Indication Powerpoint Template
This business slide displays diagram of three arrows with icons. Download this diagram to display information in visual manner. Visual effect of this diagram helps in maintaining the flow of the discussion and provides more clarity to the subject.
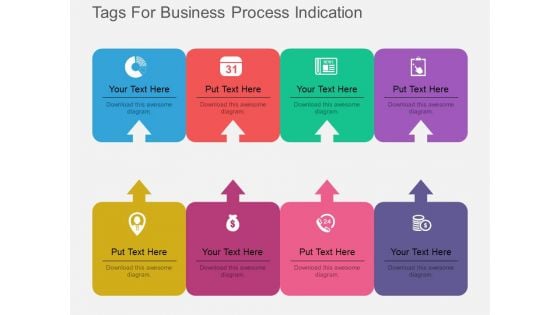
Eight Tags For Business Process Indication Powerpoint Template
Our above PPT slide contains graphics of eight text tags with icons. This PowerPoint template may be used to display business process steps. Use this diagram to impart more clarity to data and to create more sound impact on viewers.
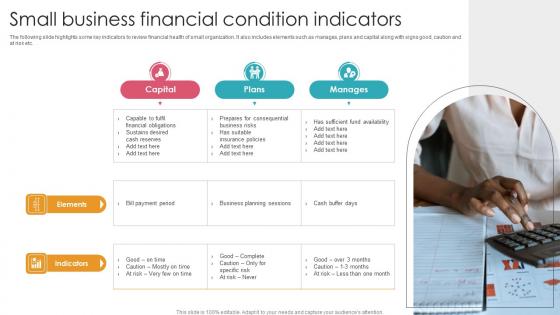
Small Business Financial Condition Indicators Themes Pdf
The following slide highlights some key indicators to review financial health of small organization. It also includes elements such as manages, plans and capital along with signs good, caution and at risk etc. Showcasing this set of slides titled Small Business Financial Condition Indicators Themes Pdf. The topics addressed in these templates are Elements, Indicators, Sustains Desired Cash Reserves. All the content presented in this PPT design is completely editable. Download it and make adjustments in color, background, font etc. as per your unique business setting. The following slide highlights some key indicators to review financial health of small organization. It also includes elements such as manages, plans and capital along with signs good, caution and at risk etc.
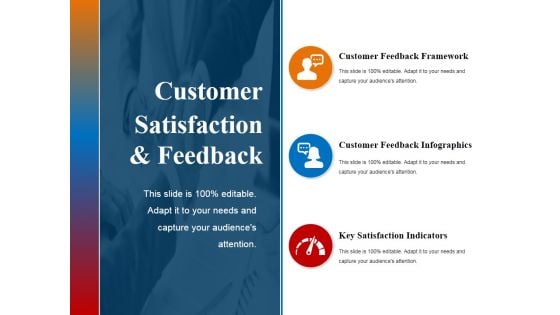
Customer Satisfaction And Feedback Ppt PowerPoint Presentation Inspiration Infographic Template
This is a customer satisfaction and feedback ppt powerpoint presentation inspiration infographic template. This is a three stage process. The stages in this process are customer feedback framework, customer feedback infographics, key satisfaction indicators, business, icons.
Customer Satisfaction And Feedback Ppt PowerPoint Presentation Infographic Template Master Slide
This is a customer satisfaction and feedback ppt powerpoint presentation infographic template master slide. This is a three stage process. The stages in this process are customer feedback framework, customer feedback infographics, key satisfaction indicators, business, icons.
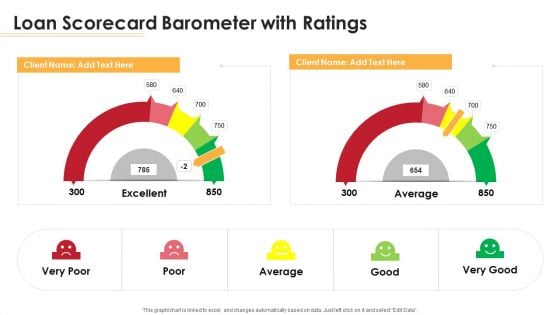
Loan Scorecard Barometer With Ratings Ppt Outline Information PDF
Deliver an awe inspiring pitch with this creative loan scorecard barometer with ratings ppt outline information pdf bundle. Topics like loan scorecard barometer with ratings can be discussed with this completely editable template. It is available for immediate download depending on the needs and requirements of the user.
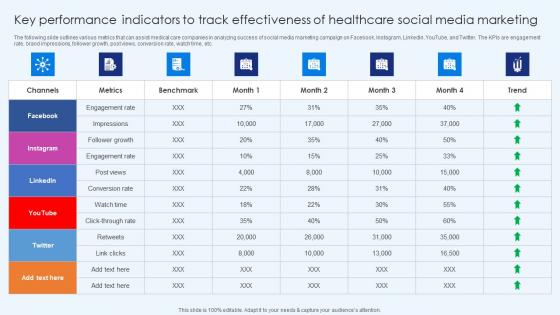
Key Performance Indicators To Tracks Effectiveness Healthcare Promotion Diagrams Pdf
The following slide outlines various metrics that can assist medical care companies in analyzing success of social media marketing campaign on Facebook, Instagram, LinkedIn, YouTube, and Twitter. The KPIs are engagement rate, brand impressions, follower growth, post views, conversion rate, watch time, etc. Slidegeeks has constructed Key Performance Indicators To Tracks Effectiveness Healthcare Promotion Diagrams Pdf after conducting extensive research and examination. These presentation templates are constantly being generated and modified based on user preferences and critiques from editors. Here, you will find the most attractive templates for a range of purposes while taking into account ratings and remarks from users regarding the content. This is an excellent jumping-off point to explore our content and will give new users an insight into our top-notch PowerPoint Templates. The following slide outlines various metrics that can assist medical care companies in analyzing success of social media marketing campaign on Facebook, Instagram, LinkedIn, YouTube, and Twitter. The KPIs are engagement rate, brand impressions, follower growth, post views, conversion rate, watch time, etc.
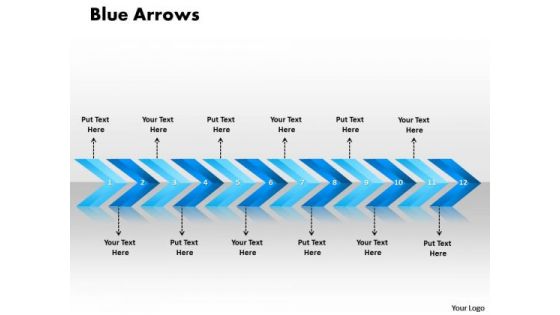
Ppt Linear Arrows 12 Phase Diagram PowerPoint Templates
PPT linear arrows 12 phase diagram PowerPoint Templates-This PowerPoint diagram depicts the sequence and illustration of the twelve steps in Horizontal manner.-PPT linear arrows 12 phase diagram PowerPoint Templates-Aim, Arrow, Arrowheads, Badge, Border, Click, Connection, Curve, Design, Direction, Download, Element, Fuchsia, Icon, Illustration, Indicator, Internet, Magenta, Mark, Object, Orientation, Pointer, Shadow, Shape, Sign Give birth to ambition with our Ppt Linear Arrows 12 Phase Diagram PowerPoint Templates. Let your thoughts design a dream.
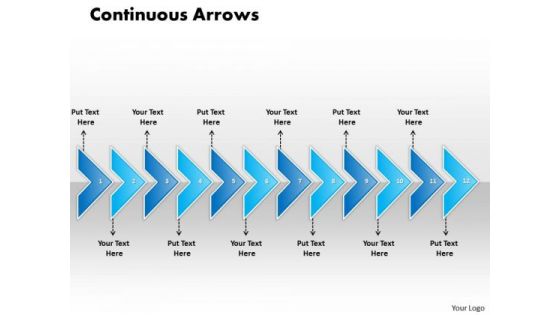
Ppt Linear Arrow 12 Phase Diagram PowerPoint Templates
PPT linear arrow 12 phase diagram PowerPoint Templates-In this Linear Arrow PPT Slide, arrows show the flow, or movement, of the sales plan from one step to the next. -PPT linear arrow 12 phase diagram PowerPoint Templates-Aim, Arrow, Arrowheads, Badge, Border, Click, Connection, Curve, Design, Direction, Download, Element, Fuchsia, Icon, Illustration, Indicator, Internet, Magenta, Mark, Object, Orientation, Pointer, Shadow, Shape, Sign Everything is feasible with our Ppt Linear Arrow 12 Phase Diagram PowerPoint Templates. They contain abundant dexterity.
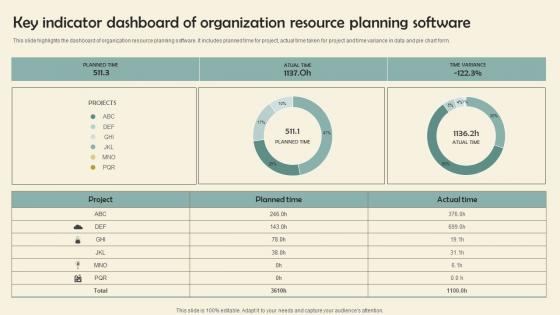
Key Indicator Dashboard Of Organization Resource Planning Software Themes Pdf
This slide highlights the dashboard of organization resource planning software. It includes planned time for project, actual time taken for project and time variance in data and pie chart form.Showcasing this set of slides titled Key Indicator Dashboard Of Organization Resource Planning Software Themes Pdf The topics addressed in these templates are Key Indicator, Dashboard Organization, Resource Planning Software All the content presented in this PPT design is completely editable. Download it and make adjustments in color, background, font etc. as per your unique business setting. This slide highlights the dashboard of organization resource planning software. It includes planned time for project, actual time taken for project and time variance in data and pie chart form.
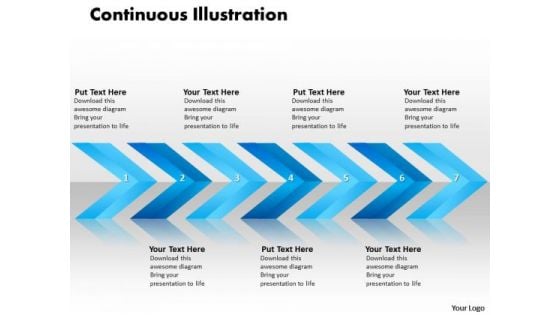
Ppt Linear Arrows 7 State PowerPoint Project Diagram Templates
PPT linear arrows 7 state powerpoint project diagram Templates-This PowerPoint template has the theme of Linear arrows. By using objects in this template you can compose your own process flow.-PPT linear arrows 7 state powerpoint project diagram Templates-Aim, Arrow, Arrowheads, Badge, Border, Click, Connection, Curve, Design, Direction, Download, Element, Fuchsia, Icon, Illustration, Indicator, Internet, Magenta, Mark, Object, Orientation, Pointer, Shadow, Shape, Sign Investigate problems with our Ppt Linear Arrows 7 State PowerPoint Project Diagram Templates. Download without worries with our money back guaranteee.

Fuel Gauge Indicating Empty And Full Levels Ppt PowerPoint Presentation Portfolio Clipart PDF
Presenting fuel gauge indicating empty and full levels ppt powerpoint presentation portfolio clipart pdf to dispense important information. This template comprises one stages. It also presents valuable insights into the topics including fuel gauge indicating empty and full levels. This is a completely customizable PowerPoint theme that can be put to use immediately. So, download it and address the topic impactfully.


 Continue with Email

 Home
Home


