Meter Icon
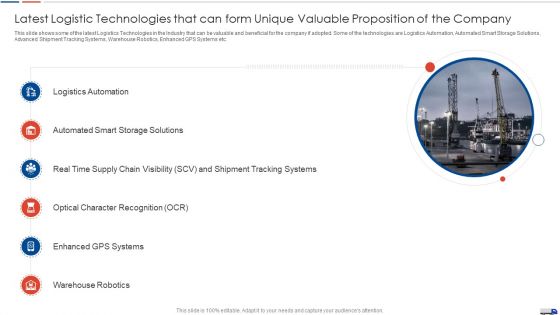
Strategies Create Good Proposition Latest Logistic Technologies That Can Form Unique Valuable Brochure PDF
This slide shows some of the latest Logistics Technologies in the Industry that can be valuable and beneficial for the company if adopted. Some of the technologies are Logistics Automation, Automated Smart Storage Solutions, Advanced Shipment Tracking Systems, Warehouse Robotics, Enhanced GPS Systems etc. Deliver and pitch your topic in the best possible manner with this strategies create good proposition latest logistic technologies that can form unique valuable brochure pdf. Use them to share invaluable insights on key performance indicators of hcl plus logistics company with future targets and impress your audience. This template can be altered and modified as per your expectations. So, grab it now.

Pmi Agile Scrum Master Certification It Key Facts And Figures About Pmi Acp Holders Topics PDF
Following slide portrays key facts and figures of active PMI agile certified practitioner certificate holders. Here the slide indicates that average salary of PMI ACP certificate holders is doller 123K per annum. Deliver an awe inspiring pitch with this creative pmi agile scrum master certification it key facts and figures about pmi acp holders topics pdf bundle. Topics like key facts and figures about pmi acp holders can be discussed with this completely editable template. It is available for immediate download depending on the needs and requirements of the user.
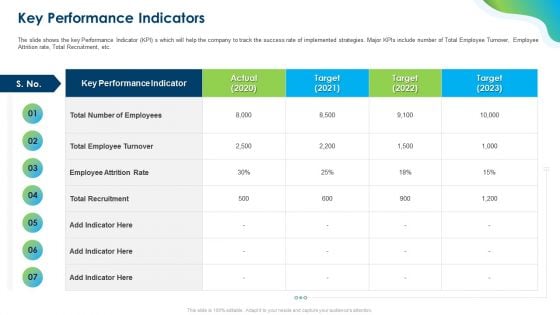
Growing Churn Rate In IT Organization Key Performance Indicators Summary PDF
Deliver an awe-inspiring pitch with this creative growing churn rate in it organization key performance indicators summary pdf bundle. Topics like total number of employees, total employee turnover, employee attrition rate can be discussed with this completely editable template. It is available for immediate download depending on the needs and requirements of the user.
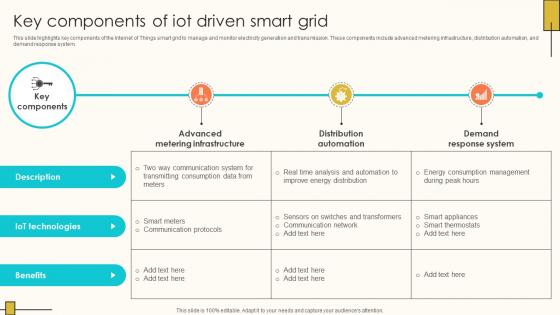
Key Components Of IoT Driven Smart Grid Internet Of Things Solutions To Enhance Energy IoT SS V
This slide highlights key components of the Internet of Things smart grid to manage and monitor electricity generation and transmission. These components include advanced metering infrastructure, distribution automation, and demand response system. Retrieve professionally designed Key Components Of IoT Driven Smart Grid Internet Of Things Solutions To Enhance Energy IoT SS V to effectively convey your message and captivate your listeners. Save time by selecting pre-made slideshows that are appropriate for various topics, from business to educational purposes. These themes come in many different styles, from creative to corporate, and all of them are easily adjustable and can be edited quickly. Access them as PowerPoint templates or as Google Slides themes. You do not have to go on a hunt for the perfect presentation because Slidegeeks got you covered from everywhere. This slide highlights key components of the Internet of Things smart grid to manage and monitor electricity generation and transmission. These components include advanced metering infrastructure, distribution automation, and demand response system.
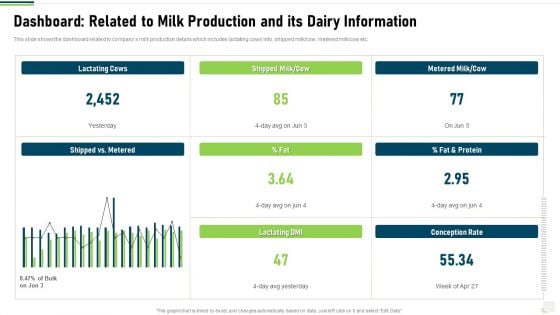
Dashboard Related To Milk Production And Its Dairy Information Diagrams PDF
This slide shows the dashboard related to companys milk production details which includes lactating cows info, shipped milk or cow, metered milk or cow etc. Deliver and pitch your topic in the best possible manner with this dashboard related to milk production and its dairy information diagrams pdf. Use them to share invaluable insights on dashboard related to milk production and its dairy information and impress your audience. This template can be altered and modified as per your expectations. So, grab it now.
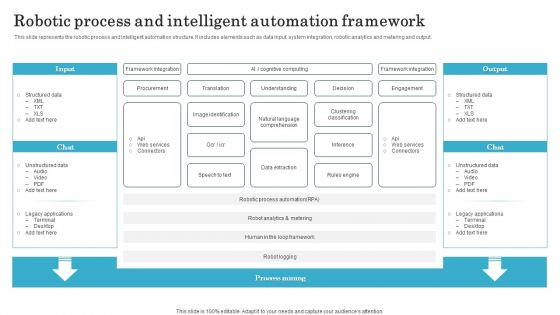
Robotic Process And Intelligent Automation Framework Diagrams PDF
This slide represents the robotic process and intelligent automation structure. It includes elements such as data input, system integration, robotic analytics and metering and output. Pitch your topic with ease and precision using this Robotic Process And Intelligent Automation Framework Diagrams PDF. This layout presents information on Robotic Process, Intelligent Automation Framework. It is also available for immediate download and adjustment. So, changes can be made in the color, design, graphics or any other component to create a unique layout.
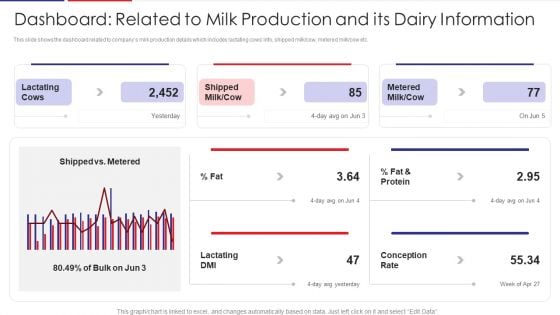
Examination Of Buyer Mindset Towards Dairy Products Dashboard Related To Milk Production Sample PDF
This slide shows the dashboard related to companys milk production details which includes lactating cows info, shipped milk or cow, metered milk or cow etc. Deliver an awe inspiring pitch with this creative examination of buyer mindset towards dairy products dashboard related to milk production sample pdf bundle. Topics like dashboard related to milk production and its dairy information can be discussed with this completely editable template. It is available for immediate download depending on the needs and requirements of the user.
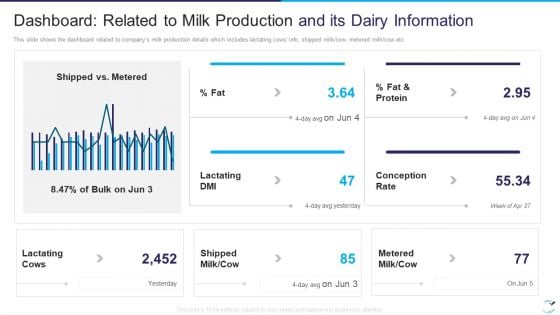
Factor Influencing User Experience Dairy Industry Dashboard Related To Milk Production Guidelines PDF
This slide shows the dashboard related to companys milk production details which includes lactating cows info, shipped milkcow, metered milk cow etc. Deliver and pitch your topic in the best possible manner with this factor influencing user experience dairy industry dashboard related to milk production guidelines pdf . Use them to share invaluable insights on dashboard related to milk production and its dairy information and impress your audience. This template can be altered and modified as per your expectations. So, grab it now.
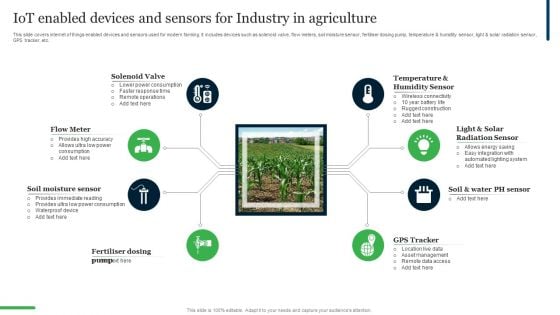
Iot Enabled Devices And Sensors For Industry In Agriculture Ppt PowerPoint Presentation Gallery Show PDF
This slide covers internet of things enabled devices and sensors used for modern farming. It includes devices such as solenoid valve, flow meters, soil moisture sensor, fertiliser dosing pump, temperature and humidity sensor, light ans solar radiation sensor, GPS tracker, etc. Presenting Iot Enabled Devices And Sensors For Industry In Agriculture Ppt PowerPoint Presentation Gallery Show PDF to dispense important information. This template comprises eight stages. It also presents valuable insights into the topics including Solenoid Valve, Flow Meter, Soil Moisture Sensor. This is a completely customizable PowerPoint theme that can be put to use immediately. So, download it and address the topic impactfully.
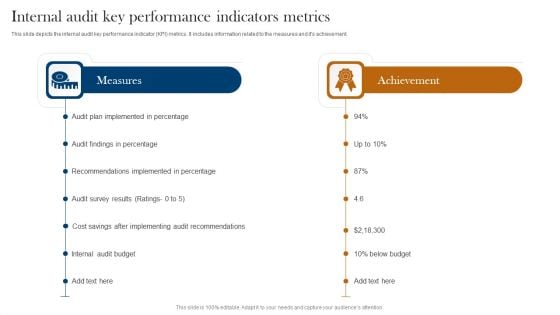
Internal Audit Key Performance Indicators Metrics Inspiration PDF
This slide depicts the internal audit key performance indicator KPI metrics. It includes information related to the measures and its achievement. Persuade your audience using this Internal Audit Key Performance Indicators Metrics Inspiration PDF. This PPT design covers two stages, thus making it a great tool to use. It also caters to a variety of topics including Measures, Achievement, Audit Findings Percentage. Download this PPT design now to present a convincing pitch that not only emphasizes the topic but also showcases your presentation skills.
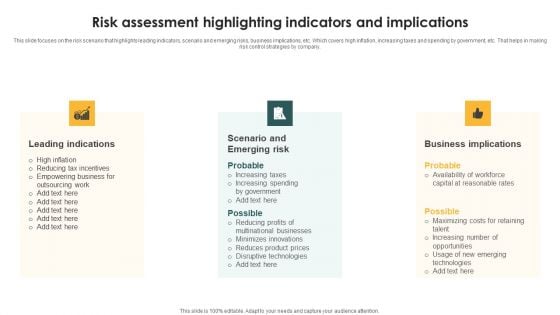
Risk Assessment Highlighting Indicators And Implications Ppt PowerPoint Presentation Gallery Elements PDF
This slide focuses on the risk scenario that highlights leading indicators, scenario and emerging risks, business implications, etc. Which covers high inflation, increasing taxes and spending by government, etc. That helps in making risk control strategies by company. Persuade your audience using this Risk Assessment Highlighting Indicators And Implications Ppt PowerPoint Presentation Gallery Elements PDF. This PPT design covers three stages, thus making it a great tool to use. It also caters to a variety of topics including Leading Indications, Scenario Emerging Risk, Business Implications. Download this PPT design now to present a convincing pitch that not only emphasizes the topic but also showcases your presentation skills.
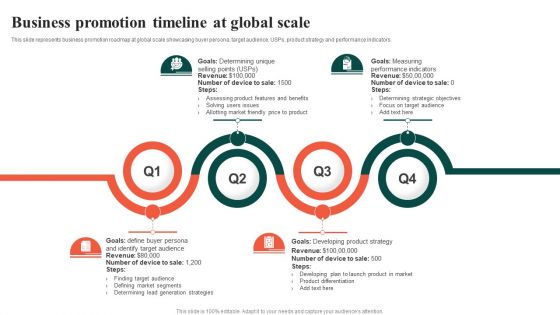
Business Promotion Timeline At Global Scale Ppt Show Infographic Template PDF
This slide represents business promotion roadmap at global scale showcasing buyer persona, target audience, USPs, product strategy and performance indicators. Presenting Business Promotion Timeline At Global Scale Ppt Show Infographic Template PDF to dispense important information. This template comprises four stages. It also presents valuable insights into the topics including Measuring, Performance Indicators, Goals. This is a completely customizable PowerPoint theme that can be put to use immediately. So, download it and address the topic impactfully.
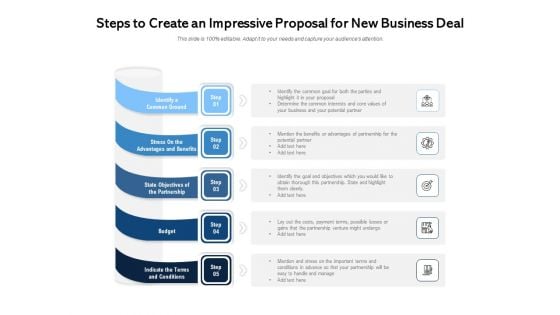
Steps To Create An Impressive Proposal For New Business Deal Ppt PowerPoint Presentation Summary Templates PDF
Presenting steps to create an impressive proposal for new business deal ppt powerpoint presentation summary templates pdf to dispense important information. This template comprises five stages. It also presents valuable insights into the topics including identify a common ground, stress on the advantages and benefits, state objectives of the partnership, budget indicate the terms and conditions. This is a completely customizable PowerPoint theme that can be put to use immediately. So, download it and address the topic impactfully.

Data Analytics Metrics For Internal Audit Ppt Model Outfit PDF
This slide covers the KPIs key performance indicators of data analytics for conducting internal audit. It includes information related to the reporting, planning and audit execution. Presenting Data Analytics Metrics For Internal Audit Ppt Model Outfit PDF to dispense important information. This template comprises three stages. It also presents valuable insights into the topics including Planning, Audit Execution, Reporting. This is a completely customizable PowerPoint theme that can be put to use immediately. So, download it and address the topic impactfully.
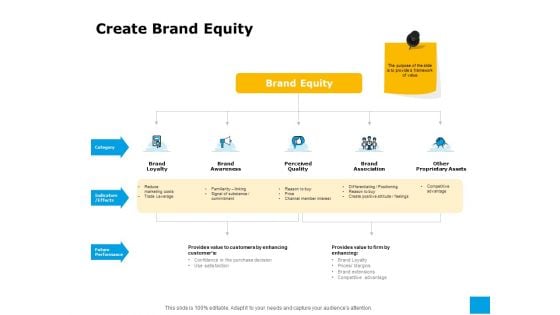
Effective Advertising And Sales Management Create Brand Equity Ppt PowerPoint Presentation Professional Show PDF
Presenting effective advertising and sales management create brand equity ppt powerpoint presentation professional show pdf to provide visual cues and insights. Share and navigate important information on five stages that need your due attention. This template can be used to pitch topics like brand loyalty, brand awareness, perceived quality, brand associations, other proprietary assets, indicators. In addition, this PPT design contains high-resolution images, graphics, etc, that are easily editable and available for immediate download.
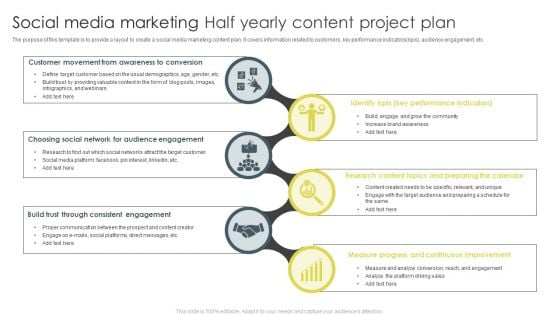
Social Media Marketing Half Yearly Content Project Plan Ppt Layouts Graphic Images PDF
The purpose of this template is to provide a layout to create a social media marketing content plan. It covers information related to customers, key performance indicators kpis, audience engagement, etc. Presenting Social Media Marketing Half Yearly Content Project Plan Ppt Layouts Graphic Images PDF to dispense important information. This template comprises six stages. It also presents valuable insights into the topics including Customer Movement, Awareness To Conversion, Consistent Engagement. This is a completely customizable PowerPoint theme that can be put to use immediately. So, download it and address the topic impactfully.
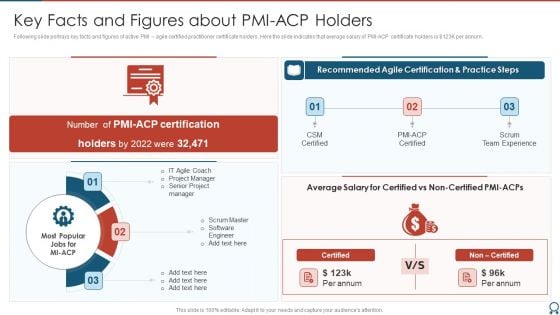
Agile Certified Professional Key Facts And Figures About PMI ACP Holders Ideas PDF
Following slide portrays key facts and figures of active PMI agile certified practitioner certificate holders. Here the slide indicates that average salary of PMI ACP certificate holders is dollar 123K per annum. Presenting Agile Certified Professional Key Facts And Figures About PMI ACP Holders Ideas PDF to provide visual cues and insights. Share and navigate important information on three stages that need your due attention. This template can be used to pitch topics like IT Agile Coach, Project Manager, Senior Project Manager. In addtion, this PPT design contains high resolution images, graphics, etc, that are easily editable and available for immediate download.
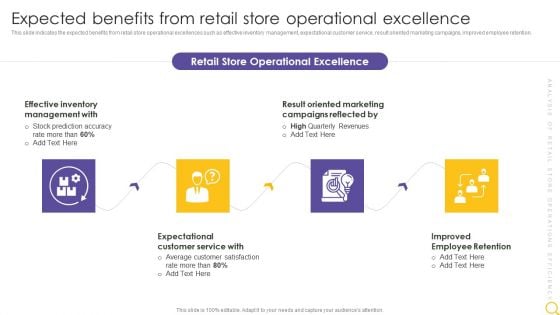
Retail Outlet Operational Efficiency Analytics Expected Benefits From Retail Store Professional PDF
This slide indicates the expected benefits from retail store operational excellences such as effective inventory management, expectational customer service, result oriented marketing campaigns, improved employee retention. This is a Retail Outlet Operational Efficiency Analytics Expected Benefits From Retail Store Professional PDF template with various stages. Focus and dispense information on four stages using this creative set, that comes with editable features. It contains large content boxes to add your information on topics like Effective Inventory Management, Result Oriented, Marketing Campaigns. You can also showcase facts, figures, and other relevant content using this PPT layout. Grab it now.
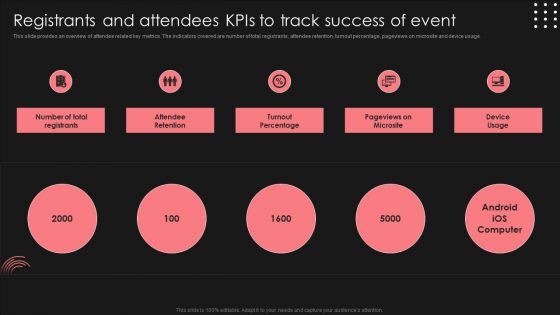
Positive Impact Of Effective Registrants And Attendees Kpis To Track Success Of Event Structure PDF
This slide provides an overview of attendee related key metrics. The indicators covered are number of total registrants, attendee retention, turnout percentage, pageviews on microsite and device usage. The best PPT templates are a great way to save time, energy, and resources. Slidegeeks have 100 percent editable powerpoint slides making them incredibly versatile. With these quality presentation templates, you can create a captivating and memorable presentation by combining visually appealing slides and effectively communicating your message. Download Positive Impact Of Effective Registrants And Attendees Kpis To Track Success Of Event Structure PDF from Slidegeeks and deliver a wonderful presentation.
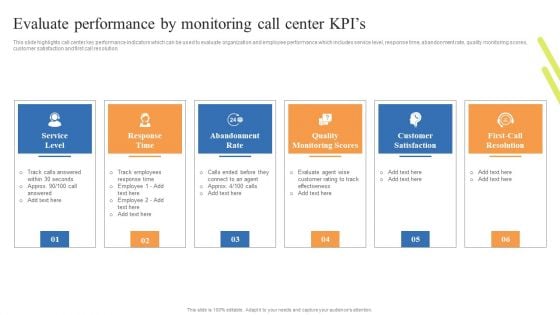
Customer Support Center Evaluate Performance By Monitoring Call Center Kpis Professional PDF
This slide highlights call center key performance indicators which can be used to evaluate organization and employee performance which includes service level, response time, abandonment rate, quality monitoring scores, customer satisfaction and first call resolution. Find highly impressive Customer Support Center Evaluate Performance By Monitoring Call Center Kpis Professional PDF on Slidegeeks to deliver a meaningful presentation. You can save an ample amount of time using these presentation templates. No need to worry to prepare everything from scratch because Slidegeeks experts have already done a huge research and work for you. You need to download Customer Support Center Evaluate Performance By Monitoring Call Center Kpis Professional PDF for your upcoming presentation. All the presentation templates are 100 percent editable and you can change the color and personalize the content accordingly. Download now
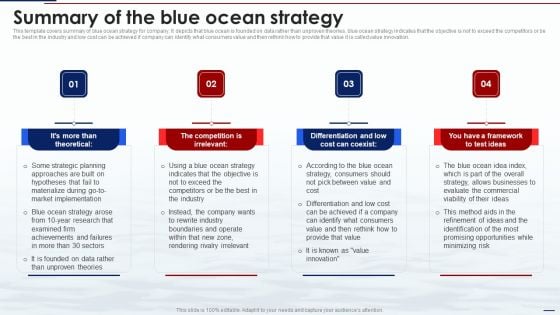
Blue Ocean Tactics Summary Of The Blue Ocean Strategy Ppt Ideas Visuals PDF
This template covers summary of blue ocean strategy for company. It depicts that blue ocean is founded on data rather than unproven theories, blue ocean strategy indicates that the objective is not to exceed the competitors or be the best in the industry and low cost can be achieved if company can identify what consumers value and then rethink how to provide that value it is called value innovation. Whether you have daily or monthly meetings, a brilliant presentation is necessary. Blue Ocean Tactics Summary Of The Blue Ocean Strategy Ppt Ideas Visuals PDF can be your best option for delivering a presentation. Represent everything in detail using Blue Ocean Tactics Summary Of The Blue Ocean Strategy Ppt Ideas Visuals PDF and make yourself stand out in meetings. The template is versatile and follows a structure that will cater to your requirements. All the templates prepared by Slidegeeks are easy to download and edit. Our research experts have taken care of the corporate themes as well. So, give it a try and see the results.
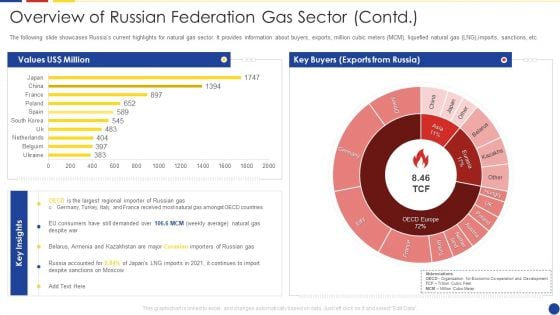
Analyzing The Impact Of Russia Ukraine Conflict On Gas Sector Overview Of Russian Federation Gas Sector Contd Sample PDF
The following slide showcases Russias current highlights for natural gas sector. It provides information about buyers, exports, million cubic meters MCM, liquefied natural gas LNG,imports, sanctions, etc. Deliver an awe inspiring pitch with this creative analyzing the impact of russia ukraine conflict on gas sector overview of russian federation gas sector contd sample pdf bundle. Topics like overview of russian federation gas sector contd can be discussed with this completely editable template. It is available for immediate download depending on the needs and requirements of the user.
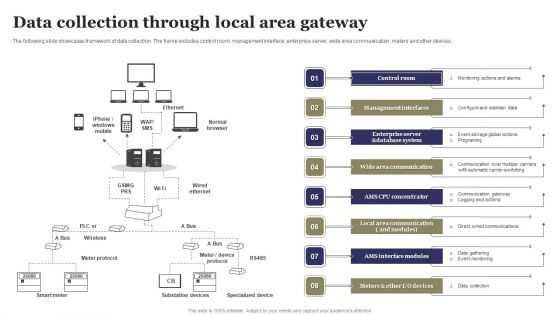
Data Collection Through Local Area Gateway Ppt PowerPoint Presentation File Design Ideas PDF
The following slide showcases framework of data collection. The frame includes control room, management interface, enterprise server, wide area communication, meters and other devices. Presenting Data Collection Through Local Area Gateway Ppt PowerPoint Presentation File Design Ideas PDF to dispense important information. This template comprises eight stages. It also presents valuable insights into the topics including Control Room, Management Interfaces, Wide Area Communication. This is a completely customizable PowerPoint theme that can be put to use immediately. So, download it and address the topic impactfully.
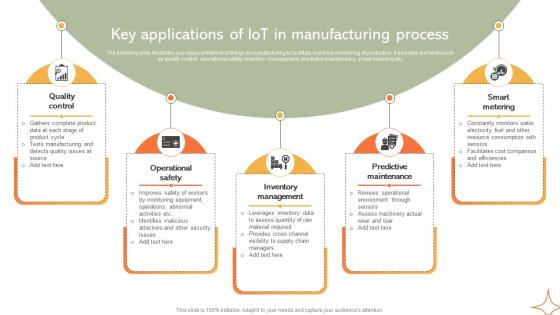
Key Applications Of IoT In Manufacturing Process Implementing Manufacturing Strategy SS V
The following slide illustrates use cases of internet of things in manufacturing to facilitate real time monitoring of production. It includes elements such as quality control, operational safety, inventory management, predictive maintenance, smart metering etc. Are you searching for a Key Applications Of IoT In Manufacturing Process Implementing Manufacturing Strategy SS V that is uncluttered, straightforward, and original Its easy to edit, and you can change the colors to suit your personal or business branding. For a presentation that expresses how much effort you have put in, this template is ideal With all of its features, including tables, diagrams, statistics, and lists, its perfect for a business plan presentation. Make your ideas more appealing with these professional slides. Download Key Applications Of IoT In Manufacturing Process Implementing Manufacturing Strategy SS V from Slidegeeks today. The following slide illustrates use cases of internet of things in manufacturing to facilitate real time monitoring of production. It includes elements such as quality control, operational safety, inventory management, predictive maintenance, smart metering etc.
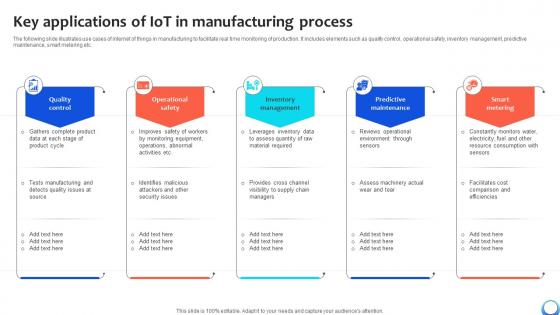
Key Applications Of IoT In Manufacturing Process Automating Production Process Strategy SS V
The following slide illustrates use cases of internet of things in manufacturing to facilitate real time monitoring of production. It includes elements such as quality control, operational safety, inventory management, predictive maintenance, smart metering etc. Are you searching for a Key Applications Of IoT In Manufacturing Process Automating Production Process Strategy SS V that is uncluttered, straightforward, and original Its easy to edit, and you can change the colors to suit your personal or business branding. For a presentation that expresses how much effort you have put in, this template is ideal With all of its features, including tables, diagrams, statistics, and lists, its perfect for a business plan presentation. Make your ideas more appealing with these professional slides. Download Key Applications Of IoT In Manufacturing Process Automating Production Process Strategy SS V from Slidegeeks today. The following slide illustrates use cases of internet of things in manufacturing to facilitate real time monitoring of production. It includes elements such as quality control, operational safety, inventory management, predictive maintenance, smart metering etc.
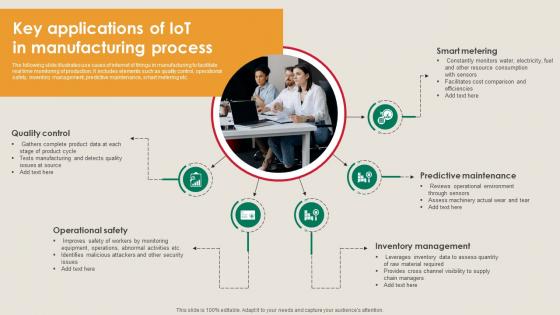
Key Applications Of IoT In Manufacturing Process Manufacturing Strategy Driving Industry 4 0
The following slide illustrates use cases of internet of things in manufacturing to facilitate real time monitoring of production. It includes elements such as quality control, operational safety, inventory management, predictive maintenance, smart metering etc. Are you searching for a Key Applications Of IoT In Manufacturing Process Manufacturing Strategy Driving Industry 4 0 that is uncluttered, straightforward, and original Its easy to edit, and you can change the colors to suit your personal or business branding. For a presentation that expresses how much effort you have put in, this template is ideal With all of its features, including tables, diagrams, statistics, and lists, its perfect for a business plan presentation. Make your ideas more appealing with these professional slides. Download Key Applications Of IoT In Manufacturing Process Manufacturing Strategy Driving Industry 4 0 from Slidegeeks today. The following slide illustrates use cases of internet of things in manufacturing to facilitate real time monitoring of production. It includes elements such as quality control, operational safety, inventory management, predictive maintenance, smart metering etc.
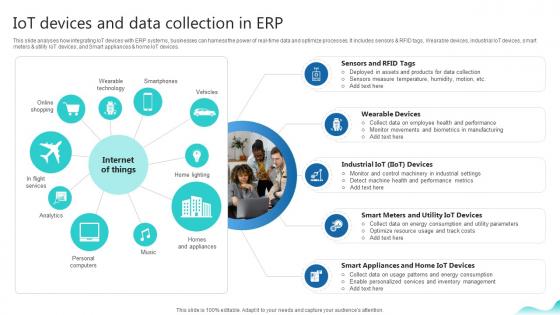
Iot Devices And Data Collection In Erp Erp And Digital Transformation For Maximizing DT SS V
This slide analyses how integrating IoT devices with ERP systems, businesses can harness the power of real-time data and optimize processes. It includes sensors and RFID tags, Wearable devices, industrial IoT devices, smart meters and utility IoT devices, and Smart appliances and home IoT devices.Whether you have daily or monthly meetings, a brilliant presentation is necessary. Iot Devices And Data Collection In Erp Erp And Digital Transformation For Maximizing DT SS V can be your best option for delivering a presentation. Represent everything in detail using Iot Devices And Data Collection In Erp Erp And Digital Transformation For Maximizing DT SS V and make yourself stand out in meetings. The template is versatile and follows a structure that will cater to your requirements. All the templates prepared by Slidegeeks are easy to download and edit. Our research experts have taken care of the corporate themes as well. So, give it a try and see the results. This slide analyses how integrating IoT devices with ERP systems, businesses can harness the power of real-time data and optimize processes. It includes sensors and RFID tags, Wearable devices, industrial IoT devices, smart meters and utility IoT devices, and Smart appliances and home IoT devices.

Framework Indicating Unit Automated Testing Pyramid Ppt Styles Portfolio PDF
This slide shows framework indicating unit test automation pyramid which can be referred by IT firms which want to improve their services for developing user experiences. It contains information about graphical user interface GUI, approval tests, unit tests, element tests, frameworks, business and development oriented aspects. Presenting Framework Indicating Unit Automated Testing Pyramid Ppt Styles Portfolio PDF to dispense important information. This template comprises three stages. It also presents valuable insights into the topics including Business Oriented Aspects, Development Oriented Aspects, Test Automation Pyramid. This is a completely customizable PowerPoint theme that can be put to use immediately. So, download it and address the topic impactfully.
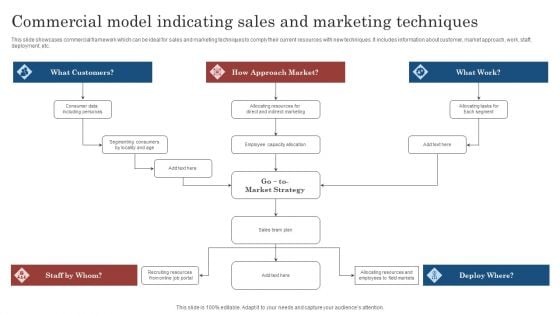
Commercial Model Indicating Sales And Marketing Techniques Ppt File Maker PDF
This slide showcases commercial framework which can be ideal for sales and marketing techniques to comply their current resources with new techniques. It includes information about customer, market approach, work, staff, deployment, etc. Persuade your audience using this Commercial Model Indicating Sales And Marketing Techniques Ppt File Maker PDF. This PPT design covers five stages, thus making it a great tool to use. It also caters to a variety of topics including Customers, Approach Market, Market Strategy . Download this PPT design now to present a convincing pitch that not only emphasizes the topic but also showcases your presentation skills.
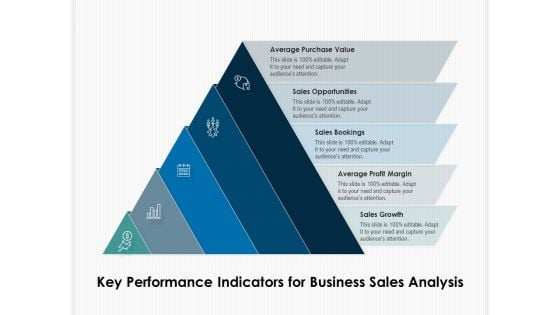
Key Performance Indicators For Business Sales Analysis Ppt PowerPoint Presentation Infographic Template Introduction PDF
Presenting key performance indicators for business sales analysis ppt powerpoint presentation infographic template introduction pdf to dispense important information. This template comprises five stages. It also presents valuable insights into the topics including average purchase value, sales opportunities, sales bookings, average profit margin, sales growth. This is a completely customizable PowerPoint theme that can be put to use immediately. So, download it and address the topic impactfully.
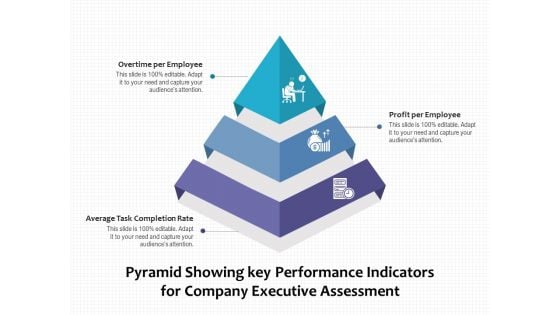
Pyramid Showing Key Performance Indicators For Company Executive Assessment Ppt PowerPoint Presentation Portfolio Rules PDF
Presenting pyramid showing key performance indicators for company executive assessment ppt powerpoint presentation portfolio rules pdf to dispense important information. This template comprises three stages. It also presents valuable insights into the topics including overtime per employee, profit per employee, average task completion rate. This is a completely customizable PowerPoint theme that can be put to use immediately. So, download it and address the topic impactfully.
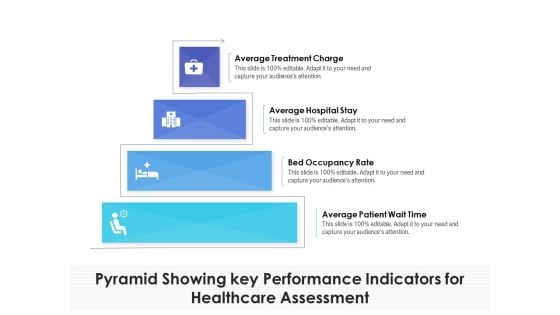
Pyramid Showing Key Performance Indicators For Healthcare Assessment Ppt PowerPoint Presentation Show Background Image PDF
Presenting pyramid showing key performance indicators for healthcare assessment ppt powerpoint presentation show background image pdf to dispense important information. This template comprises four stages. It also presents valuable insights into the topics including average treatment charge, average hospital stay, bed occupancy rate, average patient wait time. This is a completely customizable PowerPoint theme that can be put to use immediately. So, download it and address the topic impactfully.
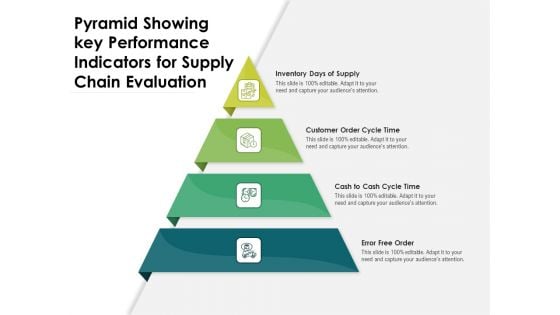
Pyramid Showing Key Performance Indicators For Supply Chain Evaluation Ppt PowerPoint Presentation Pictures Introduction PDF
Presenting pyramid showing key performance indicators for supply chain evaluation ppt powerpoint presentation pictures introduction pdf to dispense important information. This template comprises four stages. It also presents valuable insights into the topics including inventory days of supply, customer order cycle time, cash to cash cycle time, error free order. This is a completely customizable PowerPoint theme that can be put to use immediately. So, download it and address the topic impactfully.
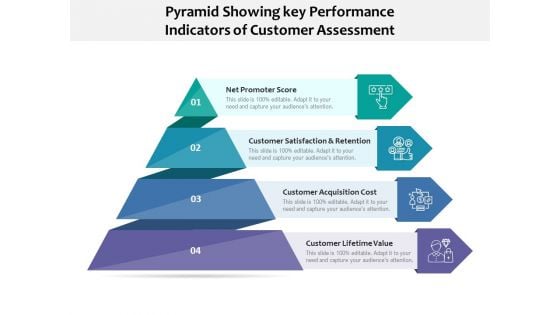
Pyramid Showing Key Performance Indicators Of Customer Assessment Ppt PowerPoint Presentation Styles Graphics Template PDF
Presenting pyramid showing key performance indicators of customer assessment ppt powerpoint presentation styles graphics template pdf to dispense important information. This template comprises four stages. It also presents valuable insights into the topics including net promoter score, customer satisfaction and retention, customer acquisition cost, customer lifetime value. This is a completely customizable PowerPoint theme that can be put to use immediately. So, download it and address the topic impactfully.
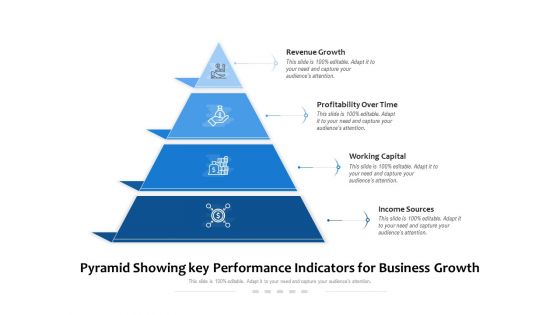
Pyramid Showing Key Performance Indicators For Business Growth Ppt PowerPoint Presentation Layouts Introduction PDF
Persuade your audience using this pyramid showing key performance indicators for business growth ppt powerpoint presentation layouts introduction pdf. This PPT design covers four stages, thus making it a great tool to use. It also caters to a variety of topics including revenue growth, profitability over time, working capital, income sources. Download this PPT design now to present a convincing pitch that not only emphasizes the topic but also showcases your presentation skills.
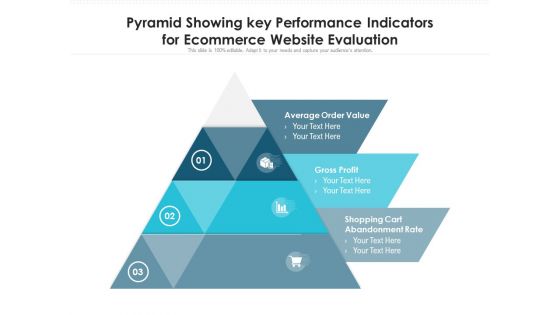
Pyramid Showing Key Performance Indicators For Ecommerce Website Evaluation Ppt PowerPoint Presentation Portfolio Layout Ideas PDF
Persuade your audience using this pyramid showing key performance indicators for ecommerce website evaluation ppt powerpoint presentation portfolio layout ideas pdf. This PPT design covers three stages, thus making it a great tool to use. It also caters to a variety of topics including average order value, gross profit, shopping cart abandonment rate. Download this PPT design now to present a convincing pitch that not only emphasizes the topic but also showcases your presentation skills.
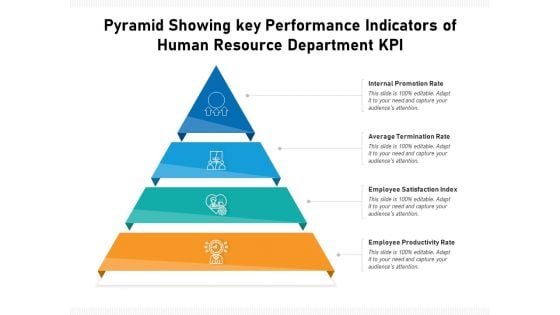
Pyramid Showing Key Performance Indicators Of Human Resource Department KPI Ppt PowerPoint Presentation Infographics Samples PDF
Persuade your audience using this pyramid showing key performance indicators of human resource department kpi ppt powerpoint presentation infographics samples pdf. This PPT design covers four stages, thus making it a great tool to use. It also caters to a variety of topics including internal promotion rate, average termination rate, employee satisfaction index, employee productivity rate. Download this PPT design now to present a convincing pitch that not only emphasizes the topic but also showcases your presentation skills.
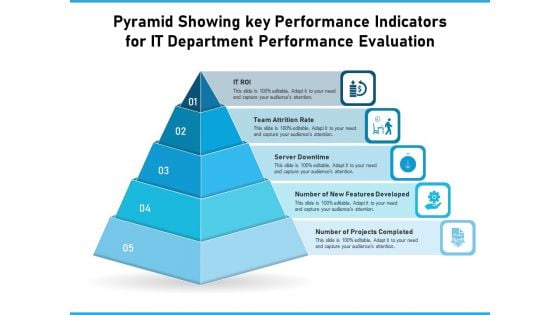
Pyramid Showing Key Performance Indicators For IT Department Performance Evaluation Ppt PowerPoint Presentation Show Graphics Design PDF
Persuade your audience using this pyramid showing key performance indicators for it department performance evaluation ppt powerpoint presentation show graphics design pdf. This PPT design covers five stages, thus making it a great tool to use. It also caters to a variety of topics including it roi, team attrition rate, server downtime, number of new features developed, number of projects completed. Download this PPT design now to present a convincing pitch that not only emphasizes the topic but also showcases your presentation skills.
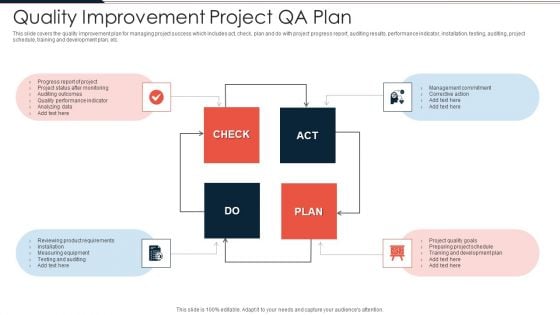
Quality Improvement Project QA Plan Ppt PowerPoint Presentation Gallery Themes PDF
This slide covers the quality improvement plan for managing project success which includes act, check, plan and do with project progress report, auditing results, performance indicator, installation, testing, auditing, project schedule, training and development plan, etc. Persuade your audience using this quality improvement project qa plan ppt powerpoint presentation gallery themes pdf. This PPT design covers four stages, thus making it a great tool to use. It also caters to a variety of topics including progress report of project, project status after monitoring, auditing outcomes, quality performance indicator, analyzing data. Download this PPT design now to present a convincing pitch that not only emphasizes the topic but also showcases your presentation skills.
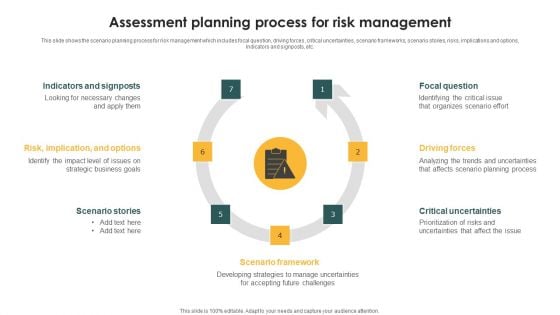
Assessment Planning Process For Risk Management Ppt PowerPoint Presentation Gallery Elements PDF
This slide shows the scenario planning process for risk management which includes focal question, driving forces, critical uncertainties, scenario frameworks, scenario stories, risks, implications and options, Indicators and signposts, etc. Presenting Assessment Planning Process For Risk Management Ppt PowerPoint Presentation Gallery Elements PDF to dispense important information. This template comprises six stages. It also presents valuable insights into the topics including Indicators And Signposts, Focal Question, Driving Forces, Critical Uncertainties. This is a completely customizable PowerPoint theme that can be put to use immediately. So, download it and address the topic impactfully.
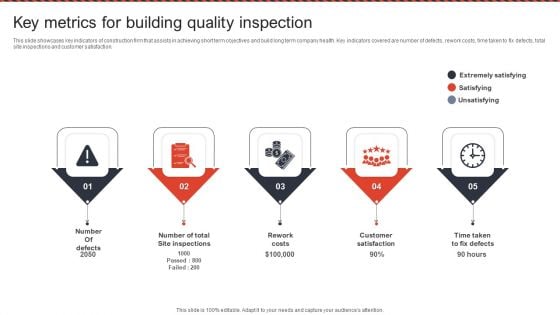
Key Metrics For Building Quality Inspection Ppt PowerPoint Presentation File Outline PDF
This slide showcases key indicators of construction firm that assists in achieving short term objectives and build long term company health. Key indicators covered are number of defects, rework costs, time taken to fix defects, total site inspections and customer satisfaction. Persuade your audience using this Key Metrics For Building Quality Inspection Ppt PowerPoint Presentation File Outline PDF. This PPT design covers five stages, thus making it a great tool to use. It also caters to a variety of topics including Extremely Satisfying, Satisfying, Unsatisfying. Download this PPT design now to present a convincing pitch that not only emphasizes the topic but also showcases your presentation skills.
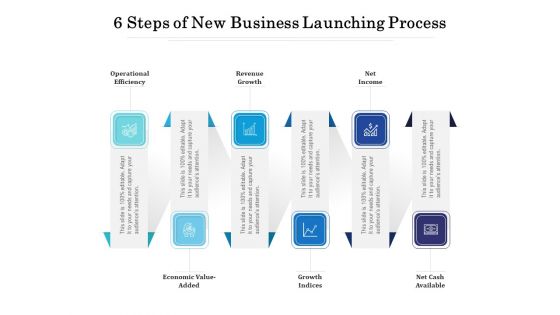
6 Steps Of New Business Launching Process Ppt PowerPoint Presentation Summary Slide PDF
Presenting 6 steps of new business launching process ppt powerpoint presentation summary slide pdf to dispense important information. This template comprises six stages. It also presents valuable insights into the topics including operational efficiency, revenue growth, net income, economic value added, growth indices, net cash available. This is a completely customizable PowerPoint theme that can be put to use immediately. So, download it and address the topic impactfully.
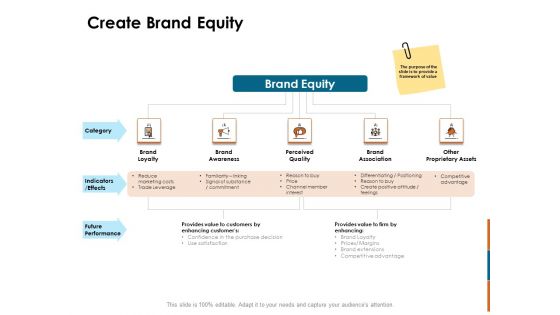
Key Statistics Of Marketing Create Brand Equity Ppt PowerPoint Presentation Inspiration Outline PDF
Presenting key statistics of marketing create brand equity ppt powerpoint presentation inspiration outline pdf to provide visual cues and insights. Share and navigate important information on five stages that need your due attention. This template can be used to pitch topics like brand loyalty, brand awareness, perceived quality, brand associations, other proprietary assets, indicators. In addition, this PPT design contains high-resolution images, graphics, etc, that are easily editable and available for immediate download.
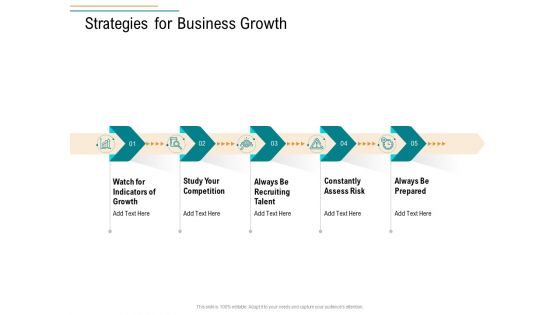
Business Operations Assessment Strategies For Business Growth Ppt Visual Aids Summary PDF
Presenting business operations assessment strategies for business growth ppt visual aids summary pdf to provide visual cues and insights. Share and navigate important information on five stages that need your due attention. This template can be used to pitch topics like watch indicators growth, study competition, always be recruiting talent, constantly assess risk, always prepared. In addition, this PPT design contains high-resolution images, graphics, etc, that are easily editable and available for immediate download.
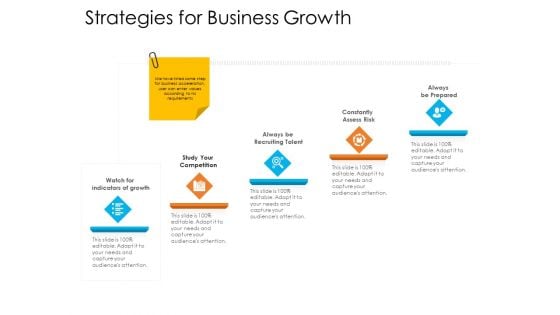
Enterprise Governance Strategies For Business Growth Formats PDF
Presenting enterprise governance strategies for business growth formats pdf to provide visual cues and insights. Share and navigate important information on five stages that need your due attention. This template can be used to pitch topics like study your competition, indicators of growth, constantly assess risk. In addition, this PPT design contains high-resolution images, graphics, etc, that are easily editable and available for immediate download.
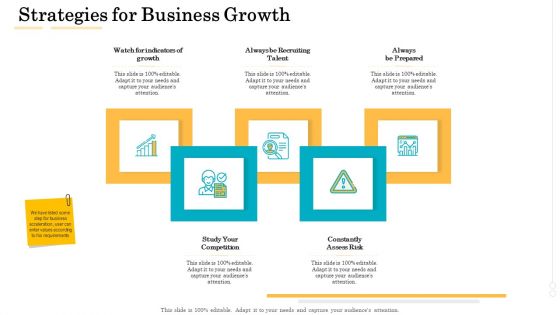
Administrative Regulation Strategies For Business Growth Ppt PowerPoint Presentation Summary Introduction PDF
Presenting administrative regulation strategies for business growth ppt powerpoint presentation summary introduction pdf to provide visual cues and insights. Share and navigate important information on five stages that need your due attention. This template can be used to pitch topics like watch indicators growth, study competition, always be recruiting talent, constantly assess risk, always prepared. In addition, this PPT design contains high-resolution images, graphics, etc, that are easily editable and available for immediate download.
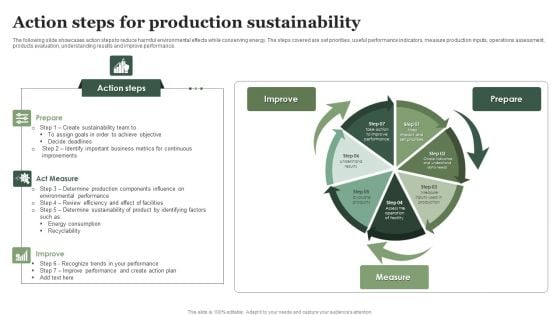
Action Steps For Production Sustainability Ppt Pictures Tips PDF
The following slide showcases action steps to reduce harmful environmental effects while conserving energy. The steps covered are set priorities, useful performance indicators, measure production inputs, operations assessment, products evaluation, understanding results and improve performance. Presenting Action Steps For Production Sustainability Ppt Pictures Tips PDF to dispense important information. This template comprises three stages. It also presents valuable insights into the topics including Action Steps, Act Measure, Improve. This is a completely customizable PowerPoint theme that can be put to use immediately. So, download it and address the topic impactfully.
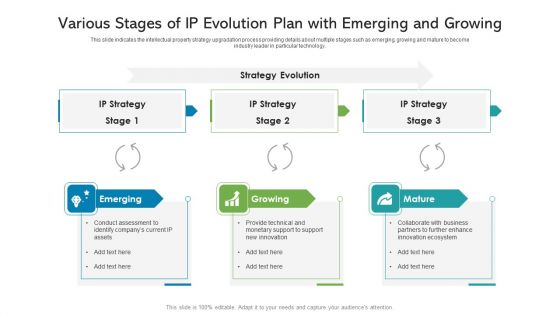
Various Stages Of IP Evolution Plan With Emerging And Growing Ppt Infographic Template Display PDF
This slide indicates the intellectual property strategy upgradation process providing details about multiple stages such as emerging, growing and mature to become industry leader in particular technology. Presenting various stages of ip evolution plan with emerging and growing ppt infographic template display pdf to dispense important information. This template comprises three stages. It also presents valuable insights into the topics including evolution, strategy, technical. This is a completely customizable PowerPoint theme that can be put to use immediately. So, download it and address the topic impactfully.
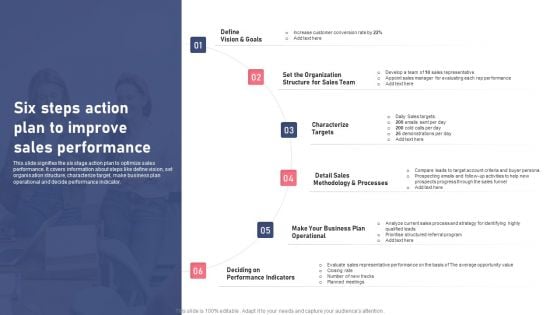
Six Steps Action Plan To Improve Sales Performance Ppt Pictures Show PDF
This slide signifies the six stage action plan to optimize sales performance. It covers information about steps like define vision, set organisation structure, characterize target, make business plan operational and decide performance indicator. Presenting Six Steps Action Plan To Improve Sales Performance Ppt Pictures Show PDF to dispense important information. This template comprises six stages. It also presents valuable insights into the topics including Organization Structure, Sales Team, Characterize Targets. This is a completely customizable PowerPoint theme that can be put to use immediately. So, download it and address the topic impactfully.
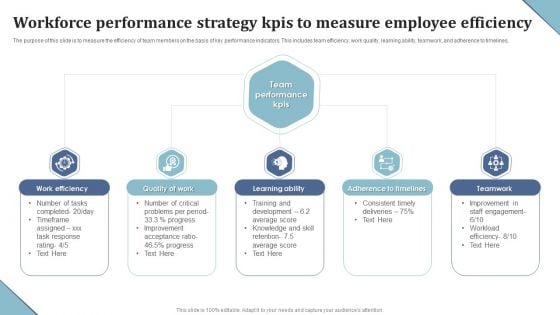
Workforce Performance Strategy Kpis To Measure Employee Efficiency Ppt Layouts Microsoft PDF
The purpose of this slide is to measure the efficiency of team members on the basis of key performance indicators. This includes team efficiency, work quality, learning ability, teamwork, and adherence to timelines. Presenting Workforce Performance Strategy Kpis To Measure Employee Efficiency Ppt Layouts Microsoft PDF to dispense important information. This template comprises five stages. It also presents valuable insights into the topics including Work Efficiency, Learning Ability, Teamwork. This is a completely customizable PowerPoint theme that can be put to use immediately. So, download it and address the topic impactfully.
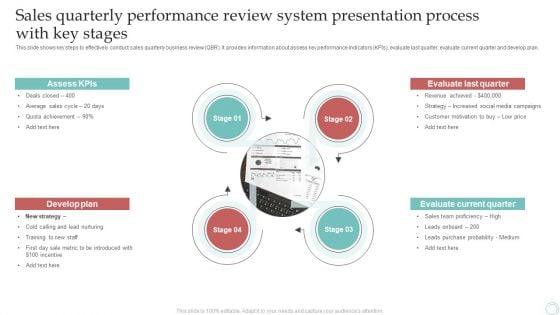
Sales Quarterly Performance Review System Presentation Process With Key Stages Infographics PDF
This slide shows key steps to effectively conduct sales quarterly business review QBR. It provides information about assess key performance indicators KPIs, evaluate last quarter, evaluate current quarter and develop plan. Presenting Sales Quarterly Performance Review System Presentation Process With Key Stages Infographics PDF to dispense important information. This template comprises four stages. It also presents valuable insights into the topics including Assess Kpis, Develop Plan, Evaluate Current Quarter, Evaluate Last Quarter. This is a completely customizable PowerPoint theme that can be put to use immediately. So, download it and address the topic impactfully.
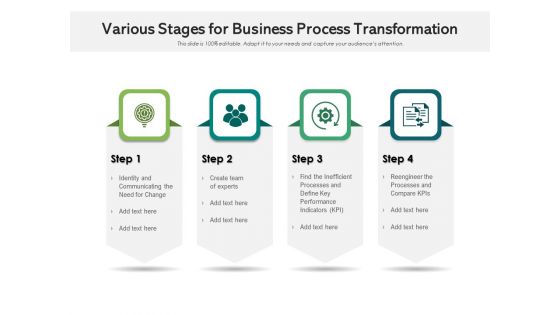
Various Stages For Business Process Transformation Ppt PowerPoint Presentation Model Slideshow PDF
Persuade your audience using this various stages for business process transformation ppt powerpoint presentation model slideshow pdf. This PPT design covers four stages, thus making it a great tool to use. It also caters to a variety of topics including identity and communicating the need for change, create team of experts, find the inefficient processes and define key performance indicators kpi, reengineer the processes and compare kpis. Download this PPT design now to present a convincing pitch that not only emphasizes the topic but also showcases your presentation skills.
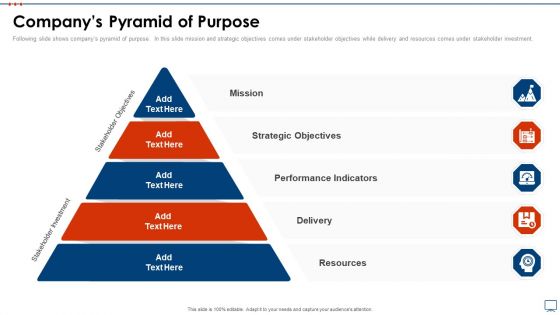
Strategic Business Plan Effective Tools Companys Pyramid Of Purpose Template PDF
Following slide shows companys pyramid of purpose. In this slide mission and strategic objectives comes under stakeholder objectives while delivery and resources comes under stakeholder investment. This is a strategic business plan effective tools companys pyramid of purpose template pdf template with various stages. Focus and dispense information on five stages using this creative set, that comes with editable features. It contains large content boxes to add your information on topics like mission, strategic objectives, performance indicators, delivery resources. You can also showcase facts, figures, and other relevant content using this PPT layout. Grab it now.
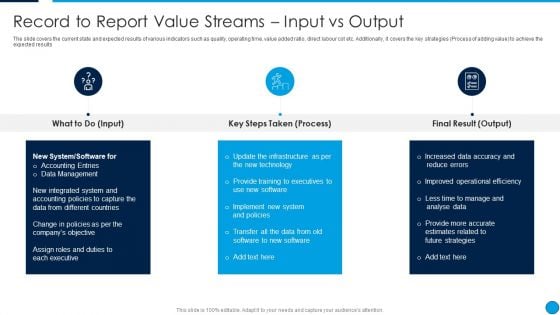
Summary Financial Record To Report Value Streams Input Vs Output Guidelines PDF
The slide covers the current state and expected results of various indicators such as quality, operating time, value added ratio, direct labour cot etc. Additionally, it covers the key strategies Process of adding value to achieve the expected results. This is a Summary Financial Record To Report Value Streams Input Vs Output Guidelines PDF template with various stages. Focus and dispense information on three stages using this creative set, that comes with editable features. It contains large content boxes to add your information on topics like New System, Accounting Entries, Data Management, Assign Roles And Duties. You can also showcase facts, figures, and other relevant content using this PPT layout. Grab it now.
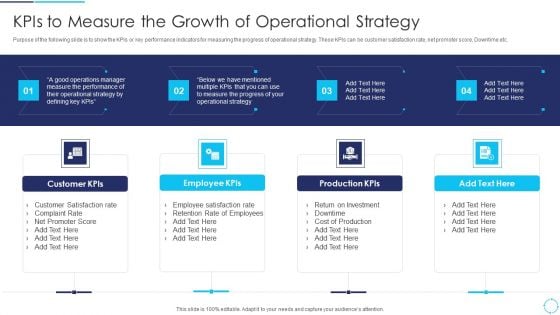
Continuous Enhancement Strategy Kpis To Measure The Growth Of Operational Strategy Inspiration PDF
Purpose of the following slide is to show the KPIs or key performance indicators for measuring the progress of operational strategy. These KPIs can be customer satisfaction rate, net promoter score, Downtime etc. This is a Continuous Enhancement Strategy Kpis To Measure The Growth Of Operational Strategy Inspiration PDF template with various stages. Focus and dispense information on four stages using this creative set, that comes with editable features. It contains large content boxes to add your information on topics like Customer KPIs, Employee KPIs, Production KPIs, Customer Satisfaction rate. You can also showcase facts, figures, and other relevant content using this PPT layout. Grab it now.
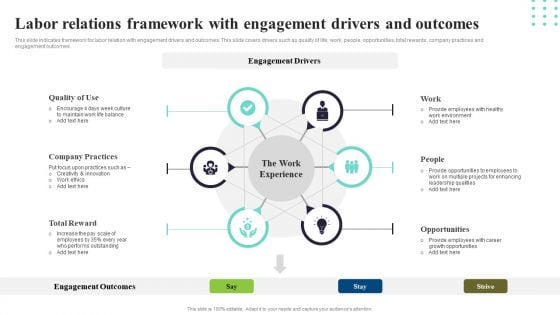
Labor Relations Framework With Engagement Drivers And Outcomes Ppt PowerPoint Presentation File Infographics PDF
This slide indicates framework for labor relation with engagement drivers and outcomes. This slide covers drivers such as quality of life, work, people, opportunities, total rewards, company practices and engagement outcomes. Persuade your audience using this Labor Relations Framework With Engagement Drivers And Outcomes Ppt PowerPoint Presentation File Infographics PDF. This PPT design covers six stages, thus making it a great tool to use. It also caters to a variety of topics including Engagement Drivers, Engagement Outcomes, Total Reward. Download this PPT design now to present a convincing pitch that not only emphasizes the topic but also showcases your presentation skills.
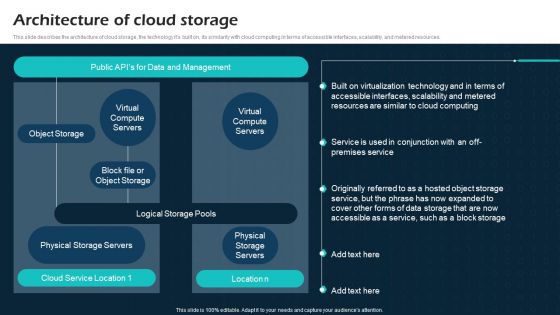
Architecture Of Cloud Storage Virtual Cloud Network IT Ppt Portfolio Files PDF
This slide describes the architecture of cloud storage, the technology its built on, its similarity with cloud computing in terms of accessible interfaces, scalability, and metered resources. Are you searching for a Architecture Of Cloud Storage Virtual Cloud Network IT Ppt Portfolio Files PDF that is uncluttered, straightforward, and original It is easy to edit, and you can change the colors to suit your personal or business branding. For a presentation that expresses how much effort you have put in, this template is ideal With all of its features, including tables, diagrams, statistics, and lists, it is perfect for a business plan presentation. Make your ideas more appealing with these professional slides. Download ZZZZZZZZZZZZZZZZZZZZ from Slidegeeks today.
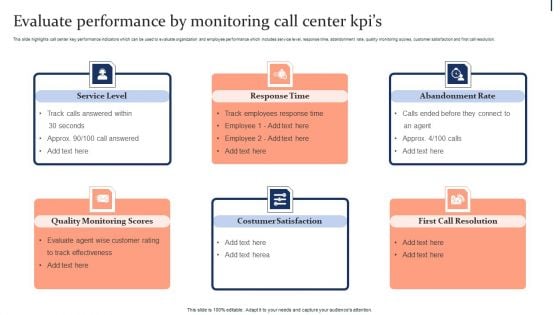
Quality Enhancement Strategic Evaluate Performance By Monitoring Call Center Kpis Rules PDF
This slide highlights call center key performance indicators which can be used to evaluate organization and employee performance which includes service level, response time, abandonment rate, quality monitoring scores, customer satisfaction and first call resolution. Formulating a presentation can take up a lot of effort and time, so the content and message should always be the primary focus. The visuals of the PowerPoint can enhance the presenters message, so our Quality Enhancement Strategic Evaluate Performance By Monitoring Call Center Kpis Rules PDF was created to help save time. Instead of worrying about the design, the presenter can concentrate on the message while our designers work on creating the ideal templates for whatever situation is needed. Slidegeeks has experts for everything from amazing designs to valuable content, we have put everything into Quality Enhancement Strategic Evaluate Performance By Monitoring Call Center Kpis Rules PDF.
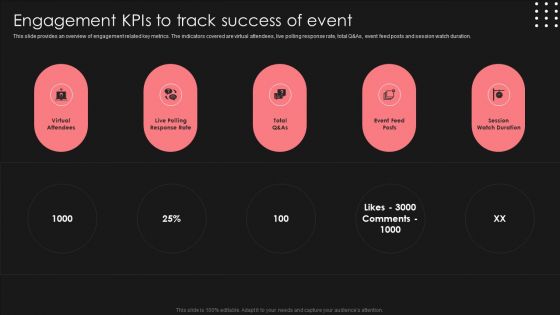
Positive Impact Of Effective Engagement Kpis To Track Success Of Event Professional PDF
This slide provides an overview of engagement related key metrics. The indicators covered are virtual attendees, live polling response rate, total Q And As, event feed posts and session watch duration. Coming up with a presentation necessitates that the majority of the effort goes into the content and the message you intend to convey. The visuals of a PowerPoint presentation can only be effective if it supplements and supports the story that is being told. Keeping this in mind our experts created Positive Impact Of Effective Engagement Kpis To Track Success Of Event Professional PDF to reduce the time that goes into designing the presentation. This way, you can concentrate on the message while our designers take care of providing you with the right template for the situation.
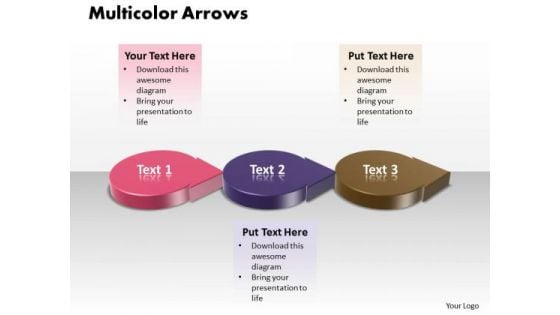
Ppt 3d Multicolor Curved Arrows PowerPoint 2010 Showing Three Stages Templates
PPT 3d multicolor curved arrows powerpoint 2010 showing three stages Templates-This PowerPoint Diagram shows you the Successive Representation of five approaches using circular Arrow. It shows the successive concepts used in a procedure. You can change color, size and orientation of any icon to your liking.-PPT 3d multicolor curved arrows powerpoint 2010 showing three stages Templates-arrow, black, blue, bright, brown, button, cartography, circle, direction, fuchsia, glossy, green, icon, indicator, internet, light, map, modern, multicolor, nautical, navigation, orientation, pink, pointer, round, set, shadow, shiny, simple, star, vector Use any of the facets our Ppt 3d Multicolor Curved Arrows PowerPoint 2010 Showing Three Stages Templates offer. They rank really high on employability.
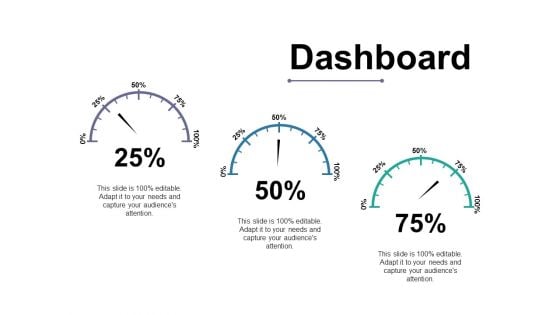
Dashboard Ppt PowerPoint Presentation Styles Themes
This is a dashboard ppt powerpoint presentation styles themes. This is a three stage process. The stages in this process are dashboard, speed, meter, business, marketing.
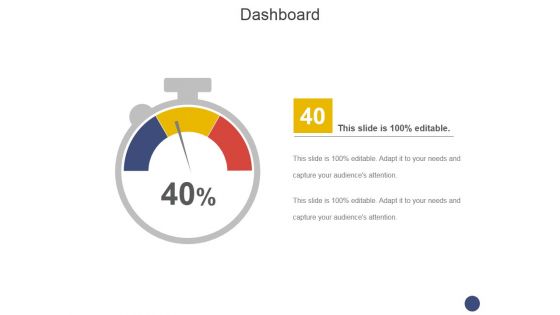
Dashboard Ppt PowerPoint Presentation Layouts Diagrams
This is a dashboard ppt powerpoint presentation layouts diagrams. This is a one stage process. The stages in this process are speed, meter, business, marketing, equipment.
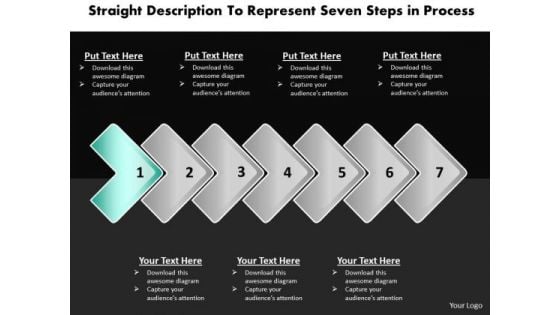
Ppt Direct Description To Represent Seven Steps In Process PowerPoint Templates
PPT direct description to represent seven steps in process PowerPoint Templates-This diagram helps you to analyze all the connected ideas and also can be used to show seven aspects of an issue. This PowerPoint Linear process diagram is used to show interrelated ideas or concepts. This diagram is useful in just about any type of presentation. You can change color, size and orientation of any icon to your liking. -PPT direct description to represent seven steps in process PowerPoint Templates-Aim, Arrow, Arrowheads, Badge, Border, Click, Connection, Curve, Design, Direction, Download, Element, Fuchsia, Icon, Illustration, Indicator, Internet, Magenta, Mark, Object, Orientation, Pointer, Shadow, Shape, Sign Our Ppt Direct Description To Represent Seven Steps In Process PowerPoint Templates are designed by an avant-garde team. They are always abreast of the state of the art.
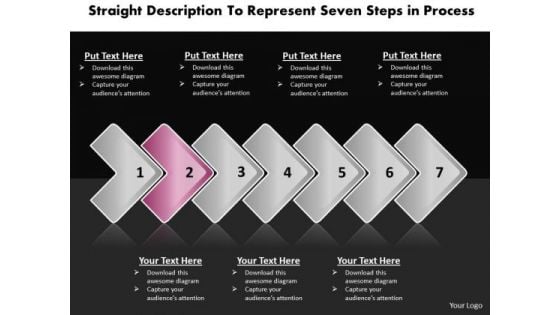
Ppt Continuous Description To Represent Seven Steps Process PowerPoint Templates
PPT continuous description to represent seven steps process PowerPoint Templates-Use this layout to define the outcome and the multiple possibilities in a way that is used in calculation of probabilities, genetics and strategic reasoning. This chart visualizes the concept of process steps, reoccurrences and components or of your company structure or product features. You can change color, size and orientation of any icon to your liking. -PPT continuous description to represent seven steps process PowerPoint Templates-Aim, Arrow, Arrowheads, Badge, Border, Click, Connection, Curve, Design, Direction, Download, Element, Fuchsia, Icon, Illustration, Indicator, Internet, Magenta, Mark, Object, Orientation, Pointer, Shadow, Shape, Sign Carry it off elegantly with our Ppt Continuous Description To Represent Seven Steps Process PowerPoint Templates. Get your thoughts into fashion.
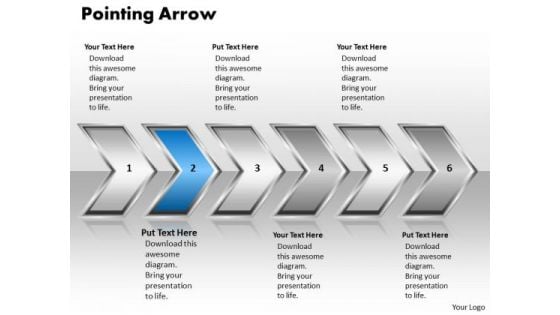
Ppt Pointing Arrow Communication Process PowerPoint Presentation 6 Stages Templates
PPT pointing arrow communication process powerpoint presentation 6 stages Templates-Use this PowerPoint Diagram to represent the layers of Linear Process model Graphically. It shows the Second stage in an animated manner through an Arrow. It is a useful captivating tool enables you to define your message in your Marketing PPT presentations. You can change color, size and orientation of any icon to your liking.-PPT pointing arrow communication process powerpoint presentation 6 stages Templates-Aim, Arrow, Arrowheads, Badge, Border, Click, Connection, Curve, Design, Direction, Download, Element, Fuchsia, Icon, Illustration, Indicator, Internet, Magenta, Mark, Object, Orientation, Pointer, Shadow, Shape, Sign Our graphice have been selected by professionals. Use them in your presentations with our Ppt Pointing Arrow Communication Process PowerPoint Presentation 6 Stages Templates. You'll always stay ahead of the game.
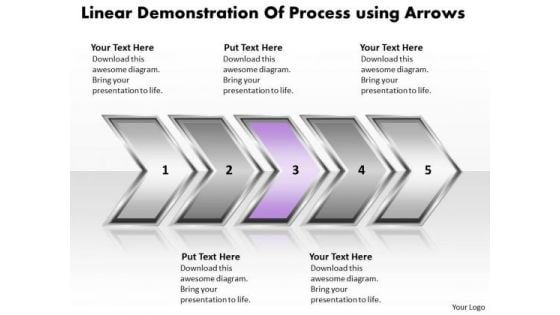
Ppt Linear Demonstration Of Business Forging Process PowerPoint Slides Templates
PPT linear demonstration of business forging process powerpoint slides Templates-Use this PowerPoint Diagram to represent the layers of Linear Process model Graphically. It shows the third stage in an animated manner through an Arrow. It is a useful captivating tool enables you to define your message in your Marketing PPT presentations. You can change color, size and orientation of any icon to your liking.-PPT linear demonstration of business forging process powerpoint slides Templates-Aim, Arrow, Arrowheads, Badge, Border, Click, Connection, Curve, Design, Direction, Download, Element, Fuchsia, Icon, Illustration, Indicator, Internet, Magenta, Mark, Object, Orientation, Pointer, Shadow, Shape, Sign Break throughthe fence with our Ppt Linear Demonstration Of Business Forging Process PowerPoint Slides Templates. Your ideas will bring down all barriers.
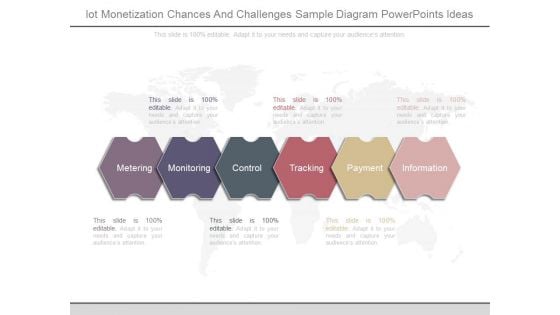
Iot Monetization Chances And Challenges Sample Diagram Powerpoints Ideas
This is a iot monetization chances and challenges sample diagram powerpoints ideas. This is a six stage process. The stages in this process are metering, monitoring, control, tracking, payment, information.

Low High Performance Measurement Indicator Dashboard Ppt PowerPoint Presentation Summary Images
This is a low high performance measurement indicator dashboard ppt powerpoint presentation summary images. This is a five stage process. The stages in this process are performance dashboard, performance meter, performance kpi.
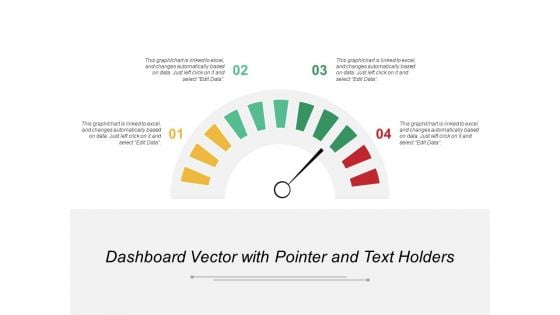
Dashboard Vector With Pointer And Text Holders Ppt PowerPoint Presentation Portfolio Format Ideas
This is a dashboard vector with pointer and text holders ppt powerpoint presentation portfolio format ideas. This is a four stage process. The stages in this process are performance dashboard, performance meter, performance kpi.
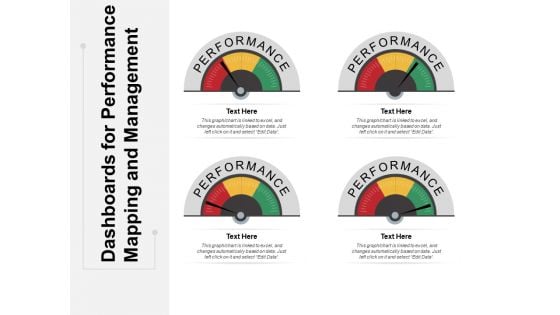
Dashboards For Performance Mapping And Management Ppt PowerPoint Presentation Ideas File Formats
This is a dashboards for performance mapping and management ppt powerpoint presentation ideas file formats. This is a four stage process. The stages in this process are performance dashboard, performance meter, performance kpi.
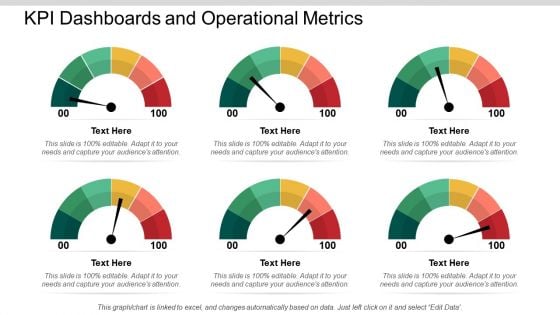
KPI Dashboards And Operational Metrics Ppt PowerPoint Presentation Portfolio Infographics

Liquid Gauge Symbol Digital Water Digital Reading Control Gauge Ppt PowerPoint Presentation Complete Deck
Presenting this set of slides with name liquid gauge symbol digital water digital reading control gauge ppt powerpoint presentation complete deck. The topics discussed in these slides are digital water, digital reading, control gauge, water meter. This is a completely editable PowerPoint presentation and is available for immediate download. Download now and impress your audience.
Folder Download Internet PowerPoint Templates And PowerPoint Themes 1012
Folder Download Internet PowerPoint Templates And PowerPoint Themes 1012-This Template shows the download folder along with the Laptop. It indicates the downloaded data from the Internet. It signifies transfer, copy, move, take and cyberspace. Your brain is always churning out ideas like cogs in a wheel. The mind is always whirring with new ideas. Put them down and present them using our innovative templates-Folder Download Internet PowerPoint Templates And PowerPoint Themes 1012-This PowerPoint template can be used for presentations relating to-Folder Icon With Arrow, Communication, Internet, Computer, Symbol, Technology Debates often go to a fever pitch. Cool down the environment with our Folder Download Internet PowerPoint Templates And PowerPoint Themes 1012.
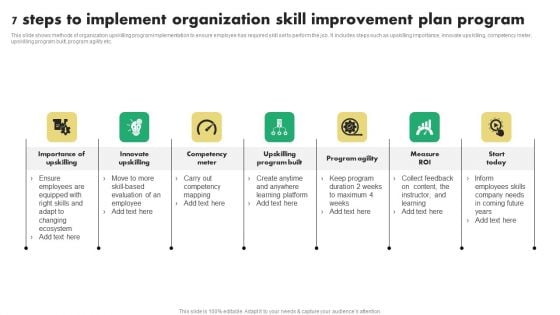
7 Steps To Implement Organization Skill Improvement Plan Program Infographics PDF
This slide shows methods of organization upskilling program implementation to ensure employee has required skill set to perform the job. It includes steps such as upskilling importance, innovate upskilling, competency meter, upskilling program built, program agility etc. Presenting 7 Steps To Implement Organization Skill Improvement Plan Program Infographics PDF to dispense important information. This template comprises seven stages. It also presents valuable insights into the topics including Competency Meter, Innovate Upskilling, Program Agility. This is a completely customizable PowerPoint theme that can be put to use immediately. So, download it and address the topic impactfully.
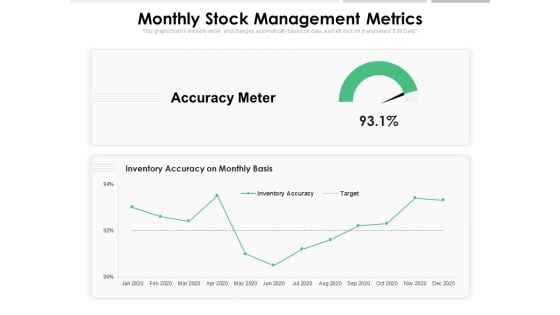
Monthly Stock Management Metrics Ppt PowerPoint Presentation Inspiration Format PDF
Presenting this set of slides with name monthly stock management metrics ppt powerpoint presentation inspiration format pdf. The topics discussed in these slides are accuracy meter, inventory accuracy on monthly basis, target. This is a completely editable PowerPoint presentation and is available for immediate download. Download now and impress your audience.
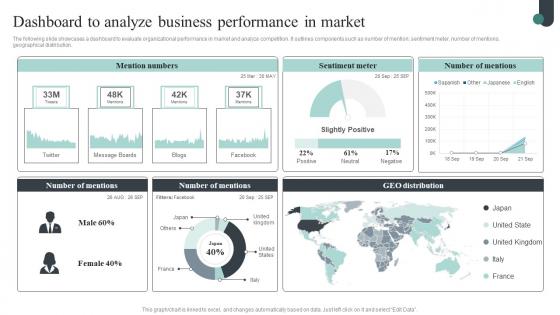
Competitive Intelligence Guide To Determine Market Dashboard To Analyze Business Pictures Pdf
The following slide showcases a dashboard to evaluate organizational performance in market and analyze competition. It outlines components such as number of mention, sentiment meter, number of mentions, geographical distribution. Do you have to make sure that everyone on your team knows about any specific topic I yes, then you should give Competitive Intelligence Guide To Determine Market Dashboard To Analyze Business Pictures Pdf a try. Our experts have put a lot of knowledge and effort into creating this impeccable Competitive Intelligence Guide To Determine Market Dashboard To Analyze Business Pictures Pdf. You can use this template for your upcoming presentations, as the slides are perfect to represent even the tiniest detail. You can download these templates from the Slidegeeks website and these are easy to edit. So grab these today. The following slide showcases a dashboard to evaluate organizational performance in market and analyze competition. It outlines components such as number of mention, sentiment meter, number of mentions, geographical distribution.
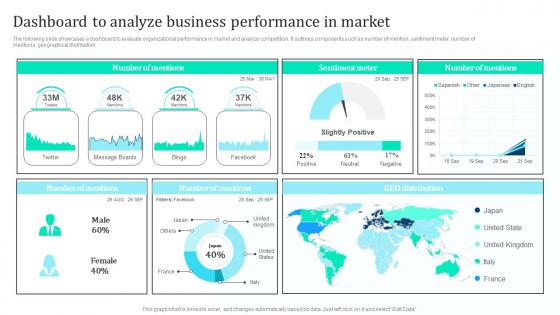
Dashboard Analyze Business Performance Marketing Intelligence Guide Data Gathering Microsoft Pdf
The following slide showcases a dashboard to evaluate organizational performance in market and analyze competition. It outlines components such as number of mention, sentiment meter, number of mentions, geographical distribution. Do you have to make sure that everyone on your team knows about any specific topic I yes, then you should give Dashboard Analyze Business Performance Marketing Intelligence Guide Data Gathering Microsoft Pdf a try. Our experts have put a lot of knowledge and effort into creating this impeccable Dashboard Analyze Business Performance Marketing Intelligence Guide Data Gathering Microsoft Pdf. You can use this template for your upcoming presentations, as the slides are perfect to represent even the tiniest detail. You can download these templates from the Slidegeeks website and these are easy to edit. So grab these today The following slide showcases a dashboard to evaluate organizational performance in market and analyze competition. It outlines components such as number of mention, sentiment meter, number of mentions, geographical distribution.
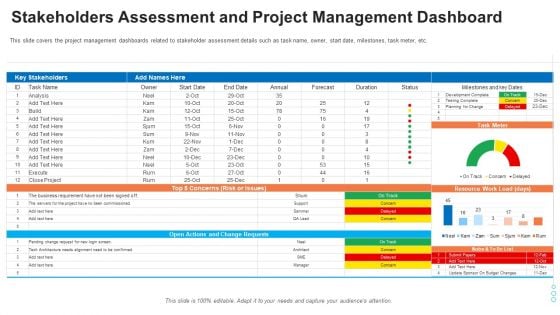
Evaluation Mapping Stakeholders Assessment And Project Management Dashboard Structure PDF
This slide covers the project management dashboards related to stakeholder assessment details such as task name, owner, start date, milestones, task meter, etc. Deliver an awe-inspiring pitch with this creative evaluation mapping stakeholders assessment and project management dashboard structure pdf bundle. Topics like stakeholders assessment and project management dashboard can be discussed with this completely editable template. It is available for immediate download depending on the needs and requirements of the user.
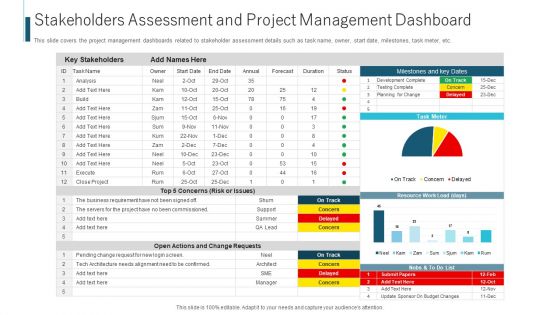
Stakeholders Assessment And Project Management Dashboard Ppt Ideas Outline PDF
This slide covers the project management dashboards related to stakeholder assessment details such as task name, owner, start date, milestones, task meter, etc. Deliver and pitch your topic in the best possible manner with this stakeholders assessment and project management dashboard ppt ideas outline pdf. Use them to share invaluable insights on risk or issues, business requirement, analysis and impress your audience. This template can be altered and modified as per your expectations. So, grab it now.
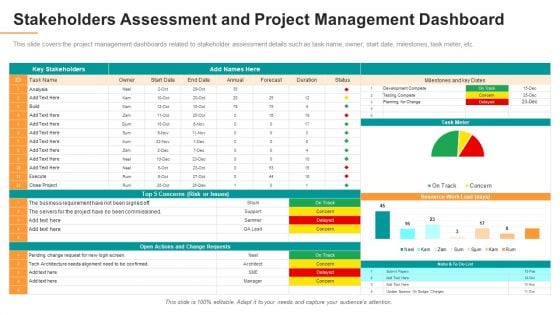
Stakeholders Assessment And Project Management Dashboard Formats PDF
This slide covers the project management dashboards related to stakeholder assessment details such as task name, owner, start date, milestones, task meter, etc. Deliver an awe inspiring pitch with this creative stakeholders assessment and project management dashboard formats pdf bundle. Topics like resource, stakeholders, analysis can be discussed with this completely editable template. It is available for immediate download depending on the needs and requirements of the user.
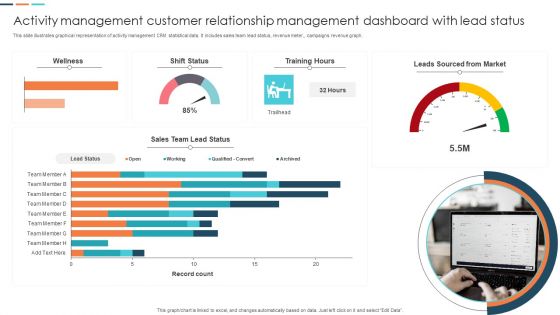
Activity Management Customer Relationship Management Dashboard With Lead Status Portrait PDF
This slide illustrates graphical representation of activity management CRM statistical data. It includes sales team lead status, revenue meter, campaigns revenue graph. Showcasing this set of slides titled Activity Management Customer Relationship Management Dashboard With Lead Status Portrait PDF. The topics addressed in these templates are Sales Team Lead Status, Leads Sourced From Market. All the content presented in this PPT design is completely editable. Download it and make adjustments in color, background, font etc. as per your unique business setting.
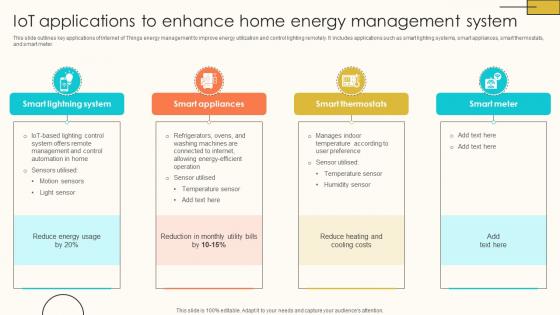
IoT Applications To Enhance Home Energy Internet Of Things Solutions To Enhance Energy IoT SS V
This slide outlines key applications of Internet of Things energy management to improve energy utilization and control lighting remotely. It includes applications such as smart lighting systems, smart appliances, smart thermostats, and smart meter. If you are looking for a format to display your unique thoughts, then the professionally designed IoT Applications To Enhance Home Energy Internet Of Things Solutions To Enhance Energy IoT SS V is the one for you. You can use it as a Google Slides template or a PowerPoint template. Incorporate impressive visuals, symbols, images, and other charts. Modify or reorganize the text boxes as you desire. Experiment with shade schemes and font pairings. Alter, share or cooperate with other people on your work. Download IoT Applications To Enhance Home Energy Internet Of Things Solutions To Enhance Energy IoT SS V and find out how to give a successful presentation. Present a perfect display to your team and make your presentation unforgettable. This slide outlines key applications of Internet of Things energy management to improve energy utilization and control lighting remotely. It includes applications such as smart lighting systems, smart appliances, smart thermostats, and smart meter.
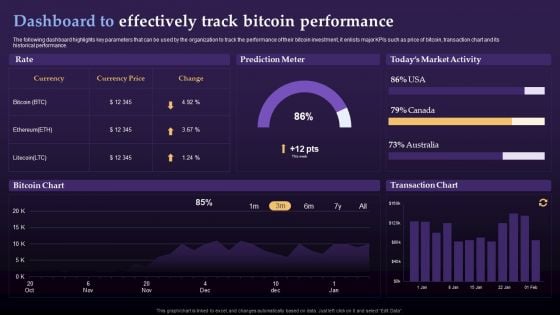
Virtual Currency Investment Guide For Companies Dashboard To Effectively Track Bitcoin Diagrams PDF
The following dashboard highlights key parameters that can be used by the organization to track the performance of their bitcoin investment, it enlists major KPIs such as price of bitcoin, transaction chart and its historical performance. Deliver an awe inspiring pitch with this creative Virtual Currency Investment Guide For Companies Dashboard To Effectively Track Bitcoin Diagrams PDF bundle. Topics like Prediction Meter, Todays Market Activity, Transaction Chart can be discussed with this completely editable template. It is available for immediate download depending on the needs and requirements of the user.

Gamification Strategy For Business Promotion Measuring ROI Of Gamification Strategy Diagrams PDF
Websites like LinkedIn are using badges to encourage users to keep updating their profiles. It encourages readers to complete all steps add their picture, work experience, location, education, and so on thereby filling the meter.Deliver an awe inspiring pitch with this creative Gamification Strategy For Business Promotion Measuring ROI Of Gamification Strategy Diagrams PDF bundle. Topics like Measuring ROI, Gamification Strategy can be discussed with this completely editable template. It is available for immediate download depending on the needs and requirements of the user.

Software Development Project Task Progress Scorecard Ideas PDF
This slide covers status summary of software development project and task allotment report. It includes details such as key stakeholders, tasks list, assigned person, start dates, top concerns, open actions, task meter,milestones, etc. Pitch your topic with ease and precision using this Software Development Project Task Progress Scorecard Ideas PDF. This layout presents information on Performance Analysis, Document Generation, Change Requests. It is also available for immediate download and adjustment. So, changes can be made in the color, design, graphics or any other component to create a unique layout.
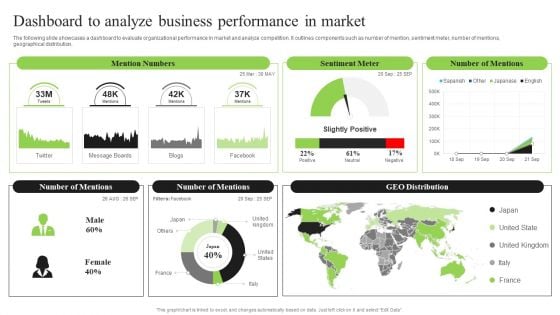
Guidebook For Executing Business Market Intelligence Dashboard To Analyze Business Brochure PDF
The following slide showcases a dashboard to evaluate organizational performance in market and analyze competition. It outlines components such as number of mention, sentiment meter, number of mentions, geographical distribution. Find a pre designed and impeccable Guidebook For Executing Business Market Intelligence Dashboard To Analyze Business Brochure PDF. The templates can ace your presentation without additional effort. You can download these easy to edit presentation templates to make your presentation stand out from others. So, what are you waiting for Download the template from Slidegeeks today and give a unique touch to your presentation.
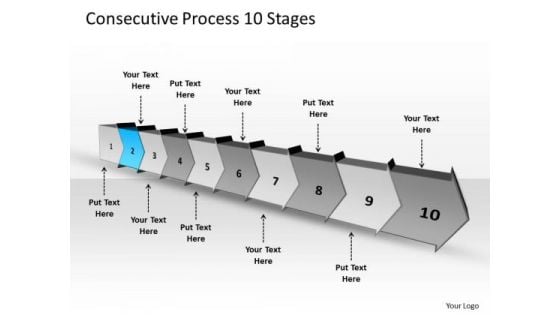
Consecutive Process 10 Stages Creating Flowchart PowerPoint Templates
We present our consecutive process 10 stages creating flowchart PowerPoint templates. Use our Arrows PowerPoint Templates because; you have the ideas to develop the teams vision of where they need to be in the future. Use our Business PowerPoint Templates because, you have played a stellar role and have a few ideas. Use our Shapes PowerPoint Templates because, prove how they mesh to motivate the company team and provide the steam to activate the composite machine. Use our Finance PowerPoint Templates because, our presentation designs are for those on the go. Use our Process and Flows PowerPoint Templates because, they are indicators of the path you have in mind. Use these PowerPoint slides for presentations relating to abstract arrow blank business chart circular circulation concept conceptual consecutive design diagram executive flow icon idea illustration management model numbers organization procedure process. The prominent colors used in the PowerPoint template are Blue, Gray, and Black Get the value of a lifetime with our Consecutive Process 10 Stages Creating Flowchart PowerPoint Templates. Dont waste time struggling with PowerPoint. Let us do it for you.
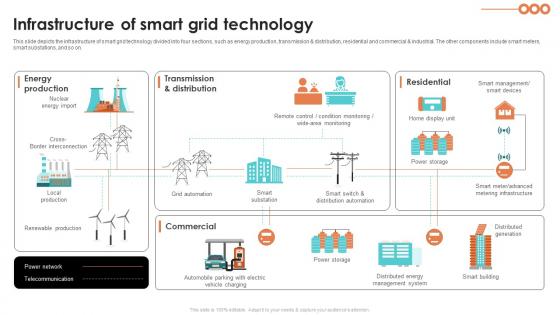
Infrastructure Of Smart Grid Technology Smart Grid Working
This slide depicts the infrastructure of smart grid technology divided into four sections, such as energy production, transmission and distribution, residential and commercial and industrial. The other components include smart meters, smart substations, and so on. Are you in need of a template that can accommodate all of your creative concepts This one is crafted professionally and can be altered to fit any style. Use it with Google Slides or PowerPoint. Include striking photographs, symbols, depictions, and other visuals. Fill, move around, or remove text boxes as desired. Test out color palettes and font mixtures. Edit and save your work, or work with colleagues. Download Infrastructure Of Smart Grid Technology Smart Grid Working and observe how to make your presentation outstanding. Give an impeccable presentation to your group and make your presentation unforgettable. This slide depicts the infrastructure of smart grid technology divided into four sections, such as energy production, transmission and distribution, residential and commercial and industrial. The other components include smart meters, smart substations, and so on.

Positive Impact Of Smart Home Systems Utilizing Smart Appliances IoT SS V
This slide provides an overview of the various smart systems used in homes and their benefits. It includes solar panels, home energy storage, electric vehicle, smart camera, speaker, blinds, water heater, thermostat, plugs, appliances, lights and meter. Retrieve professionally designed Positive Impact Of Smart Home Systems Utilizing Smart Appliances IoT SS V to effectively convey your message and captivate your listeners. Save time by selecting pre-made slideshows that are appropriate for various topics, from business to educational purposes. These themes come in many different styles, from creative to corporate, and all of them are easily adjustable and can be edited quickly. Access them as PowerPoint templates or as Google Slides themes. You do not have to go on a hunt for the perfect presentation because Slidegeeks got you covered from everywhere. This slide provides an overview of the various smart systems used in homes and their benefits. It includes solar panels, home energy storage, electric vehicle, smart camera, speaker, blinds, water heater, thermostat, plugs, appliances, lights and meter.
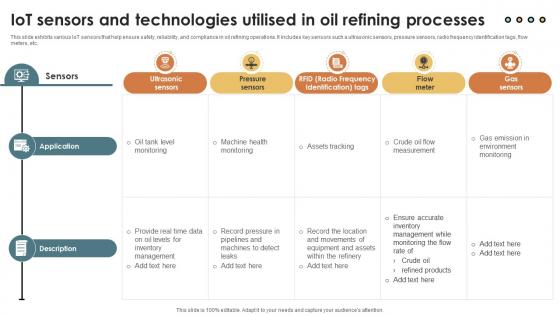
IoT Solutions For Oil IoT Sensors And Technologies Utilised In Oil Refining IoT SS V
This slide exhibits various IoT sensors that help ensure safety, reliability, and compliance in oil refining operations. It includes key sensors such a ultrasonic sensors, pressure sensors, radio frequency identification tags, flow meters, etc. Retrieve professionally designed IoT Solutions For Oil IoT Sensors And Technologies Utilised In Oil Refining IoT SS V to effectively convey your message and captivate your listeners. Save time by selecting pre-made slideshows that are appropriate for various topics, from business to educational purposes. These themes come in many different styles, from creative to corporate, and all of them are easily adjustable and can be edited quickly. Access them as PowerPoint templates or as Google Slides themes. You do not have to go on a hunt for the perfect presentation because Slidegeeks got you covered from everywhere. This slide exhibits various IoT sensors that help ensure safety, reliability, and compliance in oil refining operations. It includes key sensors such a ultrasonic sensors, pressure sensors, radio frequency identification tags, flow meters, etc.
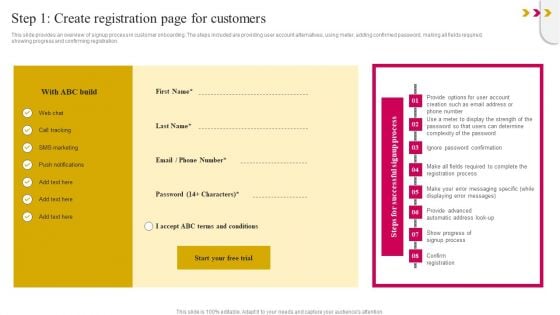
Step 1 Create Registration Page For Customers Guidelines PDF
This slide provides an overview of signup process in customer onboarding. The steps included are providing user account alternatives, using meter, adding confirmed password, making all fields required, showing progress and confirming registration. If you are looking for a format to display your unique thoughts, then the professionally designed Step 1 Create Registration Page For Customers Guidelines PDF is the one for you. You can use it as a Google Slides template or a PowerPoint template. Incorporate impressive visuals, symbols, images, and other charts. Modify or reorganize the text boxes as you desire. Experiment with shade schemes and font pairings. Alter, share or cooperate with other people on your work. Download Step 1 Create Registration Page For Customers Guidelines PDF and find out how to give a successful presentation. Present a perfect display to your team and make your presentation unforgettable.
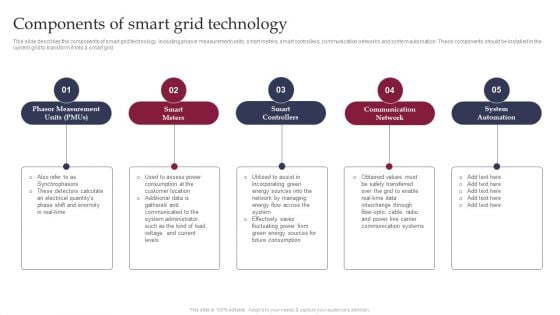
Smart Grid Technology Components Of Smart Grid Technology Rules PDF

Calculate Facebook Key Performance Indicator Ppt PowerPoint Presentation Complete Deck With Slides
This complete deck acts as a great communication tool. It helps you in conveying your business message with personalized sets of graphics, icons etc. Comprising a set of eleven slides, this complete deck can help you persuade your audience. It also induces strategic thinking as it has been thoroughly researched and put together by our experts. Not only is it easily downloadable but also editable. The color, graphics, theme any component can be altered to fit your individual needs. So grab it now.
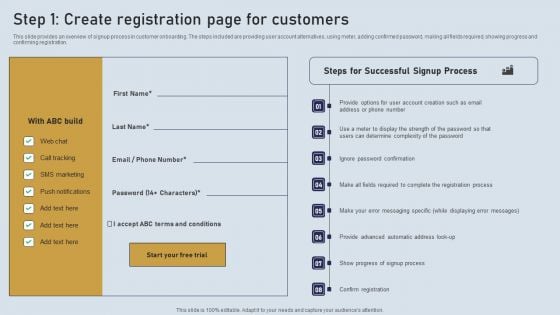
Onboarding Journey For Effective Client Communication Step 1 Create Registration Page For Customers Themes PDF
This slide provides an overview of signup process in customer onboarding. The steps included are providing user account alternatives, using meter, adding confirmed password, making all fields required, showing progress and confirming registration. Formulating a presentation can take up a lot of effort and time, so the content and message should always be the primary focus. The visuals of the PowerPoint can enhance the presenters message, so our Onboarding Journey For Effective Client Communication Step 1 Create Registration Page For Customers Themes PDF was created to help save time. Instead of worrying about the design, the presenter can concentrate on the message while our designers work on creating the ideal templates for whatever situation is needed. Slidegeeks has experts for everything from amazing designs to valuable content, we have put everything into Onboarding Journey For Effective Client Communication Step 1 Create Registration Page For Customers Themes PDF
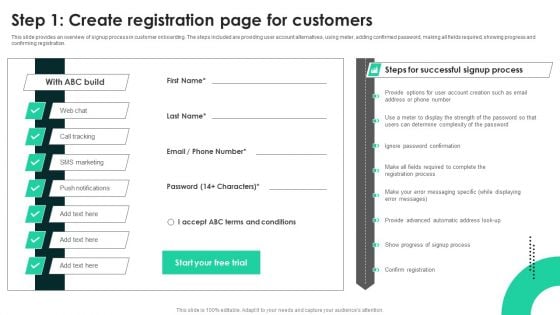
Techniques To Enhance User Onboarding Journey Step 1 Create Registration Page For Customers Themes PDF
This slide provides an overview of signup process in customer onboarding. The steps included are providing user account alternatives, using meter, adding confirmed password, making all fields required, showing progress and confirming registration. Welcome to our selection of the Techniques To Enhance User Onboarding Journey Step 1 Create Registration Page For Customers Themes PDF. These are designed to help you showcase your creativity and bring your sphere to life. Planning and Innovation are essential for any business that is just starting out. This collection contains the designs that you need for your everyday presentations. All of our PowerPoints are 100 percent editable, so you can customize them to suit your needs. This multi purpose template can be used in various situations. Grab these presentation templates today.
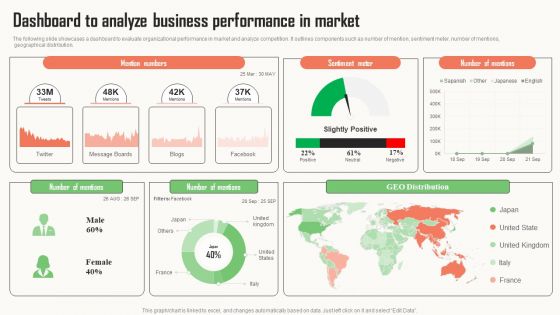
Strategic Market Insight Implementation Guide Dashboard To Analyze Business Performance In Market Slides PDF
The following slide showcases a dashboard to evaluate organizational performance in market and analyze competition. It outlines components such as number of mention, sentiment meter, number of mentions, geographical distribution. Get a simple yet stunning designed Strategic Market Insight Implementation Guide Dashboard To Analyze Business Performance In Market Slides PDF. It is the best one to establish the tone in your meetings. It is an excellent way to make your presentations highly effective. So, download this PPT today from Slidegeeks and see the positive impacts. Our easy to edit Strategic Market Insight Implementation Guide Dashboard To Analyze Business Performance In Market Slides PDF can be your go to option for all upcoming conferences and meetings. So, what are you waiting for Grab this template today.
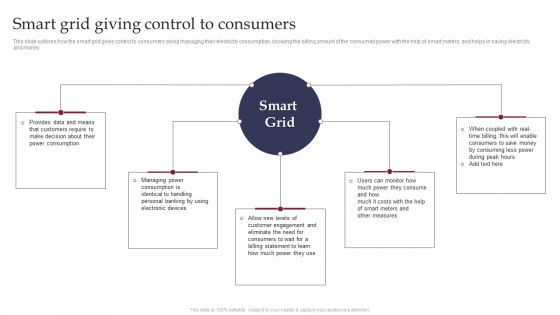
Smart Grid Technology Smart Grid Giving Control To Consumers Ideas PDF

Advance IT Service Delivery Methods To Drive Key Performance Indicators Related Business Results Complete Deck
This complete deck acts as a great communication tool. It helps you in conveying your business message with personalized sets of graphics, icons etc. Comprising a set of fifty six slides, this complete deck can help you persuade your audience. It also induces strategic thinking as it has been thoroughly researched and put together by our experts. Not only is it easily downloadable but also editable. The color, graphics, theme any component can be altered to fit your individual needs. So grab it now.
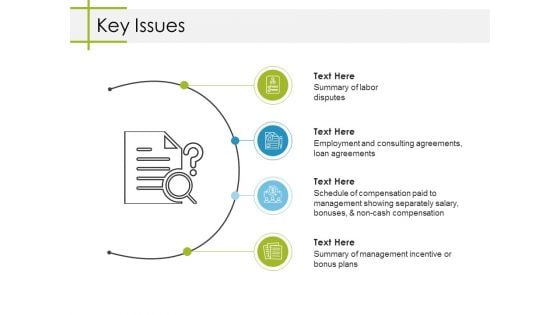
Key Issues Ppt PowerPoint Presentation Slides Deck
This is a key issues ppt powerpoint presentation slides deck. This is a four stage process. The stages in this process are key issues, business, marketing, icons, strategy.

The Problem Analysis And Solution Indication Ppt Examples
This is a the problem analysis and solution indication ppt examples. This is a four stage process. The stages in this process are icons, problem, business, management, finding.
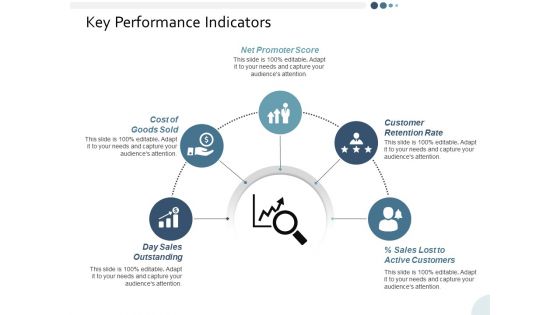
Key Performance Indicators Ppt PowerPoint Presentation Gallery Gridlines
This is a key performance indicators ppt powerpoint presentation gallery gridlines. This is a five stage process. The stages in this process are business, management, strategy, analysis, icons.
Process Control Bar Graph Growth Indication PowerPoint Template
Download our business slide with gear graphics to convincingly convey your important ideas in presentations. It also contains graphics of business icons. Create captivating presentations using this template
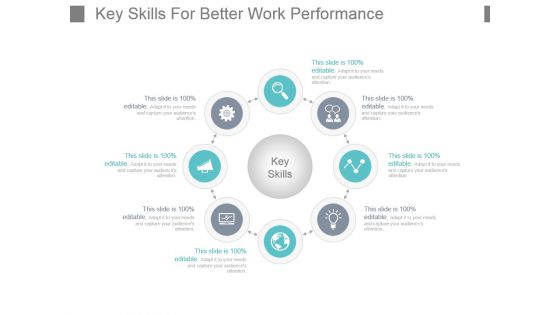
Key Skills For Better Work Performance Powerpoint Shapes
This is a key skills for better work performance powerpoint shapes. This is a four stage process. The stages in this process are key skills, flow, process, circle, icons.
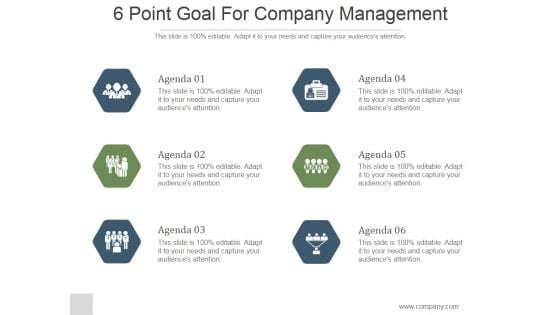
6 Point Goal For Company Management Ppt PowerPoint Presentation Slide
This is a 6 point goal for company management ppt powerpoint presentation slide. This is a six stage process. The stages in this process are agenda, business, strategy, icons, hexagon, marketing.
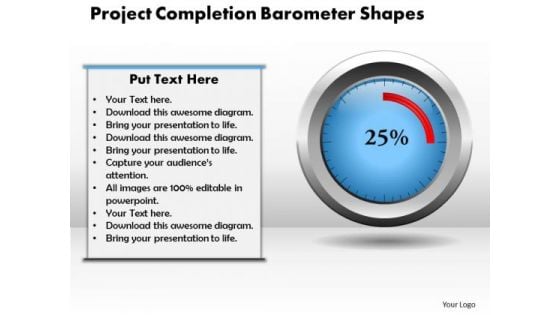
Project Completion Barometer PowerPoint Template
Draw On The Experience Of Our Project Completion Barometer PowerPoint Template Powerpoint Templates. They Imbibe From Past Masters. Drink The Nectar Of Our Business Charts Powerpoint Templates. Give Your Thoughts A Long Life.
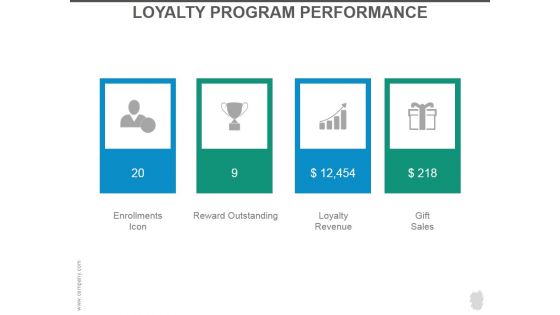
Loyalty Program Performance Ppt PowerPoint Presentation Slides
This is a loyalty program performance ppt powerpoint presentation slides. This is a four stage process. The stages in this process are enrollments icon, reward outstanding, loyalty revenue, gift sales.
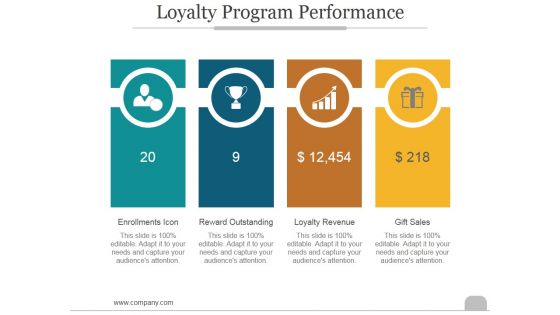
Loyalty Program Performance Ppt PowerPoint Presentation Introduction
This is a loyalty program performance ppt powerpoint presentation introduction. This is a four stage process. The stages in this process are enrollments icon, reward outstanding, loyalty revenue, gift sales.
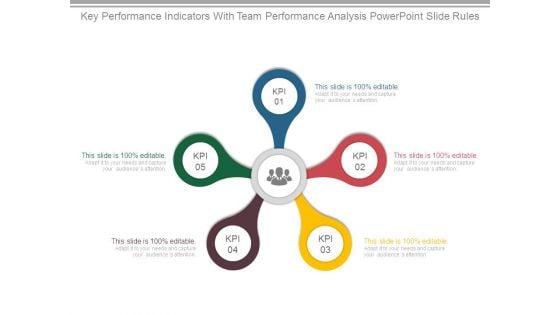
Key Performance Indicators With Team Performance Analysis Powerpoint Slide Rules
This is a key performance indicators with team performance analysis powerpoint slide rules. This is a five stage process. The stages in this process are business, strategy, marketing, success, process, icons.

Three Arrows For Business Process Indication Powerpoint Template
This business slide displays diagram of three arrows with icons. Download this diagram to display information in visual manner. Visual effect of this diagram helps in maintaining the flow of the discussion and provides more clarity to the subject.
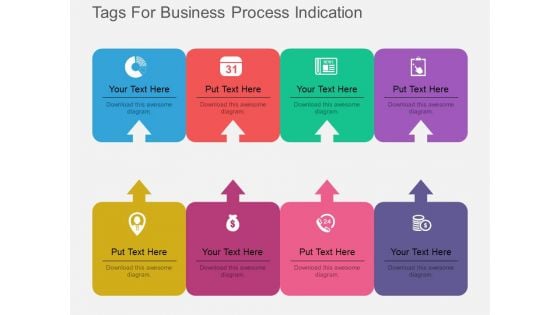
Eight Tags For Business Process Indication Powerpoint Template
Our above PPT slide contains graphics of eight text tags with icons. This PowerPoint template may be used to display business process steps. Use this diagram to impart more clarity to data and to create more sound impact on viewers.
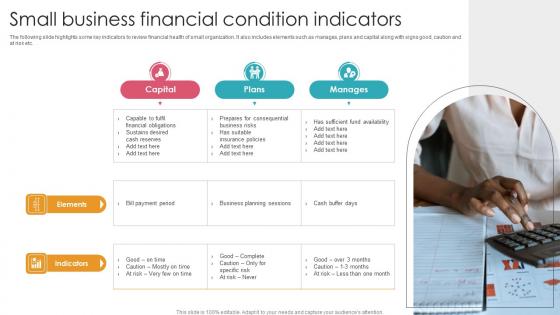
Small Business Financial Condition Indicators Themes Pdf
The following slide highlights some key indicators to review financial health of small organization. It also includes elements such as manages, plans and capital along with signs good, caution and at risk etc. Showcasing this set of slides titled Small Business Financial Condition Indicators Themes Pdf. The topics addressed in these templates are Elements, Indicators, Sustains Desired Cash Reserves. All the content presented in this PPT design is completely editable. Download it and make adjustments in color, background, font etc. as per your unique business setting. The following slide highlights some key indicators to review financial health of small organization. It also includes elements such as manages, plans and capital along with signs good, caution and at risk etc.
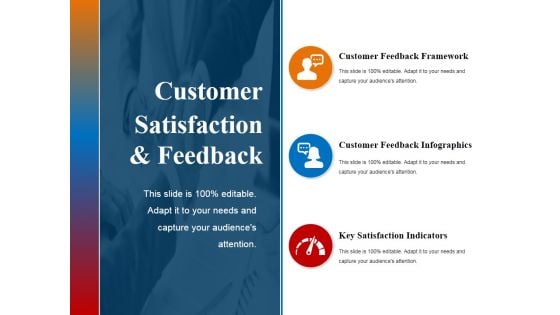
Customer Satisfaction And Feedback Ppt PowerPoint Presentation Inspiration Infographic Template
This is a customer satisfaction and feedback ppt powerpoint presentation inspiration infographic template. This is a three stage process. The stages in this process are customer feedback framework, customer feedback infographics, key satisfaction indicators, business, icons.
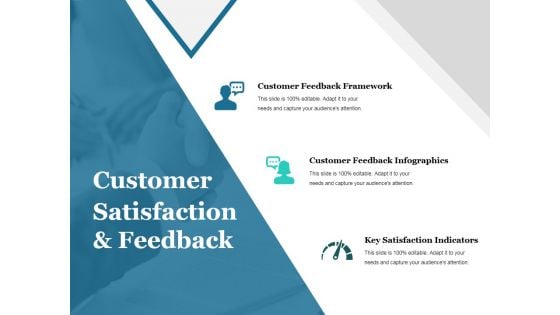
Customer Satisfaction And Feedback Ppt PowerPoint Presentation Infographic Template Master Slide
This is a customer satisfaction and feedback ppt powerpoint presentation infographic template master slide. This is a three stage process. The stages in this process are customer feedback framework, customer feedback infographics, key satisfaction indicators, business, icons.
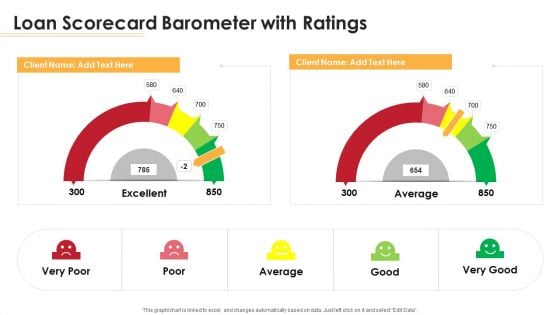
Loan Scorecard Barometer With Ratings Ppt Outline Information PDF
Deliver an awe inspiring pitch with this creative loan scorecard barometer with ratings ppt outline information pdf bundle. Topics like loan scorecard barometer with ratings can be discussed with this completely editable template. It is available for immediate download depending on the needs and requirements of the user.
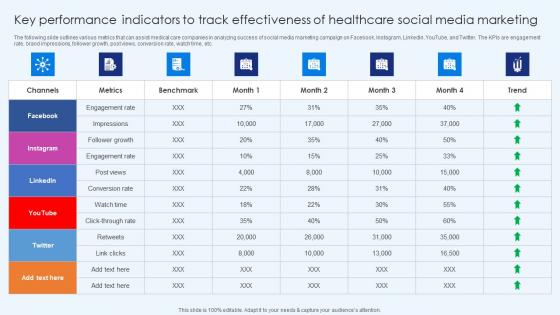
Key Performance Indicators To Tracks Effectiveness Healthcare Promotion Diagrams Pdf
The following slide outlines various metrics that can assist medical care companies in analyzing success of social media marketing campaign on Facebook, Instagram, LinkedIn, YouTube, and Twitter. The KPIs are engagement rate, brand impressions, follower growth, post views, conversion rate, watch time, etc. Slidegeeks has constructed Key Performance Indicators To Tracks Effectiveness Healthcare Promotion Diagrams Pdf after conducting extensive research and examination. These presentation templates are constantly being generated and modified based on user preferences and critiques from editors. Here, you will find the most attractive templates for a range of purposes while taking into account ratings and remarks from users regarding the content. This is an excellent jumping-off point to explore our content and will give new users an insight into our top-notch PowerPoint Templates. The following slide outlines various metrics that can assist medical care companies in analyzing success of social media marketing campaign on Facebook, Instagram, LinkedIn, YouTube, and Twitter. The KPIs are engagement rate, brand impressions, follower growth, post views, conversion rate, watch time, etc.
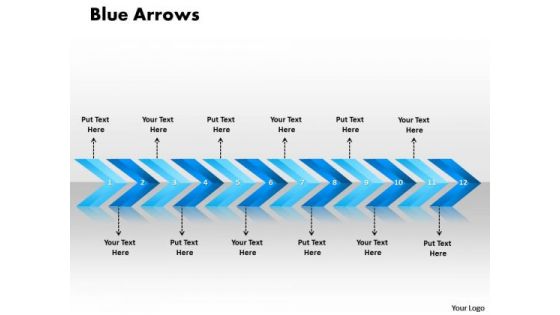
Ppt Linear Arrows 12 Phase Diagram PowerPoint Templates
PPT linear arrows 12 phase diagram PowerPoint Templates-This PowerPoint diagram depicts the sequence and illustration of the twelve steps in Horizontal manner.-PPT linear arrows 12 phase diagram PowerPoint Templates-Aim, Arrow, Arrowheads, Badge, Border, Click, Connection, Curve, Design, Direction, Download, Element, Fuchsia, Icon, Illustration, Indicator, Internet, Magenta, Mark, Object, Orientation, Pointer, Shadow, Shape, Sign Give birth to ambition with our Ppt Linear Arrows 12 Phase Diagram PowerPoint Templates. Let your thoughts design a dream.
Ppt Linear Arrow 12 Phase Diagram PowerPoint Templates
PPT linear arrow 12 phase diagram PowerPoint Templates-In this Linear Arrow PPT Slide, arrows show the flow, or movement, of the sales plan from one step to the next. -PPT linear arrow 12 phase diagram PowerPoint Templates-Aim, Arrow, Arrowheads, Badge, Border, Click, Connection, Curve, Design, Direction, Download, Element, Fuchsia, Icon, Illustration, Indicator, Internet, Magenta, Mark, Object, Orientation, Pointer, Shadow, Shape, Sign Everything is feasible with our Ppt Linear Arrow 12 Phase Diagram PowerPoint Templates. They contain abundant dexterity.
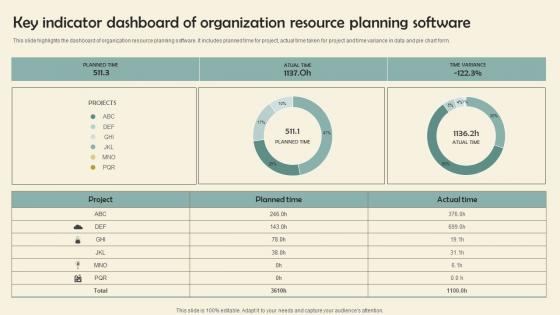
Key Indicator Dashboard Of Organization Resource Planning Software Themes Pdf
This slide highlights the dashboard of organization resource planning software. It includes planned time for project, actual time taken for project and time variance in data and pie chart form.Showcasing this set of slides titled Key Indicator Dashboard Of Organization Resource Planning Software Themes Pdf The topics addressed in these templates are Key Indicator, Dashboard Organization, Resource Planning Software All the content presented in this PPT design is completely editable. Download it and make adjustments in color, background, font etc. as per your unique business setting. This slide highlights the dashboard of organization resource planning software. It includes planned time for project, actual time taken for project and time variance in data and pie chart form.
Ppt Linear Arrows 7 State PowerPoint Project Diagram Templates
PPT linear arrows 7 state powerpoint project diagram Templates-This PowerPoint template has the theme of Linear arrows. By using objects in this template you can compose your own process flow.-PPT linear arrows 7 state powerpoint project diagram Templates-Aim, Arrow, Arrowheads, Badge, Border, Click, Connection, Curve, Design, Direction, Download, Element, Fuchsia, Icon, Illustration, Indicator, Internet, Magenta, Mark, Object, Orientation, Pointer, Shadow, Shape, Sign Investigate problems with our Ppt Linear Arrows 7 State PowerPoint Project Diagram Templates. Download without worries with our money back guaranteee.

Fuel Gauge Indicating Empty And Full Levels Ppt PowerPoint Presentation Portfolio Clipart PDF
Presenting fuel gauge indicating empty and full levels ppt powerpoint presentation portfolio clipart pdf to dispense important information. This template comprises one stages. It also presents valuable insights into the topics including fuel gauge indicating empty and full levels. This is a completely customizable PowerPoint theme that can be put to use immediately. So, download it and address the topic impactfully.
Ppt Linear Arrows 9 State PowerPoint Presentation Diagram Templates
PPT linear arrows 9 state powerpoint presentation diagram Templates-This PowerPoint diagram depicts the sequence and illustration of the nine steps in Horizontal manner.-PPT linear arrows 9 state powerpoint presentation diagram Templates-Aim, Arrow, Arrowheads, Badge, Border, Click, Connection, Curve, Design, Direction, Download, Element, Fuchsia, Icon, Illustration, Indicator, Internet, Magenta, Mark, Object, Orientation, Pointer, Shadow, Shape, Sign Impress the establishment with our Ppt Linear Arrows 9 State PowerPoint Presentation Diagram Templates. They will like the choices you make.
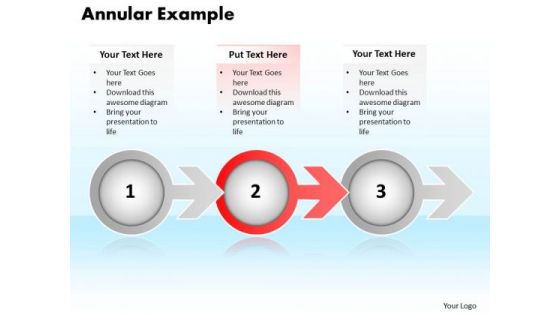
Ppt Annular Example Of 3 Stages Using Arrow PowerPoint Templates
PPT annular example of 3 stages using arrow PowerPoint Templates-This PowerPoint diagram shows three circles connected with arrows. Circles defines path functions and arrows indicate the progression of the process-PPT annular example of 3 stages using arrow PowerPoint Templates-3d, Arrow, Bevel, Blue, Boy, Bright, Circular, Concept, Design, Fancy, Funky, Graphic, Icon, Illustration, Isolated, Logo, Male, Man, Reflection, Shinning, Sign, Symbol, Vivid Avoid fiascos with our Ppt Annular Example Of 3 Stages Using Arrow PowerPoint Templates. You will be armed to face any contingency.
Ppt Arrow Description Of 2 State PowerPoint Project Diagram Method Templates
PPT arrow description of 2 state powerpoint project diagram method Templates-This diagram is the sequence diagram that shows the flow of communication between two parties-PPT arrow description of 2 state powerpoint project diagram method Templates-Aim, Arrow, Arrowheads, Badge, Border, Click, Connection, Curve, Design, Direction, Download, Element, Fuchsia, Icon, Illustration, Indicator, Internet, Magenta, Mark, Object, Orientation, Pointer, Shadow, Shape, Sign Fetch up with our Ppt Arrow Description Of 2 State PowerPoint Project Diagram Method Templates. You will be applauded wherever you go.
Ppt Arrow Description Of 2 Power Point Stage Action PowerPoint Templates
PPT arrow description of 2 power point stage action PowerPoint Templates-This diagram is the sequence diagram that shows the flow of communication between two parties-PPT arrow description of 2 power point stage action PowerPoint Templates-Aim, Arrow, Arrowheads, Badge, Border, Click, Connection, Curve, Design, Direction, Download, Element, Fuchsia, Icon, Illustration, Indicator, Internet, Magenta, Mark, Object, Orientation, Pointer, Shadow, Shape, Sign Our Ppt Arrow Description Of 2 Power Point Stage Action PowerPoint Templates can be exhilirating. Excitement levels will climb like never before.
Ppt Arrow Description Of 2 Stages In Process PowerPoint Templates
PPT arrow description of 2 stages in process PowerPoint Templates-This diagram is the sequence diagram that shows the flow of communication between two parties-PPT arrow description of 2 stages in process PowerPoint Templates-Aim, Arrow, Arrowheads, Badge, Border, Click, Connection, Curve, Design, Direction, Download, Element, Fuchsia, Icon, Illustration, Indicator, Internet, Magenta, Mark, Object, Orientation, Pointer, Shadow, Shape, Sign Show direct & decisive organizational leadership with our Ppt Arrow Description Of 2 Stages In Process PowerPoint Templates. They will make you look good.
Ppt Linear Arrows 11 Power Point Stage PowerPoint Templates
PPT linear arrows 11 power point stage PowerPoint Templates-This PowerPoint diagram depicts the sequence and illustration of the eleven steps in Horizontal manner.-PPT linear arrows 11 power point stage PowerPoint Templates-Aim, Arrow, Arrowheads, Badge, Border, Click, Connection, Curve, Design, Direction, Download, Element, Fuchsia, Icon, Illustration, Indicator, Internet, Magenta, Mark, Object, Orientation, Pointer, Shadow, Shape, Sign Your thoughts will soon be in flower. Our Ppt Linear Arrows 11 Power Point Stage PowerPoint Templates will nurse them from bud to bloom.
Ppt Five Create PowerPoint Macro Linear Writing Process Presentation Templates
PPT five create powerpoint macro linear writing process presentation Templates-This Diagram helps you to portray specific models like Analyze, Plan, Implement and Review model or any other customized processes.-PPT five create powerpoint macro linear writing process presentation Templates-Aim, Arrow, Arrowheads, Border, Click, Connection, Curve, Design, Direction, Download, Element, Icon, Illustration, Indicator, Internet, Mark, Object, Orientation, Pointer, Shadow, Shape, Sign Make your competition seem feeble with our Ppt Five Create PowerPoint Macro Linear Writing Process Presentation Templates. Just download, type and present.
Ppt Six PowerPoint Slide Numbers Linear Process Templates
PPT six powerpoint slide numbers linear process Templates-This Linear Process diagram provides a visual representation of the steps in a business process-PPT six powerpoint slide numbers linear process Templates-Aim, Arrow, Arrowheads, Badge, Border, Click, Connection, Curve, Design, Direction, Download, Element, Fuchsia, Icon, Illustration, Indicator, Internet, Magenta, Mark, Object, Orientation, Pointer, Shadow, Shape, Sign Acquire the fame you deserve. Our Ppt Six PowerPoint Slide Numbers Linear Process Templates will aid you to achieve acclaim.
Ppt Three Create PowerPoint Macro Linear Process Templates
PPT three create powerpoint macro linear process Templates-This diagram helps you to analyze all the connected ideas and also can be used to show three aspects of an issue.-PPT three create powerpoint macro linear process Templates-Aim, Arrow, Arrowheads, Badge, Border, Click, Connection, Curve, Design, Direction, Download, Element, Fuchsia, Icon, Illustration, Indicator, Internet, Magenta, Mark, Object, Orientation, Pointer, Shadow, Shape, Sign Get on a accelerated career track with our Ppt Three Create PowerPoint Macro Linear Process Templates. They will make you look good.
Ppt Linear Arrows 6 Stages PowerPoint Templates
PPT linear arrows 6 stages PowerPoint Templates-This PowerPoint template has the theme of Linear arrows. By using objects in this template you can compose your own process flow.-PPT linear arrows 6 stages PowerPoint Templates-Aim, Arrow, Arrowheads, Badge, Border, Click, Connection, Curve, Design, Direction, Download, Element, Fuchsia, Icon, Illustration, Indicator, Internet, Magenta, Mark, Object, Orientation, Pointer, Shadow, Shape, Sign Amend archaic ideas with our Ppt Linear Arrows 6 Stages PowerPoint Templates. Ring in desirable changes with your thoughts.
Ppt Linear Arrows 10 Power Point Stage PowerPoint Templates
PPT linear arrows 10 power point stage PowerPoint Templates-This PowerPoint template has the theme of Linear arrows. By using objects in this template you can compose your own process flow.-PPT linear arrows 10 power point stage PowerPoint Templates-Aim, Arrow, Arrowheads, Badge, Border, Click, Connection, Curve, Design, Direction, Download, Element, Fuchsia, Icon, Illustration, Indicator, Internet, Magenta, Mark, Object, Orientation, Pointer, Shadow, Shape, Sign Well begun is half done. Get a dream beginning with our Ppt Linear Arrows 10 Power Point Stage PowerPoint Templates.
Ppt Pointer Linear Arrow Process 6 Stages PowerPoint Templates
PPT Pointer linear arrow process 6 stages PowerPoint Templates-Deliver amazing Presentations with our above template that helps to define the mission and decide how it will be accomplished.-PPT Pointer linear arrow process 6 stages PowerPoint Templates-Aim, Arrow, Arrowheads, Badge, Border, Click, Connection, Curve, Design, Direction, Download, Element, Fuchsia, Icon, Illustration, Indicator, Internet, Magenta, Mark, Object, Orientation, Pointer, Shadow, Shape, Sign End all differences with our Ppt Pointer Linear Arrow Process 6 Stages PowerPoint Templates. They encourage achieving consensus.
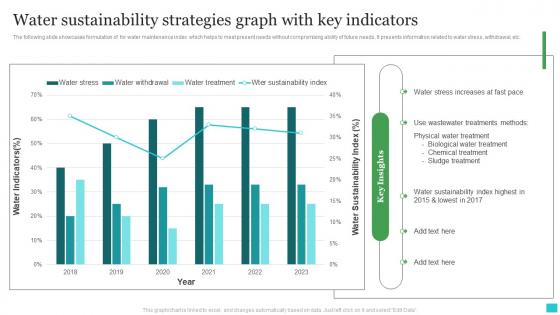
Water Sustainability Strategies Graph With Key Indicators Diagrams Pdf
The following slide showcases formulation of for water maintenance index which helps to meet present needs without compromising ability of future needs. It presents information related to water stress, withdrawal, etc. Showcasing this set of slides titled Water Sustainability Strategies Graph With Key Indicators Diagrams Pdf. The topics addressed in these templates are Biological Water Treatment,Chemical Treatment, Sludge Treatment. All the content presented in this PPT design is completely editable. Download it and make adjustments in color, background, font etc. as per your unique business setting. The following slide showcases formulation of for water maintenance index which helps to meet present needs without compromising ability of future needs. It presents information related to water stress, withdrawal, etc.
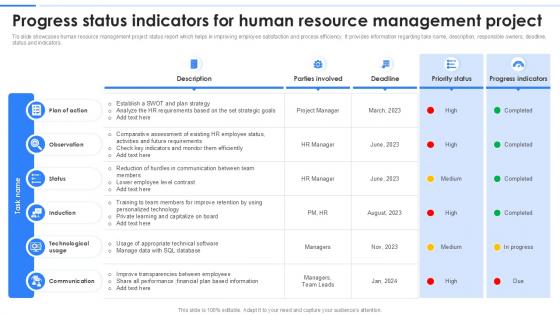
Progress Status Indicators For Human Resource Management Project
If you are looking for a format to display your unique thoughts, then the professionally designed Profit And Loss Waterfall Powerpoint Ppt Template is the one for you. You can use it as a Google Slides template or a PowerPoint template. Incorporate impressive visuals, symbols, images, and other charts. Modify or reorganize the text boxes as you desire. Experiment with shade schemes and font pairings. Alter, share or cooperate with other people on your work. Download Profit And Loss Waterfall Powerpoint Ppt Template and find out how to give a successful presentation. Present a perfect display to your team and make your presentation unforgettable. This template showcases Human Resource Management Project Status Report designed to enhance employee satisfaction and streamline process efficiency. It includes components such as task name, description, responsible owners, deadlines, current status, and progress indicators.
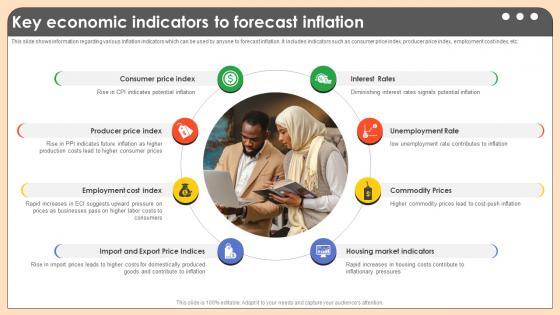
Key Economic Indicators To Forecast Inflation Comprehensive Guide On Inflation Control CM SS V
This slide shows information regarding various inflation indicators which can be used by anyone to forecast inflation. It includes indicators such as consumer price index, producer price index, employment cost index, etc. Retrieve professionally designed Key Economic Indicators To Forecast Inflation Comprehensive Guide On Inflation Control CM SS V to effectively convey your message and captivate your listeners. Save time by selecting pre-made slideshows that are appropriate for various topics, from business to educational purposes. These themes come in many different styles, from creative to corporate, and all of them are easily adjustable and can be edited quickly. Access them as PowerPoint templates or as Google Slides themes. You do not have to go on a hunt for the perfect presentation because Slidegeeks got you covered from everywhere. This slide shows information regarding various inflation indicators which can be used by anyone to forecast inflation. It includes indicators such as consumer price index, producer price index, employment cost index, etc.
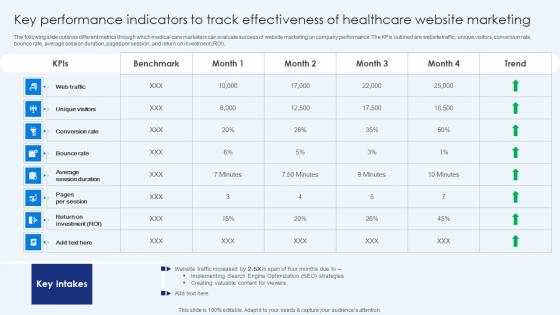
Key Performance Indicators To Track Effectiveness Healthcare Promotion Portrait Pdf
The following slide outlines different metrics through which medical care marketers can evaluate success of website marketing on company performance. The KPIs outlined are website traffic, unique visitors, conversion rate, bounce rate, average session duration, pages per session, and return on investment ROI. Are you searching for a Key Performance Indicators To Track Effectiveness Healthcare Promotion Portrait Pdf that is uncluttered, straightforward, and original Its easy to edit, and you can change the colors to suit your personal or business branding. For a presentation that expresses how much effort you have put in, this template is ideal With all of its features, including tables, diagrams, statistics, and lists, its perfect for a business plan presentation. Make your ideas more appealing with these professional slides. Download Key Performance Indicators To Track Effectiveness Healthcare Promotion Portrait Pdffrom Slidegeeks today. The following slide outlines different metrics through which medical care marketers can evaluate success of website marketing on company performance. The KPIs outlined are website traffic, unique visitors, conversion rate, bounce rate, average session duration, pages per session, and return on investment ROI.
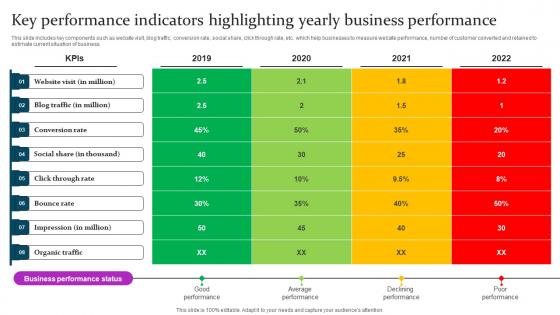
Key Performance Indicators Marketing Mix Communication Guide Client Elements Pdf
This slide includes key components such as website visit, blog traffic, conversion rate, social share, click through rate, etc. which help businesses to measure website performance, number of customer converted and retained to estimate current situation of business. Whether you have daily or monthly meetings, a brilliant presentation is necessary. Key Performance Indicators Marketing Mix Communication Guide Client Elements Pdf can be your best option for delivering a presentation. Represent everything in detail using Key Performance Indicators Marketing Mix Communication Guide Client Elements Pdf and make yourself stand out in meetings. The template is versatile and follows a structure that will cater to your requirements. All the templates prepared by Slidegeeks are easy to download and edit. Our research experts have taken care of the corporate themes as well. So, give it a try and see the results. This slide includes key components such as website visit, blog traffic, conversion rate, social share, click through rate, etc. which help businesses to measure website performance, number of customer converted and retained to estimate current situation of business.
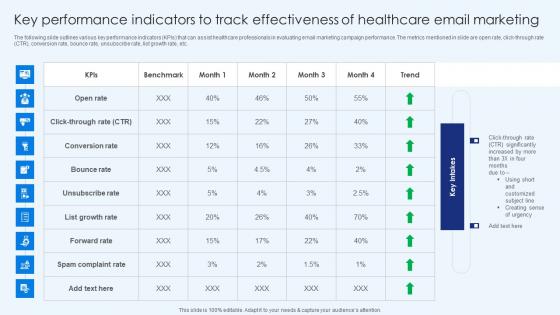
Key Performance Indicators To Track Effectiveness Of Healthcare Promotion Download Pdf
The following slide outlines various key performance indicators KPIs that can assist healthcare professionals in evaluating email marketing campaign performance. The metrics mentioned in slide are open rate, click-through rate CTR, conversion rate, bounce rate, unsubscribe rate, list growth rate, etc. Retrieve professionally designed Key Performance Indicators To Track Effectiveness Of Healthcare Promotion Download Pdf to effectively convey your message and captivate your listeners. Save time by selecting pre-made slideshows that are appropriate for various topics, from business to educational purposes. These themes come in many different styles, from creative to corporate, and all of them are easily adjustable and can be edited quickly. Access them as PowerPoint templates or as Google Slides themes. You do not have to go on a hunt for the perfect presentation because Slidegeeks got you covered from everywhere. The following slide outlines various key performance indicators KPIs that can assist healthcare professionals in evaluating email marketing campaign performance. The metrics mentioned in slide are open rate, click-through rate CTR, conversion rate, bounce rate, unsubscribe rate, list growth rate, etc.
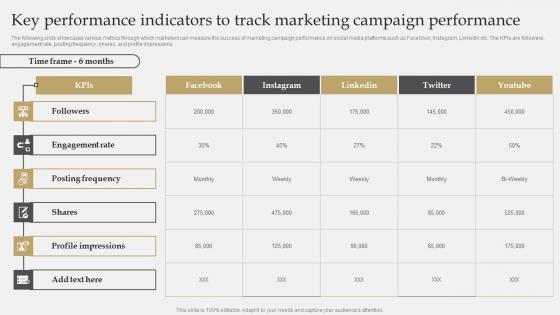
IT Industry Market Research Key Performance Indicators To Track Marketing Campaign Rules Pdf
The following slide showcases various metrics through which marketers can measure the success of marketing campaign performance on social media platforms such as Facebook, Instagram, LinkedIn etc. The KPIs are followers, engagement rate, posting frequency, shares, and profile impressions. Whether you have daily or monthly meetings, a brilliant presentation is necessary. IT Industry Market Research Key Performance Indicators To Track Marketing Campaign Rules Pdf can be your best option for delivering a presentation. Represent everything in detail using IT Industry Market Research Key Performance Indicators To Track Marketing Campaign Rules Pdf and make yourself stand out in meetings. The template is versatile and follows a structure that will cater to your requirements. All the templates prepared by Slidegeeks are easy to download and edit. Our research experts have taken care of the corporate themes as well. So, give it a try and see the results. The following slide showcases various metrics through which marketers can measure the success of marketing campaign performance on social media platforms such as Facebook, Instagram, LinkedIn etc. The KPIs are followers, engagement rate, posting frequency, shares, and profile impressions.
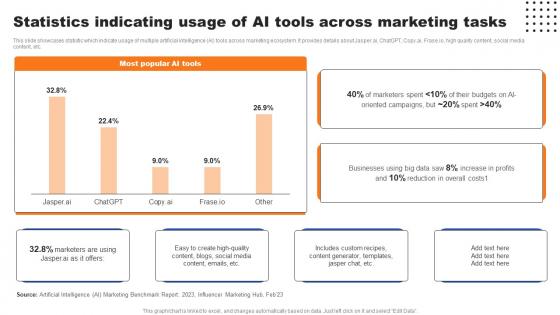
Statistics Indicating Usage Of AI Tools Across Marketing Tasks Ppt Inspiration Clipart Images Pdf
This slide showcases statistic which indicate usage of multiple artificial intelligence AI tools across marketing ecosystem. It provides details about Jasper.ai, ChatGPT, Copy.ai, Frase.io, high quality content, social media content, etc. Retrieve professionally designed Statistics Indicating Usage Of AI Tools Across Marketing Tasks Ppt Inspiration Clipart Images Pdf to effectively convey your message and captivate your listeners. Save time by selecting pre-made slideshows that are appropriate for various topics, from business to educational purposes. These themes come in many different styles, from creative to corporate, and all of them are easily adjustable and can be edited quickly. Access them as PowerPoint templates or as Google Slides themes. You do not have to go on a hunt for the perfect presentation because Slidegeeks got you covered from everywhere. This slide showcases statistic which indicate usage of multiple artificial intelligence AI tools across marketing ecosystem. It provides details about Jasper.ai, ChatGPT, Copy.ai, Frase.io, high quality content, social media content, etc.
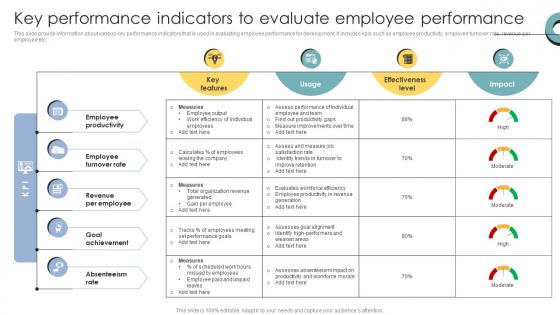
Skill Enhancement Performance Key Performance Indicators To Evaluate Employee Performance
This slide provide information about various key performance indicators that is used in evaluating employee performance for development. It includes kpis such as employee productivity, employee turnover rate, revenue per employee etc. Get a simple yet stunning designed Skill Enhancement Performance Key Performance Indicators To Evaluate Employee Performance. It is the best one to establish the tone in your meetings. It is an excellent way to make your presentations highly effective. So, download this PPT today from Slidegeeks and see the positive impacts. Our easy-to-edit Skill Enhancement Performance Key Performance Indicators To Evaluate Employee Performance can be your go-to option for all upcoming conferences and meetings. So, what are you waiting for Grab this template today. This slide provide information about various key performance indicators that is used in evaluating employee performance for development. It includes kpis such as employee productivity, employee turnover rate, revenue per employee etc.
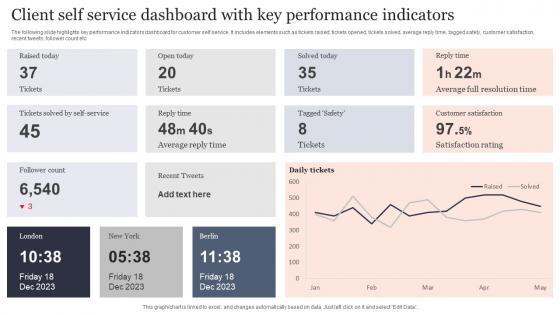
Client Self Service Dashboard With Key Performance Indicators Pictures Pdf
The following slide highlights key performance indicators dashboard for customer self service. It includes elements such as tickets raised, tickets opened, tickets solved, average reply time, tagged safety, customer satisfaction, recent tweets, follower count etc. Showcasing this set of slides titled Client Self Service Dashboard With Key Performance Indicators Pictures Pdf. The topics addressed in these templates are Open Today, Reply Time. All the content presented in this PPT design is completely editable. Download it and make adjustments in color, background, font etc. as per your unique business setting. The following slide highlights key performance indicators dashboard for customer self service. It includes elements such as tickets raised, tickets opened, tickets solved, average reply time, tagged safety, customer satisfaction, recent tweets, follower count etc.
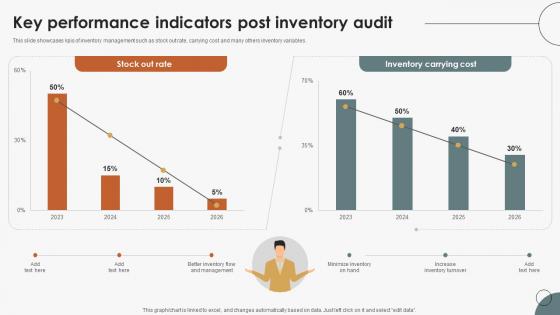
Boosting Efficiency In Inventory Key Performance Indicators Post Inventory Audit
This slide showcases kpis of inventory management such as stock out rate, carrying cost and many others inventory variables. Make sure to capture your audiences attention in your business displays with our gratis customizable Boosting Efficiency In Inventory Key Performance Indicators Post Inventory Audit. These are great for business strategies, office conferences, capital raising or task suggestions. If you desire to acquire more customers for your tech business and ensure they stay satisfied, create your own sales presentation with these plain slides. This slide showcases kpis of inventory management such as stock out rate, carrying cost and many others inventory variables.
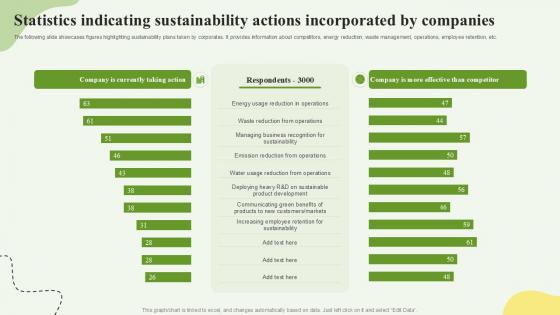
Statistics Indicating Sustainability Actions Incorporated By Companies Ppt Example SS
This slide represents the pyramid showing the performance of the human resource department of an organization. It includes details related to recruitment and selection, talent management, leadership capability, performance culture and strategic advantage. There are so many reasons you need a Statistics Indicating Sustainability Actions Incorporated By Companies Ppt Example SS The first reason is you can not spend time making everything from scratch, Thus, Slidegeeks has made presentation templates for you too. You can easily download these templates from our website easily. This slide represents the pyramid showing the performance of the human resource department of an organization. It includes details related to recruitment and selection, talent management, leadership capability, performance culture and strategic advantage.
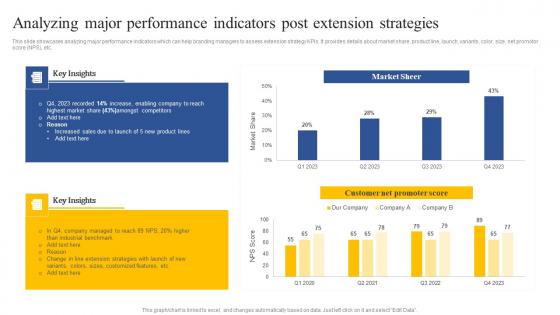
Analyzing Major Performance Indicators Post Extension How To Implement Product Guidelines Pdf
This slide showcases analyzing major performance indicators which can help branding managers to assess extension strategy KPIs. It provides details about market share, product line, launch, variants, color, size, net promotor score NPS, etc. If your project calls for a presentation, then Slidegeeks is your go-to partner because we have professionally designed, easy-to-edit templates that are perfect for any presentation. After downloading, you can easily edit Analyzing Major Performance Indicators Post Extension How To Implement Product Guidelines Pdf and make the changes accordingly. You can rearrange slides or fill them with different images. Check out all the handy templates This slide showcases analyzing major performance indicators which can help branding managers to assess extension strategy KPIs. It provides details about market share, product line, launch, variants, color, size, net promotor score NPS, etc.
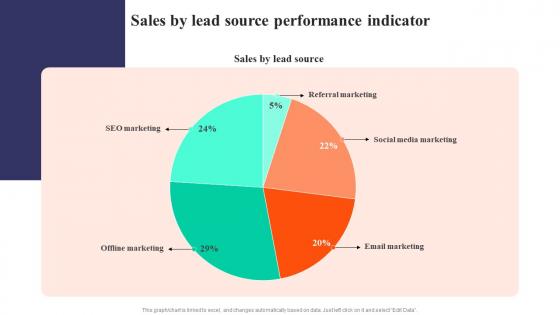
Sales By Lead Source Performance Indicator Strategies To Develop Successful Guidelines Pdf
This modern and well-arranged Sales By Lead Source Performance Indicator Strategies To Develop Successful Guidelines Pdf provides lots of creative possibilities. It is very simple to customize and edit with the Powerpoint Software. Just drag and drop your pictures into the shapes. All facets of this template can be edited with Powerpoint no extra software is necessary. Add your own material, put your images in the places assigned for them, adjust the colors, and then you can show your slides to the world, with an animated slide included. Our Sales By Lead Source Performance Indicator Strategies To Develop Successful Guidelines Pdf are topically designed to provide an attractive backdrop to any subject. Use them to look like a presentation pro.
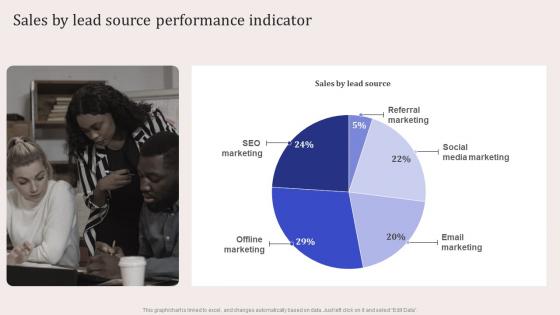
Sales By Lead Source Performance Indicator Virtual Event Promotion To Capture Infographics Pdf
The Sales By Lead Source Performance Indicator Virtual Event Promotion To Capture Infographics Pdf is a compilation of the most recent design trends as a series of slides. It is suitable for any subject or industry presentation, containing attractive visuals and photo spots for businesses to clearly express their messages. This template contains a variety of slides for the user to input data, such as structures to contrast two elements, bullet points, and slides for written information. Slidegeeks is prepared to create an impression. Our Sales By Lead Source Performance Indicator Virtual Event Promotion To Capture Infographics Pdf are topically designed to provide an attractive backdrop to any subject. Use them to look like a presentation pro.
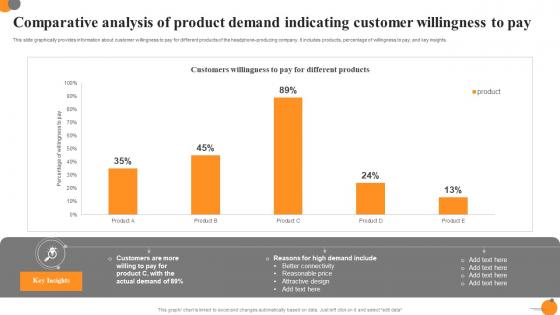
Comparative Analysis Of Product Demand Indicating Customer Willingness To Pay Ppt Gallery Influencers Pdf
This slide graphically provides information about customer willingness to pay for different products of the headphone-producing company. It includes products, percentage of willingness to pay, and key insights. Pitch your topic with ease and precision using this Comparative Analysis Of Product Demand Indicating Customer Willingness To Pay Ppt Gallery Influencers Pdf. This layout presents information on Customers, Willingness To Pay, Different Products. It is also available for immediate download and adjustment. So, changes can be made in the color, design, graphics or any other component to create a unique layout. This slide graphically provides information about customer willingness to pay for different products of the headphone-producing company. It includes products, percentage of willingness to pay, and key insights.
Linkedin Content Strategies Ad Campaign Performance Indicators Tracking MKT SS V
This slide covers dashboard to measure the performance of ad campaigns on LinkedIn platform. The purpose of this template is to provide the company an overview on the outcomes of running ad campaigns on LinkedIn. It includes performance based on impressions, CTR, engagement rates, CPC, CPM, etc. There are so many reasons you need a Linkedin Content Strategies Ad Campaign Performance Indicators Tracking MKT SS V. The first reason is you can not spend time making everything from scratch, Thus, Slidegeeks has made presentation templates for you too. You can easily download these templates from our website easily. This slide covers dashboard to measure the performance of ad campaigns on LinkedIn platform. The purpose of this template is to provide the company an overview on the outcomes of running ad campaigns on LinkedIn. It includes performance based on impressions, CTR, engagement rates, CPC, CPM, etc.

Manufacturing Plant Sustainability Dashboard Indicating Sourcing And Consumption Ppt Slide SS
The following slide showcases business sustainability innovation model. It provides information about public policy, business case, financing, company level, stakeholders, etc. The Manufacturing Plant Sustainability Dashboard Indicating Sourcing And Consumption Ppt Slide SS is a compilation of the most recent design trends as a series of slides. It is suitable for any subject or industry presentation, containing attractive visuals and photo spots for businesses to clearly express their messages. This template contains a variety of slides for the user to input data, such as structures to contrast two elements, bullet points, and slides for written information. Slidegeeks is prepared to create an impression. The following slide showcases business sustainability innovation model. It provides information about public policy, business case, financing, company level, stakeholders, etc.
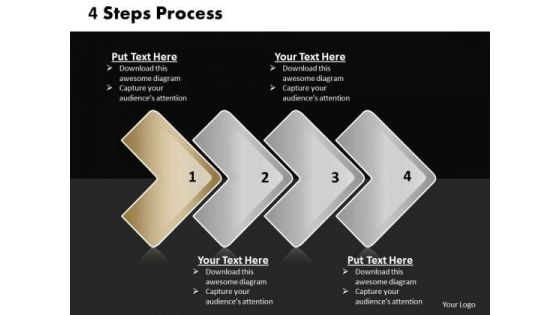
Ppt Direct Description Of 4 PowerPoint Slide Numbers Included A Task Templates
PPT direct description of 4 powerpoint slide numbers included a task Templates-Use above diagram to illustrate a stepwise process or a phase structure. Grab the attention of your team with this eye catching template presenting indicators of the path you have in mind. Use this diagram to enthuse your colleagues-PPT direct description of 4 powerpoint slide numbers included a task Templates-Aim, Arrow, Arrowheads, Badge, Border, Click, Connection, Curve, Design, Direction, Download, Element, Fuchsia, Icon, Illustration, Indicator, Internet, Magenta, Mark, Object, Orientation, Pointer, Shadow, Shape, Sign Get up real close with our Ppt Direct Description Of 4 PowerPoint Slide Numbers Included A Task Templates. Your goals will come within touching distance.
Sales Ppt Background Linear Arrows 7 Stages Business Communication PowerPoint 3 Image
sales PPT Background linear arrows 7 stages business communication powerpoint 3 Image-Arrows Indicates the way to growth. Use this diagram for improved controls to drive your business towards the right direction. This Linear arrow diagram helps to focus the thoughts of your listeners-sales PPT Background linear arrows 7 stages business communication powerpoint 3 Image-Aim, Angle, Arrow, Arrowheads, Badge, Banner, Connection, Curve, Design, Direction, Download, Element, Fuchsia, Icon, Illustration, Indicator, Internet, Label, Link, Magenta, Mark, Marker, Next, Object, Orange, Orientation, Pointer, Shadow, Shape, Signs Symbol Bash on ahead with bold conviction. Have no fear with our Sales Ppt Background Linear Arrows 7 Stages Business Communication PowerPoint 3 Image.
Ppt Arrow Pointing Curved Process 6 Phase Diagram PowerPoint Templates
PPT arrow Pointing curved process 6 phase diagram PowerPoint Templates-Clear thinking is your strength transmits your thoughts to your eager team. Use this diagram to evolve the strategy to take you down the required path with appropriate, efficient and effective marketing along the way.-PPT arrow Pointing curved process 6 phase diagram PowerPoint Templates-Aim, Arrow, Arrowheads, Badge, Border, Click, Connection, Curve, Design, Direction, Download, Element, Fuchsia, Icon, Illustration, Indicator, Internet, Magenta, Mark, Object, Orientation, Pointer, Shadow, Shape, Sign Make the event with our Ppt Arrow Pointing Curved Process 6 Phase Diagram PowerPoint Templates. Your thoughts will be really happening.
Ppt Linear Arrows 3 Phase Diagram PowerPoint Templates
PPT linear arrows 3 phase diagram PowerPoint Templates-In this Linear Arrow PPT Slide, arrows show the flow, or movement, of the process from one step to the next. -PPT linear arrows 3 phase diagram PowerPoint Templates-Aim, Arrow, Arrowheads, Badge, Border, Click, Connection, Curve, Design, Direction, Download, Element, Fuchsia, Icon, Illustration, Indicator, Internet, Magenta, Mark, Object, Orientation, Pointer, Shadow, Shape, Sign Our Ppt Linear Arrows 3 Phase Diagram PowerPoint Templates will ensure you are the best presenter in the room. You will be glad you tried us out.
Ppt Direct Description Of 4 Phase Diagram Included Process PowerPoint Templates
PPT direct description of 4 phase diagram included process PowerPoint Templates-Emphatically define your message with our above template which shows four parts of a process. You can easily edit the size, position and text. Create captivating presentations to deliver comparative and weighted arguments.-PPT direct description of 4 phase diagram included process PowerPoint Templates-Aim, Arrow, Arrowheads, Badge, Border, Click, Connection, Curve, Design, Direction, Download, Element, Fuchsia, Icon, Illustration, Indicator, Internet, Magenta, Mark, Object, Orientation, Pointer, Shadow, Shape, Sign Our Ppt Direct Description Of 4 Phase Diagram Included Process PowerPoint Templates give exceptional value. You will be amazed at the awesome returns.
Ppt Summary Of 4 State PowerPoint Project Diagram Involved Mechanism Templates
PPT summary of 4 state powerpoint project diagram involved mechanism Templates-This diagram is a graphical illustration of the relationships between and among sets of data, groups of objects that share something in common. They are indicators of the path you have in mind.-PPT summary of 4 state powerpoint project diagram involved mechanism Templates-abstract, background, balance, business, circle, colorful, complement, concept, conceptual, connected, control, cooperation, design, gear, harmony, icon, ideal, illustration, involved, machine, progress, rhythm, round, shape, spin, support, system, teamwork, technology, together, wheel Ask any favour of our Ppt Summary Of 4 State PowerPoint Project Diagram Involved Mechanism Templates. You will find them truly accomodating.
Ppt Consecutive Explanation Of 5 Steps Through Arrows PowerPoint 2010 Templates
PPT consecutive explanation of 5 steps through arrows powerpoint 2010 Templates-This is a type of diagram that represents an algorithm or process, showing the steps as circles. Arrows Indicates the way to growth. Use this diagram for improved controls to drive your business towards the right direction.-PPT consecutive explanation of 5 steps through arrows powerpoint 2010 Templates-3d, Abstract, Arrow, Circle, Circular, Click, Computer, Data, Direction, Graphic, Icon, Illustration, Insignia, Intention, Internet, Isolated, Label, Mail, Mascot, Media, Menu, Motion, Page, Pushing, Search, Shiny, Sign, Simple, Symbol Exhibit your plan with our Ppt Consecutive Explanation Of 5 Steps Through Arrows PowerPoint 2010 Templates. Display the clarity of your ideas.
Ppt Consecutive Implementation Of 6 Concepts Through Arrows PowerPoint 2010 Templates
PPT consecutive implementation of 6 concepts through arrows powerpoint 2010 Templates-This arrow diagram is built for presenting different ways for a single process. This power point diagram consists of 6 arrows. Continuous and ongoing process can be shown using this PPT Template.-PPT consecutive implementation of 6 concepts through arrows powerpoint 2010 Templates-Aim, Arrow, Badge, Border, Color, Connection, Curve, Design, Direction, Download, Icon, Illustration, Indicator, Internet, Label, Link, Magenta, Mark, Next, Object, Orientation, Paper, Peeling, Pointer, Rounded, Set, Shadow, Shape, Sign Concentrate on the important stuff with our Ppt Consecutive Implementation Of 6 Concepts Through Arrows PowerPoint 2010 Templates. You will come out on top.
Ppt Consecutive Practice Of 6 Concepts Through Circular Arrows PowerPoint 2010 Templates
PPT consecutive practice of 6 concepts through circular arrows powerpoint 2010 Templates-This arrow diagram is built for presenting different ways for a single process. This power point diagram consists of 6 arrows. Continuous and ongoing process can be shown using this PPT Template.-PPT consecutive practice of 6 concepts through circular arrows powerpoint 2010 Templates-Aim, Arrow, Badge, Border, Color, Connection, Curve, Design, Direction, Download, Icon, Illustration, Indicator, Internet, Label, Link, Magenta, Mark, Next, Object, Orientation, Paper, Peeling, Pointer, Rounded, Set, Shadow, Shape, Sign You are known to be erudite. Share your learning with our Ppt Consecutive Practice Of 6 Concepts Through Circular Arrows PowerPoint 2010 Templates.
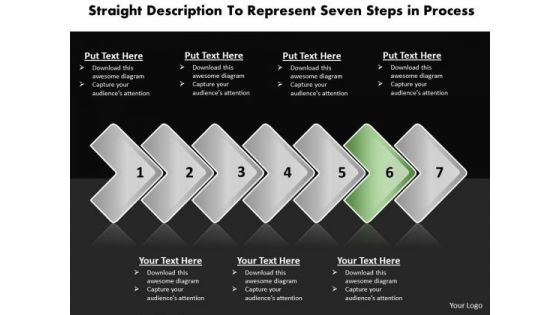
Ppt Straight Explanation To Represent Seven Steps In Process PowerPoint Templates
PPT straight explanation to represent seven steps in process PowerPoint Templates-Develop competitive advantage with our above Diagram which contains a diagram of horizontal arrows. These arrows are indicators of the path you have in mind. Use them to help you organize the logic of your views-PPT straight explanation to represent seven steps in process PowerPoint Templates-above, aiming, arrow, arrowhead, balance, communicate, communication, connection, descriptive, design, designer, direct, direction, dynamic, element, graphic, high, icon, illustration, inform, internet, journey, multimedia, pointer, reflection, set, shape, sign, signal, straight, symbol, top, transportation, travel, vector You possess enterprising ideas. Display them with courage on our Ppt Straight Explanation To Represent Seven Steps In Process PowerPoint Templates.
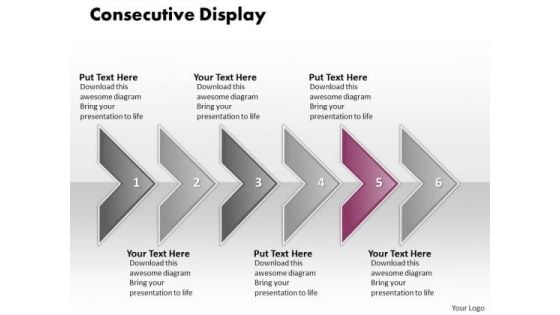
Ppt Consecutive Display Of 6 Concepts Through Curved Arrows PowerPoint 2010 Templates
PPT consecutive display of 6 concepts through curved arrows powerpoint 2010 Templates-This diagram is used to organize information so that it can be accessed more easily. It consists of consecutive arrows. You should understand your target audience and enhance presentations to create the wow effect to your visual delivery.-PPT consecutive display of 6 concepts through curved arrows powerpoint 2010 Templates-Aim, Arrow, Badge, Border, Color, Connection, Curve, Design, Direction, Download, Icon, Illustration, Indicator, Internet, Label, Link, Magenta, Mark, Next, Object, Orientation, Paper, Peeling, Pointer, Rounded, Set, Shadow, Shape, Sign Equalize the odds with our Ppt Consecutive Display Of 6 Concepts Through Curved Arrows PowerPoint 2010 Templates. Better the chances of your ideas working.
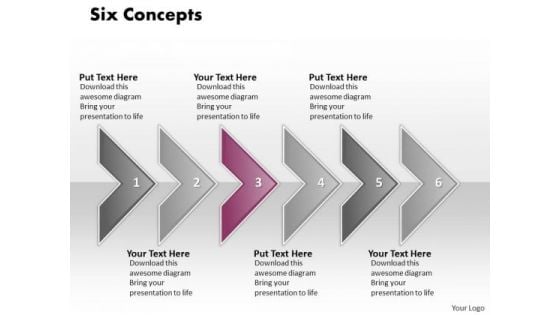
Ppt Consecutive Effect Of 6 Concepts Through Arrows PowerPoint Templates
PPT consecutive effect of 6 concepts through arrows powerpoint templates-This diagram organizes, represents and summarizes information so that patterns and relationships can be identified. It aims to inform, influence or convince an audience. Add charm and personality to your presentations with our attractive PPT design-PPT consecutive effect of 6 concepts through arrows powerpoint templates-Aim, Arrow, Badge, Border, Color, Connection, Curve, Design, Direction, Download, Icon, Illustration, Indicator, Internet, Label, Link, Magenta, Mark, Next, Object, Orientation, Paper, Peeling, Pointer, Rounded, Set, Shadow, Shape, Sign Display a fair minded approach with our Ppt Consecutive Effect Of 6 Concepts Through Arrows PowerPoint Templates. Give due attention to all aspects.
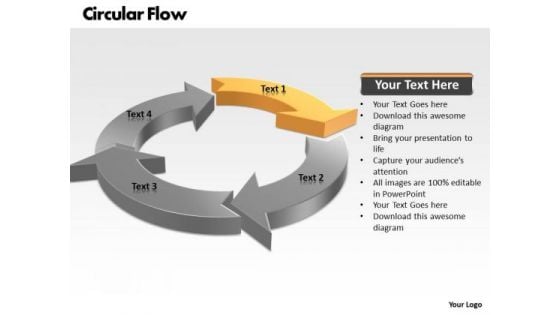
Ppt Circular Flow Process PowerPoint Presentation Chart 4 Stages Templates
PPT circular flow process powerpoint presentation chart 4 stages Templates-The diagrams are used to represent part whole relationship because results relationship etc. this is a 4 parts circle to express your ideas. They are indicators of the path you have in mind.-PPT circular flow process powerpoint presentation chart 4 stages Templates-Arrow, Chart, Circle, Circular, Circulation, Collection, Concept, Connection, Continuity, Cursor, Cycle, Cyclic, Diagram, Direction, Flow, Flowchart, Graph, Graphic, Group, Icon, Motion, Movement, Process, Progress, Recycle, Recycling, Refresh, Reload, Renew, Repetition, Return, Reuse, Ring, Rotation, Round, Sign, Six, Symbol Address eco-clubs with our Ppt Circular Flow Process PowerPoint Presentation Chart 4 Stages Templates. Advocate curbing of carbon emissions.
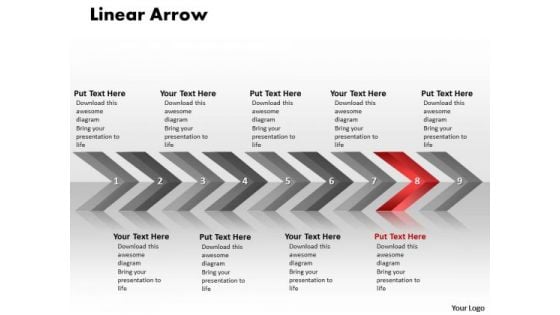
Editable Ppt Theme Linear Arrows 9 States Diagram Project Management PowerPoint Image
editable PPT Theme linear arrows 9 states diagram project management powerpoint Image-This diagram is a simple mapping tool that shows the sequence of actions within a process. Use this diagram to develop the teams vision of where they need to be in the future.-editable PPT Theme linear arrows 9 states diagram project management powerpoint Image-Aim, Angle, Arrow, Arrowheads, Badge, Banner, Connection, Curve, Design, Direction, Download, Element, Fuchsia, Icon, Illustration, Indicator, Internet, Label, Link, Magenta, Mark, Marker, Next, Object, Orange, Orientation, Pointer, Shadow, Shape, Signs Symbol Break out of the cocoon with our Editable Ppt Theme Linear Arrows 9 States Diagram Project Management PowerPoint Image. Let your thoughts take to the air.
Editable Ppt Theme Linear Flow 2 States Diagram Project Management PowerPoint 1 Image
editable PPT Theme linear flow 2 states diagram project management powerpoint 1 Image-This PowerPoint diagram can be used for product comparison. You can easily edit the size, position, text, color and change any other background style. Create captivating presentations to deliver comparative and weighted arguments.-editable PPT Theme linear flow 2 states diagram project management powerpoint 1 Image-Aim, Arrow, Arrowheads, Badge, Border, Click, Connection, Curve, Design, Direction, Download, Element, Fuchsia, Icon, Illustration, Indicator, Internet, Magenta, Mark, Object, Orientation, Pointer, Shadow, Shape, Sign Our Editable Ppt Theme Linear Flow 2 States Diagram Project Management PowerPoint 1 Image are very falcon like. They keep a sharp eye on the target.
Ppt Annular Description Of 3 State Diagram Using Arrow PowerPoint Templates
PPT annular description of 3 state diagram using arrow PowerPoint Templates-This PowerPoint diagram shows three circles connected with arrows. Circles defines path functions and arrows indicate the progression of the process-PPT annular description of 3 state diagram using arrow PowerPoint Templates-3d, Arrow, Bevel, Blue, Boy, Bright, Circular, Concept, Design, Fancy, Funky, Graphic, Icon, Illustration, Isolated, Logo, Male, Man, Reflection, Shinning, Sign, Symbol, Vivid You are entitled to excellence. Demand your due from our Ppt Annular Description Of 3 State Diagram Using Arrow PowerPoint Templates.
Ppt Annular Illustration Of 3 State PowerPoint Template Diagram Using Arrow Templates
PPT annular illustration of 3 state powerpoint template diagram using arrow Templates-This PowerPoint diagram shows three circles connected with arrows. Circles defines path functions and arrows indicate the progression of the process-PPT annular illustration of 3 state powerpoint template diagram using arrow Templates-3d, Arrow, Bevel, Blue, Boy, Bright, Circular, Concept, Design, Fancy, Funky, Graphic, Icon, Illustration, Isolated, Logo, Male, Man, Reflection, Shinning, Sign, Symbol, Vivid Enter the professional club with our Ppt Annular Illustration Of 3 State PowerPoint Template Diagram Using Arrow Templates. You will come out on top.
Ppt Linear Demonstration Of Arrows PowerPoint 2010 Org Chart Templates
PPT linear demonstration of arrows powerpoint 2010 org chart Templates-Life and Business is made up of processes comprising stages that flow from one to another. An excellent graphic to attract the attention of and understanding by your audience to improve earnings.-PPT linear demonstration of arrows powerpoint 2010 org chart Templates-Aim, Arrow, Arrowheads, Badge, Border, Click, Connection, Curve, Design, Direction, Download, Element, Fuchsia, Icon, Illustration, Indicator, Internet, Magenta, Mark, Object, Orientation, Pointer, Shadow, Shape, Sign Encourage creativity with our Ppt Linear Demonstration Of Arrows PowerPoint 2010 Org Chart Templates. You will come out on top.
Ppt Linaer Arrow Business PowerPoint Theme Process 6 Stages Templates
PPT linaer arrow business powerpoint theme process 6 stages Templates-The mind is always whirring with new ideas. Use this attractive diagram to inform audiences of the various means they have to achieve them.-PPT linaer arrow business powerpoint theme process 6 stages Templates-Aim, Arrow, Arrowheads, Badge, Border, Click, Connection, Curve, Design, Direction, Download, Element, Fuchsia, Icon, Illustration, Indicator, Internet, Magenta, Mark, Object, Orientation, Pointer, Shadow, Shape, Sign Find the perfect fit with our Ppt Linaer Arrow Business PowerPoint Theme Process 6 Stages Templates. Try us out and see what a difference our templates make.
Ppt 2 State Diagram Linear Procurement Process PowerPoint Presentation Templates
PPT 2 state diagram linear procurement process powerpoint presentation Templates-Our Template designs are State of the Art. This one depicts the popular linear chart. The structure of our template allows you to effectively highlight the key issues concerning the growth of your business.-PPT 2 state diagram linear procurement process powerpoint presentation Templates-Aim, Arrow, Arrowheads, Badge, Border, Click, Connection, Curve, Design, Direction, Download, Element, Fuchsia, Icon, Illustration, Indicator, Internet, Magenta, Mark, Object, Orientation, Pointer, Shadow, Shape, Sign You know you have the feel for it. Confidently address your audience with our Ppt 2 State Diagram Linear Procurement Process PowerPoint Presentation Templates.
Ppt 3d Circular Curved Arrows PowerPoint 2010 Showing Pink Stage Templates
PPT 3d circular curved arrows powerpoint 2010 showing pink stage Templates-This 3D Business PowerPoint Diagram shows the circular arrows connected to each other signifying step by step execution. The items are professionally animated and are easily editable. This diagram is useful to show interrelated factors, give and take interaction etc.-PPT 3d circular curved arrows powerpoint 2010 showing pink stage Templates-arrow, black, blue, bright, brown, button, cartography, circle, direction, fuchsia, glossy, green, icon, indicator, internet, light, map, modern, multicolor, nautical, navigation, orientation, pink, pointer, round, set, shadow, shiny, simple, star, vector Allow discussions with our Ppt 3d Circular Curved Arrows PowerPoint 2010 Showing Pink Stage Templates. You will come out on top.
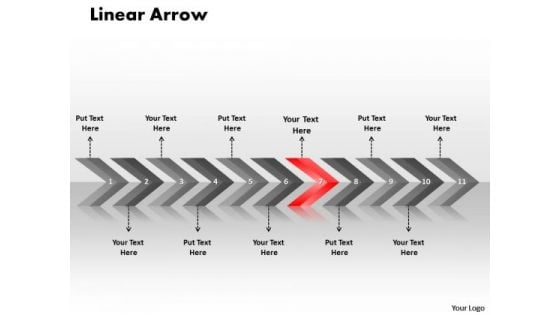
Business Ppt Theme Linear Arrows 11 Power Point Stage Strategy PowerPoint 8 Graphic
Business PPT Theme linear arrows 11 power point stage strategy powerpoint 8 Graphic-Use these Linear Arrows to Illustrate Processes Step by Step in PowerPoint Presentations. This diagram has the unique ability to drive home your ideas and show how they mesh to guarantee success.-Business PPT Theme linear arrows 11 power point stage strategy powerpoint 8 Graphic-Aim, Angle, Arrow, Arrowheads, Badge, Banner, Connection, Curve, Design, Direction, Download, Element, Fuchsia, Icon, Illustration, Indicator, Internet, Label, Link, Magenta, Mark, Marker, Next, Object, Orange, Orientation, Pointer, Shadow, Shape, Signs Symbol Alert your team to possibilities with our Business Ppt Theme Linear Arrows 11 Power Point Stage Strategy PowerPoint 8 Graphic. You will come out on top.
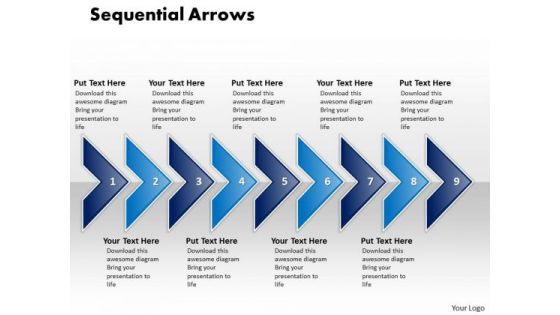
Ppt Linear Arrow 9 State PowerPoint Presentation Diagram Templates
PPT linear arrow 9 state powerpoint presentation diagram Templates-This PowerPoint template has the theme of Linear arrows. By using objects in this template you can compose your own process flow.-PPT linear arrow 9 state powerpoint presentation diagram Templates-Aim, Arrow, Arrowheads, Badge, Border, Click, Connection, Curve, Design, Direction, Download, Element, Fuchsia, Icon, Illustration, Indicator, Internet, Magenta, Mark, Object, Orientation, Pointer, Shadow, Shape, Sign Hammer out any doubts with our Ppt Linear Arrow 9 State PowerPoint Presentation Diagram Templates. Try us out and see what a difference our templates make.
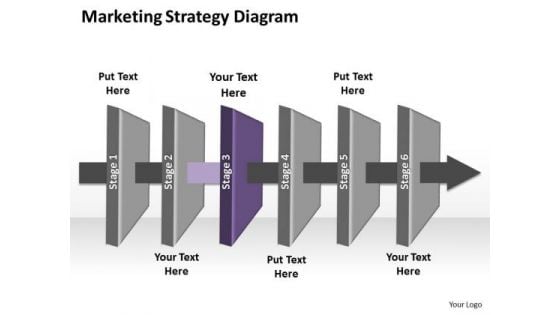
Ppt Linear Flow Of Marketing Startegy Swim Lane Diagram PowerPoint Template Templates
PPT linear flow of marketing startegy swim lane diagram powerpoint template Templates-In above diagram steps in a process are shown with symbolic shapes, and the flow of the process is indicated with arrow connecting the symbols. Create dynamic Microsoft office PPT Presentations with our professional template -PPT linear flow of marketing startegy swim lane diagram powerpoint template Templates-3d, Air, Arrow, Art, Business, Chart, Clip, Clipart, Cooling, Diagram, Drip, Drop, Dry, Energy, Eps10, Evaporate, Evaporating, Evaporation, Graphic, Heat, Icon, Illustration, Isolated, Isometric, Layers, Material, Moisture, Process Display leadership with our Ppt Linear Flow Of Marketing Startegy Swim Lane Diagram PowerPoint Template Templates. Download without worries with our money back guaranteee.
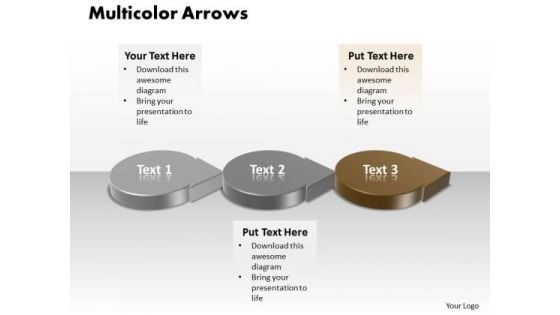
Ppt 3d Circular Arrows PowerPoint 2010 Showing Brown Stage Templates
PPT 3d circular arrows powerpoint 2010 showing brown stage Templates-Diagrams for PowerPoint Circle arrow offer an elegant alternative to the boring bullet points used in Presentations. You can portray specific models like Analyze, Plan, Implement and Review model, Waterfall model or any other customized processes.-PPT 3d circular arrows powerpoint 2010 showing brown stage Templates-arrow, black, blue, bright, brown, button, cartography, circle, direction, fuchsia, glossy, green, icon, indicator, internet, light, map, modern, multicolor, nautical, navigation, orientation, pink, pointer, round, set, shadow, shiny, simple, star, vector Navigate difficult territory with our Ppt 3d Circular Arrows PowerPoint 2010 Showing Brown Stage Templates. Download without worries with our money back guaranteee.
Ppt 3d Circular PowerPoint Graphics Arrows Showing Purple Stage Templates
PPT 3d circular powerpoint graphics arrows showing purple stage Templates-Use this PowerPoint diagram to define basic work and data flow and quality management processes to increase efficiency of your business.-PPT 3d circular powerpoint graphics arrows showing purple stage Templates-arrow, black, blue, bright, brown, button, cartography, circle, direction, fuchsia, glossy, green, icon, indicator, internet, light, map, modern, multicolor, nautical, navigation, orientation, pink, pointer, round, set, shadow, shiny, simple, star, vector Cruise along with our Ppt 3d Circular PowerPoint Graphics Arrows Showing Purple Stage Templates. Your thoughts will pick up the flow.
Ppt Blue Layouts PowerPoint 2003 Free Circle Shaped Text Arrow Templates
PPT blue layouts powerpoint 2003 free circle shaped text arrow Templates-This PowerPoint Diagram shows you the Sequential Flow of Business Process using Circular arrows. It consists of four stages or approaches or factors or components.-PPT blue layouts powerpoint 2003 free circle shaped text arrow Templates-arrow, black, blue, bright, brown, button, cartography, circle, direction, fuchsia, glossy, green, icon, indicator, internet, light, map, modern, multicolor, nautical, navigation, orientation, pink, pointer, round, set, shadow, shiny, simple, star, vector The environment deserves constant attention. Keep an eye through our Ppt Blue Layouts PowerPoint 2003 Free Circle Shaped Text Arrow Templates.
Ppt Linear Illustration Of Process Using 4 State Diagram PowerPoint Templates
PPT linear illustration of process using 4 state diagram PowerPoint Templates-This PowerPoint template depicts the popular linear chart. Determine your targets and sequence them as per your priorities. Unravel the desired and essential elements of your overall strategy.-PPT linear illustration of process using 4 state diagram PowerPoint Templates-Aim, Arrow, Arrowheads, Badge, Border, Click, Connection, Curve, Design, Direction, Download, Element, Fuchsia, Icon, Illustration, Indicator, Internet, Magenta, Mark, Object, Orientation, Pointer, Shadow, Shape, Sign Our content is tried and tested by thousands. Join them with our Ppt Linear Illustration Of Process Using 4 State Diagram PowerPoint Templates. You'll always stay ahead of the game.
Ppt Linear Flow Of Process Using 4 State PowerPoint Presentation Diagram Templates
PPT linear flow of process using 4 state powerpoint presentation diagram Templates-This templatehelps you chart the course of your presentation. The concept and strategy is your strength. Our template will help pinpoint their viability.-PPT linear flow of process using 4 state powerpoint presentation diagram Templates-Aim, Arrow, Arrowheads, Badge, Border, Click, Connection, Curve, Design, Direction, Download, Element, Fuchsia, Icon, Illustration, Indicator, Internet, Magenta, Mark, Object, Orientation, Pointer, Shadow, Shape, Sign Display an ambitious attitude with our Ppt Linear Flow Of Process Using 4 State PowerPoint Presentation Diagram Templates. Your audience will become believers.
Ppt Linear Arrows 5 State PowerPoint Project Diagram Templates
PPT linear arrows 5 state powerpoint project diagram Templates-This PPT is made of Linear arrows. This graphics is of superlative quality that makes an attractive presentation. This template is quite a remedy to present any process-PPT linear arrows 5 state powerpoint project diagram Templates-Aim, Arrow, Arrowheads, Badge, Border, Click, Connection, Curve, Design, Direction, Download, Element, Fuchsia, Icon, Illustration, Indicator, Internet, Magenta, Mark, Object, Orientation, Pointer, Shadow, Shape, Sign Clever is the basic for our Ppt Linear Arrows 5 State PowerPoint Project Diagram Templates. Brilliance is what your thoughts will achieve.

 Home
Home