Meter Icon
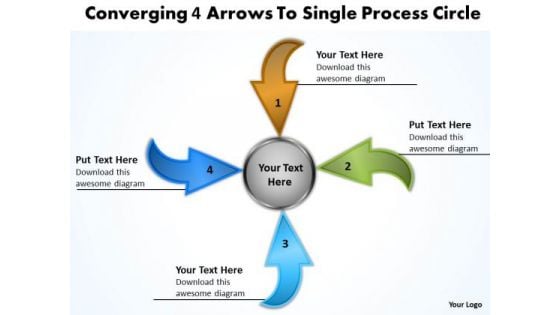
Converging 4 Arrows To Single Process Circle Pie Diagram PowerPoint Templates
We present our converging 4 arrows to single process circle Pie Diagram PowerPoint templates.Download and present our Arrows PowerPoint Templates because you will be able to Highlight your ideas broad-based on strong fundamentals and illustrate how they step by step acheive the set growth factor. Use our Circle Charts PowerPoint Templates because you can present your opinions in this field using our impressive templates. Download our Shapes PowerPoint Templates because displaying your ideas and highlighting your ability will accelerate the growth of your company and yours. Download and present our Business PowerPoint Templates because your ideas too are pinpointedly focused on you goals. Present our Flow Charts PowerPoint Templates because you can Unravel the desired and essential elements of your overall strategy.Use these PowerPoint slides for presentations relating to arrow, arrowheads, badge, banner, blue, button, cerulean, cobalt, colored, colorful, connection, cursor, cyan, design element, designator, directional, download, emblem, gray shadow, green, icon, indicator, interface, internet, link, load, magenta, marker, matted, menu tool, navigation panel, next, orientation, page site, pictogram, pink, pointer, red, right, satined, sign, signpost, smooth, symbol, upload, vector illustration, web, web 2.0, white background. The prominent colors used in the PowerPoint template are Blue, Brown, Green. Presenters tell us our converging 4 arrows to single process circle Pie Diagram PowerPoint templates are Nostalgic. You can be sure our banner PowerPoint templates and PPT Slides are Radiant. Professionals tell us our converging 4 arrows to single process circle Pie Diagram PowerPoint templates are Stylish. People tell us our colored PowerPoint templates and PPT Slides will generate and maintain the level of interest you desire. They will create the impression you want to imprint on your audience. People tell us our converging 4 arrows to single process circle Pie Diagram PowerPoint templates are Handsome. Professionals tell us our banner PowerPoint templates and PPT Slides are Efficient. Carry your thoughts on our Converging 4 Arrows To Single Process Circle Pie Diagram PowerPoint Templates. They will take them that much further.
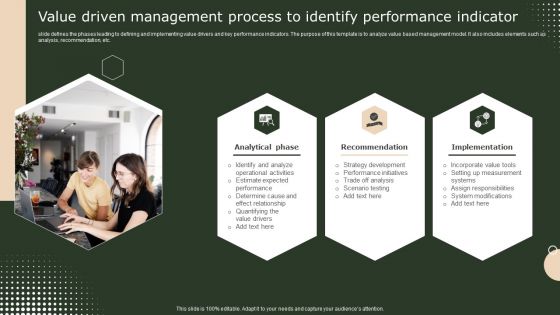
Value Driven Management Process To Identify Performance Indicator Themes PDF
slide defines the phases leading to defining and implementing value drivers and key performance indicators. The purpose of this template is to analyze value based management model. It also includes elements such as analysis, recommendation, etc. Persuade your audience using this Value Driven Management Process To Identify Performance Indicator Themes PDF. This PPT design covers three stages, thus making it a great tool to use. It also caters to a variety of topics including Recommendation, Analytical Phase, Implementation. Download this PPT design now to present a convincing pitch that not only emphasizes the topic but also showcases your presentation skills.
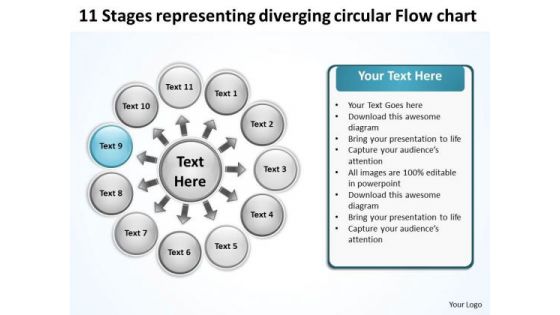
Representing Diverging Circular Flow Chart Process PowerPoint Slides
We present our representing diverging circular flow chart Process PowerPoint Slides.Use our Ring charts PowerPoint Templates because the lessons have been analyzed, studied and conclusions drawn. Present our Circle charts PowerPoint Templates because you will be able to Highlight these individual targets and the paths to their achievement. Use our Process and Flows PowerPoint Templates because this unique template give you an enthusiastic response and a purposeful Aye- Aye Sir. Download and present our Business PowerPoint Templates because you have had a great year or so business wise. It is time to celebrate the efforts of your team. Download our Marketing PowerPoint Templates because networking is an imperative in todays world. You need to access the views of others. Similarly you need to give access to them of your abilities.Use these PowerPoint slides for presentations relating to Cerulean, circle, circulation, cobalt,colorful, cyan, cycle, element,emblem, grayshadow, green,icon, indicator, interface, internet, label,link, load, marker, motion, movement,navigationpanel, next, orientation, pagsite, pink, pointer, previous, process, reload, rotation, satined, sign, signpost,smooth, sticker, sticky, symbol. The prominent colors used in the PowerPoint template are Blue light, Black, White. Customers tell us our representing diverging circular flow chart Process PowerPoint Slides are Lush. We assure you our cyan PowerPoint templates and PPT Slides are Adorable. PowerPoint presentation experts tell us our representing diverging circular flow chart Process PowerPoint Slides are Sparkling. People tell us our circulation PowerPoint templates and PPT Slides are Luxurious. We assure you our representing diverging circular flow chart Process PowerPoint Slides are Wistful. Use our element PowerPoint templates and PPT Slides are Handsome. Cure your organization's problems with our Representing Diverging Circular Flow Chart Process PowerPoint Slides. You will come out on top.
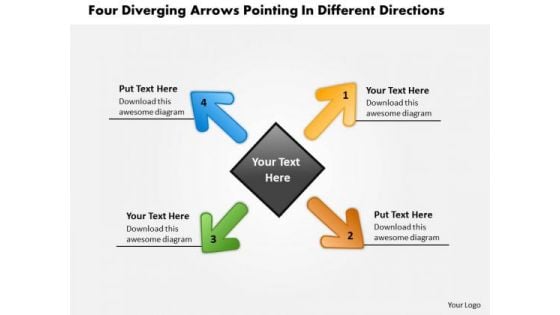
Arrows Pointing Different Directions Circular Flow Chart PowerPoint Templates
We present our arrows pointing different directions Circular Flow Chart PowerPoint templates.Download our Arrows PowerPoint Templates because you can Amplify your views, ideas and thoughts from very basic aspects to the highly technical and complicated issus using this template as a tool. Download our Business PowerPoint Templates because you can Flutter your wings and enchant the world. Impress them with the innate attractiveness of your thoughts and words. Download our Shapes PowerPoint Templates because this slide depicts the occasion for gifting and giving. Download our Metaphors-Visual Concepts PowerPoint Templates because you can Present your views on the methods using our self-explanatory templates. Use our Flow Charts PowerPoint Templates because it Saves your time as a prized possession, an ideal aid to give an ideal presentation.Use these PowerPoint slides for presentations relating to arrow, arrowheads, badge, banner, blue, button, cerulean, cobalt, colored, colorful, connection, cursor, cyan, design element, designator, directional, download, emblem, gray shadow, green, icon, indicator, interface, internet, link, load, magenta, marker, matted, menu tool, navigation panel, next, orientation, page site, pictogram, pink, pointer, red, right, satined, sign, signpost, smooth, symbol, upload, vector illustration, web, web 2.0, white background. The prominent colors used in the PowerPoint template are Green, Blue, Orange. Presenters tell us our arrows pointing different directions Circular Flow Chart PowerPoint templates have awesome images to get your point across. You can be sure our colored PowerPoint templates and PPT Slides are Functional. Professionals tell us our arrows pointing different directions Circular Flow Chart PowerPoint templates are visually appealing. People tell us our banner PowerPoint templates and PPT Slides are Nice. People tell us our arrows pointing different directions Circular Flow Chart PowerPoint templates are Efficacious. Professionals tell us our blue PowerPoint templates and PPT Slides are Royal. Burst through the ceiling with our Arrows Pointing Different Directions Circular Flow Chart PowerPoint Templates. Rise strongly above created barriers.
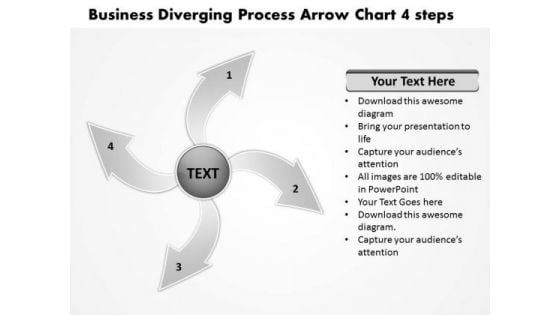
Presentation Diverging Process Arrow Chart 4 Steps Cycle PowerPoint Slides
We present our presentation diverging process arrow chart 4 steps Cycle PowerPoint Slides.Present our Arrows PowerPoint Templates because this PPt slide highlights any anticipated problems, shortfalls or weak areas. Use our Flow charts PowerPoint Templates because displaying your ideas and highlighting your ability will accelerate the growth of your company and yours. Use our Process and Flows PowerPoint Templates because the fruit of your labour is about to ripen. Download and present our Business PowerPoint Templates because the great Bald headed Eagle embodies your personality. the eagle eye to seize upon the smallest of opportunities. Use our Shapes PowerPoint Templates because the ideas and plans are on your finger tips.Use these PowerPoint slides for presentations relating to Button,cerulean, circle, circulation, cobalt,colorful,cycle, element,emblem, grayshadow, green,icon, indicator, interface, internet, label,link, load, marker, motion, movement,navigationpanel, next, orientation, pagsite, pink, pointer, previous, process, reload, rotation, satined, sign, signpost,smooth, sticker, sticky, symbol. The prominent colors used in the PowerPoint template are Gray, Black, White. Customers tell us our presentation diverging process arrow chart 4 steps Cycle PowerPoint Slides are Zippy. We assure you our cobalt PowerPoint templates and PPT Slides are Pleasant. PowerPoint presentation experts tell us our presentation diverging process arrow chart 4 steps Cycle PowerPoint Slides are Fancy. People tell us our cycle PowerPoint templates and PPT Slides are Striking. We assure you our presentation diverging process arrow chart 4 steps Cycle PowerPoint Slides are Romantic. Use our circle PowerPoint templates and PPT Slides are Awesome. Our Presentation Diverging Process Arrow Chart 4 Steps Cycle PowerPoint Slides fall in step with your thought. They will go through the drill with you.
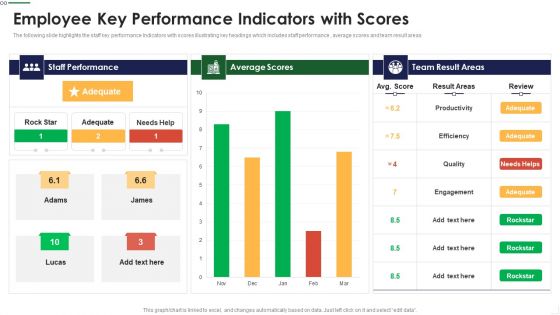
Employee Key Performance Indicators With Scores Themes PDF
The following slide highlights the staff key performance Indicators with scores illustrating key headings which includes staff performance , average scores and team result areas Pitch your topic with ease and precision using this Employee Key Performance Indicators With Scores Themes PDF This layout presents information on Staff Performance, Average Scores, Team Result It is also available for immediate download and adjustment. So, changes can be made in the color, design, graphics or any other component to create a unique layout.
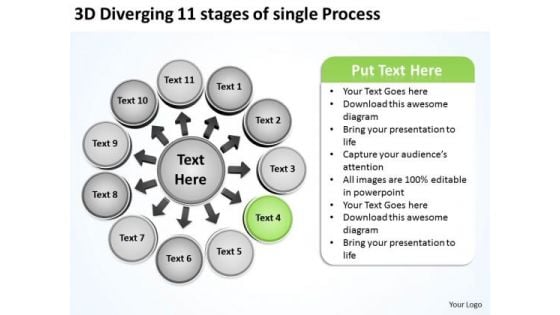
3d Diverging 11 Stages Of Single Process Business Circular Flow Arrow Chart PowerPoint Slides
We present our 3d diverging 11 stages of single process business Circular Flow Arrow Chart PowerPoint Slides.Use our Business PowerPoint Templates because you too have got the framework of your companys growth in place. Download our Circle charts PowerPoint Templates because you should Emphasise the process of your business or corporate growth. Download our Arrows PowerPoint Templates because colours generate instant reactions in our brains. Use our Shapes PowerPoint Templates because it Creates a winner with your passion and dream. Use our Flow charts PowerPoint Templates because they are the indicators of the path you have in mind.Use these PowerPoint slides for presentations relating to Abstract, arrow, arrow, circle, business, concept, career, center, stage, chart, circle circle, connection, contrast, cycle, diagram, direction, flow flowchart, future, graph, icon, illustration, isolate, isolated, job, life, loop, money, motion network, recycle, refresh, ring, rotation, sick, sign, symbol, simply, target, wealth. The prominent colors used in the PowerPoint template are Green, Gray, White. People tell us our 3d diverging 11 stages of single process business Circular Flow Arrow Chart PowerPoint Slides are No-nonsense. PowerPoint presentation experts tell us our center PowerPoint templates and PPT Slides provide great value for your money. Be assured of finding the best projection to highlight your words. Presenters tell us our 3d diverging 11 stages of single process business Circular Flow Arrow Chart PowerPoint Slides are Glamorous. PowerPoint presentation experts tell us our circle PowerPoint templates and PPT Slides are Spiffy. People tell us our 3d diverging 11 stages of single process business Circular Flow Arrow Chart PowerPoint Slides are specially created by a professional team with vast experience. They diligently strive to come up with the right vehicle for your brilliant Ideas. People tell us our stage PowerPoint templates and PPT Slides are Youthful. However faint their hopes may be. Buck them up with our 3d Diverging 11 Stages Of Single Process Business Circular Flow Arrow Chart PowerPoint Slides.
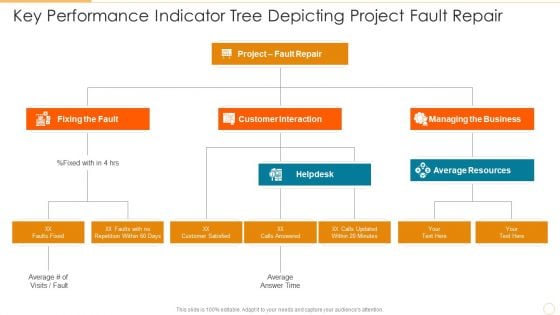
Key Performance Indicator Tree Depicting Project Fault Repair Diagrams PDF
Presenting key performance indicator tree depicting project fault repair diagrams pdf to dispense important information. This template comprises three stages. It also presents valuable insights into the topics including customer interaction, managing the business, fixing the fault. This is a completely customizable PowerPoint theme that can be put to use immediately. So, download it and address the topic impactfully.
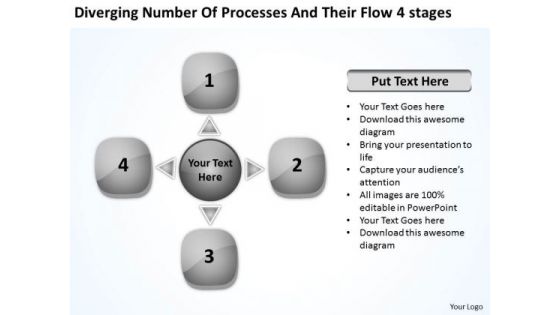
Number Of Processes And Their Stages Cycle Motion Chart PowerPoint Templates
We present our number of processes and their stages Cycle Motion Chart PowerPoint templates.Download our Symbol PowerPoint Templates because they are the indicators of the path you have in mind. Download and present our Arrows PowerPoint Templates because you can get advantage to prioritise your ideas. Present our Business PowerPoint Templates because you too have got the framework of your companys growth in place. Download our Shapes PowerPoint Templates because knowledge is power goes the popular saying. Download and present our Process and Flows PowerPoint Templates because the ideas and plans are on your finger tips.Use these PowerPoint slides for presentations relating to Abstract, Arrows, Blank, Business, Central, Centralized, Chart, Circle, Circular, Circulation, Concept, Conceptual, Converging, Design, Diagram, Empty, Executive, Five, Icon, Idea, Illustration, Management, Map, Mapping, Organization, Outwards, Pointing, Procedure, Process, Relationship, Strategy, Template. The prominent colors used in the PowerPoint template are White, Gray, Black. Use our number of processes and their stages Cycle Motion Chart PowerPoint templates are Festive. We assure you our Centralized PowerPoint templates and PPT Slides are Beautiful. People tell us our number of processes and their stages Cycle Motion Chart PowerPoint templates provide great value for your money. Be assured of finding the best projection to highlight your words. PowerPoint presentation experts tell us our Blank PowerPoint templates and PPT Slides are Colorful. PowerPoint presentation experts tell us our number of processes and their stages Cycle Motion Chart PowerPoint templates are Endearing. Use our Blank PowerPoint templates and PPT Slides are Stunning. Consolidate successes with our Number Of Processes And Their Stages Cycle Motion Chart PowerPoint Templates. Download without worries with our money back guaranteee.
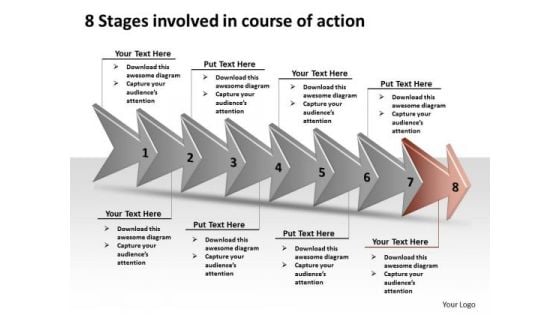
8 Stages Involved Course Of Action Ppt Production Flow Charts PowerPoint Slides
We present our 8 stages involved course of action ppt production flow charts PowerPoint Slides.Download our Leadership PowerPoint Templates because this diagram can be used to illustrate the logical path or system. Download our Shapes PowerPoint Templates because it Educates your team with your thoughts and logic. Present our Signs PowerPoint Templates because some opportunities are bound to be highly profitable for you to follow up. Use our Arrows PowerPoint Templates because we all know that alphabetical order is a time honoured concept. Download our Process and Flows PowerPoint Templates because this slide helps you to give your team an overview of your capability and insight into the minute details of the overall picture highlighting the interdependence at every operational level.Use these PowerPoint slides for presentations relating to Around, Arrows, artistic, bevel, bright, concept, conceptual, decrease, design, direction, down, ecology, high, icon, illustration, increase, indication, isolated, low, motion, movement, nature, opposite, point, protection, recycling, red, reflection, renewable, reuse, set, shinning, sign, stylish, symbol. The prominent colors used in the PowerPoint template are White, Black, Gray. The feedback we get is that our 8 stages involved course of action ppt production flow charts PowerPoint Slides are Youthful. People tell us our decrease PowerPoint templates and PPT Slides are Wistful. We assure you our 8 stages involved course of action ppt production flow charts PowerPoint Slides are Striking. Presenters tell us our design PowerPoint templates and PPT Slides are Gorgeous. We assure you our 8 stages involved course of action ppt production flow charts PowerPoint Slides are Charming. Use our concept PowerPoint templates and PPT Slides are Dynamic. Try our 8 Stages Involved Course Of Action Ppt Production Flow Charts PowerPoint Slides and get bitten by the bug. You will cease to consider anything else.
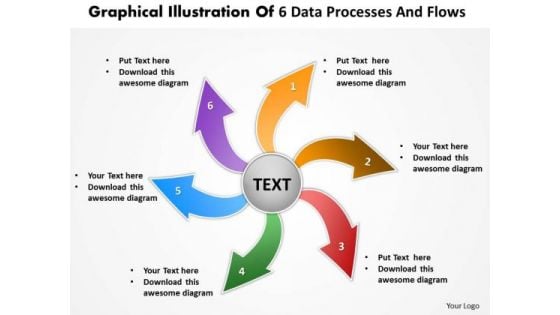
Illustration Of 6 Data Processes And Flows Circular Chart PowerPoint Templates
We present our illustration of 6 data processes and flows Circular Chart PowerPoint templates.Present our Arrows PowerPoint Templates because they are the indicators of the path you have in mind. Download our Circle Charts PowerPoint Templates because the ideas and plans are on your finger tips. Present our Shapes PowerPoint Templates because it shows how one can contribute to the overall feeling of well-being. Download our Business PowerPoint Templates because it will demonstrate the strength of character under severe stress. Shine the torch ahead and bring the light to shine on all. Present our Flow Charts PowerPoint Templates because you know what it takes to keep it fit and healthy.Use these PowerPoint slides for presentations relating to achievement, aim, around, arrow, blue, center, chart, circle, circular, connection, cursor, cycle, cyclic, decisions, direction, flow, graph, graphic, group, icon, illustration, isolated, loop, motion, movement, point, pointer, recycle, recycling, reuse, ring, rotation, round, sign, spin, symbol, target, team, teamwork, technology, turn, wheel, white. The prominent colors used in the PowerPoint template are Red, Green, Blue. Presenters tell us our illustration of 6 data processes and flows Circular Chart PowerPoint templates are Perfect. You can be sure our arrow PowerPoint templates and PPT Slides are Ultra. Professionals tell us our illustration of 6 data processes and flows Circular Chart PowerPoint templates are Nifty. People tell us our center PowerPoint templates and PPT Slides are Handsome. People tell us our illustration of 6 data processes and flows Circular Chart PowerPoint templates are Youthful. Professionals tell us our around PowerPoint templates and PPT Slides are Fancy. Address problems with our Illustration Of 6 Data Processes And Flows Circular Chart PowerPoint Templates. Download without worries with our money back guaranteee.
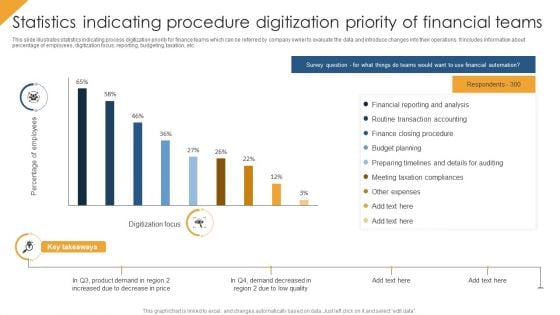
Statistics Indicating Procedure Digitization Priority Of Financial Teams Themes PDF
This slide illustrates statistics indicating process digitization priority for finance teams which can be referred by company owner to evaluate the data and introduce changes into their operations. It includes information about percentage of employees, digitization focus, reporting, budgeting, taxation, etc. Showcasing this set of slides titled Statistics Indicating Procedure Digitization Priority Of Financial Teams Themes PDF. The topics addressed in these templates are Budget Planning, Financial Reporting And Analysis, Other Expenses. All the content presented in this PPT design is completely editable. Download it and make adjustments in color, background, font etc. as per your unique business setting.
Share Portfolio Tracking Sheet To Analyze Market Indices Themes PDF
Following slide showcases portfolio tracking sheet to analyze stock market performance. This slide provides information about total number of shares purchased, price at which share bought, total cost, current market value of share, etc. Pitch your topic with ease and precision using this Share Portfolio Tracking Sheet To Analyze Market Indices Themes PDF. This layout presents information on Share Portfolio, Tracking Sheet, Market Indices. It is also available for immediate download and adjustment. So, changes can be made in the color, design, graphics or any other component to create a unique layout.
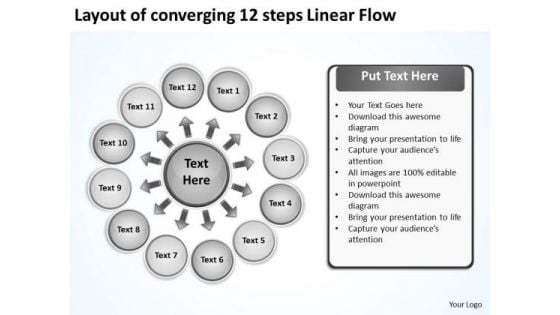
Layout Of Converging 12 Steps Linear Flow Ppt Cycle Diagram PowerPoint Slides
We present our layout of converging 12 steps linear flow ppt Cycle Diagram PowerPoint Slides.Download our Symbol PowerPoint Templates because you can Place them where they need to be. Download our Business PowerPoint Templates because the majestic tiger lord of all it surveys.It exudes power even when it is in repose. Download and present our Arrows PowerPoint Templates because Our PowerPoint Templates and Slides will let you Leave a lasting impression to your audiences. They possess an inherent longstanding recall factor. Present our Shapes PowerPoint Templates because they are the indicators of the path you have in mind. Use our Process and Flows PowerPoint Templates because this is an appropriate layout to convince your team that they have the ability to score a tEN every time.Use these PowerPoint slides for presentations relating to Arrows, Business, Central, Centralized, Chart, Circle, Circular, Circulation, Concept, Conceptual, Converging, Design, Diagram, Executive, Icon, Idea, Illustration, Management, Mapping, Model, Numbers, Organization, Outwards, Pointing, Procedure, Process, Radial, Radiating, Relationship, Resource, Sequence, Sequential, Square. The prominent colors used in the PowerPoint template are White, Gray, Black. Use our layout of converging 12 steps linear flow ppt Cycle Diagram PowerPoint Slides will make the presenter look like a pro even if they are not computer savvy. We assure you our Concept PowerPoint templates and PPT Slides are Breathtaking. People tell us our layout of converging 12 steps linear flow ppt Cycle Diagram PowerPoint Slides have awesome images to get your point across. PowerPoint presentation experts tell us our Circulation PowerPoint templates and PPT Slides are Festive. PowerPoint presentation experts tell us our layout of converging 12 steps linear flow ppt Cycle Diagram PowerPoint Slides are Clever. Use our Centralized PowerPoint templates and PPT Slides are the best it can get when it comes to presenting. Identify targets with our Layout Of Converging 12 Steps Linear Flow Ppt Cycle Diagram PowerPoint Slides. Download without worries with our money back guaranteee.
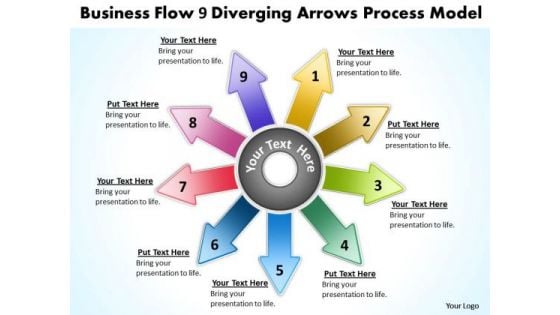
Templates Flow 9 Diverging Arrows Process Model Circular PowerPoint Slides
We present our templates flow 9 diverging arrows process model Circular PowerPoint Slides.Download our Arrows PowerPoint Templates because this template contains the material to highlight the key issues of your presentation. Use our Circle Charts PowerPoint Templates because we all know that alphabetical order is a time honoured concept. Use our Shapes PowerPoint Templates because it highlights the important timelines and milestones of this exciting journey. Download and present our Business PowerPoint Templates because your fledgling career is in the chrysallis stage. Nurture it and watch it grow into a beautiful butterfly. Download our Flow Charts PowerPoint Templates because it helps to churn the mixture to the right degree and pound home your views and expectations in a spectacularly grand and virtuoso fluid performance.Use these PowerPoint slides for presentations relating to arrow, arrowheads, badge, banner, blue, button, cerulean, cobalt, colored, colorful, connection, cursor, cyan, design element, designator, directional, download, emblem, gray shadow, green, icon, indicator, interface, internet, link, load, magenta, marker, navigation panel, next, orientation, page site, pictogram, pink, pointer, red, right, satined, sign, signpost, smooth, symbol, . The prominent colors used in the PowerPoint template are Purple, Red, Green. Presenters tell us our templates flow 9 diverging arrows process model Circular PowerPoint Slides are Detailed. You can be sure our cerulean PowerPoint templates and PPT Slides will impress their bosses and teams. Professionals tell us our templates flow 9 diverging arrows process model Circular PowerPoint Slides are Royal. People tell us our blue PowerPoint templates and PPT Slides are Ultra. People tell us our templates flow 9 diverging arrows process model Circular PowerPoint Slides are Swanky. Professionals tell us our blue PowerPoint templates and PPT Slides effectively help you save your valuable time. Our Templates Flow 9 Diverging Arrows Process Model Circular PowerPoint Slides team cater for all possibilities. You thoughts will automatically factor all in.
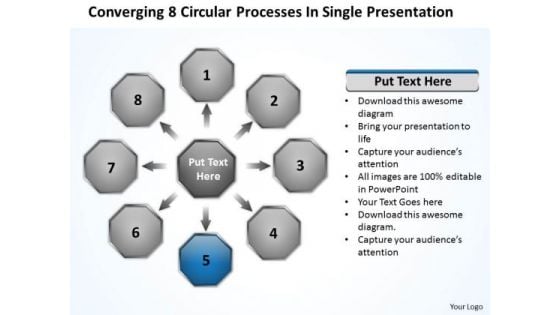
Processes In Single Presentation Relative Circular Flow Arrow Network PowerPoint Templates
We present our processes in single presentation Relative Circular Flow Arrow Network PowerPoint templates.Download and present our Arrows PowerPoint Templates because you can Show them how to churn out fresh ideas. Use our Circle Charts PowerPoint Templates because it shows various choices to be made. Download our Ring Charts PowerPoint Templates because very often it is important to reflect on the basics. Download our Business PowerPoint Templates because you have selected your team man for man. Use our Shapes PowerPoint Templates because they will Amplify your thoughts via our appropriate templates.Use these PowerPoint slides for presentations relating to Button,cerulean, circle, circulation, cobalt,colorful, cyan, cycle, element,emblem, grayshadow, green,icon, indicator, interface, internet, label,link, load, marker, motion, movement,navigationpanel, next, orientation, pagsite, pink, pointer, previous, process, reload, rotation, satined, sign, signpost,smooth, sticker, sticky, symbol. The prominent colors used in the PowerPoint template are Blue navy, Black, Gray. Customers tell us our processes in single presentation Relative Circular Flow Arrow Network PowerPoint templates are Energetic. We assure you our colorful PowerPoint templates and PPT Slides help you meet deadlines which are an element of today's workplace. Just browse and pick the slides that appeal to your intuitive senses. PowerPoint presentation experts tell us our processes in single presentation Relative Circular Flow Arrow Network PowerPoint templates are Elegant. People tell us our element PowerPoint templates and PPT Slides are Wistful. We assure you our processes in single presentation Relative Circular Flow Arrow Network PowerPoint templates are Beautiful. Use our cycle PowerPoint templates and PPT Slides are Adorable. You have fathereda great idea. Baptise it with our Processes In Single Presentation Relative Circular Flow Arrow Network PowerPoint Templates.
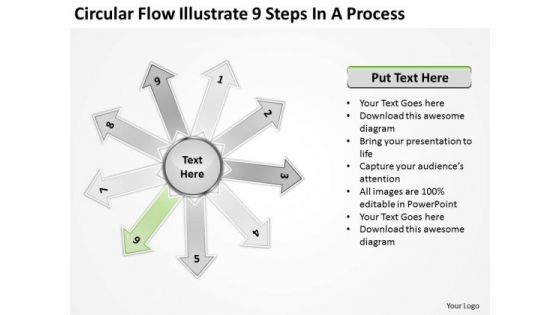
Flow Illustrate 9 Steps In Process Circular Layout Network PowerPoint Slides
We present our flow illustrate 9 steps in process Circular Layout Network PowerPoint Slides.Download and present our Arrows PowerPoint Templates because you have developed a vision of where you want to be a few years from now. Download our Circle Charts PowerPoint Templates because you have some excellent plans to spread some more of it across your community. Download and present our Process and Flows PowerPoint Templates because this slide brings grey areas to the table and explain in detail you assessment of the need for care to ensure continued smooth progress. Download and present our Business PowerPoint Templates because your fledgling career is in the chrysallis stage. Nurture it and watch it grow into a beautiful butterfly. Download and present our Shapes PowerPoint Templates because they are the indicators of the path you have in mind.Use these PowerPoint slides for presentations relating to Arrows, Blank, Business, Central, Centralized, Chart, Circle, Circular, Circulation, Concept, Conceptual, Converging, Design, Diagram, Empty, Executive, Icon, Idea, Illustration, Management, Map, Mapping, Moa, Model, Numbers, Organization, Outwards, Pointing, Procedure, Process, Radial, Radiating, Relationship, Resource, Sequence, Sequential, Seven, Square, Strategy. The prominent colors used in the PowerPoint template are Green, Gray, White. Professionals tell us our flow illustrate 9 steps in process Circular Layout Network PowerPoint Slides are Appealing. You can be sure our Circle PowerPoint templates and PPT Slides are Multicolored. Customers tell us our flow illustrate 9 steps in process Circular Layout Network PowerPoint Slides are Pretty. Professionals tell us our Centralized PowerPoint templates and PPT Slides are Nostalgic. People tell us our flow illustrate 9 steps in process Circular Layout Network PowerPoint Slides are Tasteful. People tell us our Chart PowerPoint templates and PPT Slides are Pretty. Excite your audience with our Flow Illustrate 9 Steps In Process Circular Layout Network PowerPoint Slides. You will come out on top.

Illustration Of Colorful Diverging 8 Arrows Circular Flow Process PowerPoint Slides
We present our illustration of colorful diverging 8 arrows Circular Flow Process PowerPoint Slides.Use our Circle Charts PowerPoint Templates because the ideas and plans are on your finger tips. Use our Arrows PowerPoint Templates because this diagram has the unique ability to drive home your ideas and show how they mesh to guarantee success. Use our Process and Flows PowerPoint Templates because some opportunities are bound to be highly profitable for you to follow up. Download and present our Business PowerPoint Templates because watch the excitement levels rise as they realise their worth. Download and present our Shapes PowerPoint Templates because it Shines the light on your thoughts and motivates your team to improve the quality of celebration for all around you.Use these PowerPoint slides for presentations relating to Arrow, arrowheads, blue, button,cerulean, circle, circulation, cobalt,colorful, cyan, cycle, element,download, emblem, gray,shadow, green,icon, indicator, interface, internet, label,link, load, marker, motion, movement,navigationpanel, next, orientation, pagesite, pink, pointer, previous, process, red,reload, rotation, stained, sign, symbol,. The prominent colors used in the PowerPoint template are Yellow, Gray, Black. Customers tell us our illustration of colorful diverging 8 arrows Circular Flow Process PowerPoint Slides are Luxurious. Customers tell us our circle PowerPoint templates and PPT Slides are Nifty. Customers tell us our illustration of colorful diverging 8 arrows Circular Flow Process PowerPoint Slides are Pleasant. People tell us our cerulean PowerPoint templates and PPT Slides are Glamorous. Customers tell us our illustration of colorful diverging 8 arrows Circular Flow Process PowerPoint Slides are Fun. Customers tell us our blue PowerPoint templates and PPT Slides will make you look like a winner. Carve out your territory with our Illustration Of Colorful Diverging 8 Arrows Circular Flow Process PowerPoint Slides. You will come out on top.
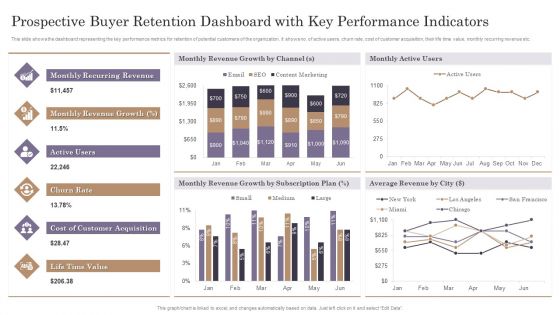
Prospective Buyer Retention Dashboard With Key Performance Indicators Themes PDF
This slide shows the dashboard representing the key performance metrics for retention of potential customers of the organization. It shows no. of active users, churn rate, cost of customer acquisition, their life time value, monthly recurring revenue etc.Pitch your topic with ease and precision using this Prospective Buyer Retention Dashboard With Key Performance Indicators Themes PDF. This layout presents information on Recurring Revenue, Revenue Growth, Customer Acquisition. It is also available for immediate download and adjustment. So, changes can be made in the color, design, graphics or any other component to create a unique layout.
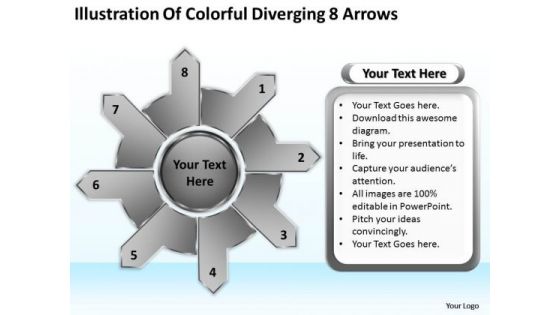
Illustration Of Colorful Diverging 8 Arrows Circular Flow Spoke Diagram PowerPoint Slides
We present our illustration of colorful diverging 8 arrows Circular Flow Spoke Diagram PowerPoint Slides.Present our Arrows PowerPoint Templates because this diagram provides trainers a tool to teach the procedure in a highly visual, engaging way. Use our Marketing PowerPoint Templates because networking is an imperative in todays world. You need to access the views of others. Similarly you need to give access to them of your abilities. Use our Process and Flows PowerPoint Templates because the gears of youthful minds are useful, therefore set them in motion. Download and present our Business PowerPoint Templates because project your ideas to you colleagues and complete the full picture. Present our Success PowerPoint Templates because you have come up with a brilliant breakthrough idea. you can also visualise the interest it will generate.Use these PowerPoint slides for presentations relating to Arrow, arrowheads, , blue, button, cerulean,circle, circulation, cobalt, colorreflection,connection, cyan, designelement,download, emblem, gold, green, icon,indicator, interface, internet, left, link,load, marker, movement, navigationpanel, next, orange, orientation, pagesite, pictogram, pointer, previous,processing, reload, rotation, satined,sign, signpost, smooth, symbol,. The prominent colors used in the PowerPoint template are White, Gray, Black. Customers tell us our illustration of colorful diverging 8 arrows Circular Flow Spoke Diagram PowerPoint Slides are Enchanting. Customers tell us our circle PowerPoint templates and PPT Slides are Versatile. Customers tell us our illustration of colorful diverging 8 arrows Circular Flow Spoke Diagram PowerPoint Slides are Cheerful. People tell us our cobalt PowerPoint templates and PPT Slides are Gorgeous. Customers tell us our illustration of colorful diverging 8 arrows Circular Flow Spoke Diagram PowerPoint Slides are Vintage. Customers tell us our button PowerPoint templates and PPT Slides are Delightful. Your thoughts andour Illustration Of Colorful Diverging 8 Arrows Circular Flow Spoke Diagram PowerPoint Slides are destined to amalgamate. They will create a champion team.
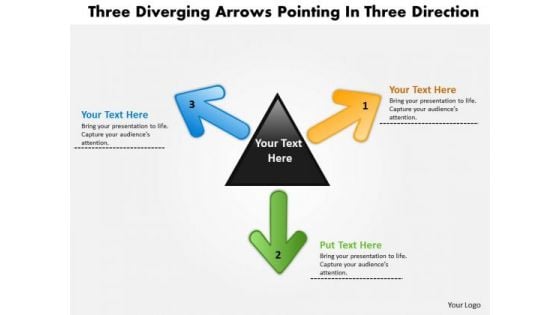
Three Diverging Arrows Pointing Direction Cycle Network PowerPoint Slides
We present our three diverging arrows pointing direction Cycle Network PowerPoint Slides.Download our Arrows PowerPoint Templates because getting it done may not be enough. Present our Triangles PowerPoint Templates because it unravels each one for your audience while setting key timelines as you go along. Present our Shapes PowerPoint Templates because this emphasises on the relevance and importance of all milestones along the way. Present our Business PowerPoint Templates because you have had a great year or so business wise. It is time to celebrate the efforts of your team. Present our Flow Charts PowerPoint Templates because they are Designed to attract the attention of your audience.Use these PowerPoint slides for presentations relating to arrow, arrowheads, badge, banner, blue, button, cerulean, cobalt, colored, colorful, connection, cursor, cyan, design element, designator, directional, download, emblem, gray shadow, green, icon, indicator, interface, internet, link, load, magenta, marker, navigation panel, next, orientation, page site, pictogram, pink, pointer, red, right, satined, sign, signpost, smooth, symbol, . The prominent colors used in the PowerPoint template are Orange, Green, Blue. Presenters tell us our three diverging arrows pointing direction Cycle Network PowerPoint Slides are designed by a team of presentation professionals. You can be sure our banner PowerPoint templates and PPT Slides are Festive. Professionals tell us our three diverging arrows pointing direction Cycle Network PowerPoint Slides are Graceful. People tell us our banner PowerPoint templates and PPT Slides are Gorgeous. People tell us our three diverging arrows pointing direction Cycle Network PowerPoint Slides are Multicolored. Professionals tell us our cerulean PowerPoint templates and PPT Slides are Nifty. Keep up the fight with our Three Diverging Arrows Pointing Direction Cycle Network PowerPoint Slides. Be assured of eventual achievement.
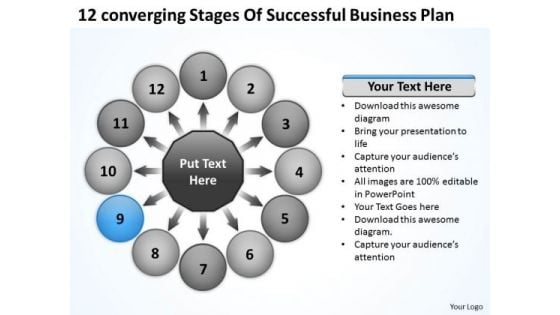
Successful Business PowerPoint Templates Free Download Plan Ppt 10 Gear Network Slides
We present our successful business powerpoint templates free download plan ppt 10 Gear Network Slides.Use our Business PowerPoint Templates because you too have got the framework of your companys growth in place. Download and present our Signs PowerPoint Templates because it depicts that Original thinking is the need of the hour. Download our Shapes PowerPoint Templates because your ideas are fundamentally stable with a broad base of workable possibilities. Download our Process and Flows PowerPoint Templates because they are the indicators of the path you have in mind. Download and present our Arrows PowerPoint Templates because you know that the core of any organisation is the people who work for it.Use these PowerPoint slides for presentations relating to Arrows, background, blue, chart, circle, circular, circulation, color, connection, continuity, cycle, cyclic, diagram, direction, empty, flow, graph, icon, illustration, isolated, isolated on white, loop, motion, presentation, process, progress, reason, recycle, recycling, repetition, report, result, ring, rotation, round, scheme, section, step, symbol, teamwork, four dimensional. The prominent colors used in the PowerPoint template are Blue, White, Black. The feedback we get is that our successful business powerpoint templates free download plan ppt 10 Gear Network Slides are Adorable. The feedback we get is that our circle PowerPoint templates and PPT Slides are Elevated. People tell us our successful business powerpoint templates free download plan ppt 10 Gear Network Slides are Spiffy. We assure you our circle PowerPoint templates and PPT Slides are the best it can get when it comes to presenting. We assure you our successful business powerpoint templates free download plan ppt 10 Gear Network Slides are second to none. The feedback we get is that our blue PowerPoint templates and PPT Slides are No-nonsense. Start delivering strong and sustainable gains with our Successful Business PowerPoint Templates Free Download Plan Ppt 10 Gear Network Slides. They will make you look good.
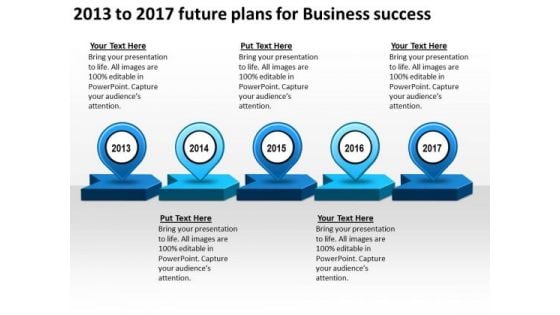
2013 To 2017 Future Plans For Business Success PowerPoint Templates Ppt Slides Graphics
We present our 2013 to 2017 future plans for Business success PowerPoint Templates PPT Slides Graphics.Use our Marketing PowerPoint Templates because customer satisfaction is a mantra of the marketplace. Building a loyal client base is an essential element of your business. Download and present our Timelines PowerPoint Templates because they are the indicators of the path you have in mind. Use our Business PowerPoint Templates because this template can project the path to sucess that you have charted. Download and present our Arrows PowerPoint Templates because they will Amplify your plans to have dedicated sub groups working on related but distinct tasks. Download and present our Time planning PowerPoint Templates because it have all to represent to your viewers.Use these PowerPoint slides for presentations relating to Art, Background, Button, Call, City, Colorful, Concept, Country, Destination, Editable, Flag, Fuel, Geography, Graphic, Home, Icon, Illustration, Journey, Land, Locate, Location, Macro, Map, Mapping, Mark, Navigate, Needle, Petrol, Pin, Pinpoint, Place, Pointing, Pump, Push, Pushpin, Restaurant, Road, Roadmap, Service, Set, Shiny, Space, Symbol, Town, Travel, Trip. The prominent colors used in the PowerPoint template are Blue, Blue light, White. PowerPoint presentation experts tell us our 2013 to 2017 future plans for Business success PowerPoint Templates PPT Slides Graphics provide you with a vast range of viable options. Select the appropriate ones and just fill in your text. Customers tell us our Call PowerPoint templates and PPT Slides are Perfect. Customers tell us our 2013 to 2017 future plans for Business success PowerPoint Templates PPT Slides Graphics are Second to none. Customers tell us our Call PowerPoint templates and PPT Slides are Pleasant. PowerPoint presentation experts tell us our 2013 to 2017 future plans for Business success PowerPoint Templates PPT Slides Graphics are Ultra. People tell us our Colorful PowerPoint templates and PPT Slides are Amazing. Counsel wisely with our 2013 To 2017 Future Plans For Business Success PowerPoint Templates Ppt Slides Graphics. Bring all your acumen into play.
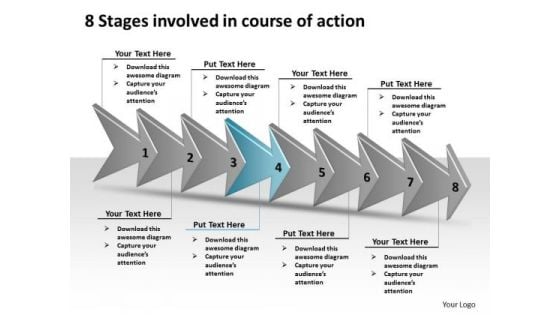
8 Stages Involved Course Of Action Make Flowchart PowerPoint Slides
We present our 8 stages involved course of action make flowchart PowerPoint Slides.Use our Leadership PowerPoint Templates because this diagram can be used to illustrate the logical path or system. Download and present our Shapes PowerPoint Templates because with the help of our Slides you can Illustrate your plans on using the many social media modes available to inform soceity at large of the benefits of your product. Use our Signs PowerPoint Templates because you must Evolve the strategy to take you down the required path with appropriate, efficient and effective marketing along the way. Download our Arrows PowerPoint Templates because we provide the means to project your views. Download and present our Process and Flows PowerPoint Templates because the Venn graphic comprising interlinking circles geometrically demonstate how various functions operating independantly, to a large extent, are essentially interdependant.Use these PowerPoint slides for presentations relating to Designator, blue bottom, circular cobalt banner, clean group badge, clear directional, crimson application icon, down load, download, circle marker, filter grain, front, grunge, grungy, internet page site, left orientation, magenta cursor symbol, monochromatic texture, monochrome pattern, navigation panel, next indicator, noise effect, Arrows sign, push, red pointer pictogram, redo, right, round shape, scattered surface,. The prominent colors used in the PowerPoint template are Blue light, White, Gray. The feedback we get is that our 8 stages involved course of action make flowchart PowerPoint Slides are Pleasant. People tell us our cobalt PowerPoint templates and PPT Slides are Attractive. We assure you our 8 stages involved course of action make flowchart PowerPoint Slides are Upbeat. Presenters tell us our cobalt PowerPoint templates and PPT Slides are One-of-a-kind. We assure you our 8 stages involved course of action make flowchart PowerPoint Slides will make you look like a winner. Use our group PowerPoint templates and PPT Slides are Splendid. Beat mediocrity with our 8 Stages Involved Course Of Action Make Flowchart PowerPoint Slides. You will come out on top.
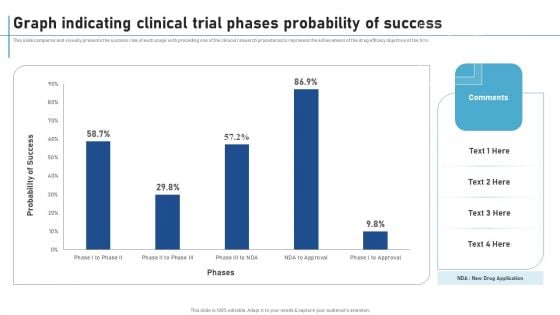
Graph Indicating Clinical Trial Phases Probability Of Success New Clinical Drug Trial Process Information PDF
This slide compares and visually presents the success rate of each stage with preceding one of the clinical research procedures to represent the achievement of the drug efficacy objective of the firm. If your project calls for a presentation, then Slidegeeks is your go-to partner because we have professionally designed, easy-to-edit templates that are perfect for any presentation. After downloading, you can easily edit Graph Indicating Clinical Trial Phases Probability Of Success New Clinical Drug Trial Process Information PDF and make the changes accordingly. You can rearrange slides or fill them with different images. Check out all the handy templates
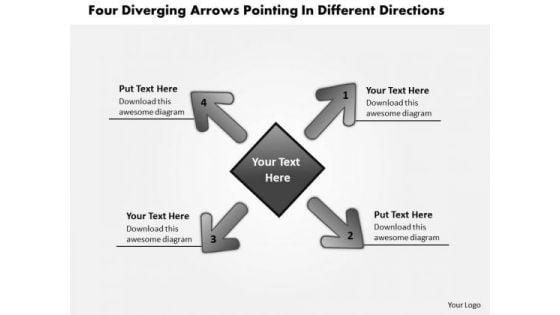
Pointing Different Directions Relative Circular Flow Arrow Process PowerPoint Templates
We present our pointing different directions Relative Circular Flow Arrow Process PowerPoint templates.Download and present our Process and Flows PowerPoint Templates because they will Amplify your views and plans for getting ahead and then the manner in which you intend staying ahead. Present our Business PowerPoint Templates because a lot of dissimilar elements needing to gel to strike the deal. Download and present our Shapes PowerPoint Templates because they enhance the essence of your viable ideas. Present our Arrows PowerPoint Templates because our templates emphasises your views. Use our Marketing PowerPoint Templates because you have a handle on all the targets, a master of the game, the experienced and consummate juggler.Use these PowerPoint slides for presentations relating to Arrowheads, blue, button,cerulean, circle, circulation, cobalt,colorful, cyan, cycle, element,emblem, grayshadow, green,icon, indicator, interface, internet, label,link, load, marker, motion, movement,navigationpanel, next, orientation, pagsite, pink, pointer, previous, process, reload, rotation, satined, sign, signpost,smooth, sticker, sticky, symbol. The prominent colors used in the PowerPoint template are Gray, Black, White. Customers tell us our pointing different directions Relative Circular Flow Arrow Process PowerPoint templates are Great. We assure you our cobalt PowerPoint templates and PPT Slides are Romantic. PowerPoint presentation experts tell us our pointing different directions Relative Circular Flow Arrow Process PowerPoint templates are Dazzling. People tell us our circulation PowerPoint templates and PPT Slides are Luxurious. We assure you our pointing different directions Relative Circular Flow Arrow Process PowerPoint templates are Wistful. Use our cobalt PowerPoint templates and PPT Slides are Festive. Aspire to any fancy with our Pointing Different Directions Relative Circular Flow Arrow Process PowerPoint Templates. Put your thoughts in creative mode.
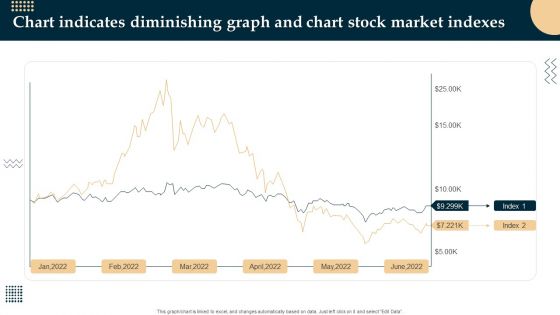
Chart Indicates Diminishing Graph And Chart Stock Market Indexes Themes PDF
Showcasing this set of slides titled Chart Indicates Diminishing Graph And Chart Stock Market Indexes Themes PDF. The topics addressed in these templates are Chart Indicates Diminishing Graph, Chart Stock Market Indexes. All the content presented in this PPT design is completely editable. Download it and make adjustments in color, background, font etc. as per your unique business setting.
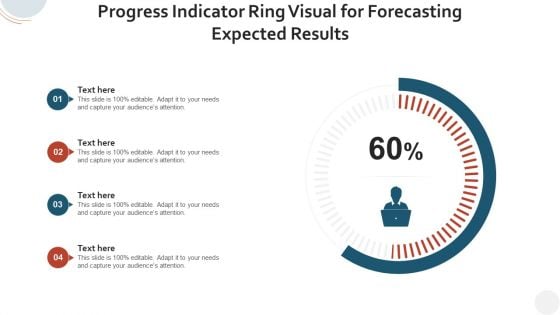
Progress Indicator Ring Visual For Forecasting Expected Results Diagrams PDF
Pitch your topic with ease and precision using this progress indicator ring visual for forecasting expected results diagrams pdf. This layout presents information on progress indicator ring visual for forecasting expected results. It is also available for immediate download and adjustment. So, changes can be made in the color, design, graphics or any other component to create a unique layout.
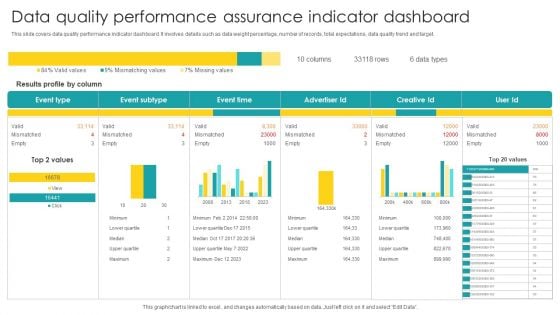
Data Quality Performance Assurance Indicator Dashboard Diagrams PDF
Pitch your topic with ease and precision using this Data Quality Performance Assurance Indicator Dashboard Diagrams PDF. This layout presents information on Data Quality Performance, Assurance Indicator Dashboard. It is also available for immediate download and adjustment. So, changes can be made in the color, design, graphics or any other component to create a unique layout.
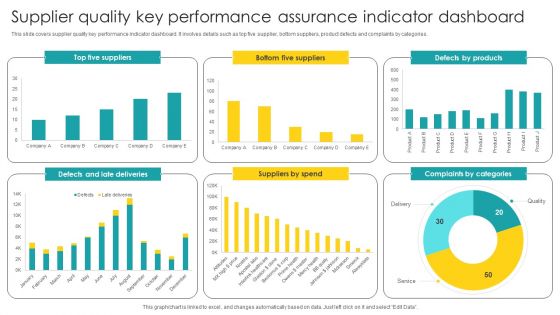
Supplier Quality Key Performance Assurance Indicator Dashboard Diagrams PDF
Showcasing this set of slides titled Supplier Quality Key Performance Assurance Indicator Dashboard Diagrams PDF. The topics addressed in these templates are Supplier Quality, Key Performance, Assurance Indicator. All the content presented in this PPT design is completely editable. Download it and make adjustments in color, background, font etc. as per your unique business setting.
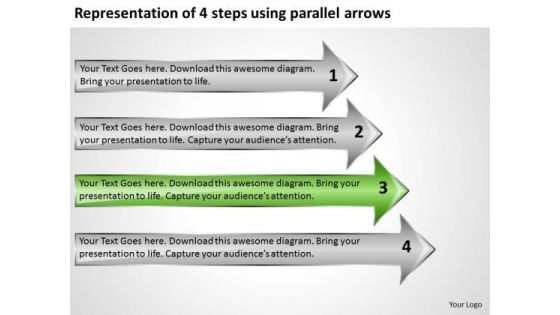
Representation Of 4 Steps Using Parallel Arrows Model Business Plans PowerPoint Templates
We present our representation of 4 steps using parallel arrows model business plans PowerPoint templates.Download and present our Arrows PowerPoint Templates because this diagram helps you to discuss each step slowly but surely move up the pyramid narrowing down to the best and most success oriented project. Download and present our Flow charts PowerPoint Templates because with the help of our Slides you can Illustrate your plans to your listeners with the same accuracy. Present our Process and Flows PowerPoint Templates because this slide helps you to give your team an overview of your capability and insight into the minute details of the overall picture highlighting the interdependence at every operational level. Present our Business PowerPoint Templates because you have had your share of being a goldfish in a small bowl.you are ready to launch out and spread your wings. Present our Marketing PowerPoint Templates because you can Present your views on the methods using our self-explanatory templates.Use these PowerPoint slides for presentations relating to Arrows, flow charts, success, four arrows, steps, flow steps, process arrows, arrows steps, shapes, charts, colorful, centigrade, chart, clip, clipart, cold, design, diagram, directional, drop, element, fahrenheit, flow, gauge, graph, graphic,blue, heat, hot, icon, illustration, info graphic, pointer, process, progress, segments, set. The prominent colors used in the PowerPoint template are Green, White, Gray. People tell us our representation of 4 steps using parallel arrows model business plans PowerPoint templates are Gorgeous. You can be sure our arrows PowerPoint templates and PPT Slides are Liberated. People tell us our representation of 4 steps using parallel arrows model business plans PowerPoint templates provide great value for your money. Be assured of finding the best projection to highlight your words. PowerPoint presentation experts tell us our four PowerPoint templates and PPT Slides are Luxurious. You can be sure our representation of 4 steps using parallel arrows model business plans PowerPoint templates are Fashionable. People tell us our arrows PowerPoint templates and PPT Slides will get their audience's attention. Be clear and crisp with our Representation Of 4 Steps Using Parallel Arrows Model Business Plans PowerPoint Templates. All dillemas will begin to disappear.
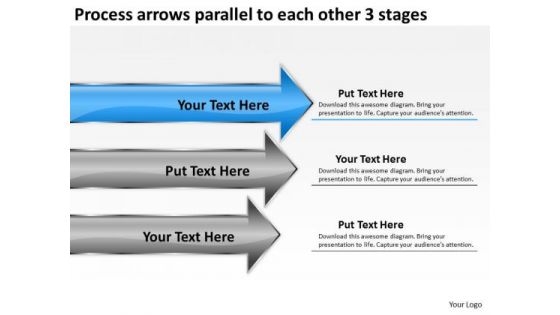
Process Arrows Parallel To Each Other 3 Stages Business Plan For Bakery PowerPoint Slides
We present our process arrows parallel to each other 3 stages business plan for bakery PowerPoint Slides.Download and present our Arrows PowerPoint Templates because you can put it up there for all to see. Download and present our Flow charts PowerPoint Templates because you have a great plan to put the pieces together, getting all the various contributors to gel for a successful completion. Present our Process and Flows PowerPoint Templates because Our PowerPoint Templates and Slides will let you Hit the target. Go the full distance with ease and elan. Download our Shapes PowerPoint Templates because you are aware of some pitfalls ahead where you need to be cautious not to overrun and avoid a stall. Present our Steps PowerPoint Templates because Our PowerPoint Templates and Slides come in all colours, shades and hues. They help highlight every nuance of your views.Use these PowerPoint slides for presentations relating to Arrows, process, business, process charts, process and flow, flow charts, success, three arrows, steps, flow steps, process arrows, arrows steps, marketing, future, symbol, shapes, charts, colorful, centigrade, chart, clip, clipart, cold, design, diagram, directional, drop, element, fahrenheit, flow, gauge, graph, graphic,blue, heat, hot, icon, illustration, info graphic, pointer, process, progress, segments, set. The prominent colors used in the PowerPoint template are Blue, Gray, White. People tell us our process arrows parallel to each other 3 stages business plan for bakery PowerPoint Slides are Nostalgic. You can be sure our charts PowerPoint templates and PPT Slides are Stylish. People tell us our process arrows parallel to each other 3 stages business plan for bakery PowerPoint Slides are Fantastic. PowerPoint presentation experts tell us our process PowerPoint templates and PPT Slides are Breathtaking. You can be sure our process arrows parallel to each other 3 stages business plan for bakery PowerPoint Slides are Handsome. People tell us our and PowerPoint templates and PPT Slides are visually appealing. Lay the bait with our Process Arrows Parallel To Each Other 3 Stages Business Plan For Bakery PowerPoint Slides. Get them hooked onto your ideas.
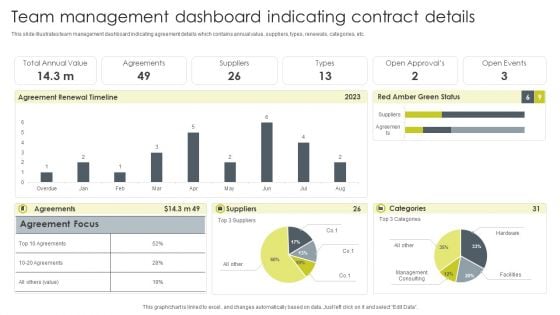
Team Management Dashboard Indicating Contract Details Diagrams PDF
This slide illustrates team management dashboard indicating agreement details which contains annual value, suppliers, types, renewals, categories, etc. Showcasing this set of slides titled Team Management Dashboard Indicating Contract Details Diagrams PDF. The topics addressed in these templates are Suppliers, Agreements, Total Annual Value. All the content presented in this PPT design is completely editable. Download it and make adjustments in color, background, font etc. as per your unique business setting.
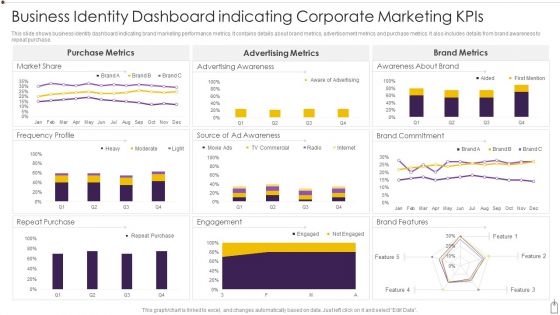
Business Identity Dashboard Indicating Corporate Marketing Kpis Diagrams PDF
This slide shows business identity dashboard indicating brand marketing performance metrics. It contains details about brand metrics, advertisement metrics and purchase metrics. It also includes details from brand awareness to repeat purchase. Showcasing this set of slides titled Business Identity Dashboard Indicating Corporate Marketing Kpis Diagrams PDF. The topics addressed in these templates are Purchase, Engagement, Market Share. All the content presented in this PPT design is completely editable. Download it and make adjustments in color, background, font etc. as per your unique business setting.
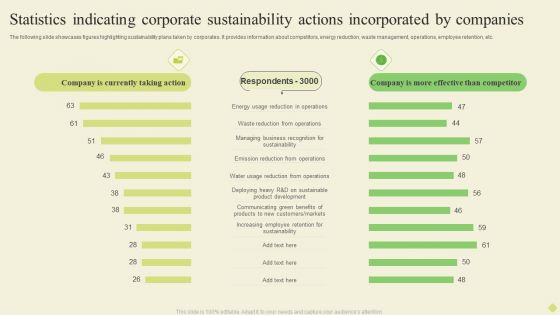
Statistics Indicating Corporate Sustainability Actions Incorporated By Companies Diagrams PDF
The following slide showcases figures highlighting sustainability plans taken by corporates. It provides information about competitors, energy reduction, waste management, operations, employee retention, etc.Pitch your topic with ease and precision using this Statistics Indicating Corporate Sustainability Actions Incorporated By Companies Diagrams PDF. This layout presents information on Energy Reduction, Emission Reduction, Increasing Employee. It is also available for immediate download and adjustment. So, changes can be made in the color, design, graphics or any other component to create a unique layout.
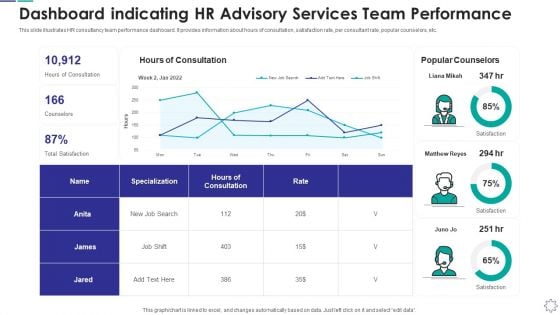
Dashboard Indicating Hr Advisory Services Team Performance
This slide illustrates HR consultancy team performance dashboard. It provides information about hours of consultation, satisfaction rate, per consultant rate, popular counselors, etc. Pitch your topic with ease and precision using this dashboard indicating hr advisory services team performance download pdf. This layout presents information on dashboard indicating hr advisory services team performance. It is also available for immediate download and adjustment. So, changes can be made in the color, design, graphics or any other component to create a unique layout.
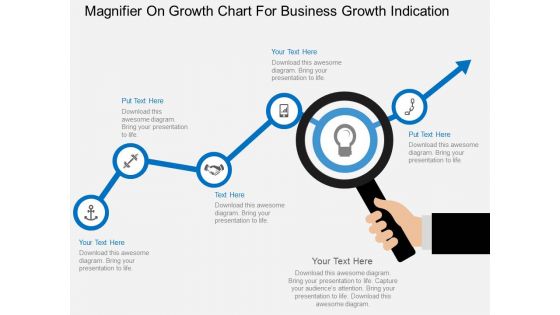
Magnifier On Growth Chart For Business Growth Indication Powerpoint Template
This business slide contains graphics of magnifier on growth chart. This PowerPoint template helps to display business planning and analysis. Use this diagram to impart more clarity to concept and to create more sound impact on viewers.
Ad Campaign Performance Indicators Tracking Dashboard Diagrams PDF
This slide covers dashboard to measure the performance of ad campaigns on LinkedIn platform. The purpose of this template is to provide the company an overview on the outcomes of running ad campaigns on LinkedIn. It includes performance based on impressions, CTR, engagement rates, CPC, CPM, etc. Find a pre designed and impeccable Ad Campaign Performance Indicators Tracking Dashboard Diagrams PDF. The templates can ace your presentation without additional effort. You can download these easy to edit presentation templates to make your presentation stand out from others. So, what are you waiting for Download the template from Slidegeeks today and give a unique touch to your presentation.
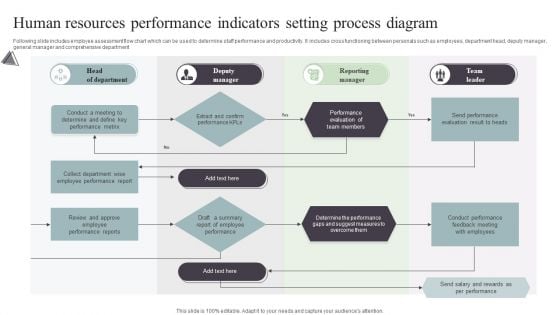
Human Resources Performance Indicators Setting Process Diagram Infographics PDF
Following slide includes employee assessment flow chart which can be used to determine staff performance and productivity. It includes cross functioning between personals such as employees, department head, deputy manager, general manager and comprehensive department. Presenting Human Resources Performance Indicators Setting Process Diagram Infographics PDF to dispense important information. This template comprises one stages. It also presents valuable insights into the topics including Head Of Department, Deputy Manager, Reporting Manager, Team Leader. This is a completely customizable PowerPoint theme that can be put to use immediately. So, download it and address the topic impactfully.
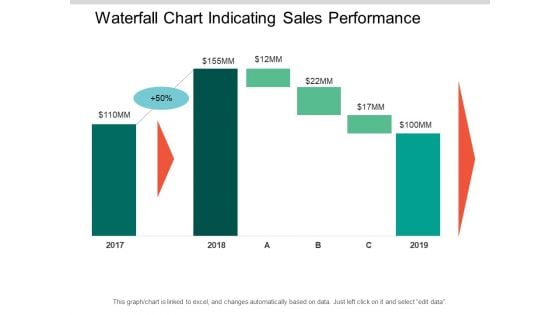
Waterfall Chart Indicating Sales Performance Ppt PowerPoint Presentation Outline Templates
This is a waterfall chart indicating sales performance ppt powerpoint presentation outline templates. This is a seven stage process. The stages in this process are sales waterfall, waterfall chart, business.
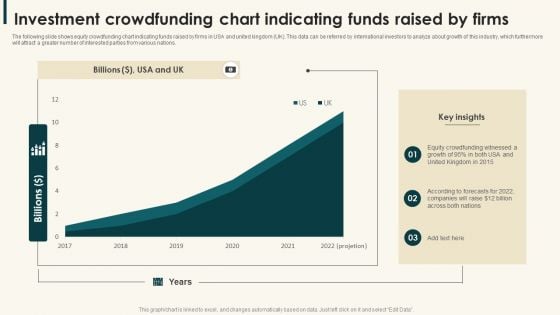
Investment Crowdfunding Chart Indicating Funds Raised By Firms Demonstration PDF
The following slide shows equity crowdfunding chart indicating funds raised by firms in USA and united kingdom UK. This data can be referred by international investors to analyze about growth of this industry, which furthermore will attract a greater number of interested parties from various nations.Showcasing this set of slides titled Investment Crowdfunding Chart Indicating Funds Raised By Firms Demonstration PDF. The topics addressed in these templates are Crowdfunding Witnessed, United Kingdom, Companies Raise. All the content presented in this PPT design is completely editable. Download it and make adjustments in color, background, font etc. as per your unique business setting.
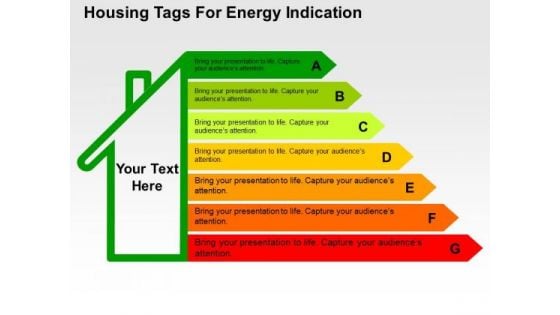
Housing Tags For Energy Indication PowerPoint Template
This business diagram has been designed with graphic of housing tags. This diagram contains the concept of energy saving. This diagram slide can be used to make impressive presentations.
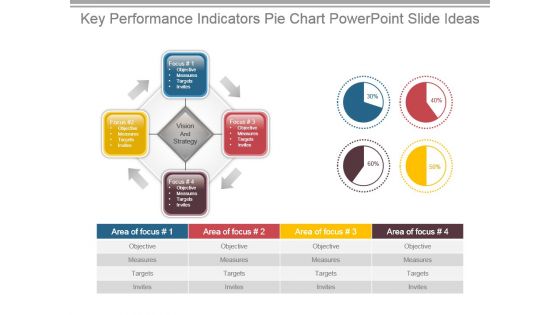
Key Performance Indicators Pie Chart Powerpoint Slide Ideas
This is a key performance indicators pie chart powerpoint slide ideas. This is a four stage process. The stages in this process are focus, objectives, measures, targets, invites, vision and strategy, area of focus.
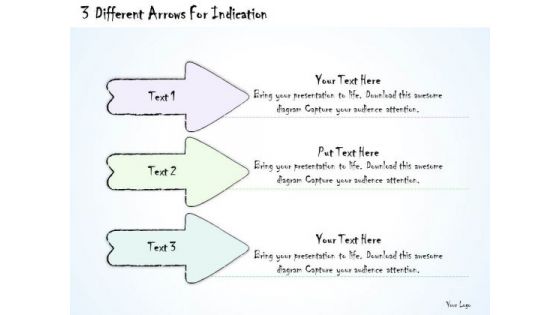
Ppt Slide 3 Different Arrows For Indication Consulting Firms
Get Out Of The Dock With Our PPT Slide 3 different arrows for indication consulting firms Powerpoint Templates. Your Mind Will Be Set Free.
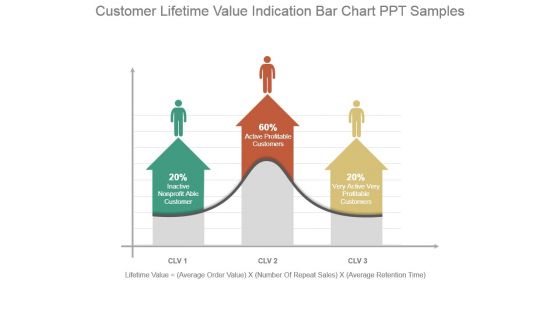
Customer Lifetime Value Indication Bar Chart Ppt Samples
This is a customer lifetime value indication bar chart ppt samples. This is a three stage process. The stages in this process are inactive nonprofit able customer, active profitable customers, very active very profitable customers, lifetime value, average order value, number of repeat sales, average retention time.

Performance Indicators For Successful Client Onboarding Themes PDF
This slide showcases KPIs that showcases success of user onboarding. Major KPIs included are customer engagement, retention and count, average response time, completion and free trial conversion rate. If you are looking for a format to display your unique thoughts, then the professionally designed Performance Indicators For Successful Client Onboarding Themes PDF is the one for you. You can use it as a Google Slides template or a PowerPoint template. Incorporate impressive visuals, symbols, images, and other charts. Modify or reorganize the text boxes as you desire. Experiment with shade schemes and font pairings. Alter, share or cooperate with other people on your work. Download Performance Indicators For Successful Client Onboarding Themes PDF and find out how to give a successful presentation. Present a perfect display to your team and make your presentation unforgettable.
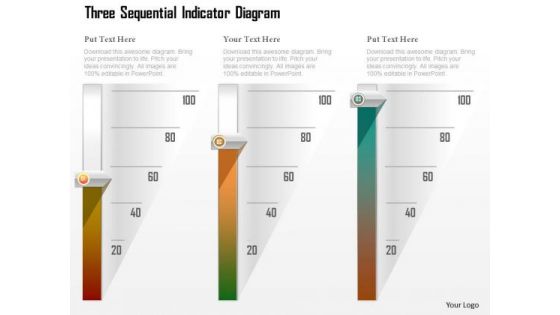
Business Diagram Three Sequential Indicator Diagram Presentation Template
Three staged sequential indicator diagram has been used to craft this power point template slide. This PPT slide contains the concept of sequential and linear process flow. Use this PPT for your business and marketing related presentations.
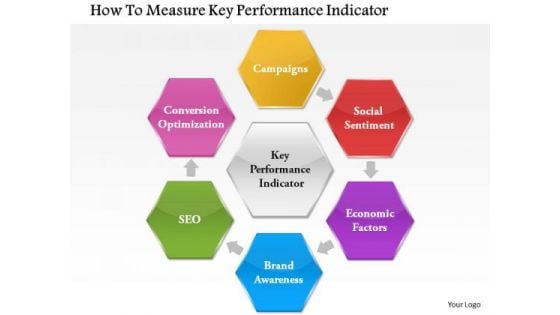
Business Framework How To Measure Key Performance Indicator PowerPoint Presentation
This Power Point diagram slide has been crafted with graphic of flower petal diagram. This PPT slide contains the concept of measuring the key performance and indicate it. Use this PPT slide for your management related presentation.
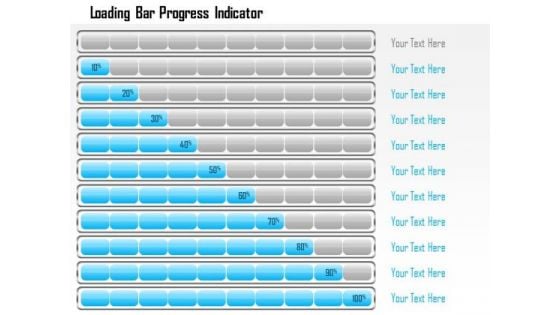
Business Framework Loading Bar Progress Indicator PowerPoint Presentation
This business diagram displays bar progress indicators. This business slide contains the concept of business growth shown in multiple levels. Use this diagram to present and compare data in an impressive manner.

Arrow Indicating Profit Success PowerPoint Themes And PowerPoint Slides 0511
Microsoft PowerPoint Theme and Slide with three dimensional arrow indicating profit over loss Compel your team with our Arrow Indicating Profit Success PowerPoint Themes And PowerPoint Slides 0511. Download without worries with our money back guaranteee.

Perspective Performance Indicator Ppt Powerpoint Slide Designs
This is a perspective performance indicator ppt powerpoint slide designs. This is a seven stage process. The stages in this process are performance indicator, perspective, unit, description formula, data source, measurement instrument, method of test how, frequency when, decision criteria, data collector who, owner, baseline, target, process diagram or drawings.
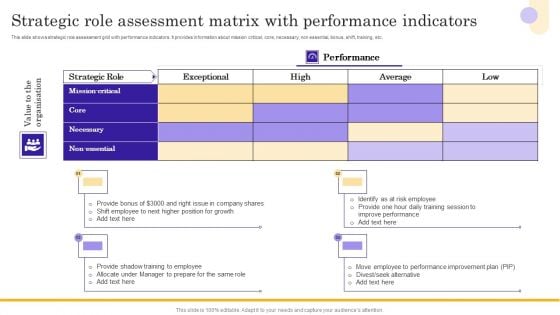
Strategic Role Assessment Matrix With Performance Indicators Themes PDF
This slide shows strategic role assessment grid with performance indicators. It provides information about mission critical, core, necessary, non essential, bonus, shift, training, etc. Pitch your topic with ease and precision using this Strategic Role Assessment Matrix With Performance Indicators Themes PDF. This layout presents information on Strategic Role Assessment, Matrix With Performance Indicators. It is also available for immediate download and adjustment. So, changes can be made in the color, design, graphics or any other component to create a unique layout.
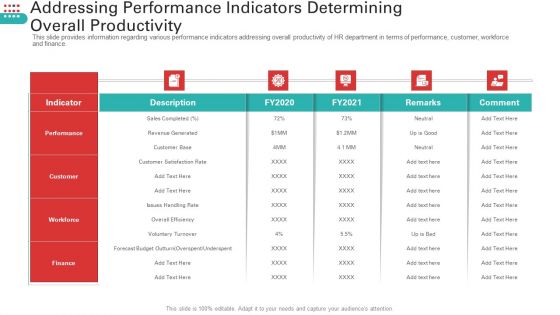
Addressing Performance Indicators Determining Overall Productivity Themes PDF
Deliver an awe inspiring pitch with this creative addressing performance indicators determining overall productivity themes pdf bundle. Topics like addressing performance indicators determining overall productivity can be discussed with this completely editable template. It is available for immediate download depending on the needs and requirements of the user.
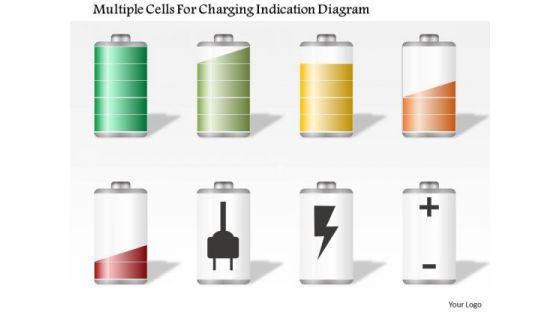
Business Diagram Multiple Cells For Charging Indication Diagram Presentation Template
Graphic of multiple cells is used to decorate this power point template slide. This PPt slide contains the concept of charging and power consumption. Use this PPT slide and explain these topics in a graphical manner.
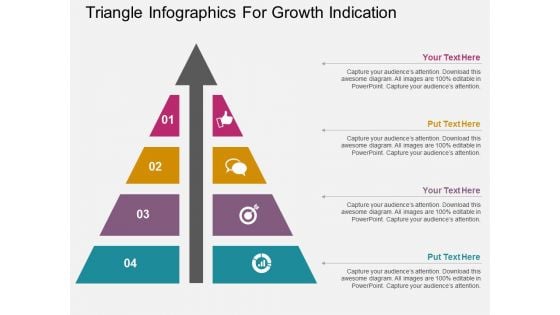
Triangle Infographics For Growth Indication Powerpoint Template
Our above PPT slide has been designed triangle infographic with growth arrow. This PowerPoint template is suitable to present strategic management for business growth. Use this business diagram to present your work in a more smart and precise manner.
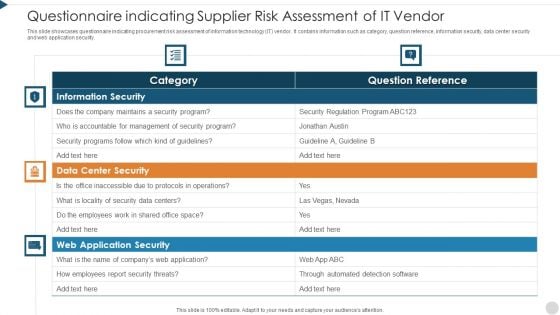
Questionnaire Indicating Supplier Risk Assessment Of It Vendor Themes PDF
This slide showcases questionnaire indicating procurement risk assessment of information technology IT vendor. It contains information such as category, question reference, information security, data center security and web application security. Pitch your topic with ease and precision using this questionnaire indicating supplier risk assessment of it vendor themes pdf. This layout presents information on information security, data center security, web application security. It is also available for immediate download and adjustment. So, changes can be made in the color, design, graphics or any other component to create a unique layout.
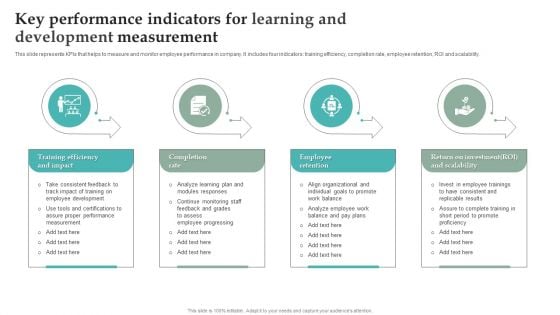
Key Performance Indicators For Learning And Development Measurement Themes PDF
This slide represents KPIs that helps to measure and monitor employee performance in company. It includes four indicators training efficiency, completion rate, employee retention, ROI and scalability. Persuade your audience using this Key Performance Indicators For Learning And Development Measurement Themes PDF. This PPT design covers Four stages, thus making it a great tool to use. It also caters to a variety of topics including Training Efficiency And Impact, Completion Rate Employee Retention. Download this PPT design now to present a convincing pitch that not only emphasizes the topic but also showcases your presentation skills.

Performance Indicators Of PPC Marketing Campaigns Themes PDF
This slide exhibits elements of pay per click campaigns that helps to increase website advertisement traffic. It contains three points search engine marketing, ad rank and cost per mille. Presenting Performance Indicators Of PPC Marketing Campaigns Themes PDF to dispense important information. This template comprises three stages. It also presents valuable insights into the topics including Determines, Search Engine Marketing, Advertisement. This is a completely customizable PowerPoint theme that can be put to use immediately. So, download it and address the topic impactfully.

Election Time Government PowerPoint Templates And PowerPoint Themes 1012
Election Time Government PowerPoint Templates And PowerPoint Themes 1012-The above template Shows the phrase Election which indicates the Government. It signifies the concept of vote, voting, poll, balloting, selection, choice, appointment, designation etc. Stable ideas are the building blocks of a successful structure. Lay down the fundamentals to build upon. Take it up to a higher level with your thoughts. Activate the minds of your team with your ideas. Illustrate to them how it will take them to the very top.-Election Time Government PowerPoint Templates And PowerPoint Themes 1012-This PowerPoint template can be used for presentations relating to-Election time government, government, symbol, signs, stars, shapes Eliminate contradictions with our Election Time Government PowerPoint Templates And PowerPoint Themes 1012. Dilemmas will begin to disappear.
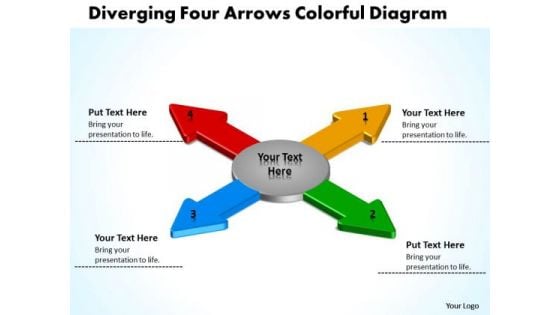
Diverging Four Arrows Colorful Flow Diagram Cycle PowerPoint Slides
We present our diverging four arrows colorful flow diagram Cycle PowerPoint Slides.Use our Arrows PowerPoint Templates because the NASA Space programme took mankind to the moon and so much more. Like them you too can look far beyond normal boundaries. Show them that in your mind the sky is certainly not the limit. Download our Circle Charts PowerPoint Templates because our creative template will lay down your views. Download our Shapes PowerPoint Templates because you are going along well but your foresight shows that it may need a slight change in plans or direction. Download and present our Business PowerPoint Templates because project your ideas to you colleagues and complete the full picture. Use our Flow Charts PowerPoint Templates because you can Set out the goals and your plan of action for teamwork.Use these PowerPoint slides for presentations relating to arrow, arrowheads, badge, banner, blue, button, cerulean, cobalt, colored, colorful, connection, cursor, cyan, design element, designator, directional, download, emblem, gray shadow, green, icon, indicator, interface, internet, link, load, magenta, marker, matted, menu tool, navigation panel, next, orientation, page site, pictogram, pink, pointer, red, right, satined, sign, signpost, smooth, symbol, upload, vector illustration, web, web 2.0, white background. The prominent colors used in the PowerPoint template are Red, Yellow, Green. Presenters tell us our diverging four arrows colorful flow diagram Cycle PowerPoint Slides are aesthetically designed to attract attention. We guarantee that they will grab all the eyeballs you need. You can be sure our button PowerPoint templates and PPT Slides are Awesome. Professionals tell us our diverging four arrows colorful flow diagram Cycle PowerPoint Slides are Glamorous. People tell us our blue PowerPoint templates and PPT Slides are Multicolored. People tell us our diverging four arrows colorful flow diagram Cycle PowerPoint Slides are effectively colour coded to prioritise your plans They automatically highlight the sequence of events you desire. Professionals tell us our banner PowerPoint templates and PPT Slides effectively help you save your valuable time. Give an exhaustive account with our Diverging Four Arrows Colorful Flow Diagram Cycle PowerPoint Slides. Your thoughts will illuminate every little detail.
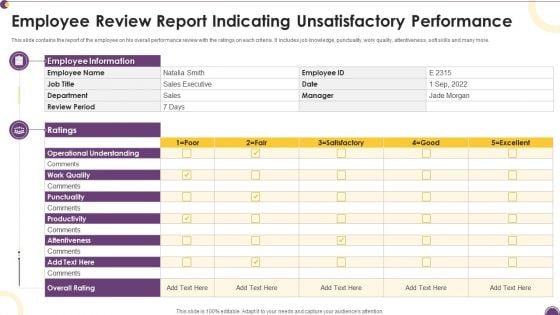
Employee Review Report Indicating Unsatisfactory Performance Themes PDF
This slide contains the report of the employee on his overall performance review with the ratings on each criteria. It includes job knowledge, punctuality, work quality, attentiveness, soft skills and many more.Pitch your topic with ease and precision using this Employee Review Report Indicating Unsatisfactory Performance Themes PDF. This layout presents information on Operational Understanding, Employee Information, Punctuality. It is also available for immediate download and adjustment. So, changes can be made in the color, design, graphics or any other component to create a unique layout.
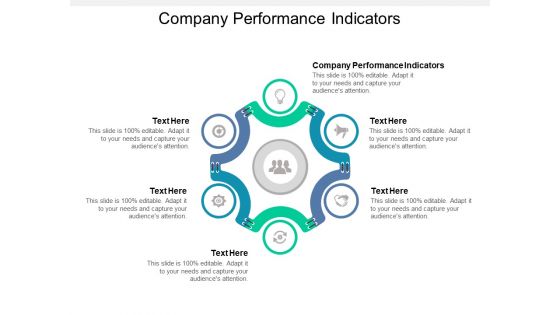
Company Performance Indicators Ppt PowerPoint Presentation Diagram Images
This is a company performance indicators ppt powerpoint presentation diagram images. This is a six stage process. The stages in this process are company performance indicators.
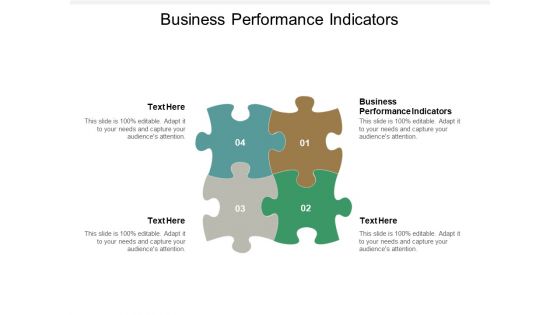
Business Performance Indicators Ppt PowerPoint Presentation Visual Aids Diagrams Cpb
This is a business performance indicators ppt powerpoint presentation visual aids diagrams cpb. This is a four stage process. The stages in this process are business performance indicators.
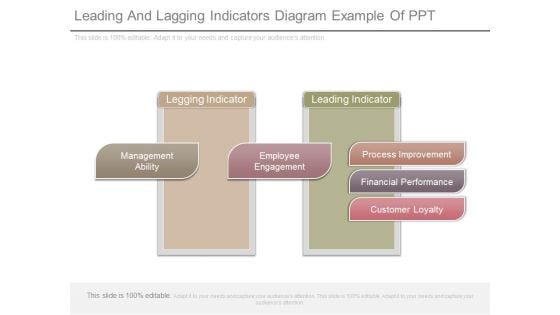
Leading And Lagging Indicators Diagram Example Of Ppt
This is a leading and lagging indicators diagram example of ppt. This is a two stage process. The stages in this process are legging indicator, management ability, employee engagement, leading indicator, process improvement, financial performance, customer loyalty.
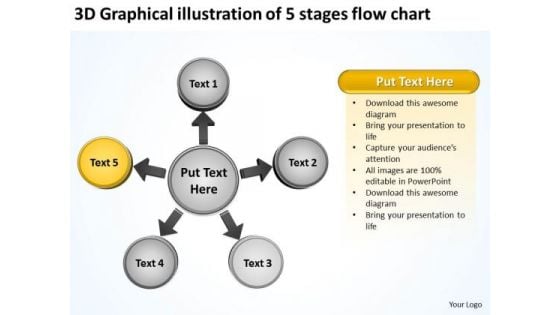
3d Graphical Illustration Of 5 Stages Flow Chart Arrow Circular Spoke Diagram PowerPoint Slides
We present our 3d graphical illustration of 5 stages flow chart arrow Circular Spoke Diagram PowerPoint Slides.Present our Business PowerPoint Templates because you are ready to flap your wings and launch off. All poised are you to touch the sky with glory. Present our Circle charts PowerPoint Templates because they are the indicators of the path you have in mind. Download our Arrows PowerPoint Templates because you can put down your ideas and present them using our innovative templates. Present our Shapes PowerPoint Templates because it Shines the light on your thoughts and motivates your team to improve the quality of celebration for all around you. Use our Flow charts PowerPoint Templates because you have the ideas to develop the teams vision of where they need to be in the future.Use these PowerPoint slides for presentations relating to Abstract, arrow, arrow, circle, business, concept, career, center, stage, chart, circle circle, connection, contrast, cycle, diagram, direction, flow flowchart, future, graph, icon, illustration, isolate, isolated, job, life, loop, money, motion network, recycle, refresh, ring, rotation, sick, sign, symbol, simply, target, wealth. The prominent colors used in the PowerPoint template are Yellow, Gray, White. People tell us our 3d graphical illustration of 5 stages flow chart arrow Circular Spoke Diagram PowerPoint Slides are Romantic. PowerPoint presentation experts tell us our business PowerPoint templates and PPT Slides are Vintage. Presenters tell us our 3d graphical illustration of 5 stages flow chart arrow Circular Spoke Diagram PowerPoint Slides are Fantastic. PowerPoint presentation experts tell us our circle PowerPoint templates and PPT Slides are Functional. People tell us our 3d graphical illustration of 5 stages flow chart arrow Circular Spoke Diagram PowerPoint Slides are Nifty. People tell us our center PowerPoint templates and PPT Slides will generate and maintain the level of interest you desire. They will create the impression you want to imprint on your audience. Our 3d Graphical Illustration Of 5 Stages Flow Chart Arrow Circular Spoke Diagram PowerPoint Slides stay away from farce. They treat every event correctly.
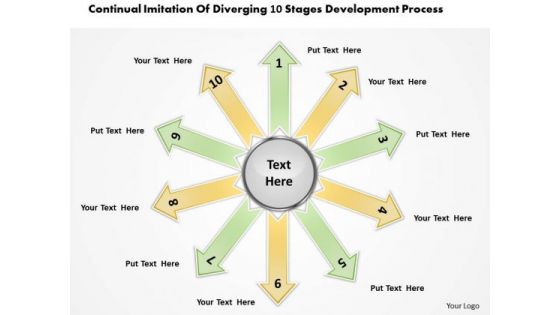
Imitation Of Diverging 10 Stages Development Process Ppt Pie Diagram PowerPoint Templates
We present our imitation of diverging 10 stages development process ppt Pie Diagram PowerPoint templates.Download our Arrows PowerPoint Templates because this layout helps you to see satisfaction spread across the room as they unravel your gifted views. Use our Circle Charts PowerPoint Templates because this Layout can explain the relevance of the different layers and stages in getting down to your core competence, ability and desired result. Use our Shapes PowerPoint Templates because it has inspired a whole new world of medical endeavour. Download our Business PowerPoint Templates because you can Lead your flock steadily to greater heights. Look around at the vast potential of achievement around you. Present our Flow Charts PowerPoint Templates because this is an excellent slide to detail and highlight your thought process, your views and your positive expectations..Use these PowerPoint slides for presentations relating to arrow, arrowheads, badge, banner, blue, button, cerulean, cobalt, colored, colorful, connection, cursor, cyan, design element, designator, icon, indicator, interface, internet, link, load, magenta, marker, matted, menu tool, navigation panel, next, orientation, page site, pictogram, pink, pointer, red, right, satined, sign, signpost, smooth, symbol, . The prominent colors used in the PowerPoint template are Yellow, Green, Gray. Presenters tell us our imitation of diverging 10 stages development process ppt Pie Diagram PowerPoint templates are Attractive. You can be sure our button PowerPoint templates and PPT Slides will make the presenter successul in his career/life. Professionals tell us our imitation of diverging 10 stages development process ppt Pie Diagram PowerPoint templates will impress their bosses and teams. People tell us our button PowerPoint templates and PPT Slides are Elevated. People tell us our imitation of diverging 10 stages development process ppt Pie Diagram PowerPoint templates provide great value for your money. Be assured of finding the best projection to highlight your words. Professionals tell us our blue PowerPoint templates and PPT Slides are Pretty. Give a fillip to your plans with our Imitation Of Diverging 10 Stages Development Process Ppt Pie Diagram PowerPoint Templates. They will get that extra attention you seek.
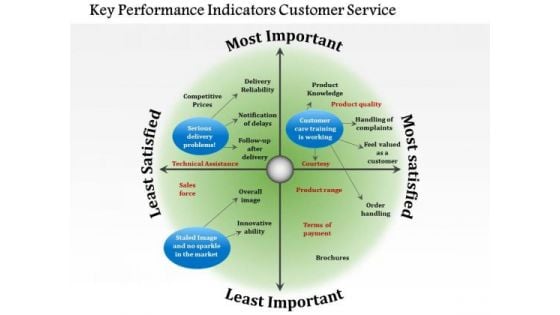
Business Diagram Key Performance Indicators Customer Service PowerPoint Ppt Presentation
Our above diagram provides framework of key performance indicators for customer service. It contains circular diagram in four segments depicting concepts of delivery problems, customer care training. Download this diagram to make professional presentations on customer service.
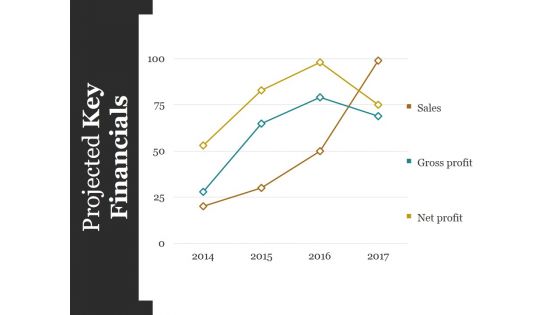
Projected Key Financials Template Ppt PowerPoint Presentation Styles Graphics Design
This is a projected key financials template ppt powerpoint presentation styles graphics design. This is a four stage process. The stages in this process are sales, gross profit, net profit.
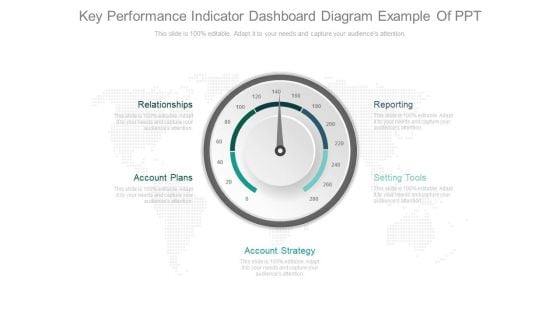
Key Performance Indicator Dashboard Diagram Example Of Ppt
This is a key performance indicator dashboard diagram example of ppt. This is a five stage process. The stages in this process are relationships, account plans, account strategy, setting tools, reporting.
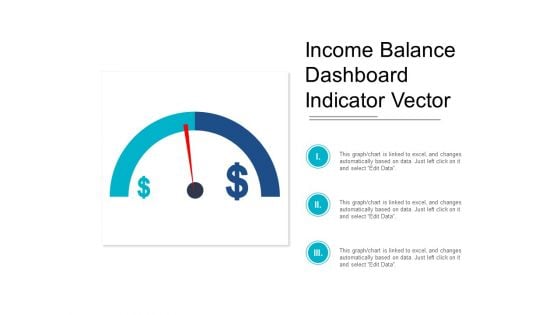
Income Balance Dashboard Indicator Vector Ppt PowerPoint Presentation Professional Diagrams
This is a income balance dashboard indicator vector ppt powerpoint presentation professional diagrams. This is a three stage process. The stages in this process are growth, increase sales, increase revenue.
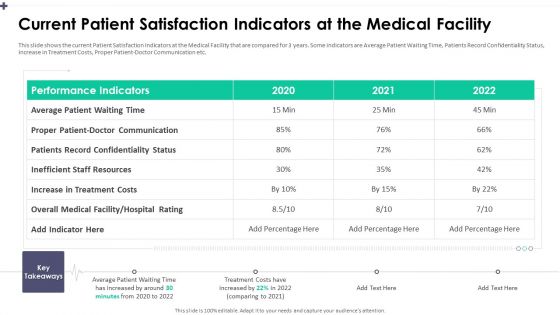
Current Patient Satisfaction Indicators At The Medical Facility Diagrams PDF
This slide shows the current Patient Satisfaction Indicators at the Medical Facility that are compared for 3 years. Some indicators are Average Patient Waiting Time, Patients Record Confidentiality Status, Increase in Treatment Costs, Proper Patient Doctor Communication etc.Deliver and pitch your topic in the best possible manner with this patients record confidentiality, inefficient staff resources, performance indicators. Use them to share invaluable insights on patients record confidentiality, inefficient staff resources, performance indicators and impress your audience. This template can be altered and modified as per your expectations. So, grab it now.
Software Tool Leading And Lagging Performance Tracking Indicators Diagrams PDF
This slide showcase the lagging and leading performance indicators after the implementation of a software tool. It includes customer integration data, email campaign revenue generated,session time, email deliverability, email click rates etc. Persuade your audience using this Software Tool Leading And Lagging Performance Tracking Indicators Diagrams PDF. This PPT design covers Two stages, thus making it a great tool to use. It also caters to a variety of topics including Software Tool Leading, Lagging Performance, Tracking Indicators. Download this PPT design now to present a convincing pitch that not only emphasizes the topic but also showcases your presentation skills.
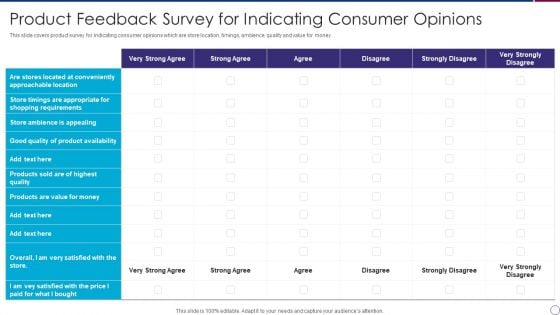
Product Feedback Survey For Indicating Consumer Opinions Diagrams PDF
This slide covers product survey for indicating consumer opinions which are store location, timings, ambience, quality and value for money.Showcasing this set of slides titled Product Feedback Survey For Indicating Consumer Opinions Diagrams PDF The topics addressed in these templates are Approachable Location, Product Availability, Ambience Appealing All the content presented in this PPT design is completely editable. Download it and make adjustments in color, background, font etc. as per your unique business setting.
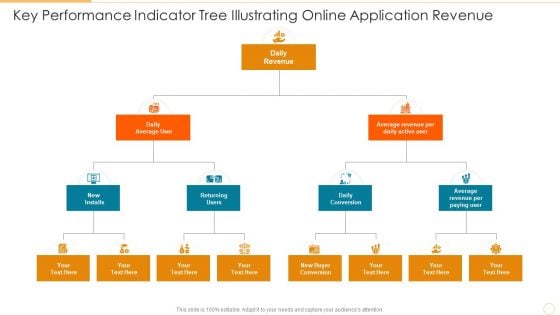
Key Performance Indicator Tree Illustrating Online Application Revenue Download PDF
Presenting key performance indicator tree illustrating online application revenue download pdf to dispense important information. This template comprises three stages. It also presents valuable insights into the topics including daily conversion, returning users, daily revenue. This is a completely customizable PowerPoint theme that can be put to use immediately. So, download it and address the topic impactfully.
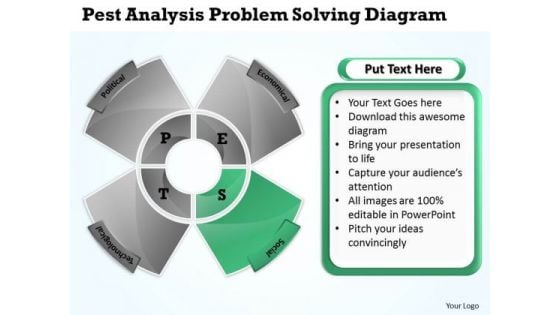
Business Structure Diagram Pest Analysis Problem Solving PowerPoint Slides
We present our business structure diagram pest analysis problem solving PowerPoint Slides.Download and present our Advertising PowerPoint Templates because It will let you Set new benchmarks with our PowerPoint Templates and Slides. They will keep your prospects well above par. Download our Shapes PowerPoint Templates because Our PowerPoint Templates and Slides will bullet point your ideas. See them fall into place one by one. Use our Business PowerPoint Templates because our PowerPoint Templates and Slides are the string of your bow. Fire of your ideas and conquer the podium. Present our Process and Flows PowerPoint Templates because Our PowerPoint Templates and Slides will embellish your thoughts. See them provide the desired motivation to your team. Download our Metaphors-Visual Concepts PowerPoint Templates because Our PowerPoint Templates and Slides ensures Effective communication. They help you put across your views with precision and clarity.Use these PowerPoint slides for presentations relating to Actions, analyze, business, commerce, concept, conceptual, define, design, diagram, direction, guidelines, icon, implement, improve, indicators, integration, key, manage, management, mba, model, optimize, organization, performance, process, resentation, resource, review, selling, solution, solve, system, theoretical, theory, tool. The prominent colors used in the PowerPoint template are Green, Gray, Black. The feedback we get is that our business structure diagram pest analysis problem solving PowerPoint Slides will save the presenter time. The feedback we get is that our conceptual PowerPoint templates and PPT Slides are second to none. Professionals tell us our business structure diagram pest analysis problem solving PowerPoint Slides are readymade to fit into any presentation structure. Professionals tell us our concept PowerPoint templates and PPT Slides are topically designed to provide an attractive backdrop to any subject. Presenters tell us our business structure diagram pest analysis problem solving PowerPoint Slides are effectively colour coded to prioritise your plans They automatically highlight the sequence of events you desire. You can be sure our business PowerPoint templates and PPT Slides are designed to make your presentations professional. Our Business Structure Diagram Pest Analysis Problem Solving PowerPoint Slides will keep u sane. Your thoughts will bolt across the line.
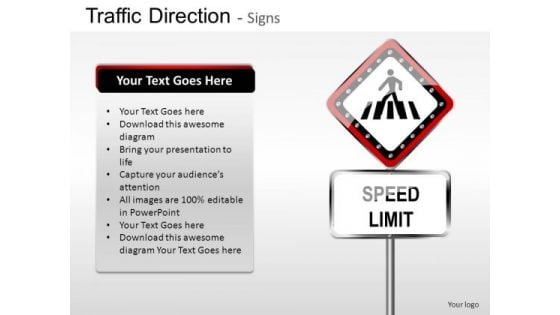
Indication Traffic Direction PowerPoint Slides And Ppt Diagram Templates
Indication Traffic Direction PowerPoint Slides And PPT Diagram Templates-These high quality powerpoint pre-designed slides and powerpoint templates have been carefully created by our professional team to help you impress your audience. All slides have been created and are 100% editable in powerpoint. Each and every property of any graphic - color, size, orientation, shading, outline etc. can be modified to help you build an effective powerpoint presentation. Any text can be entered at any point in the powerpoint template or slide. Simply DOWNLOAD, TYPE and PRESENT! Decrease conflict with your thoughts.Enable communication with our Indication Traffic Direction PowerPoint Slides And Ppt Diagram Templates.
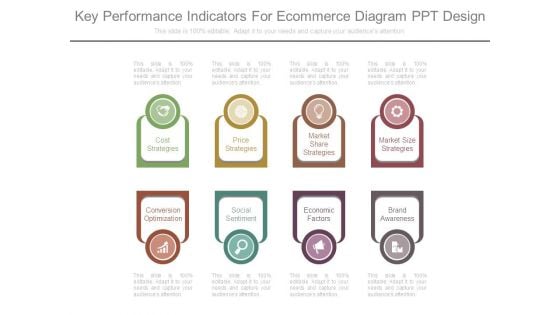
Key Performance Indicators For Ecommerce Diagram Ppt Design
This is a key performance indicators for ecommerce diagram ppt design. This is a eight stage process. The stages in this process are cost strategies, price strategies, market share strategies, market size strategies, conversion optimization, social sentiment, economic factors, brand awareness.
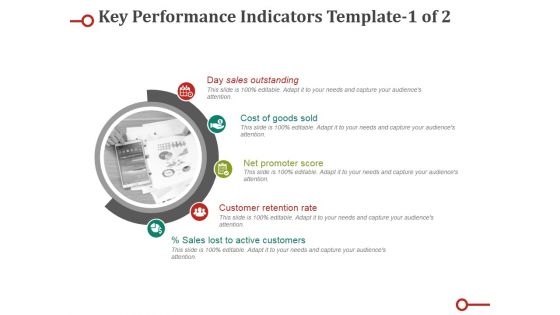
Key Performance Indicators Template Ppt PowerPoint Presentation Professional Diagrams
This is a key performance indicators template ppt powerpoint presentation professional diagrams. This is a five stage process. The stages in this process are day sales outstanding, cost of goods sold, net promoter score, customer retention rate, sales lost to active customers.
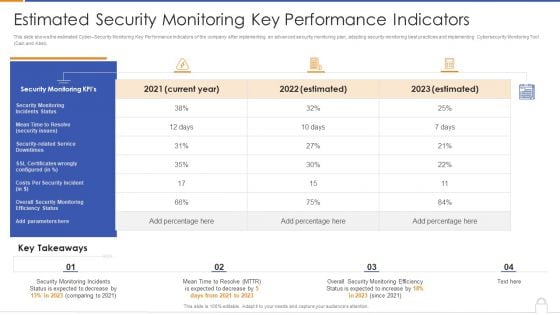
Estimated Security Monitoring Key Performance Indicators Diagrams PDF
Deliver and pitch your topic in the best possible manner with this estimated security monitoring key performance indicators diagrams pdf. Use them to share invaluable insights on security monitoring, security related service downtimes, overall security monitoring and impress your audience. This template can be altered and modified as per your expectations. So, grab it now.
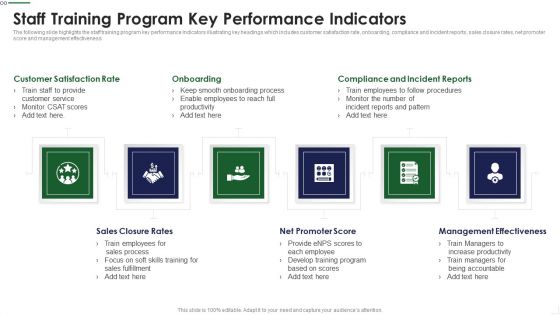
Staff Training Program Key Performance Indicators Diagrams PDF
The following slide highlights the staff training program key performance Indicators illustrating key headings which includes customer satisfaction rate, onboarding, compliance and incident reports, sales closure rates, net promoter score and management effectiveness Presenting Staff Training Program Key Performance Indicators Diagrams PDF to provide visual cues and insights. Share and navigate important information on six stages that need your due attention. This template can be used to pitch topics like Turnover Quarter, Turnover Type, Turnover Reasons In addtion, this PPT design contains high resolution images, graphics, etc, that are easily editable and available for immediate download.
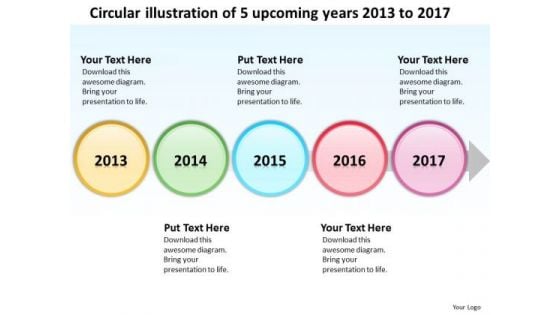
Circular Illustration Of 5 Upcoming Years 2013 To 2017 PowerPoint Templates Ppt Slides Graphics
We present our Circular illustration of 5 upcoming years 2013 to 2017 PowerPoint Templates PPT Slides Graphics.Download and present our Marketing PowerPoint Templates because generation of sales is the core of any business. Present our Timelines PowerPoint Templates because they are the indicators of the path you have in mind. Download our Business PowerPoint Templates because the fruits of your labour are beginning to show.Enlighten them on the great plans you have for their enjoyment. Present our Arrows PowerPoint Templates because this diagram helps you to show goal also clearly etched in your mind. Download and present our Time planning PowerPoint Templates because this diagram helps you to discuss each step slowly but surely move up the pyramid narrowing down to the best and most success oriented project.Use these PowerPoint slides for presentations relating to Art, Background, Button, Call, City, Colorful, Concept, Country, Destination, Editable, Flag, Fuel, Geography, Graphic, Home, Icon, Illustration, Journey, Land, Locate, Location, Macro, Map, Mapping, Mark, Navigate, Needle, Petrol, Pin, Pinpoint, Place, Pointing, Pump, Push, Pushpin, Restaurant, Road, Roadmap, Service, Set, Shiny, Space, Symbol, Town, Travel, Trip. The prominent colors used in the PowerPoint template are Red, Green, Blue. PowerPoint presentation experts tell us our Circular illustration of 5 upcoming years 2013 to 2017 PowerPoint Templates PPT Slides Graphics are designed to make your presentations professional. Customers tell us our Call PowerPoint templates and PPT Slides are Charming. Customers tell us our Circular illustration of 5 upcoming years 2013 to 2017 PowerPoint Templates PPT Slides Graphics are Fashionable. Customers tell us our Concept PowerPoint templates and PPT Slides are designed to make your presentations professional. PowerPoint presentation experts tell us our Circular illustration of 5 upcoming years 2013 to 2017 PowerPoint Templates PPT Slides Graphics are Great. People tell us our Colorful PowerPoint templates and PPT Slides are aesthetically designed to attract attention. We guarantee that they will grab all the eyeballs you need. It is time to say farewell to failure. Our Circular Illustration Of 5 Upcoming Years 2013 To 2017 PowerPoint Templates Ppt Slides Graphics assure achievement.

Business Diagram Danger Warning Symbol For Safety Indication Presentation Template
This Power Point template has been designed with graphic of danger board. This diagram contains the concept of safety warning for danger area. Use this diagram for your warning and safety related presentation.
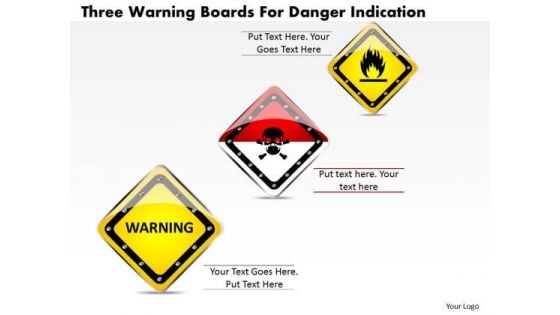
Business Diagram Three Warning Boards For Danger Indication Presentation Template
This Power Point image template has been designed with graphic of three different sign boards. These signs are designed to identify dangerous places. Use this diagram for safety and prevention related topics.
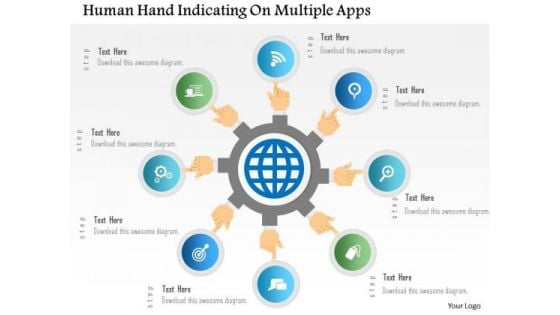
Business Diagram Human Hand Indicating On Multiple Apps PowerPoint Template
Graphic of human hand with multiple apps has been used to craft this PPT. This PPT diagram contains the concept of app usage. Use this PPT for your technology and data related topics in any presentation.

Business Diagram Thermometer Graphics Indicating Progress Presentation Template
This power point template diagram has been designed with graphic of thermometer and bar graph. This PPT contains the concept of growth analysis. Use this PPT for business and marketing related presentations.

Chart Indicates Diminishing Graph And Chart Cash Payment Mode Inspiration PDF
Showcasing this set of slides titled Chart Indicates Diminishing Graph And Chart Cash Payment Mode Inspiration PDF. The topics addressed in these templates are Chart Indicates Diminishing Graph, Chart Cash Payment Mode. All the content presented in this PPT design is completely editable. Download it and make adjustments in color, background, font etc. as per your unique business setting.

Chart Indicates Diminishing Graph And Chart Retail Value And Volume Download PDF
Pitch your topic with ease and precision using this Chart Indicates Diminishing Graph And Chart Retail Value And Volume Download PDF. This layout presents information on Chart Indicates Diminishing Graph, Chart Retail Value And Volume. It is also available for immediate download and adjustment. So, changes can be made in the color, design, graphics or any other component to create a unique layout.
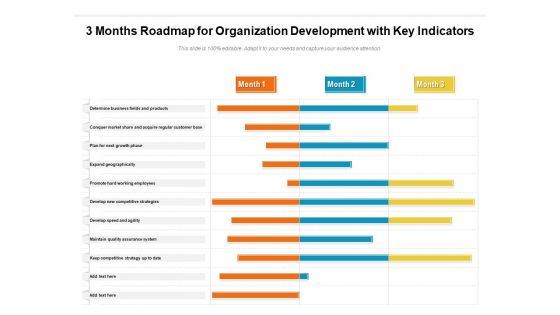
3 Months Roadmap For Organization Development With Key Indicators Guidelines
Presenting the 3 months roadmap for organization development with key indicators guidelines. The template includes a roadmap that can be used to initiate a strategic plan. Not only this, the PowerPoint slideshow is completely editable and you can effortlessly modify the font size, font type, and shapes according to your needs. This PPT slide can be easily reached in standard screen and widescreen aspect ratios. The set is also available in various formats like PDF, PNG, and JPG. So download and use it multiple times as per your knowledge.
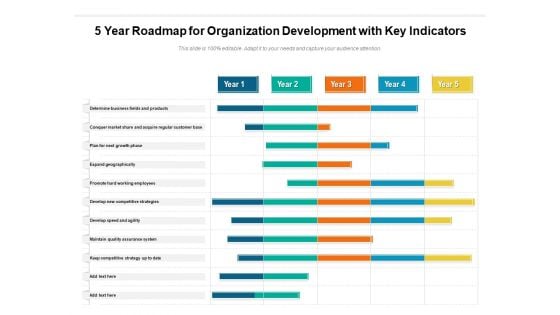
5 Year Roadmap For Organization Development With Key Indicators Clipart
Presenting the 5 year roadmap for organization development with key indicators clipart. The template includes a roadmap that can be used to initiate a strategic plan. Not only this, the PowerPoint slideshow is completely editable and you can effortlessly modify the font size, font type, and shapes according to your needs. This PPT slide can be easily reached in standard screen and widescreen aspect ratios. The set is also available in various formats like PDF, PNG, and JPG. So download and use it multiple times as per your knowledge.
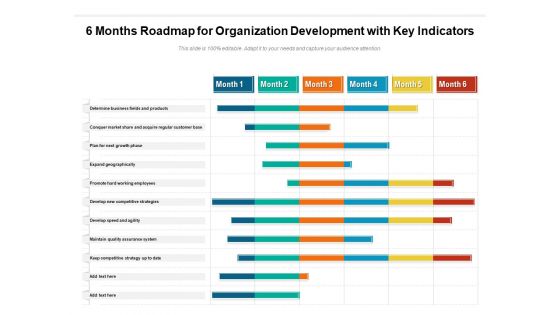
6 Months Roadmap For Organization Development With Key Indicators Topics
Presenting the 6 months roadmap for organization development with key indicators topics. The template includes a roadmap that can be used to initiate a strategic plan. Not only this, the PowerPoint slideshow is completely editable and you can effortlessly modify the font size, font type, and shapes according to your needs. This PPT slide can be easily reached in standard screen and widescreen aspect ratios. The set is also available in various formats like PDF, PNG, and JPG. So download and use it multiple times as per your knowledge.
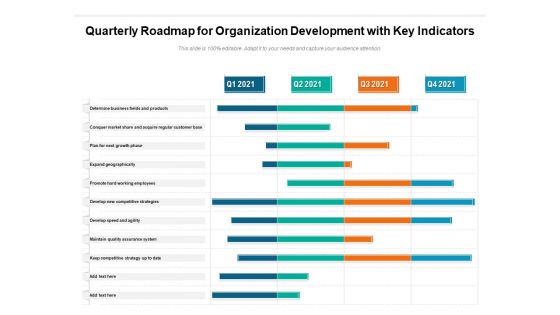
Quarterly Roadmap For Organization Development With Key Indicators Sample
Presenting the quarterly roadmap for organization development with key indicators sample. The template includes a roadmap that can be used to initiate a strategic plan. Not only this, the PowerPoint slideshow is completely editable and you can effortlessly modify the font size, font type, and shapes according to your needs. This PPT slide can be easily reached in standard screen and widescreen aspect ratios. The set is also available in various formats like PDF, PNG, and JPG. So download and use it multiple times as per your knowledge.
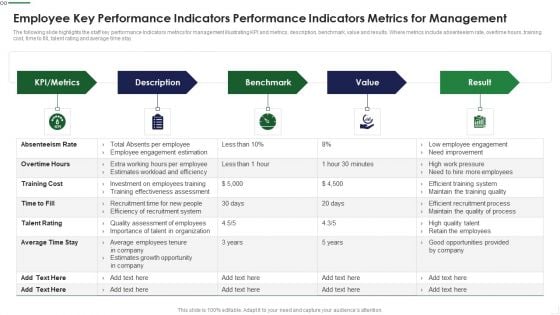
Employee Key Performance Indicators Performance Indicators Metrics For Management Professional PDF
The following slide highlights the staff key performance Indicators metrics for management illustrating KPI and metrics, description, benchmark, value and results. Where metrics include absenteeism rate, overtime hours, training cost, time to fill, talent rating and average time stay Presenting Employee Key Performance Indicators Performance Indicators Metrics For Management Professional PDF to dispense important information. This template comprises five stages. It also presents valuable insights into the topics including Employee Engagement, Recruitment System, Talent Organization This is a completely customizable PowerPoint theme that can be put to use immediately. So, download it and address the topic impactfully.
Dashboard For Tracking Global Share Market Indices Formats PDF
Following slide represent a comprehensive dashboard to track stock market indices of different countries. The indices mentioned in the slide are DOW jones, NASDAQ, S and P along with the highest and lowest price of indices on a particular day. Showcasing this set of slides titled Dashboard For Tracking Global Share Market Indices Formats PDF. The topics addressed in these templates are Global Share, Market Indices, Abbreviations. All the content presented in this PPT design is completely editable. Download it and make adjustments in color, background, font etc. as per your unique business setting.
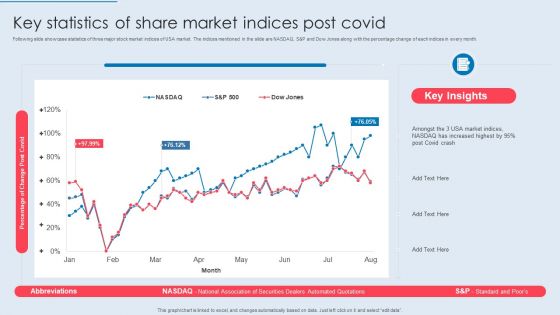
Key Statistics Of Share Market Indices Post Covid Sample PDF
Following slide showcase statistics of three major stock market indices of USA market. The indices mentioned in the slide are NASDAQ, S and P and Dow Jones along with the percentage change of each indices in every month. Showcasing this set of slides titled Key Statistics Of Share Market Indices Post Covid Sample PDF. The topics addressed in these templates are Percentage Change Post Covid, Increased Highest, Indices Post Covid. All the content presented in this PPT design is completely editable. Download it and make adjustments in color, background, font etc. as per your unique business setting.
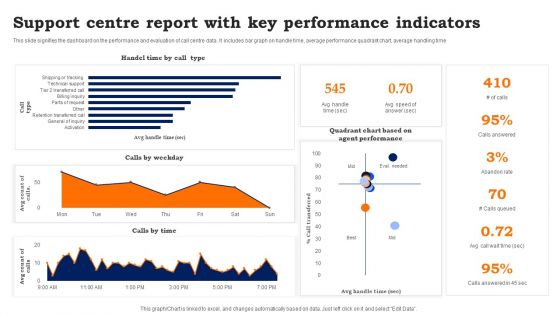
Support Centre Report With Key Performance Indicators Information PDF
This slide signifies the dashboard on the performance and evaluation of call centre data. It includes bar graph on handle time, average performance quadrant chart, average handling time. Showcasing this set of slides titled Support Centre Report With Key Performance Indicators Information PDF. The topics addressed in these templates are Support Centre Report, Key Performance Indicators. All the content presented in this PPT design is completely editable. Download it and make adjustments in color, background, font etc. as per your unique business setting.
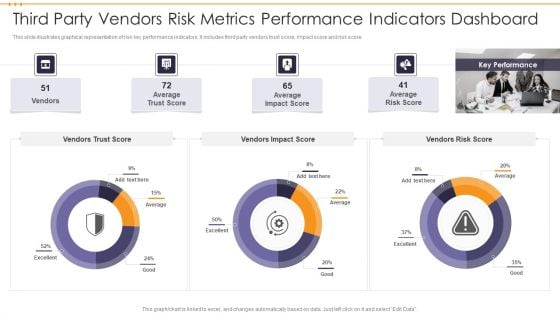
Third Party Vendors Risk Metrics Performance Indicators Dashboard Topics PDF
This slide illustrates graphical representation of risk key performance indicators. It includes third party vendors trust score, impact score and risk score. Pitch your topic with ease and precision using this Third Party Vendors Risk Metrics Performance Indicators Dashboard Topics PDF. This layout presents information on Third Party Vendors Risk Metrics Performance Indicators Dashboard. It is also available for immediate download and adjustment. So, changes can be made in the color, design, graphics or any other component to create a unique layout.

HR Framework Dashboard Indicating Kpis Of Employees Introduction PDF
This slide represents human resource HR structure dashboard indicating key performance indicators KPIs of employees. it provides information regarding absenteeism, overtime hours, training costs etc.Pitch your topic with ease and precision using this HR Framework Dashboard Indicating Kpis Of Employees Introduction PDF. This layout presents information on Absenteeism Rate, Costs, Average. It is also available for immediate download and adjustment. So, changes can be made in the color, design, graphics or any other component to create a unique layout.
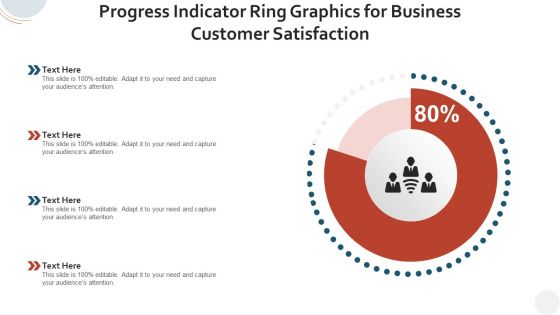
Progress Indicator Ring Graphics For Business Customer Satisfaction Background PDF
Pitch your topic with ease and precision using this progress indicator ring graphics for business customer satisfaction background pdf. This layout presents information on progress indicator ring graphics for business customer satisfaction. It is also available for immediate download and adjustment. So, changes can be made in the color, design, graphics or any other component to create a unique layout.
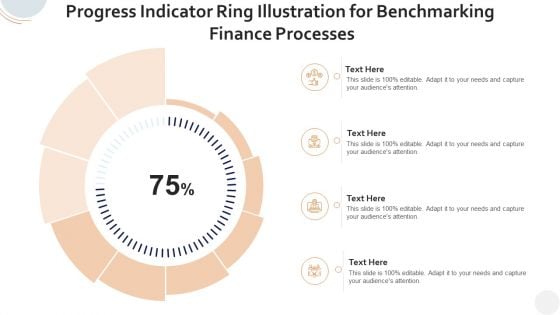
Progress Indicator Ring Illustration For Benchmarking Finance Processes Clipart PDF
Pitch your topic with ease and precision using this progress indicator ring illustration for benchmarking finance processes clipart pdf. This layout presents information on progress indicator ring illustration for benchmarking finance processes. It is also available for immediate download and adjustment. So, changes can be made in the color, design, graphics or any other component to create a unique layout.
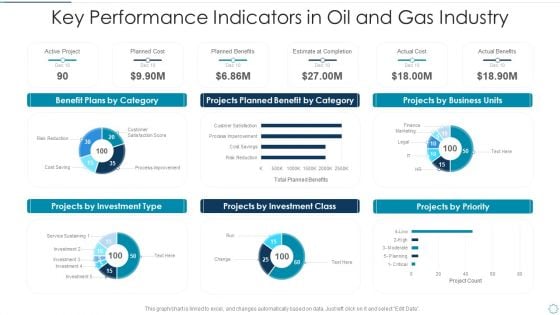
Key Performance Indicators In Oil And Gas Industry Template PDF
Showcasing this set of slides titled key performance indicators in oil and gas industry template pdf. The topics addressed in these templates are key performance indicators in oil and gas industry. All the content presented in this PPT design is completely editable. Download it and make adjustments in color, background, font etc. as per your unique business setting.
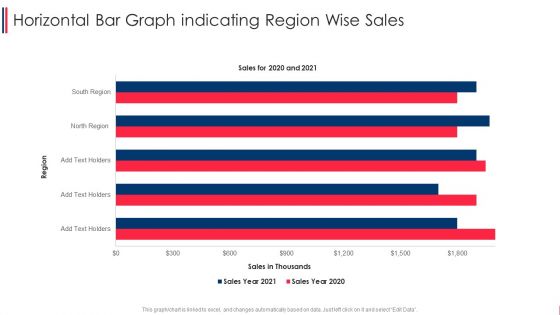
Horizontal Bar Graph Indicating Region Wise Sales Formats PDF
Pitch your topic with ease and precision using this horizontal bar graph indicating region wise sales formats pdf. This layout presents information on horizontal bar graph indicating region wise sales. It is also available for immediate download and adjustment. So, changes can be made in the color, design, graphics or any other component to create a unique layout.
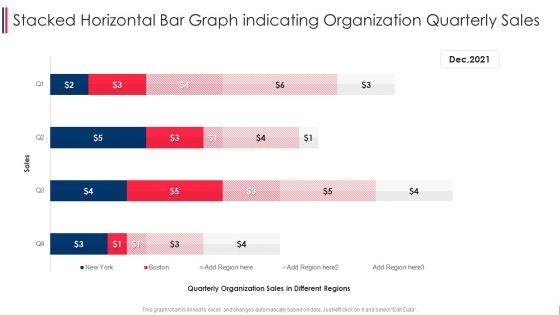
Stacked Horizontal Bar Graph Indicating Organization Quarterly Sales Graphics PDF
Pitch your topic with ease and precision using this stacked horizontal bar graph indicating organization quarterly sales graphics pdf. This layout presents information on stacked horizontal bar graph indicating organization quarterly sales. It is also available for immediate download and adjustment. So, changes can be made in the color, design, graphics or any other component to create a unique layout.
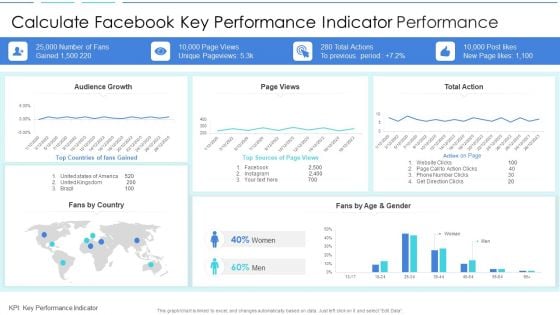
Calculate Facebook Key Performance Indicator Performance Sample PDF
Pitch your topic with ease and precision using this calculate facebook key performance indicator performance sample pdf. This layout presents information on calculate facebook key performance indicator performance. It is also available for immediate download and adjustment. So, changes can be made in the color, design, graphics or any other component to create a unique layout.
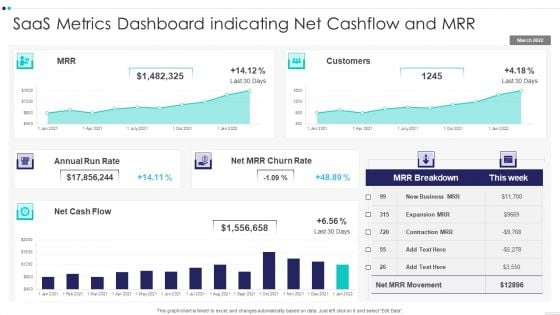
Saas Metrics Dashboard Indicating Net Cashflow And MRR Demonstration PDF
Pitch your topic with ease and precision using this Saas Metrics Dashboard Indicating Net Cashflow And MRR Demonstration PDF This layout presents information on Saas Metrics Dashboard Indicating Net Cashflow And MRR It is also available for immediate download and adjustment. So, changes can be made in the color, design, graphics or any other component to create a unique layout.
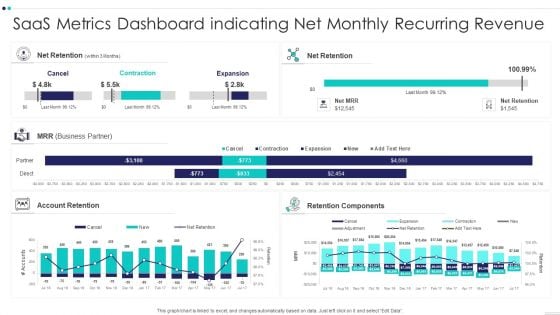
Saas Metrics Dashboard Indicating Net Monthly Recurring Revenue Information PDF
Showcasing this set of slides titled Saas Metrics Dashboard Indicating Net Monthly Recurring Revenue Information PDF The topics addressed in these templates are Saas Metrics Dashboard Indicating Net Monthly Recurring Revenue All the content presented in this PPT design is completely editable. Download it and make adjustments in color, background, font etc. as per your unique business setting.
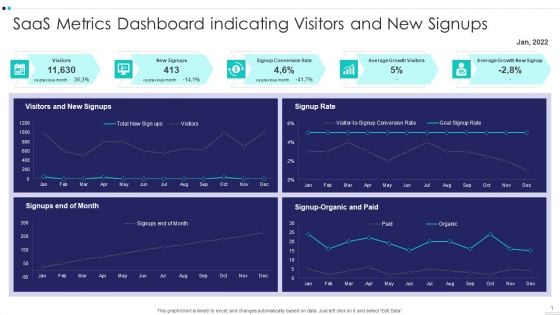
Saas Metrics Dashboard Indicating Visitors And New Signups Elements PDF
Pitch your topic with ease and precision using this Saas Metrics Dashboard Indicating Visitors And New Signups Elements PDF This layout presents information on Saas Metrics Dashboard Indicating Visitors And New Signups It is also available for immediate download and adjustment. So, changes can be made in the color, design, graphics or any other component to create a unique layout.
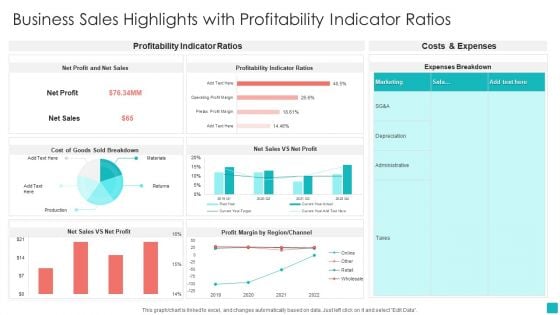
Business Sales Highlights With Profitability Indicator Ratios Download PDF
Showcasing this set of slides titled Business Sales Highlights With Profitability Indicator Ratios Download PDF. The topics addressed in these templates are Net Profit, Net Sales, Profitability Indicator Ratios. All the content presented in this PPT design is completely editable. Download it and make adjustments in color, background, font etc. as per your unique business setting.
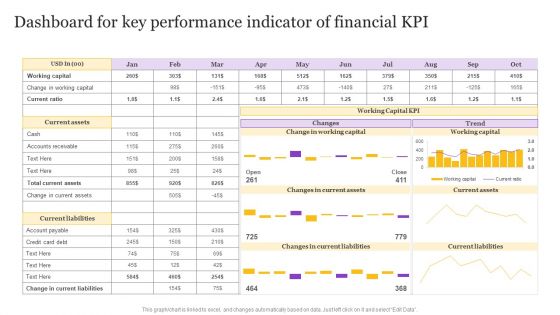
Dashboard For Key Performance Indicator Of Financial KPI Background PDF
Pitch your topic with ease and precision using this Dashboard For Key Performance Indicator Of Financial KPI Background PDF. This layout presents information on Dashboard For Key, Performance Indicator, Financial KPI. It is also available for immediate download and adjustment. So, changes can be made in the color, design, graphics or any other component to create a unique layout.
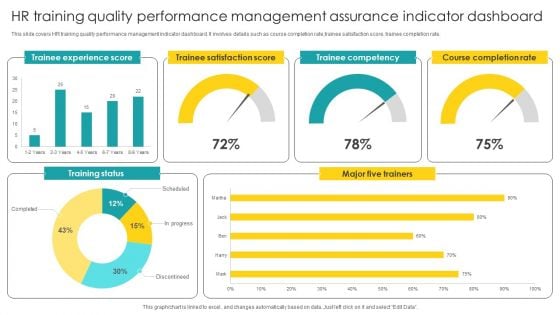
HR Training Quality Performance Management Assurance Indicator Dashboard Structure PDF
Showcasing this set of slides titled HR Training Quality Performance Management Assurance Indicator Dashboard Structure PDF. The topics addressed in these templates are Performance Management, Assurance Indicator Dashboard. All the content presented in this PPT design is completely editable. Download it and make adjustments in color, background, font etc. as per your unique business setting.
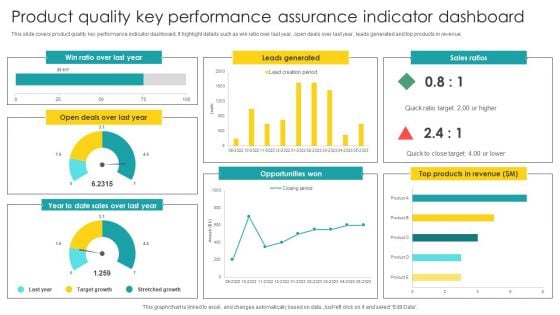
Product Quality Key Performance Assurance Indicator Dashboard Graphics PDF
Showcasing this set of slides titled Product Quality Key Performance Assurance Indicator Dashboard Graphics PDF. The topics addressed in these templates are Key Performance, Assurance Indicator, Dashboard. All the content presented in this PPT design is completely editable. Download it and make adjustments in color, background, font etc. as per your unique business setting.
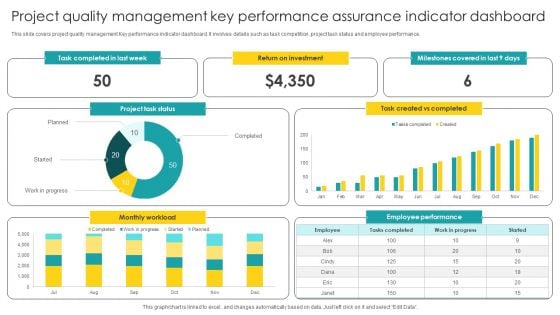
Project Quality Management Key Performance Assurance Indicator Dashboard Guidelines PDF
Pitch your topic with ease and precision using this Project Quality Management Key Performance Assurance Indicator Dashboard Guidelines PDF. This layout presents information on Management Key, Performance Assurance, Indicator Dashboard. It is also available for immediate download and adjustment. So, changes can be made in the color, design, graphics or any other component to create a unique layout.
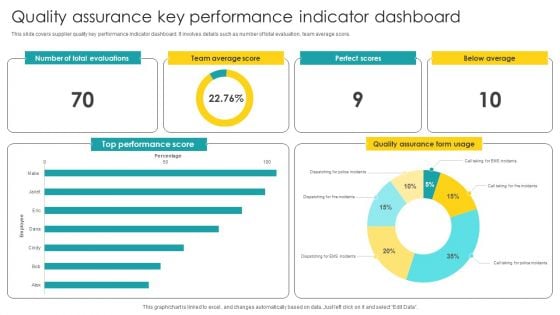
Quality Assurance Key Performance Indicator Dashboard Structure PDF
Showcasing this set of slides titled Quality Assurance Key Performance Indicator Dashboard Structure PDF. The topics addressed in these templates are Key Performance, Indicator Dashboard. All the content presented in this PPT design is completely editable. Download it and make adjustments in color, background, font etc. as per your unique business setting.
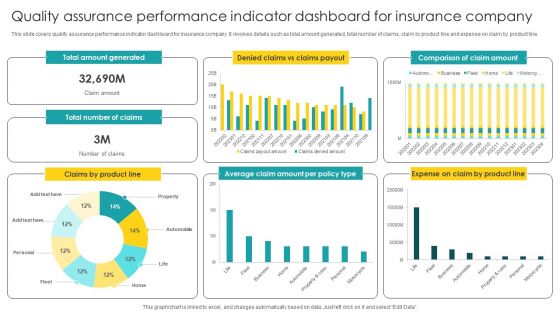
Quality Assurance Performance Indicator Dashboard For Insurance Company Brochure PDF
Pitch your topic with ease and precision using this Quality Assurance Performance Indicator Dashboard For Insurance Company Brochure PDF. This layout presents information on Performance Indicator, Dashboard For Insurance Company. It is also available for immediate download and adjustment. So, changes can be made in the color, design, graphics or any other component to create a unique layout.
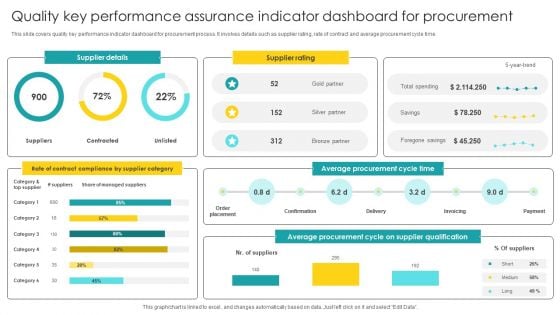
Quality Key Performance Assurance Indicator Dashboard For Procurement Elements PDF
Pitch your topic with ease and precision using this Quality Key Performance Assurance Indicator Dashboard For Procurement Elements PDF. This layout presents information on Indicator Dashboard, Procurement. It is also available for immediate download and adjustment. So, changes can be made in the color, design, graphics or any other component to create a unique layout.
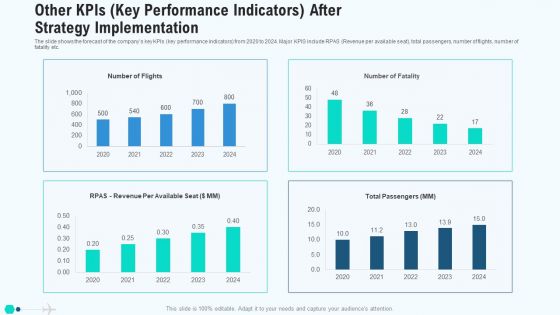
Other Kpis Key Performance Indicators After Strategy Implementation Mockup PDF
The slide shows the forecast of the companys key KPIs key performance indicators from 2020 to 2024. Major KPIS include RPAS Revenue per available seat, total passengers, number of flights, number of fatality etc. Deliver and pitch your topic in the best possible manner with this other kpis key performance indicators after strategy implementation mockup pdf. Use them to share invaluable insights on other kpis key performance indicators after strategy implementation and impress your audience. This template can be altered and modified as per your expectations. So, grab it now.
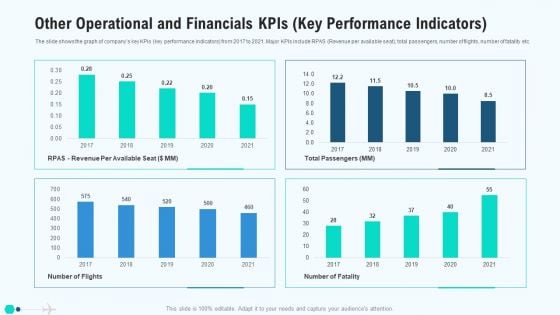
Other Operational And Financials Kpis Key Performance Indicators Clipart PDF
The slide shows the graph of companys key KPIs key performance indicators from 2017 to 2021. Major KPIs include RPAS Revenue per available seat, total passengers, number of flights, number of fatality etc. Deliver an awe inspiring pitch with this creative other operational and financials kpis key performance indicators clipart pdf bundle. Topics like other operational and financials kpis key performance indicators can be discussed with this completely editable template. It is available for immediate download depending on the needs and requirements of the user.
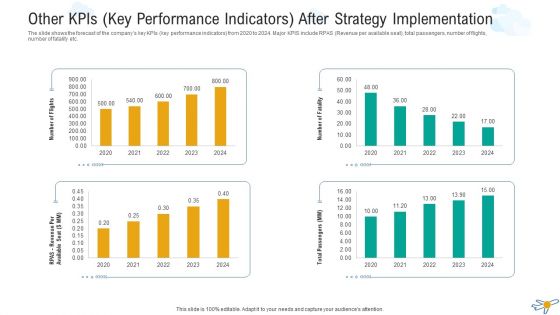
Other Kpis Key Performance Indicators After Strategy Implementation Microsoft PDF
The slide shows the forecast of the companys key KPIs key performance indicators from 2020 to 2024. Major KPIS include RPAS Revenue per available seat, total passengers, number of flights, number of fatality etc. Deliver and pitch your topic in the best possible manner with this other kpis key performance indicators after strategy implementation microsoft pdf. Use them to share invaluable insights on other kpis key performance indicators after strategy implementation and impress your audience. This template can be altered and modified as per your expectations. So, grab it now.
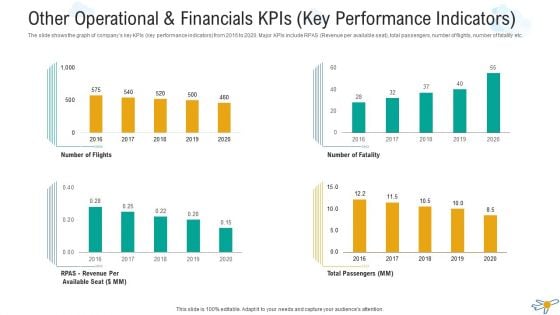
Other Operational And Financials Kpis Key Performance Indicators Professional PDF
The slide shows the graph of companys key KPIs key performance indicators from 2016 to 2020. Major KPIs include RPAS Revenue per available seat, total passengers, number of flights, number of fatality etc. Deliver an awe-inspiring pitch with this creative other operational and financials kpis key performance indicators professional pdf bundle. Topics like other operational and financials kpis key performance indicators can be discussed with this completely editable template. It is available for immediate download depending on the needs and requirements of the user.
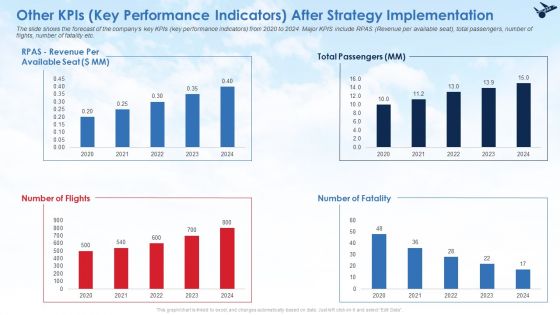
Other Kpis Key Performance Indicators After Strategy Implementation Infographics PDF
The slide shows the forecast of the companys key KPIs key performance indicators from 2020 to 2024. Major KPIS include RPAS Revenue per available seat, total passengers, number of flights, number of fatality etc. Deliver and pitch your topic in the best possible manner with this other kpis key performance indicators after strategy implementation infographics pdf. Use them to share invaluable insights on other kpis key performance indicators after strategy implementation and impress your audience. This template can be altered and modified as per your expectations. So, grab it now.
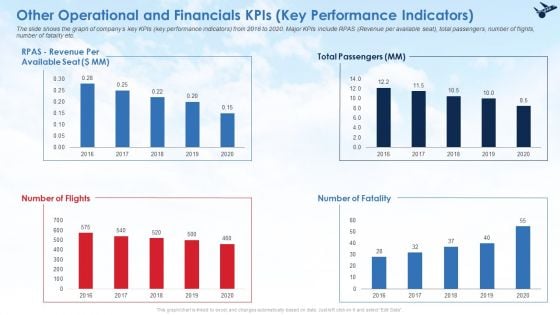
Other Operational And Financials Kpis Key Performance Indicators Ideas PDF
The slide shows the graph of companys key KPIs key performance indicators from 2016 to 2020. Major KPIs include RPAS Revenue per available seat, total passengers, number of flights, number of fatality etc. Deliver an awe inspiring pitch with this creative other operational and financials kpis key performance indicators ideas pdf bundle. Topics like other operational and financials kpis key performance indicators can be discussed with this completely editable template. It is available for immediate download depending on the needs and requirements of the user.
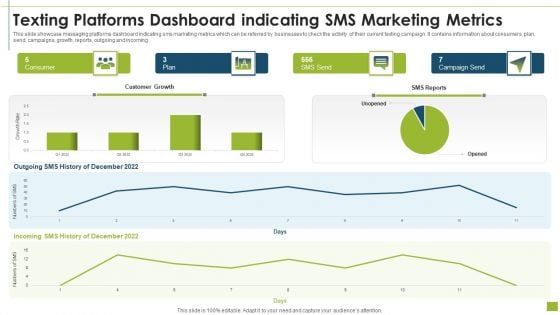
Texting Platforms Dashboard Indicating SMS Marketing Metrics Designs PDF
This slide showcase messaging platforms dashboard indicating sms marketing metrics which can be referred by businesses to check the activity of their current texting campaign. It contains information about consumers, plan, send, campaigns, growth, reports, outgoing and incoming.Pitch your topic with ease and precision using this texting platforms dashboard indicating sms marketing metrics designs pdf This layout presents information on texting platforms dashboard indicating sms marketing metrics It is also available for immediate download and adjustment. So, changes can be made in the color, design, graphics or any other component to create a unique layout.
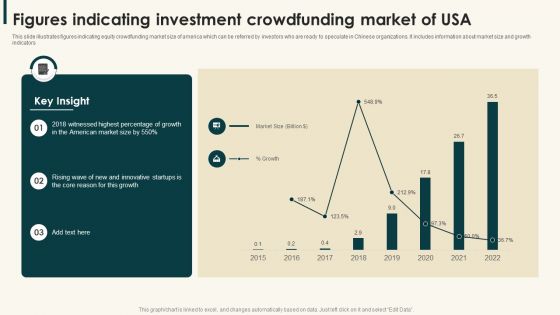
Figures Indicating Investment Crowdfunding Market Of Usa Information PDF
This slide illustrates figures indicating equity crowdfunding market size of america which can be referred by investors who are ready to speculate in Chinese organizations. It includes information about market size and growth indicators,Pitch your topic with ease and precision using this Figures Indicating Investment Crowdfunding Market Of Usa Information PDF. This layout presents information on Witnessed Highest, American Market, Innovative Startups. It is also available for immediate download and adjustment. So, changes can be made in the color, design, graphics or any other component to create a unique layout.
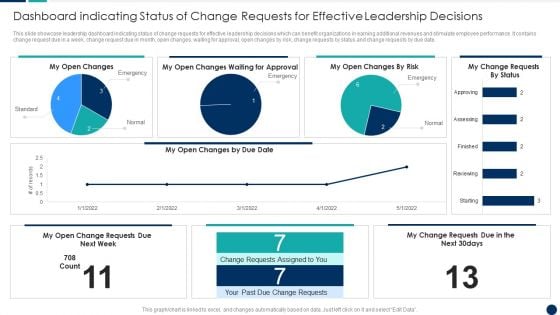
Dashboard Indicating Status Of Change Requests For Effective Leadership Decisions Themes PDF
This slide showcase leadership dashboard indicating status of change requests for effective leadership decisions which can benefit organizations in earning additional revenues and stimulate employee performance. It contains change request due in a week, change request due in month, open changes, waiting for approval, open changes by risk, change requests by status and change requests by due date.Showcasing this set of slides titled Dashboard Indicating Status Of Change Requests For Effective Leadership Decisions Themes PDF The topics addressed in these templates are Dashboard Indicating, Requests Effective, Leadership Decisions All the content presented in this PPT design is completely editable. Download it and make adjustments in color, background, font etc. as per your unique business setting.
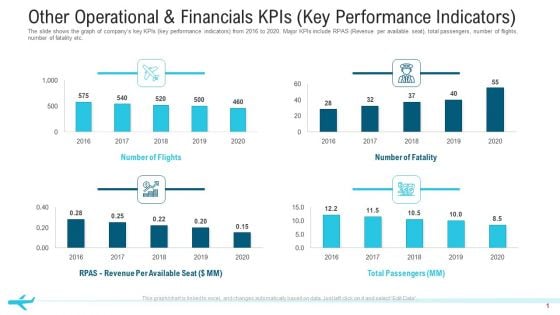
Other Operational And Financials Kpis Key Performance Indicators Structure PDF
The slide shows the graph of companys key KPIs key performance indicators from 2016 to 2020. Major KPIs include RPAS Revenue per available seat, total passengers, number of flights, number of fatality etc.Deliver an awe-inspiring pitch with this creative other operational and financials KPIs key performance indicators structure pdf. bundle. Topics like total passengers, number of flights,2016 to 2020 can be discussed with this completely editable template. It is available for immediate download depending on the needs and requirements of the user.
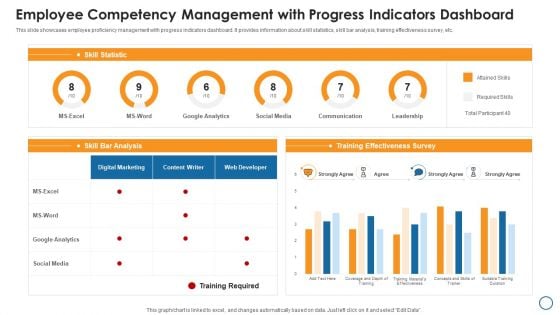
Employee Competency Management With Progress Indicators Dashboard Graphics PDF
This slide showcases employee proficiency management with progress indicators dashboard. It provides information about skill statistics, skill bar analysis, training effectiveness survey, etc. Showcasing this set of slides titled employee competency management with progress indicators dashboard graphics pdf. The topics addressed in these templates are google analytics, social media, survey. All the content presented in this PPT design is completely editable. Download it and make adjustments in color, background, font etc. as per your unique business setting.
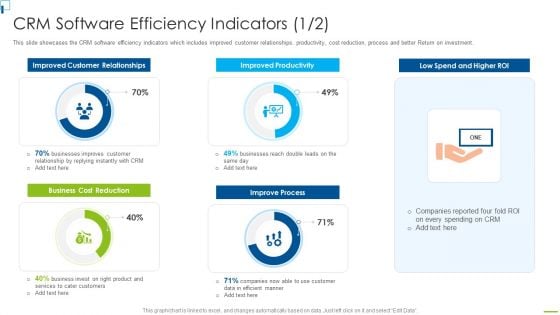
CRM Software Efficiency Indicators Designing And Deployment Elements PDF
This slide showcases the CRM software efficiency indicators which includes improved customer relationships, productivity, cost reduction, process and better Return on investment. Deliver an awe inspiring pitch with this creative crm software efficiency indicators designing and deployment elements pdf bundle. Topics like improved customer relationships, improved productivity, low spend and higher roi, business cost reduction, improve process can be discussed with this completely editable template. It is available for immediate download depending on the needs and requirements of the user.
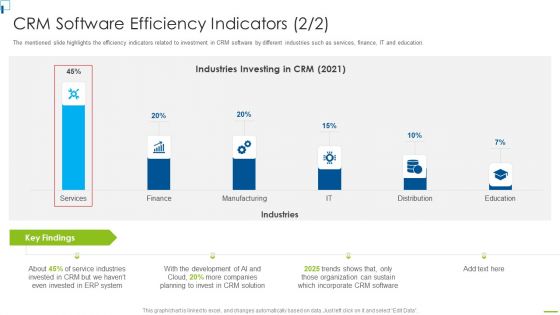
Designing And Deployment CRM Software Efficiency Indicators Portrait PDF
The mentioned slide highlights the efficiency indicators related to investment in CRM software by different industries such as services, finance, IT and education. Deliver an awe inspiring pitch with this creative designing and deployment crm software efficiency indicators portrait pdf bundle. Topics like industries investing in crm 2021, finance, services, education, manufacturing, it can be discussed with this completely editable template. It is available for immediate download depending on the needs and requirements of the user.
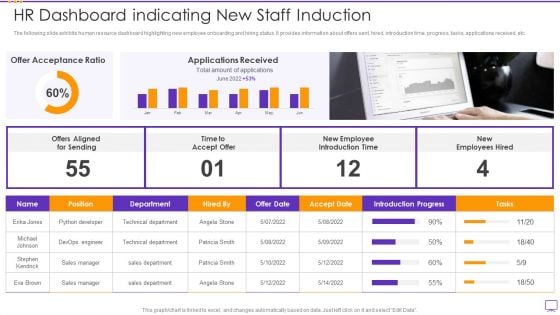
HR Dashboard Indicating New Staff Induction Portrait PDF
The following slide exhibits human resource dashboard highlighting new employee onboarding and hiring status. It provides information about offers sent, hired, introduction time, progress, tasks, applications received, etc. Showcasing this set of slides titled HR Dashboard Indicating New Staff Induction Portrait PDF. The topics addressed in these templates are HR Dashboard Indicating New Staff Induction. All the content presented in this PPT design is completely editable. Download it and make adjustments in color, background, font etc. as per your unique business setting.
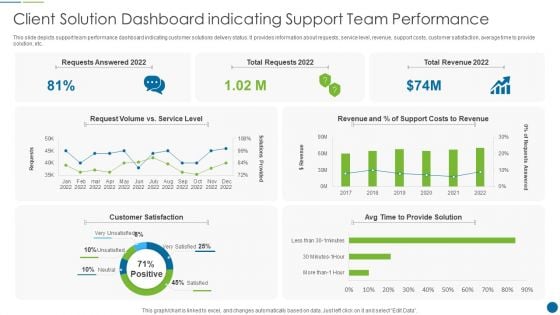
Client Solution Dashboard Indicating Support Team Performance Graphics PDF
This slide depicts support team performance dashboard indicating customer solutions delivery status. It provides information about requests, service level, revenue, support costs, customer satisfaction, average time to provide solution, etc. Showcasing this set of slides titled Client Solution Dashboard Indicating Support Team Performance Graphics PDF. The topics addressed in these templates are Costs, Revenue, Customer. All the content presented in this PPT design is completely editable. Download it and make adjustments in color, background, font etc. as per your unique business setting.
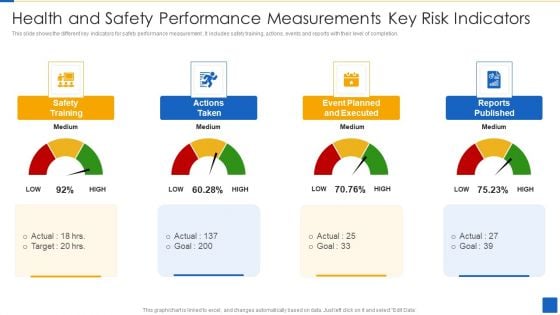
Health And Safety Performance Measurements Key Risk Indicators Download PDF
This slide shows the different key indicators for safety performance measurement . It includes safety training, actions, events and reports with their level of completion.Showcasing this set of slides titled Health And Safety Performance Measurements Key Risk Indicators Download PDF The topics addressed in these templates are Safety Training, Actions Taken, Event Planned Executed All the content presented in this PPT design is completely editable. Download it and make adjustments in color, background, font etc. as per your unique business setting.
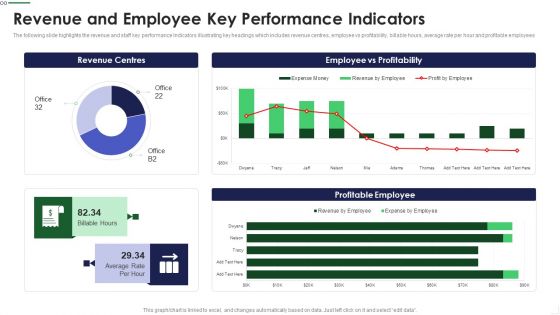
Revenue And Employee Key Performance Indicators Background PDF
The following slide highlights the revenue and staff key performance Indicators illustrating key headings which includes revenue centres, employee vs profitability, billable hours, average rate per hour and profitable employees Deliver an awe inspiring pitch with this creative Revenue And Employee Key Performance Indicators Background PDF bundle. Topics like Revenue Centres, Employee Profitability, Profitable Employee can be discussed with this completely editable template. It is available for immediate download depending on the needs and requirements of the user.
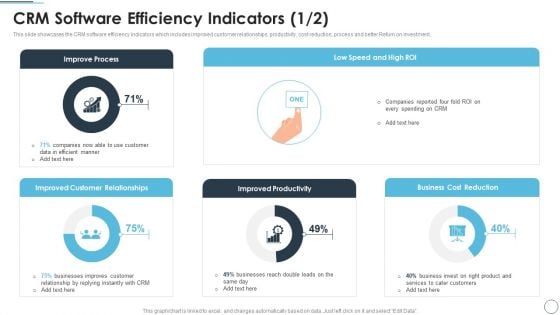
CRM Solutions Implementation Strategy CRM Software Efficiency Indicators Ideas PDF
This slide showcases the CRM software efficiency indicators which includes improved customer relationships, productivity, cost reduction, process and better Return on investment.Deliver and pitch your topic in the best possible manner with this CRM Solutions Implementation Strategy CRM Software Efficiency Indicators Ideas PDF Use them to share invaluable insights on Improve Process, Improved Customer, Improved Productivity and impress your audience. This template can be altered and modified as per your expectations. So, grab it now.
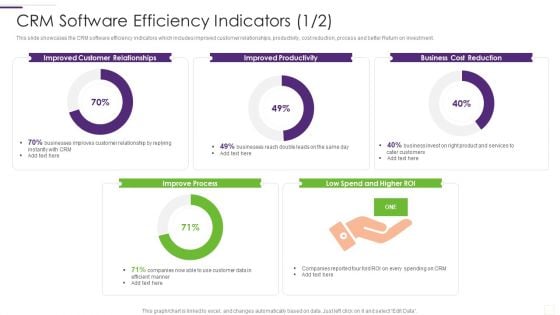
CRM Implementation Strategy CRM Software Efficiency Indicators Clipart PDF
This slide showcases the CRM software efficiency indicators which includes improved customer relationships, productivity, cost reduction, process and better Return on investment.Deliver and pitch your topic in the best possible manner with this CRM Implementation Strategy CRM Software Efficiency Indicators Clipart PDF Use them to share invaluable insights on Customer Relationships, Improved Productivity, Cost Reduction and impress your audience. This template can be altered and modified as per your expectations. So, grab it now.
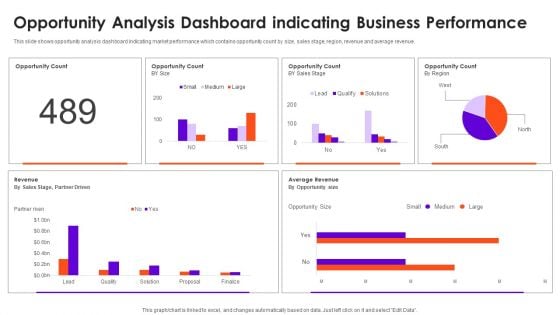
Opportunity Analysis Dashboard Indicating Business Performance Information Rules PDF
This slide shows opportunity analysis dashboard indicating market performance which contains opportunity count by size, sales stage, region, revenue and average revenue. Pitch your topic with ease and precision using this Opportunity Analysis Dashboard Indicating Business Performance Information Rules PDF. This layout presents information on Opportunity Count, Revenue, Sales. It is also available for immediate download and adjustment. So, changes can be made in the color, design, graphics or any other component to create a unique layout.
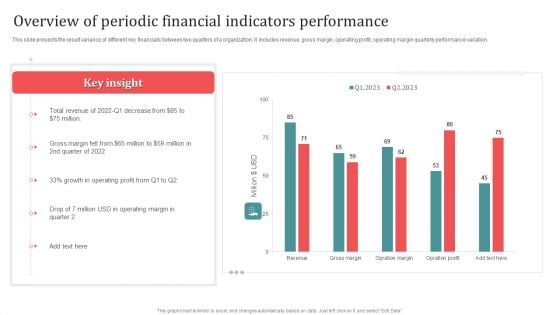
Overview Of Periodic Financial Indicators Performance Designs PDF
This slide presents the result variance of different key financials between two quarters of a organization. It includes revenue, gross margin, operating profit, operating margin quarterly performance variation. Showcasing this set of slides titled Overview Of Periodic Financial Indicators Performance Designs PDF. The topics addressed in these templates are Overview Of Periodic, Financial Indicators Performance. All the content presented in this PPT design is completely editable. Download it and make adjustments in color, background, font etc. as per your unique business setting.
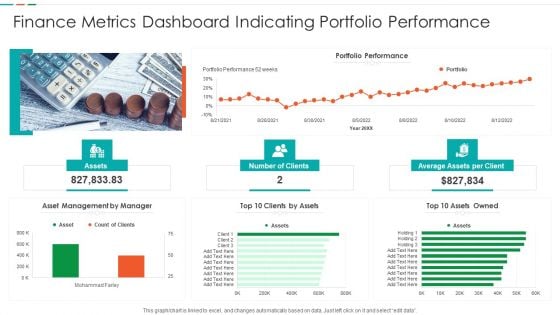
Finance Metrics Dashboard Indicating Portfolio Performance Microsoft PDF
This graph or chart is linked to excel, and changes automatically based on data. Just left click on it and select edit data. Pitch your topic with ease and precision using this Finance Metrics Dashboard Indicating Portfolio Performance Microsoft PDF. This layout presents information on Portfolio Performance Portfolio, Asset Management Manager, Top 10 Assets. It is also available for immediate download and adjustment. So, changes can be made in the color, design, graphics or any other component to create a unique layout.
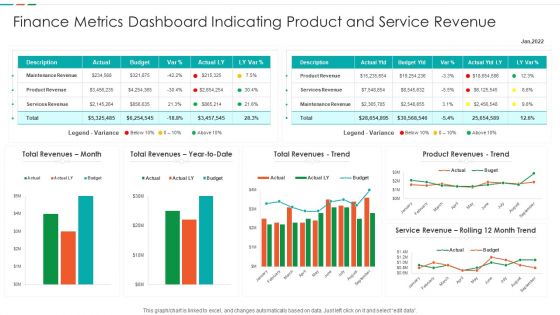
Finance Metrics Dashboard Indicating Product And Service Revenue Designs PDF
This graph or chart is linked to excel, and changes automatically based on data. Just left click on it and select edit data. Showcasing this set of slides titled Finance Metrics Dashboard Indicating Product And Service Revenue Designs PDF. The topics addressed in these templates are Maintenance Revenue Product, Revenue Product Revenues, Service Revenue Rolling. All the content presented in this PPT design is completely editable. Download it and make adjustments in color, background, font etc. as per your unique business setting.
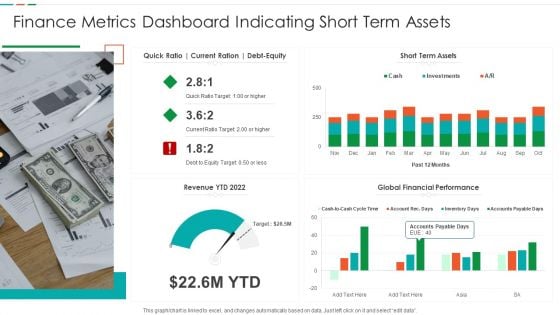
Finance Metrics Dashboard Indicating Short Term Assets Download PDF
This graph or chart is linked to excel, and changes automatically based on data. Just left click on it and select edit data. Pitch your topic with ease and precision using this Finance Metrics Dashboard Indicating Short Term Assets Download PDF. This layout presents information on Short Term Assets, Global Financial Performance, Revenue YTD 2022. It is also available for immediate download and adjustment. So, changes can be made in the color, design, graphics or any other component to create a unique layout.
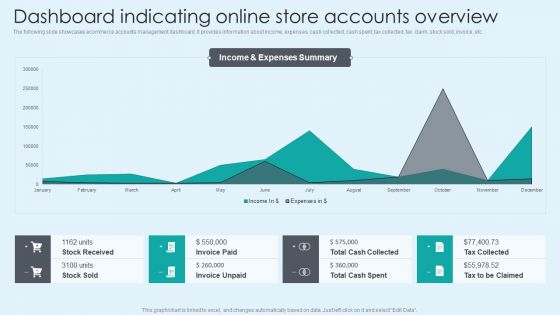
Dashboard Indicating Online Store Accounts Overview Introduction PDF
The following slide showcases ecommerce accounts management dashboard. It provides information about income, expenses, cash collected, cash spent, tax collected, tax claim, stock sold, invoice, etc. Presenting this PowerPoint presentation, titled Dashboard Indicating Online Store Accounts Overview Introduction PDF, with topics curated by our researchers after extensive research. This editable presentation is available for immediate download and provides attractive features when used. Download now and captivate your audience. Presenting this Dashboard Indicating Online Store Accounts Overview Introduction PDF. Our researchers have carefully researched and created these slides with all aspects taken into consideration. This is a completely customizable Dashboard Indicating Online Store Accounts Overview Introduction PDF that is available for immediate downloading. Download now and make an impact on your audience. Highlight the attractive features available with our PPTs.
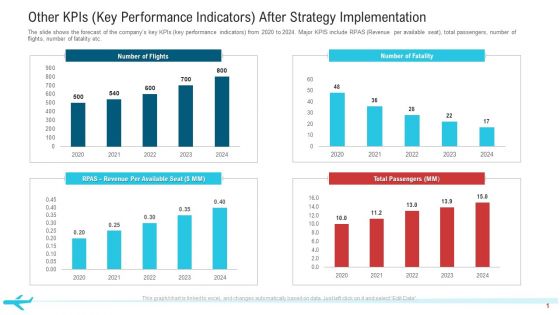
Other Kpis Key Performance Indicators After Strategy Implementation Professional PDF
The slide shows the forecast of the companys key KPIs key performance indicators from 2020 to 2024. Major KPIS include RPAS Revenue per available seat, total passengers, number of flights, number of fatality etc.Deliver and pitch your topic in the best possible manner with this other KPIs key performance indicators after strategy implementation professional pdf. Use them to share invaluable insights on total passengers, number of flights, 2020 to 2024 and impress your audience. This template can be altered and modified as per your expectations. So, grab it now.
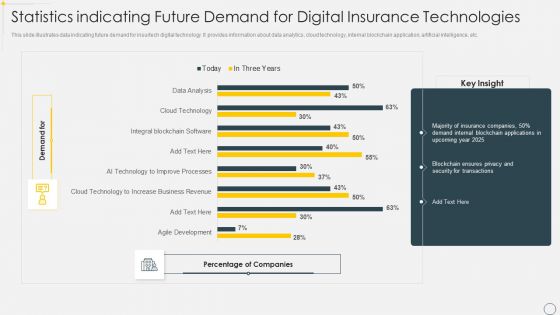
Statistics Indicating Future Demand For Digital Insurance Technologies Brochure PDF
This slide illustrates data indicating future demand for insurtech digital technology. It provides information about data analytics, cloud technology, internal blockchain application, artificial intelligence, etc. Pitch your topic with ease and precision using this Statistics Indicating Future Demand For Digital Insurance Technologies Brochure PDF. This layout presents information on Data Analytics, Cloud Technology, Internal Blockchain Application. It is also available for immediate download and adjustment. So, changes can be made in the color, design, graphics or any other component to create a unique layout.
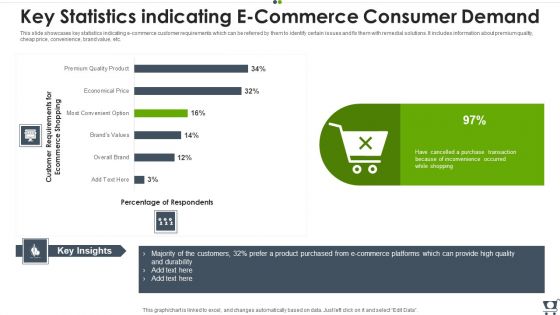
Key Statistics Indicating E Commerce Consumer Demand Professional PDF
This slide showcases key statistics indicating e commerce customer requirements which can be referred by them to identify certain issues and fix them with remedial solutions. It includes information about premium quality, cheap price, convenience, brand value, etc. Showcasing this set of slides titled Key Statistics Indicating E Commerce Consumer Demand Professional PDF. The topics addressed in these templates are E Commerce, Purchased, Product. All the content presented in this PPT design is completely editable. Download it and make adjustments in color, background, font etc. as per your unique business setting.
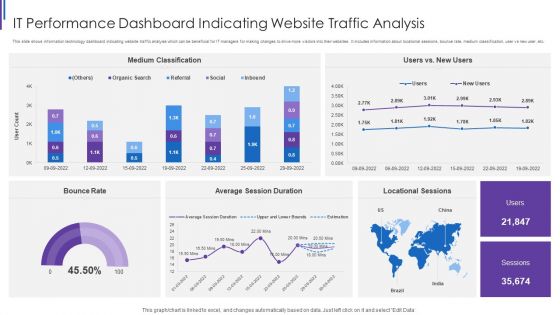
IT Performance Dashboard Indicating Website Traffic Analysis Background PDF
This slide shows information technology dashboard indicating website traffic analysis which can be beneficial for IT managers for making changes to drive more visitors into their websites. It includes information about locational sessions, bounce rate, medium classification, user vs new user, etc. Pitch your topic with ease and precision using this IT Performance Dashboard Indicating Website Traffic Analysis Background PDF. This layout presents information on Medium Classification Rate, Average Session Duration, Locational Sessions Bounce. It is also available for immediate download and adjustment. So, changes can be made in the color, design, graphics or any other component to create a unique layout.
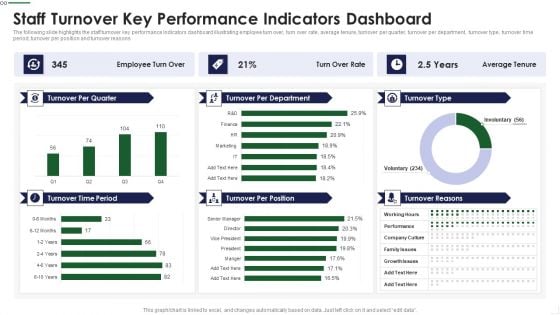
Staff Turnover Key Performance Indicators Dashboard Sample PDF
The following slide highlights the staff turnover key performance Indicators dashboard illustrating employee turn over, turn over rate, average tenure, turnover per quarter, turnover per department, turnover type, turnover time period, turnover per position and turnover reasons Deliver and pitch your topic in the best possible manner with this Staff Turnover Key Performance Indicators Dashboard Sample PDF Use them to share invaluable insights on Management Goals, Subjective Appraisal, Product Defects and impress your audience. This template can be altered and modified as per your expectations. So, grab it now.
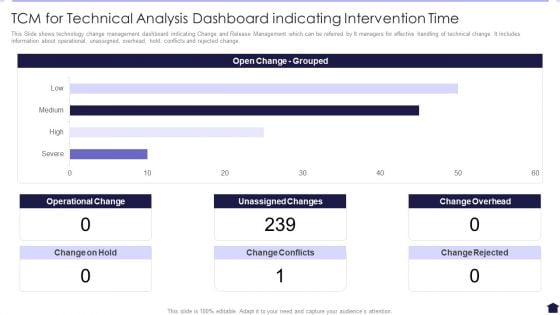
TCM For Technical Analysis Dashboard Indicating Intervention Time Background PDF
This Slide shows technology change management dashboard indicating Change and Release Management which can be referred by It managers for effective handling of technical change. It includes information about operational, unassigned, overhead, hold, conflicts and rejected change. Showcasing this set of slides titled TCM For Technical Analysis Dashboard Indicating Intervention Time Background PDF. The topics addressed in these templates are Operational Change, Unassigned Changes, Change Overhead. All the content presented in this PPT design is completely editable. Download it and make adjustments in color, background, font etc. as per your unique business setting.
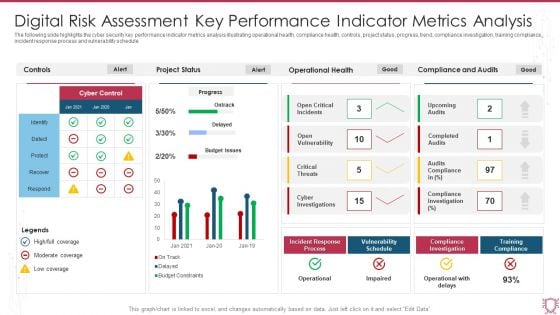
Digital Risk Assessment Key Performance Indicator Metrics Analysis Infographics PDF
The following slide highlights the cyber security key performance indicator metrics analysis illustrating operational health, compliance health, controls, project status, progress, trend, compliance investigation, training compliance, incident response process and vulnerability schedule. Showcasing this set of slides titled Digital Risk Assessment Key Performance Indicator Metrics Analysis Infographics PDF. The topics addressed in these templates are Project Status, Operational Health, Compliance And Audits. All the content presented in this PPT design is completely editable. Download it and make adjustments in color, background, font etc. as per your unique business setting.
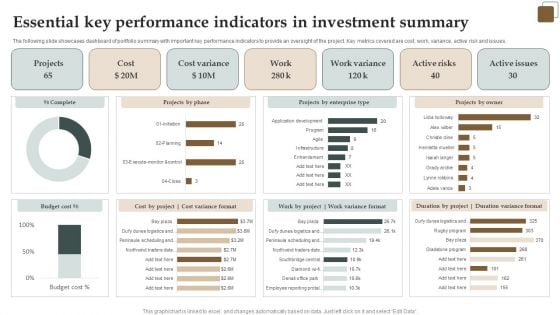
Essential Key Performance Indicators In Investment Summary Demonstration PDF
The following slide showcases dashboard of portfolio summary with important key performance indicators to provide an oversight of the project. Key metrics covered are cost, work, variance, active risk and issues. Showcasing this set of slides titled Essential Key Performance Indicators In Investment Summary Demonstration PDF. The topics addressed in these templates are Cost, Active Risks, Projects. All the content presented in this PPT design is completely editable. Download it and make adjustments in color, background, font etc. as per your unique business setting.
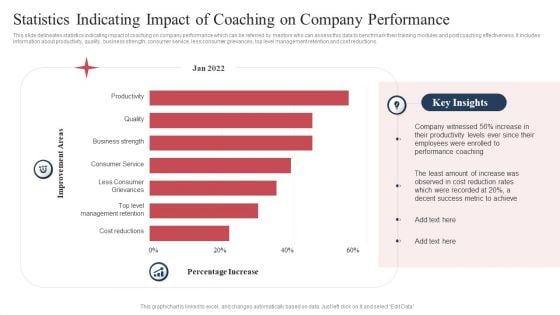
Statistics Indicating Impact Of Coaching On Company Performance Formats PDF
This slide delineates statistics indicating impact of coaching on company performance which can be referred by mentors who can assess this data to benchmark their training modules and post coaching effectiveness. It includes information about productivity, quality, business strength, consumer service, less consumer grievances, top level management retention and cost reductions. Pitch your topic with ease and precision using this Statistics Indicating Impact Of Coaching On Company Performance Formats PDF. This layout presents information on Productivity, Quality, Business Strength. It is also available for immediate download and adjustment. So, changes can be made in the color, design, graphics or any other component to create a unique layout.
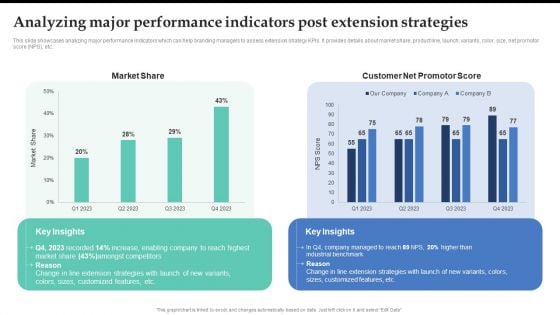
Analyzing Major Performance Indicators Post Extension Strategies Topics PDF
This slide showcases analyzing major performance indicators which can help branding managers to assess extension strategy KPIs. It provides details about market share, product line, launch, variants, color, size, net promotor score NPS, etc. From laying roadmaps to briefing everything in detail, our templates are perfect for you. You can set the stage with your presentation slides. All you have to do is download these easy-to-edit and customizable templates. Analyzing Major Performance Indicators Post Extension Strategies Topics PDF will help you deliver an outstanding performance that everyone would remember and praise you for. Do download this presentation today.
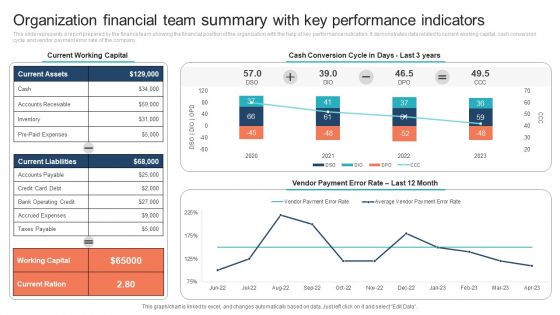
Organization Financial Team Summary With Key Performance Indicators Clipart PDF
This slide represents a report prepared by the finance team showing the financial position of the organization with the help of key performance indicators. It demonstrates data related to current working capital, cash conversion cycle and vendor payment error rate of the company. Pitch your topic with ease and precision using this Organization Financial Team Summary With Key Performance Indicators Clipart PDF. This layout presents information on Current Working Capital, Cash Conversion Cycle. It is also available for immediate download and adjustment. So, changes can be made in the color, design, graphics or any other component to create a unique layout.
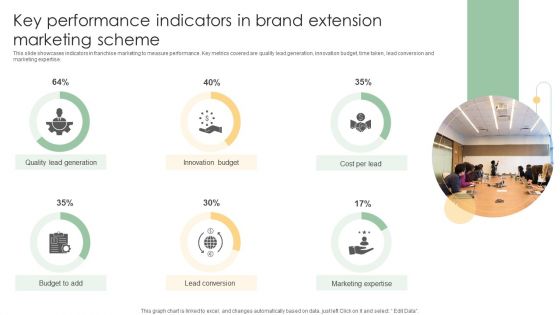
Key Performance Indicators In Brand Extension Marketing Scheme Ideas PDF
This slide showcases indicators in franchise marketing to measure performance. Key metrics covered are quality lead generation, innovation budget, time taken, lead conversion and marketing expertise.Pitch your topic with ease and precision using this Key Performance Indicators In Brand Extension Marketing Scheme Ideas PDF. This layout presents information on Quality Lead Generation, Innovation Budget, Lead Conversion. It is also available for immediate download and adjustment. So, changes can be made in the color, design, graphics or any other component to create a unique layout.
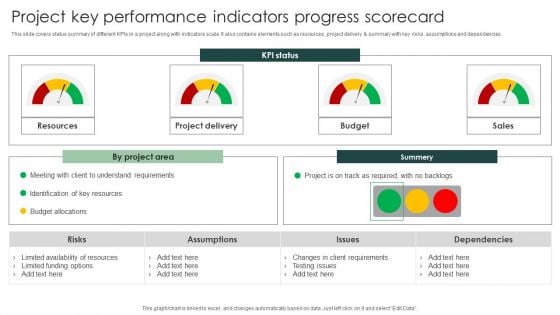
Project Key Performance Indicators Progress Scorecard Portrait PDF
This slide covers status summary of different KPIs in a project along with indicators scale. It also contains elements such as resources , project delivery summary with key risks, assumptions and dependencies.Pitch your topic with ease and precision using this Project Key Performance Indicators Progress Scorecard Portrait PDF. This layout presents information on Limited Availability Resources, Limited Funding Options, Key Resources . It is also available for immediate download and adjustment. So, changes can be made in the color, design, graphics or any other component to create a unique layout.
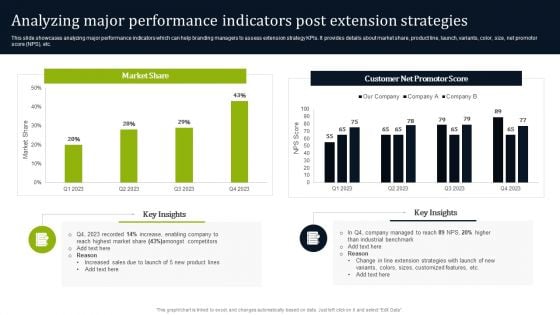
Analyzing Major Performance Indicators Post Extension Strategies Designs PDF
This slide showcases analyzing major performance indicators which can help branding managers to assess extension strategy KPIs. It provides details about market share, product line, launch, variants, color, size, net promotor score NPS, etc. Want to ace your presentation in front of a live audience Our Analyzing Major Performance Indicators Post Extension Strategies Designs PDF can help you do that by engaging all the users towards you. Slidegeeks experts have put their efforts and expertise into creating these impeccable powerpoint presentations so that you can communicate your ideas clearly. Moreover, all the templates are customizable, and easy-to-edit and downloadable. Use these for both personal and commercial use.

Call Center Process Key Performance Indicator Dashboard Mockup PDF
This slide showcases call center process measurements and key performance indicators so managers and teams can keep track of and improve performance . It includes received calls, calculating speed of answering calls , ended calls before starting conversations , average calls per minute etc. Showcasing this set of slides titled Call Center Process Key Performance Indicator Dashboard Mockup PDF. The topics addressed in these templates are Received Calls, Conversation, Abandon Rate. All the content presented in this PPT design is completely editable. Download it and make adjustments in color, background, font etc. as per your unique business setting.
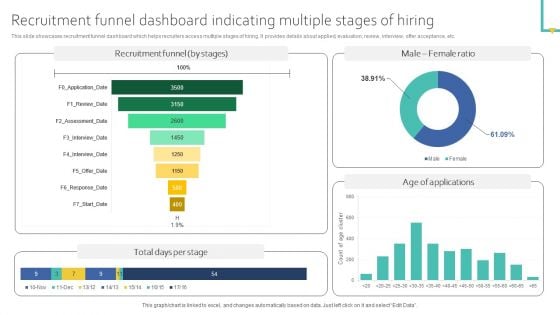
Recruitment Funnel Dashboard Indicating Multiple Stages Of Hiring Ideas PDF
This slide showcases recruitment funnel dashboard which helps recruiters access multiple stages of hiring. It provides details about applied, evaluation, review, interview, offer acceptance, etc. Get a simple yet stunning designed Recruitment Funnel Dashboard Indicating Multiple Stages Of Hiring Ideas PDF. It is the best one to establish the tone in your meetings. It is an excellent way to make your presentations highly effective. So, download this PPT today from Slidegeeks and see the positive impacts. Our easy to edit Recruitment Funnel Dashboard Indicating Multiple Stages Of Hiring Ideas PDF can be your go to option for all upcoming conferences and meetings. So, what are you waiting for Grab this template today.
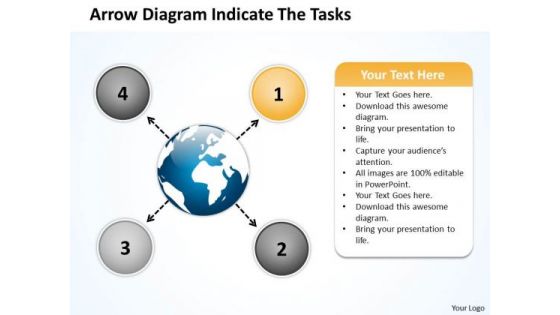
Arrow Diagram Indicate The Tasks Ppt Circular Flow Layout Process PowerPoint Slide
We present our arrow diagram indicate the tasks ppt Circular Flow Layout Process PowerPoint Slide.Download our Process and Flows PowerPoint Templates because the vision of being the market leader is clear to you. Download our Arrows PowerPoint Templates because this is a good example of the strength of teamwork. Use our Business PowerPoint Templates because this template helps you to delve on these thoughts and brief your team on the value of your depth of understanding of the subject. Download and present our Circle Charts PowerPoint Templates because the mind is always whirring with new ideas. Present our Flow Charts PowerPoint Templates because you know your business and have a vision for it.Use these PowerPoint slides for presentations relating to Arrows, choice, connect, design, direction, flows, four, info graph, instruction, layout, manual, marketing, modern, one, option, order, page, paper, pointing, process, product, promotion, sequence, simple, special, step, symbol. The prominent colors used in the PowerPoint template are Orange, Gray, Black. Presenters tell us our arrow diagram indicate the tasks ppt Circular Flow Layout Process PowerPoint Slide will help you be quick off the draw. Just enter your specific text and see your points hit home. Professionals tell us our design PowerPoint templates and PPT Slides are specially created by a professional team with vast experience. They diligently strive to come up with the right vehicle for your brilliant Ideas. PowerPoint presentation experts tell us our arrow diagram indicate the tasks ppt Circular Flow Layout Process PowerPoint Slide are Reminiscent. The feedback we get is that our direction PowerPoint templates and PPT Slides are effectively colour coded to prioritise your plans They automatically highlight the sequence of events you desire. Use our arrow diagram indicate the tasks ppt Circular Flow Layout Process PowerPoint Slide are Clever. Use our info PowerPoint templates and PPT Slides are Colorful. Get things going for you with our Arrow Diagram Indicate The Tasks Ppt Circular Flow Layout Process PowerPoint Slide. The audience will be in a favourable mood.
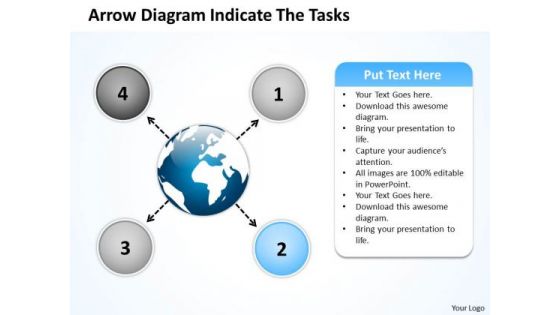
Arrow Diagram Indicate The Tasks Circular Flow Layout Process PowerPoint Slide
We present our arrow diagram indicate the tasks Circular Flow Layout Process PowerPoint Slide.Use our Process and Flows PowerPoint Templates because the atmosphere in the worplace is electric. Download and present our Arrows PowerPoint Templates because you know that the core of any organisation is the people who work for it. Use our Business PowerPoint Templates because the majestic tiger lord of all it surveys.It exudes power even when it is in repose. Download and present our Circle Charts PowerPoint Templates because you have a handle on all the targets, a master of the game, the experienced and consummate juggler. Download our Flow Charts PowerPoint Templates because this Layout can explain the relevance of the different layers and stages in getting down to your core competence, ability and desired result.Use these PowerPoint slides for presentations relating to Arrows, choice, connect, design, direction, flows, four, info graph, instruction, layout, manual, marketing, modern, one, option, order, page, paper, pointing, process, product, promotion, sequence, simple, special, step, symbol. The prominent colors used in the PowerPoint template are Blue light, Blue, Black. Presenters tell us our arrow diagram indicate the tasks Circular Flow Layout Process PowerPoint Slide are Stylish. Professionals tell us our info PowerPoint templates and PPT Slides are Fashionable. PowerPoint presentation experts tell us our arrow diagram indicate the tasks Circular Flow Layout Process PowerPoint Slide will make the presenter look like a pro even if they are not computer savvy. The feedback we get is that our connect PowerPoint templates and PPT Slides are Fashionable. Use our arrow diagram indicate the tasks Circular Flow Layout Process PowerPoint Slide are Zippy. Use our four PowerPoint templates and PPT Slides are Royal. Be a proactive manager with our Arrow Diagram Indicate The Tasks Circular Flow Layout Process PowerPoint Slide. They will make you look good.
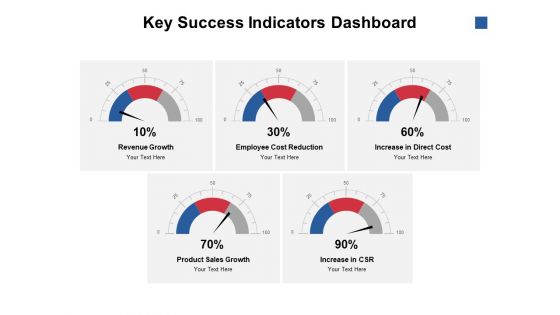
Key Success Indicators Dashboard Ppt PowerPoint Presentation Show Styles
Presenting this set of slides with name key success indicators dashboard ppt powerpoint presentation show styles. The topics discussed in these slides are revenue growth, employee cost reduction, increase in direct cost, product sales growth, increase in csr. This is a completely editable PowerPoint presentation and is available for immediate download. Download now and impress your audience.
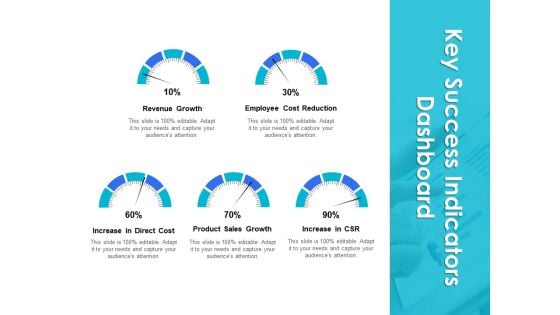
Key Success Indicators Dashboard Ppt PowerPoint Presentation Infographics Slide Portrait
Presenting this set of slides with name key success indicators dashboard ppt powerpoint presentation infographics slide portrait. The topics discussed in these slides are revenue growth, employee cost reduction, increase in direct cost, product sales growth, increase in csr. This is a completely editable PowerPoint presentation and is available for immediate download. Download now and impress your audience.
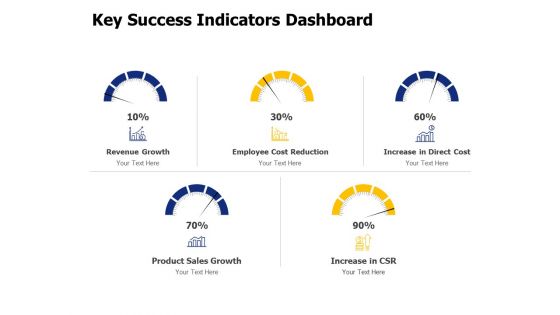
Key Success Indicators Dashboard Ppt PowerPoint Presentation Pictures Example Topics
Presenting this set of slides with name key success indicators dashboard ppt powerpoint presentation pictures example topics. The topics discussed in these slides are revenue growth, employee cost reduction, increase in direct cost, product sales growth, increase csr. This is a completely editable PowerPoint presentation and is available for immediate download. Download now and impress your audience.
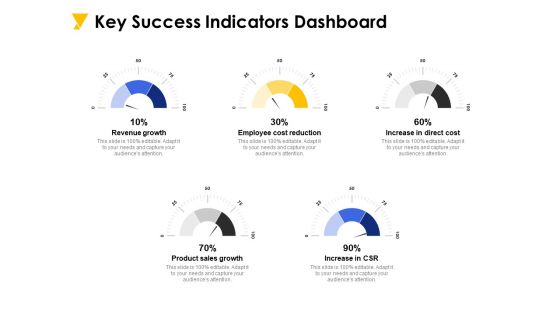
Key Success Indicators Dashboard Ppt PowerPoint Presentation Infographic Template Portfolio
Presenting this set of slides with name key success indicators dashboard ppt powerpoint presentation infographic template portfolio. The topics discussed in these slides are revenue growth, employee cost reduction, increase in direct cost, product sales growth, increase csr. This is a completely editable PowerPoint presentation and is available for immediate download. Download now and impress your audience.
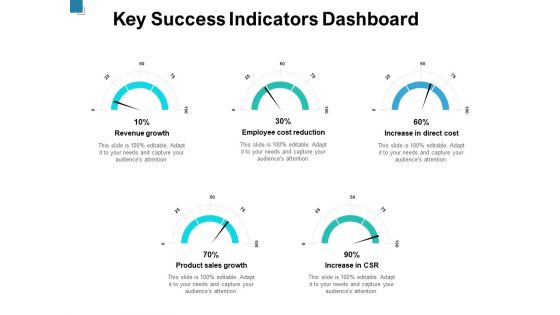
Key Success Indicators Dashboard Ppt PowerPoint Presentation File Backgrounds
Presenting this set of slides with name key success indicators dashboard ppt powerpoint presentation file backgrounds. The topics discussed in these slides are revenue growth, employee cost reduction, increase in direct cost, product sales growth, increase csr. This is a completely editable PowerPoint presentation and is available for immediate download. Download now and impress your audience.
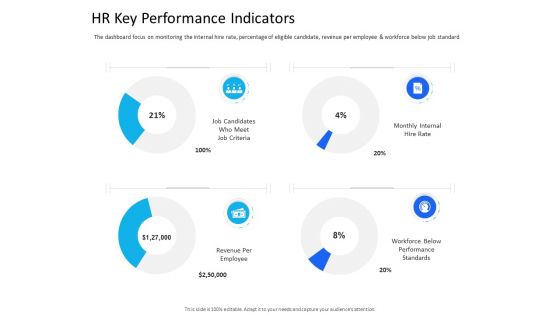
Organization Manpower Management Technology HR Key Performance Indicators Graphics PDF
Deliver an awe inspiring pitch with this creative organization manpower management technology hr key performance indicators graphics pdf bundle. Topics like criteria, workforce, performance, revenue, internal can be discussed with this completely editable template. It is available for immediate download depending on the needs and requirements of the user.
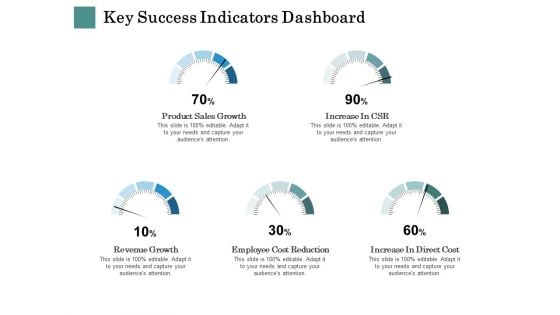
Business Strategies Key Success Indicators Dashboard Ppt Backgrounds PDF
Deliver an awe inspiring pitch with this creative business strategies key success indicators dashboard ppt backgrounds pdf bundle. Topics like revenue, growth, sales, cost, reduction can be discussed with this completely editable template. It is available for immediate download depending on the needs and requirements of the user.
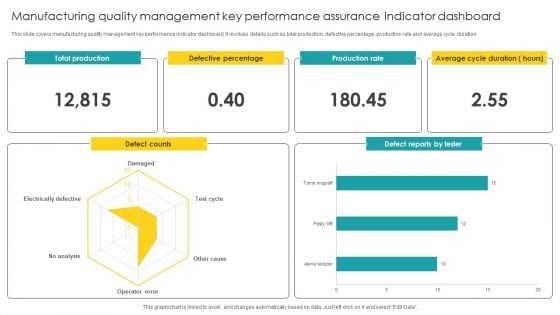
Manufacturing Quality Management Key Performance Assurance Indicator Dashboard Microsoft PDF
Pitch your topic with ease and precision using this Manufacturing Quality Management Key Performance Assurance Indicator Dashboard Microsoft PDF. This layout presents information on Quality Management, Key Performance Assurance. It is also available for immediate download and adjustment. So, changes can be made in the color, design, graphics or any other component to create a unique layout.
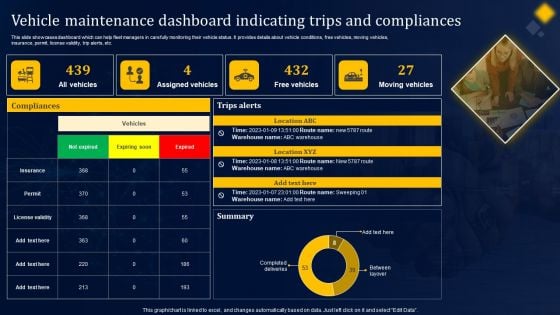
Vehicle Maintenance Dashboard Indicating Trips And Compliances Structure PDF
This slide showcases dashboard which can help fleet managers in carefully monitoring their vehicle status. It provides details about vehicle conditions, free vehicles, moving vehicles, insurance, permit, license validity, trip alerts, etc. Here you can discover an assortment of the finest PowerPoint and Google Slides templates. With these templates, you can create presentations for a variety of purposes while simultaneously providing your audience with an eye-catching visual experience. Download Vehicle Maintenance Dashboard Indicating Trips And Compliances Structure PDF to deliver an impeccable presentation. These templates will make your job of preparing presentations much quicker, yet still, maintain a high level of quality. Slidegeeks has experienced researchers who prepare these templates and write high-quality content for you. Later on, you can personalize the content by editing the Vehicle Maintenance Dashboard Indicating Trips And Compliances Structure PDF.
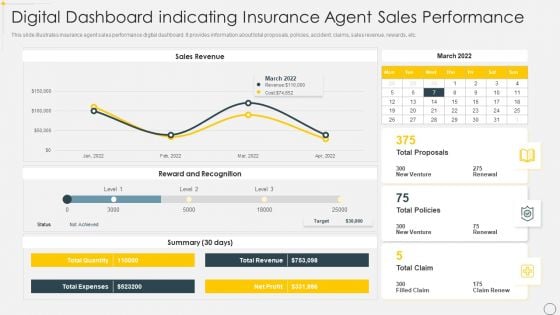
Digital Dashboard Indicating Insurance Agent Sales Performance Portrait PDF
This slide illustrates insurance agent sales performance digital dashboard. It provides information about total proposals, policies, accident, claims, sales revenue, rewards, etc. Pitch your topic with ease and precision using this Digital Dashboard Indicating Insurance Agent Sales Performance Portrait PDF. This layout presents information on Sales Revenue, Reward And Recognition. It is also available for immediate download and adjustment. So, changes can be made in the color, design, graphics or any other component to create a unique layout.
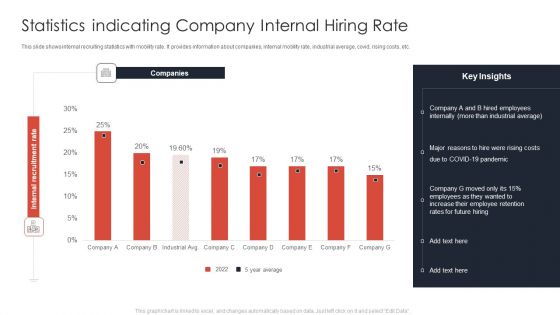
Statistics Indicating Company Internal Hiring Rate Ppt Ideas Templates PDF
This slide shows internal recruiting statistics with mobility rate. It provides information about companies, internal mobility rate, industrial average, covid, rising costs, etc. Showcasing this set of slides titled Statistics Indicating Company Internal Hiring Rate Ppt Ideas Templates PDF. The topics addressed in these templates are Companies, Employees Internally, COVID 19 Pandemic. All the content presented in this PPT design is completely editable. Download it and make adjustments in color, background, font etc. as per your unique business setting.
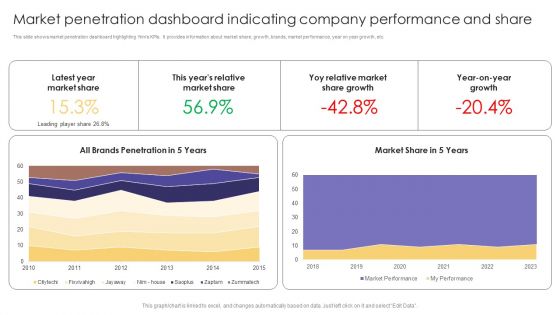
Market Penetration Dashboard Indicating Company Performance And Share Formats PDF
This slide shows market penetration dashboard highlighting firms KPIs. It provides information about market share, growth, brands, market performance, year on year growth, etc. Showcasing this set of slides titled Market Penetration Dashboard Indicating Company Performance And Share Formats PDF. The topics addressed in these templates are Latest Year, Market Share, Market Share Growth. All the content presented in this PPT design is completely editable. Download it and make adjustments in color, background, font etc. as per your unique business setting.
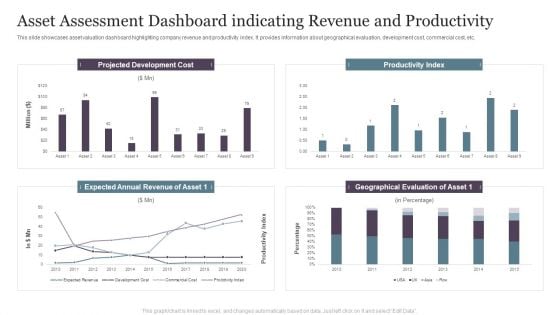
Asset Assessment Dashboard Indicating Revenue And Productivity Infographics PDF
This slide showcases asset valuation dashboard highlighting company revenue and productivity index. It provides information about geographical evaluation, development cost, commercial cost, etc.Pitch your topic with ease and precision using this Asset Assessment Dashboard Indicating Revenue And Productivity Infographics PDF. This layout presents information on Projected Development, Productivity Index, Geographical Evaluation. It is also available for immediate download and adjustment. So, changes can be made in the color, design, graphics or any other component to create a unique layout.
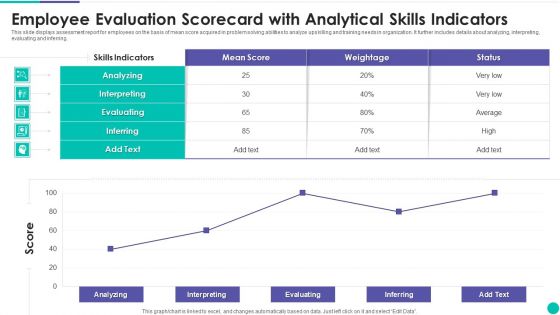
Employee Evaluation Scorecard With Analytical Skills Indicators Clipart PDF
This slide displays assessment report for employees on the basis of mean score acquired in problem solving abilities to analyze upskilling and training needs in organization. It further includes details about analyzing, interpreting, evaluating and inferring. Pitch your topic with ease and precision using this Employee Evaluation Scorecard With Analytical Skills Indicators Clipart PDF. This layout presents information on Analyzing, Interpreting, Evaluating. It is also available for immediate download and adjustment. So, changes can be made in the color, design, graphics or any other component to create a unique layout.
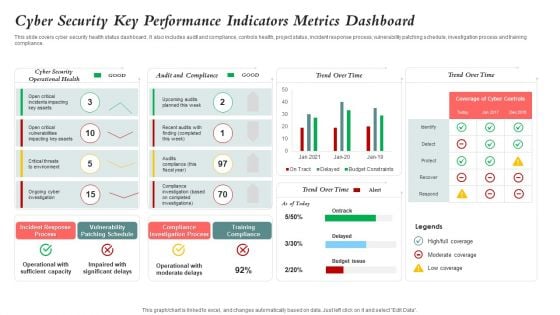
Cyber Security Key Performance Indicators Metrics Dashboard Mockup PDF
This slide covers cyber security health status dashboard . It also includes audit and compliance, controls health, project status, incident response process, vulnerability patching schedule, investigation process and training compliance. Pitch your topic with ease and precision using this Cyber Security Key Performance Indicators Metrics Dashboard Mockup PDF. This layout presents information on Cyber Security, Vulnerability Patching Schedule, Compliance Investigation Process. It is also available for immediate download and adjustment. So, changes can be made in the color, design, graphics or any other component to create a unique layout.
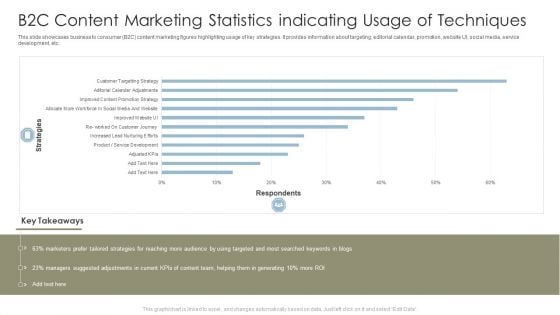
B2C Content Marketing Statistics Indicating Usage Of Techniques Sample PDF
This slide showcases business to consumer B2C content marketing figures highlighting usage of key strategies. It provides information about targeting, editorial calendar, promotion, website UI, social media, service development, etc. Pitch your topic with ease and precision using this B2C Content Marketing Statistics Indicating Usage Of Techniques Sample PDF. This layout presents information on Strategies, Marketers, Content Team. It is also available for immediate download and adjustment. So, changes can be made in the color, design, graphics or any other component to create a unique layout.
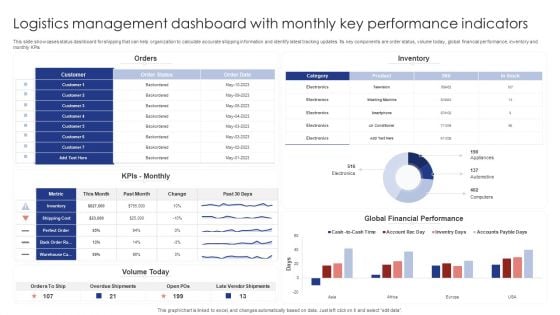
Logistics Management Dashboard With Monthly Key Performance Indicators Rules PDF
This slide showcases status dashboard for shipping that can help organization to calculate accurate shipping information and identify latest tracking updates. Its key components are order status, volume today, global financial performance, inventory and monthly KPIs. Pitch your topic with ease and precision using this Logistics Management Dashboard With Monthly Key Performance Indicators Rules PDF. This layout presents information on Orders, Inventory, Kpis Monthly. It is also available for immediate download and adjustment. So, changes can be made in the color, design, graphics or any other component to create a unique layout.
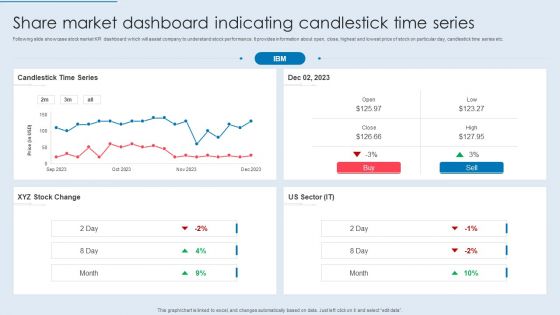
Share Market Dashboard Indicating Candlestick Time Series Formats PDF
Following slide showcase stock market KPI dashboard which will assist company to understand stock performance. It provides information about open, close, highest and lowest price of stock on particular day, candlestick time series etc. Pitch your topic with ease and precision using this Share Market Dashboard Indicating Candlestick Time Series Formats PDF. This layout presents information on Candlestick Time Series, Stock Change, US Sector. It is also available for immediate download and adjustment. So, changes can be made in the color, design, graphics or any other component to create a unique layout.

Data Mining Flowchart Indicating Customer Profiling Ppt Gallery Styles PDF
This slide showcase flowchart indicating customer profiling by using data mining which can assist companies in gathering reliable data to streamline the process of profiling. It contains details about individual data, regulations, professional, verification, mechanist, cancelled, approved and so on. Presenting Data Mining Flowchart Indicating Customer Profiling Ppt Gallery Styles PDF to dispense important information. This template comprises two stages. It also presents valuable insights into the topics including Cancelled Regulations, All Regulations, Approved Regulations. This is a completely customizable PowerPoint theme that can be put to use immediately. So, download it and address the topic impactfully.
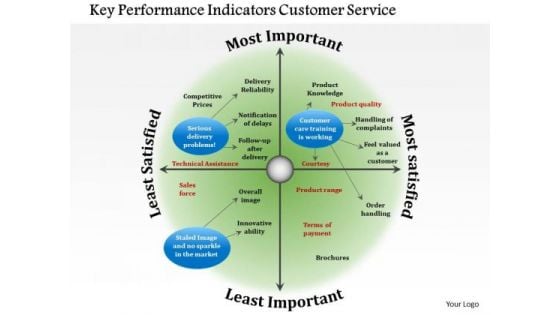
Business Framework Key Performance Indicators Customer Service PowerPoint Presentation
Our above diagram provides framework of key performance indicators for customer service. It contains circular diagram in four segments depicting concepts of delivery problems, customer care training. Download this diagram to make professional presentations on customer service.
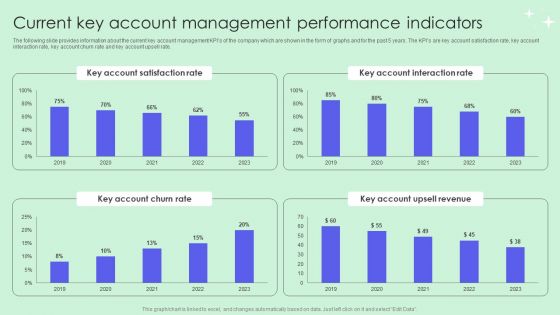
Current Key Account Management Performance Indicators Pictures PDF
The following slide provides information about the current key account management KPIs of the company which are shown in the form of graphs and for the past 5 years. The KPIs are key account satisfaction rate, key account interaction rate, key account churn rate and key account upsell rate. Are you in need of a template that can accommodate all of your creative concepts This one is crafted professionally and can be altered to fit any style. Use it with Google Slides or PowerPoint. Include striking photographs, symbols, depictions, and other visuals. Fill, move around, or remove text boxes as desired. Test out color palettes and font mixtures. Edit and save your work, or work with colleagues. Download Current Key Account Management Performance Indicators Pictures PDF and observe how to make your presentation outstanding. Give an impeccable presentation to your group and make your presentation unforgettable.
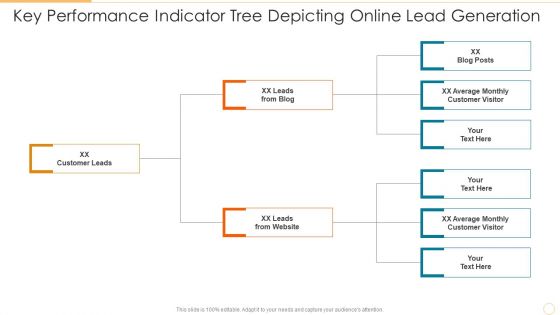
Key Performance Indicator Tree Depicting Online Lead Generation Information PDF
Persuade your audience using this key performance indicator tree depicting online lead generation information pdf. This PPT design covers three stages, thus making it a great tool to use. It also caters to a variety of topics including customer leads, leads from blog, leads from website. Download this PPT design now to present a convincing pitch that not only emphasizes the topic but also showcases your presentation skills.
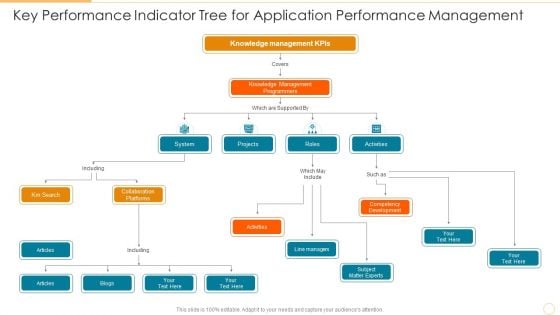
Key Performance Indicator Tree For Application Performance Management Background PDF
Persuade your audience using this key performance indicator tree for application performance management background pdf. This PPT design covers six stages, thus making it a great tool to use. It also caters to a variety of topics including collaboration platforms, competency development, knowledge management programmers. Download this PPT design now to present a convincing pitch that not only emphasizes the topic but also showcases your presentation skills.

 Home
Home