Meter Icon
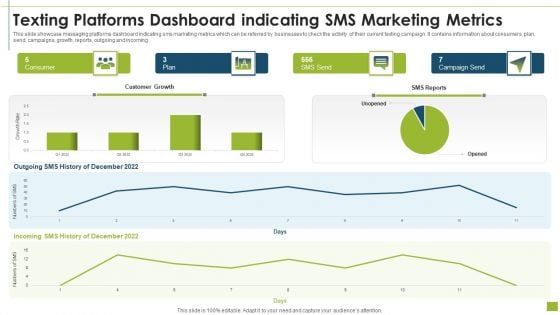
Texting Platforms Dashboard Indicating SMS Marketing Metrics Designs PDF
This slide showcase messaging platforms dashboard indicating sms marketing metrics which can be referred by businesses to check the activity of their current texting campaign. It contains information about consumers, plan, send, campaigns, growth, reports, outgoing and incoming.Pitch your topic with ease and precision using this texting platforms dashboard indicating sms marketing metrics designs pdf This layout presents information on texting platforms dashboard indicating sms marketing metrics It is also available for immediate download and adjustment. So, changes can be made in the color, design, graphics or any other component to create a unique layout.
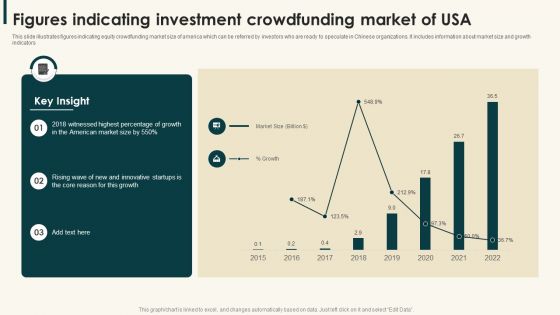
Figures Indicating Investment Crowdfunding Market Of Usa Information PDF
This slide illustrates figures indicating equity crowdfunding market size of america which can be referred by investors who are ready to speculate in Chinese organizations. It includes information about market size and growth indicators,Pitch your topic with ease and precision using this Figures Indicating Investment Crowdfunding Market Of Usa Information PDF. This layout presents information on Witnessed Highest, American Market, Innovative Startups. It is also available for immediate download and adjustment. So, changes can be made in the color, design, graphics or any other component to create a unique layout.
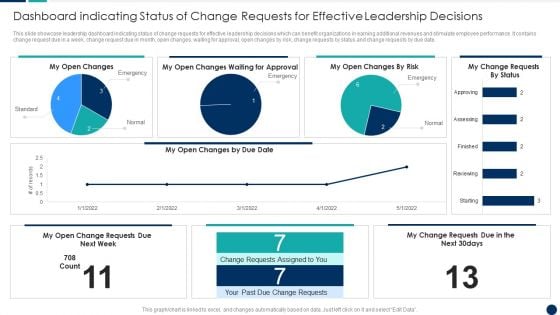
Dashboard Indicating Status Of Change Requests For Effective Leadership Decisions Themes PDF
This slide showcase leadership dashboard indicating status of change requests for effective leadership decisions which can benefit organizations in earning additional revenues and stimulate employee performance. It contains change request due in a week, change request due in month, open changes, waiting for approval, open changes by risk, change requests by status and change requests by due date.Showcasing this set of slides titled Dashboard Indicating Status Of Change Requests For Effective Leadership Decisions Themes PDF The topics addressed in these templates are Dashboard Indicating, Requests Effective, Leadership Decisions All the content presented in this PPT design is completely editable. Download it and make adjustments in color, background, font etc. as per your unique business setting.
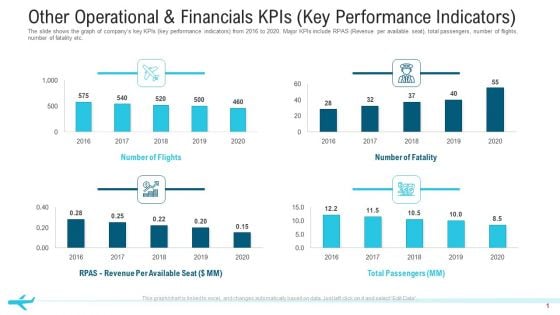
Other Operational And Financials Kpis Key Performance Indicators Structure PDF
The slide shows the graph of companys key KPIs key performance indicators from 2016 to 2020. Major KPIs include RPAS Revenue per available seat, total passengers, number of flights, number of fatality etc.Deliver an awe-inspiring pitch with this creative other operational and financials KPIs key performance indicators structure pdf. bundle. Topics like total passengers, number of flights,2016 to 2020 can be discussed with this completely editable template. It is available for immediate download depending on the needs and requirements of the user.
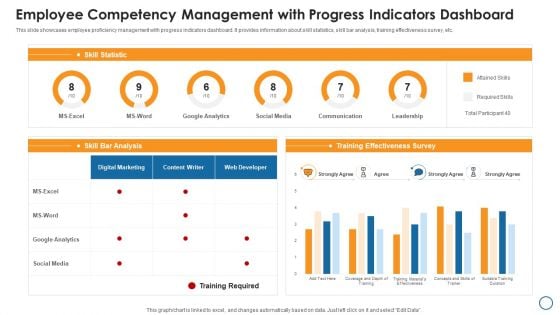
Employee Competency Management With Progress Indicators Dashboard Graphics PDF
This slide showcases employee proficiency management with progress indicators dashboard. It provides information about skill statistics, skill bar analysis, training effectiveness survey, etc. Showcasing this set of slides titled employee competency management with progress indicators dashboard graphics pdf. The topics addressed in these templates are google analytics, social media, survey. All the content presented in this PPT design is completely editable. Download it and make adjustments in color, background, font etc. as per your unique business setting.
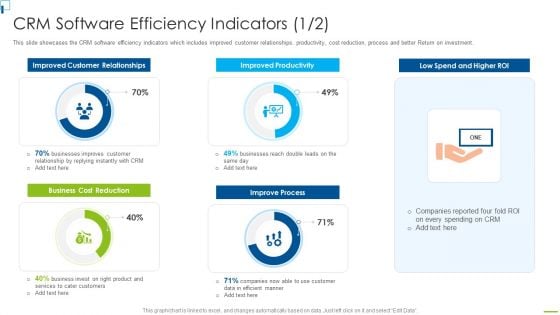
CRM Software Efficiency Indicators Designing And Deployment Elements PDF
This slide showcases the CRM software efficiency indicators which includes improved customer relationships, productivity, cost reduction, process and better Return on investment. Deliver an awe inspiring pitch with this creative crm software efficiency indicators designing and deployment elements pdf bundle. Topics like improved customer relationships, improved productivity, low spend and higher roi, business cost reduction, improve process can be discussed with this completely editable template. It is available for immediate download depending on the needs and requirements of the user.
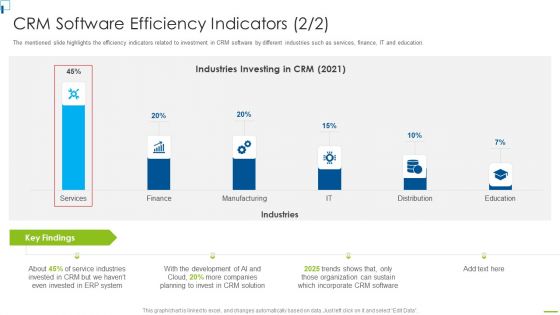
Designing And Deployment CRM Software Efficiency Indicators Portrait PDF
The mentioned slide highlights the efficiency indicators related to investment in CRM software by different industries such as services, finance, IT and education. Deliver an awe inspiring pitch with this creative designing and deployment crm software efficiency indicators portrait pdf bundle. Topics like industries investing in crm 2021, finance, services, education, manufacturing, it can be discussed with this completely editable template. It is available for immediate download depending on the needs and requirements of the user.
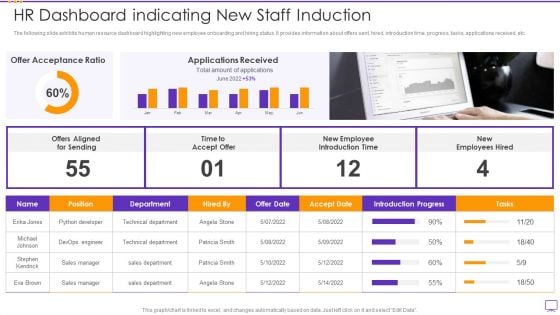
HR Dashboard Indicating New Staff Induction Portrait PDF
The following slide exhibits human resource dashboard highlighting new employee onboarding and hiring status. It provides information about offers sent, hired, introduction time, progress, tasks, applications received, etc. Showcasing this set of slides titled HR Dashboard Indicating New Staff Induction Portrait PDF. The topics addressed in these templates are HR Dashboard Indicating New Staff Induction. All the content presented in this PPT design is completely editable. Download it and make adjustments in color, background, font etc. as per your unique business setting.
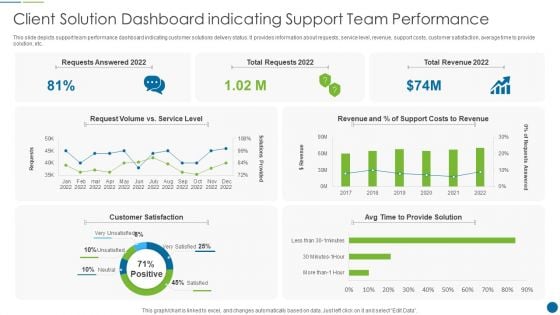
Client Solution Dashboard Indicating Support Team Performance Graphics PDF
This slide depicts support team performance dashboard indicating customer solutions delivery status. It provides information about requests, service level, revenue, support costs, customer satisfaction, average time to provide solution, etc. Showcasing this set of slides titled Client Solution Dashboard Indicating Support Team Performance Graphics PDF. The topics addressed in these templates are Costs, Revenue, Customer. All the content presented in this PPT design is completely editable. Download it and make adjustments in color, background, font etc. as per your unique business setting.
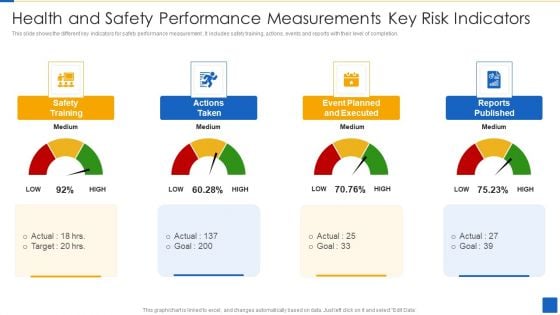
Health And Safety Performance Measurements Key Risk Indicators Download PDF
This slide shows the different key indicators for safety performance measurement . It includes safety training, actions, events and reports with their level of completion.Showcasing this set of slides titled Health And Safety Performance Measurements Key Risk Indicators Download PDF The topics addressed in these templates are Safety Training, Actions Taken, Event Planned Executed All the content presented in this PPT design is completely editable. Download it and make adjustments in color, background, font etc. as per your unique business setting.
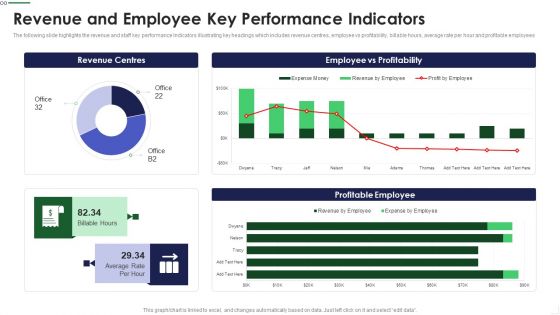
Revenue And Employee Key Performance Indicators Background PDF
The following slide highlights the revenue and staff key performance Indicators illustrating key headings which includes revenue centres, employee vs profitability, billable hours, average rate per hour and profitable employees Deliver an awe inspiring pitch with this creative Revenue And Employee Key Performance Indicators Background PDF bundle. Topics like Revenue Centres, Employee Profitability, Profitable Employee can be discussed with this completely editable template. It is available for immediate download depending on the needs and requirements of the user.
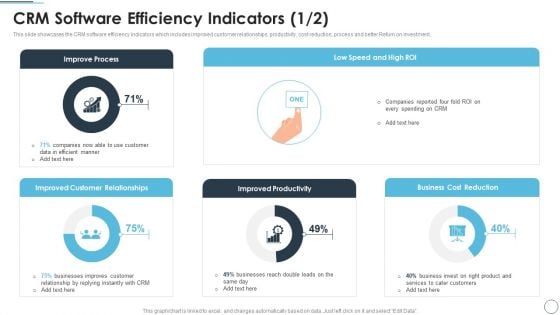
CRM Solutions Implementation Strategy CRM Software Efficiency Indicators Ideas PDF
This slide showcases the CRM software efficiency indicators which includes improved customer relationships, productivity, cost reduction, process and better Return on investment.Deliver and pitch your topic in the best possible manner with this CRM Solutions Implementation Strategy CRM Software Efficiency Indicators Ideas PDF Use them to share invaluable insights on Improve Process, Improved Customer, Improved Productivity and impress your audience. This template can be altered and modified as per your expectations. So, grab it now.
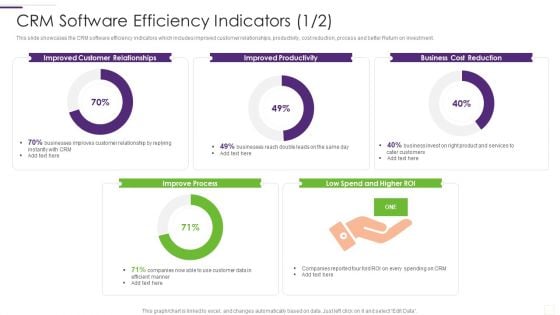
CRM Implementation Strategy CRM Software Efficiency Indicators Clipart PDF
This slide showcases the CRM software efficiency indicators which includes improved customer relationships, productivity, cost reduction, process and better Return on investment.Deliver and pitch your topic in the best possible manner with this CRM Implementation Strategy CRM Software Efficiency Indicators Clipart PDF Use them to share invaluable insights on Customer Relationships, Improved Productivity, Cost Reduction and impress your audience. This template can be altered and modified as per your expectations. So, grab it now.
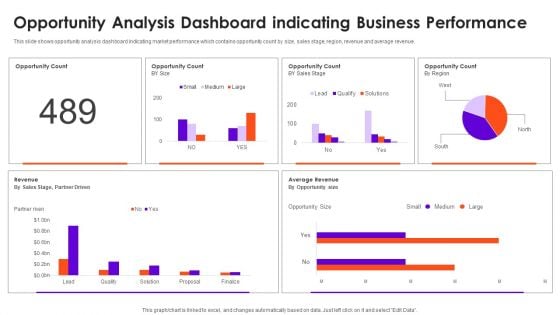
Opportunity Analysis Dashboard Indicating Business Performance Information Rules PDF
This slide shows opportunity analysis dashboard indicating market performance which contains opportunity count by size, sales stage, region, revenue and average revenue. Pitch your topic with ease and precision using this Opportunity Analysis Dashboard Indicating Business Performance Information Rules PDF. This layout presents information on Opportunity Count, Revenue, Sales. It is also available for immediate download and adjustment. So, changes can be made in the color, design, graphics or any other component to create a unique layout.
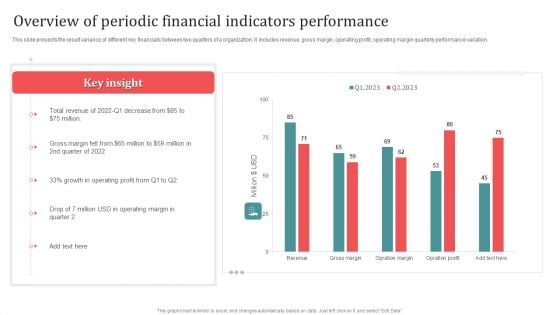
Overview Of Periodic Financial Indicators Performance Designs PDF
This slide presents the result variance of different key financials between two quarters of a organization. It includes revenue, gross margin, operating profit, operating margin quarterly performance variation. Showcasing this set of slides titled Overview Of Periodic Financial Indicators Performance Designs PDF. The topics addressed in these templates are Overview Of Periodic, Financial Indicators Performance. All the content presented in this PPT design is completely editable. Download it and make adjustments in color, background, font etc. as per your unique business setting.
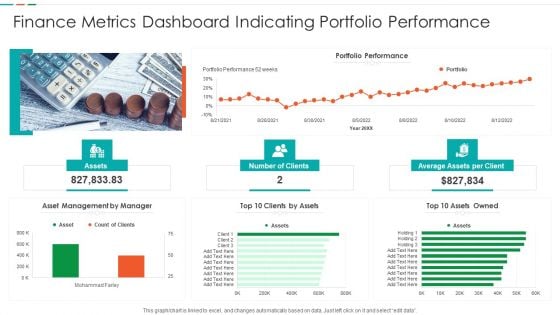
Finance Metrics Dashboard Indicating Portfolio Performance Microsoft PDF
This graph or chart is linked to excel, and changes automatically based on data. Just left click on it and select edit data. Pitch your topic with ease and precision using this Finance Metrics Dashboard Indicating Portfolio Performance Microsoft PDF. This layout presents information on Portfolio Performance Portfolio, Asset Management Manager, Top 10 Assets. It is also available for immediate download and adjustment. So, changes can be made in the color, design, graphics or any other component to create a unique layout.
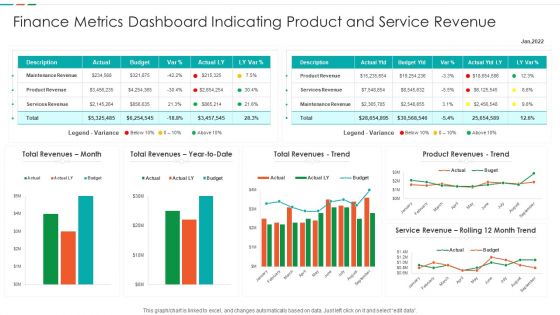
Finance Metrics Dashboard Indicating Product And Service Revenue Designs PDF
This graph or chart is linked to excel, and changes automatically based on data. Just left click on it and select edit data. Showcasing this set of slides titled Finance Metrics Dashboard Indicating Product And Service Revenue Designs PDF. The topics addressed in these templates are Maintenance Revenue Product, Revenue Product Revenues, Service Revenue Rolling. All the content presented in this PPT design is completely editable. Download it and make adjustments in color, background, font etc. as per your unique business setting.
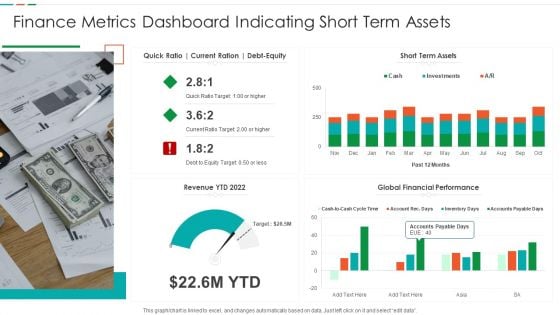
Finance Metrics Dashboard Indicating Short Term Assets Download PDF
This graph or chart is linked to excel, and changes automatically based on data. Just left click on it and select edit data. Pitch your topic with ease and precision using this Finance Metrics Dashboard Indicating Short Term Assets Download PDF. This layout presents information on Short Term Assets, Global Financial Performance, Revenue YTD 2022. It is also available for immediate download and adjustment. So, changes can be made in the color, design, graphics or any other component to create a unique layout.
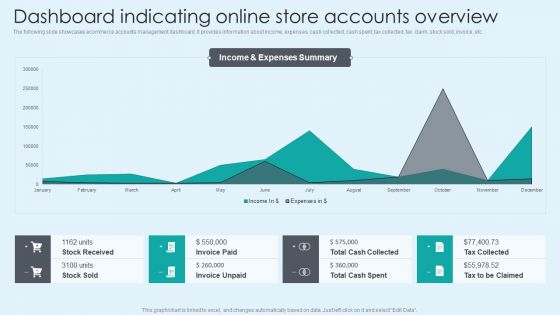
Dashboard Indicating Online Store Accounts Overview Introduction PDF
The following slide showcases ecommerce accounts management dashboard. It provides information about income, expenses, cash collected, cash spent, tax collected, tax claim, stock sold, invoice, etc. Presenting this PowerPoint presentation, titled Dashboard Indicating Online Store Accounts Overview Introduction PDF, with topics curated by our researchers after extensive research. This editable presentation is available for immediate download and provides attractive features when used. Download now and captivate your audience. Presenting this Dashboard Indicating Online Store Accounts Overview Introduction PDF. Our researchers have carefully researched and created these slides with all aspects taken into consideration. This is a completely customizable Dashboard Indicating Online Store Accounts Overview Introduction PDF that is available for immediate downloading. Download now and make an impact on your audience. Highlight the attractive features available with our PPTs.
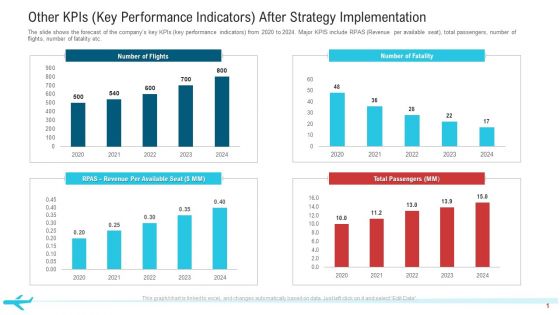
Other Kpis Key Performance Indicators After Strategy Implementation Professional PDF
The slide shows the forecast of the companys key KPIs key performance indicators from 2020 to 2024. Major KPIS include RPAS Revenue per available seat, total passengers, number of flights, number of fatality etc.Deliver and pitch your topic in the best possible manner with this other KPIs key performance indicators after strategy implementation professional pdf. Use them to share invaluable insights on total passengers, number of flights, 2020 to 2024 and impress your audience. This template can be altered and modified as per your expectations. So, grab it now.
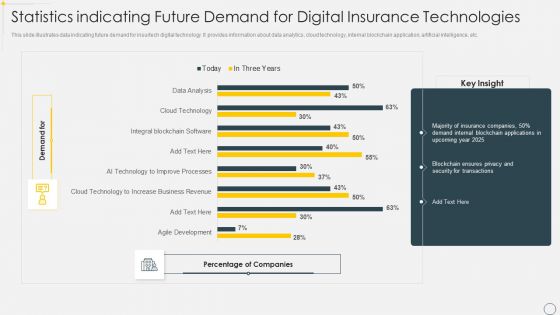
Statistics Indicating Future Demand For Digital Insurance Technologies Brochure PDF
This slide illustrates data indicating future demand for insurtech digital technology. It provides information about data analytics, cloud technology, internal blockchain application, artificial intelligence, etc. Pitch your topic with ease and precision using this Statistics Indicating Future Demand For Digital Insurance Technologies Brochure PDF. This layout presents information on Data Analytics, Cloud Technology, Internal Blockchain Application. It is also available for immediate download and adjustment. So, changes can be made in the color, design, graphics or any other component to create a unique layout.
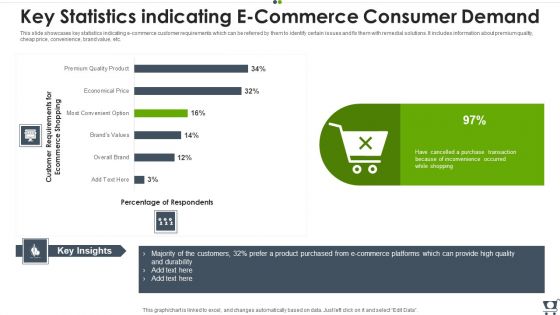
Key Statistics Indicating E Commerce Consumer Demand Professional PDF
This slide showcases key statistics indicating e commerce customer requirements which can be referred by them to identify certain issues and fix them with remedial solutions. It includes information about premium quality, cheap price, convenience, brand value, etc. Showcasing this set of slides titled Key Statistics Indicating E Commerce Consumer Demand Professional PDF. The topics addressed in these templates are E Commerce, Purchased, Product. All the content presented in this PPT design is completely editable. Download it and make adjustments in color, background, font etc. as per your unique business setting.
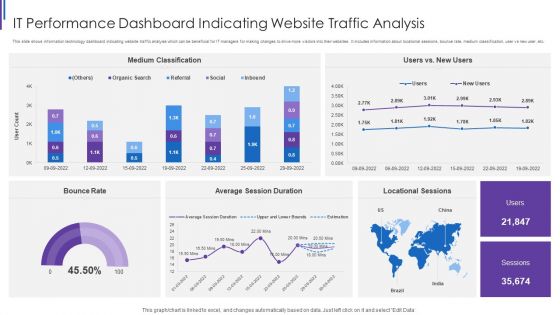
IT Performance Dashboard Indicating Website Traffic Analysis Background PDF
This slide shows information technology dashboard indicating website traffic analysis which can be beneficial for IT managers for making changes to drive more visitors into their websites. It includes information about locational sessions, bounce rate, medium classification, user vs new user, etc. Pitch your topic with ease and precision using this IT Performance Dashboard Indicating Website Traffic Analysis Background PDF. This layout presents information on Medium Classification Rate, Average Session Duration, Locational Sessions Bounce. It is also available for immediate download and adjustment. So, changes can be made in the color, design, graphics or any other component to create a unique layout.
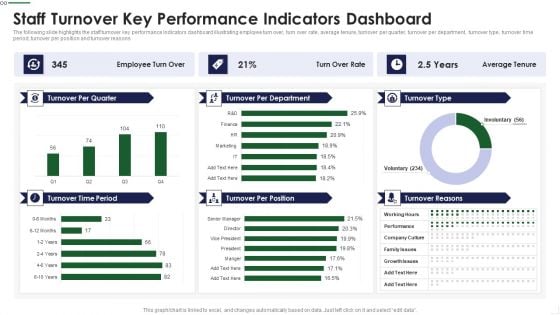
Staff Turnover Key Performance Indicators Dashboard Sample PDF
The following slide highlights the staff turnover key performance Indicators dashboard illustrating employee turn over, turn over rate, average tenure, turnover per quarter, turnover per department, turnover type, turnover time period, turnover per position and turnover reasons Deliver and pitch your topic in the best possible manner with this Staff Turnover Key Performance Indicators Dashboard Sample PDF Use them to share invaluable insights on Management Goals, Subjective Appraisal, Product Defects and impress your audience. This template can be altered and modified as per your expectations. So, grab it now.
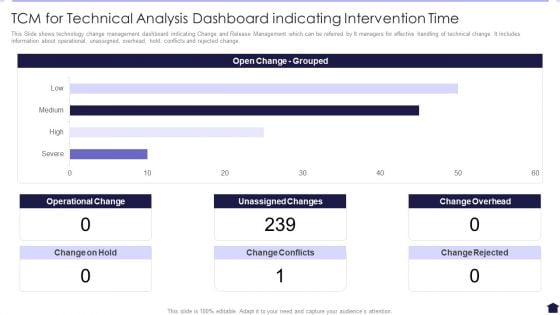
TCM For Technical Analysis Dashboard Indicating Intervention Time Background PDF
This Slide shows technology change management dashboard indicating Change and Release Management which can be referred by It managers for effective handling of technical change. It includes information about operational, unassigned, overhead, hold, conflicts and rejected change. Showcasing this set of slides titled TCM For Technical Analysis Dashboard Indicating Intervention Time Background PDF. The topics addressed in these templates are Operational Change, Unassigned Changes, Change Overhead. All the content presented in this PPT design is completely editable. Download it and make adjustments in color, background, font etc. as per your unique business setting.
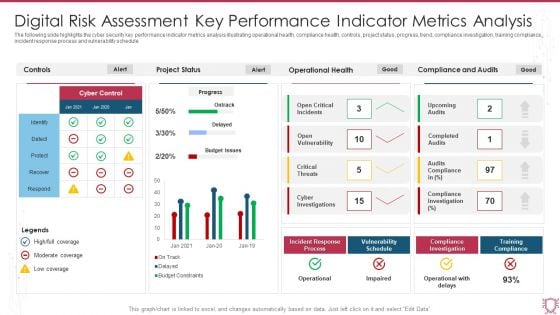
Digital Risk Assessment Key Performance Indicator Metrics Analysis Infographics PDF
The following slide highlights the cyber security key performance indicator metrics analysis illustrating operational health, compliance health, controls, project status, progress, trend, compliance investigation, training compliance, incident response process and vulnerability schedule. Showcasing this set of slides titled Digital Risk Assessment Key Performance Indicator Metrics Analysis Infographics PDF. The topics addressed in these templates are Project Status, Operational Health, Compliance And Audits. All the content presented in this PPT design is completely editable. Download it and make adjustments in color, background, font etc. as per your unique business setting.
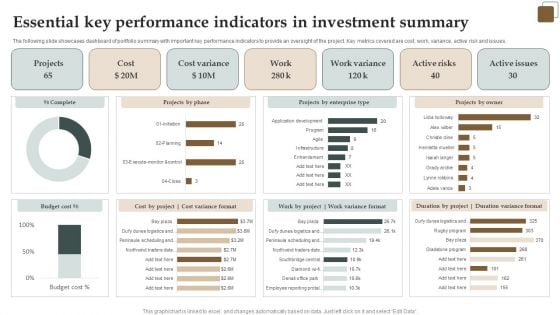
Essential Key Performance Indicators In Investment Summary Demonstration PDF
The following slide showcases dashboard of portfolio summary with important key performance indicators to provide an oversight of the project. Key metrics covered are cost, work, variance, active risk and issues. Showcasing this set of slides titled Essential Key Performance Indicators In Investment Summary Demonstration PDF. The topics addressed in these templates are Cost, Active Risks, Projects. All the content presented in this PPT design is completely editable. Download it and make adjustments in color, background, font etc. as per your unique business setting.
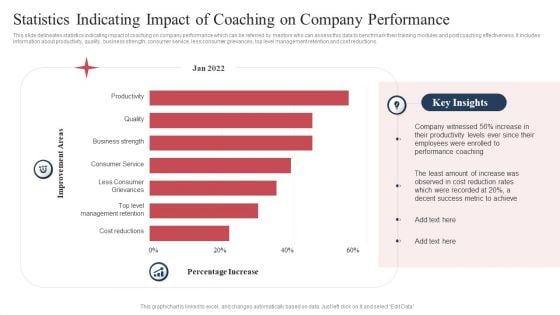
Statistics Indicating Impact Of Coaching On Company Performance Formats PDF
This slide delineates statistics indicating impact of coaching on company performance which can be referred by mentors who can assess this data to benchmark their training modules and post coaching effectiveness. It includes information about productivity, quality, business strength, consumer service, less consumer grievances, top level management retention and cost reductions. Pitch your topic with ease and precision using this Statistics Indicating Impact Of Coaching On Company Performance Formats PDF. This layout presents information on Productivity, Quality, Business Strength. It is also available for immediate download and adjustment. So, changes can be made in the color, design, graphics or any other component to create a unique layout.
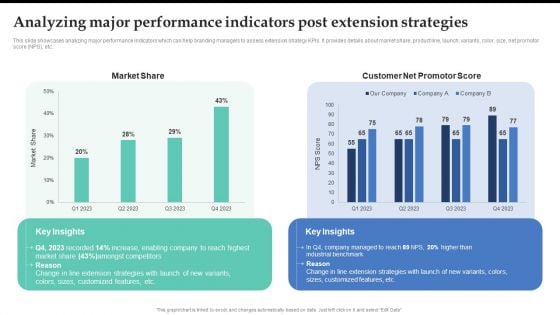
Analyzing Major Performance Indicators Post Extension Strategies Topics PDF
This slide showcases analyzing major performance indicators which can help branding managers to assess extension strategy KPIs. It provides details about market share, product line, launch, variants, color, size, net promotor score NPS, etc. From laying roadmaps to briefing everything in detail, our templates are perfect for you. You can set the stage with your presentation slides. All you have to do is download these easy-to-edit and customizable templates. Analyzing Major Performance Indicators Post Extension Strategies Topics PDF will help you deliver an outstanding performance that everyone would remember and praise you for. Do download this presentation today.
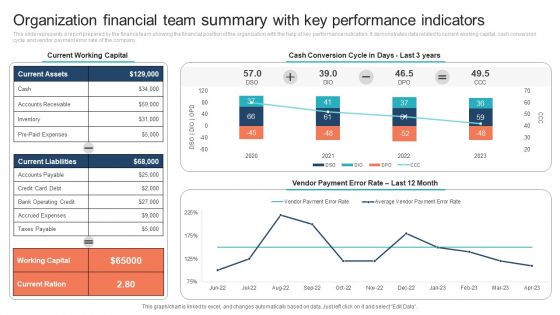
Organization Financial Team Summary With Key Performance Indicators Clipart PDF
This slide represents a report prepared by the finance team showing the financial position of the organization with the help of key performance indicators. It demonstrates data related to current working capital, cash conversion cycle and vendor payment error rate of the company. Pitch your topic with ease and precision using this Organization Financial Team Summary With Key Performance Indicators Clipart PDF. This layout presents information on Current Working Capital, Cash Conversion Cycle. It is also available for immediate download and adjustment. So, changes can be made in the color, design, graphics or any other component to create a unique layout.
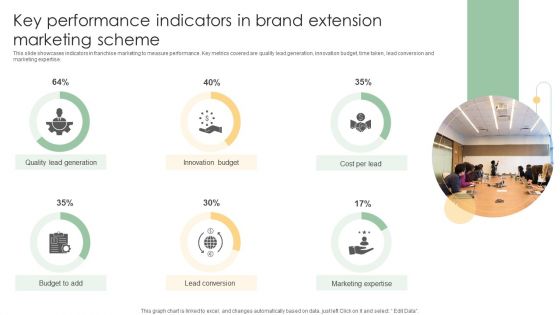
Key Performance Indicators In Brand Extension Marketing Scheme Ideas PDF
This slide showcases indicators in franchise marketing to measure performance. Key metrics covered are quality lead generation, innovation budget, time taken, lead conversion and marketing expertise.Pitch your topic with ease and precision using this Key Performance Indicators In Brand Extension Marketing Scheme Ideas PDF. This layout presents information on Quality Lead Generation, Innovation Budget, Lead Conversion. It is also available for immediate download and adjustment. So, changes can be made in the color, design, graphics or any other component to create a unique layout.
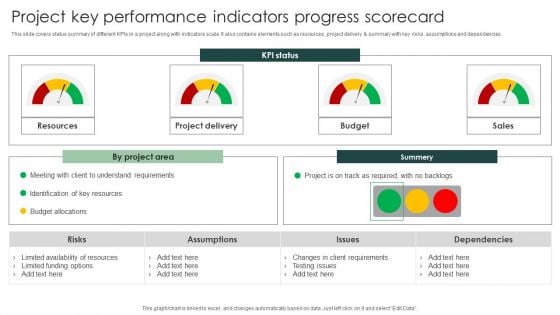
Project Key Performance Indicators Progress Scorecard Portrait PDF
This slide covers status summary of different KPIs in a project along with indicators scale. It also contains elements such as resources , project delivery summary with key risks, assumptions and dependencies.Pitch your topic with ease and precision using this Project Key Performance Indicators Progress Scorecard Portrait PDF. This layout presents information on Limited Availability Resources, Limited Funding Options, Key Resources . It is also available for immediate download and adjustment. So, changes can be made in the color, design, graphics or any other component to create a unique layout.
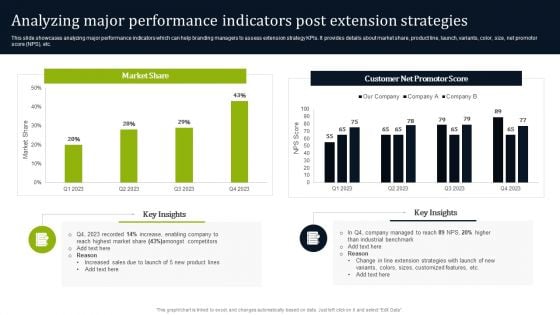
Analyzing Major Performance Indicators Post Extension Strategies Designs PDF
This slide showcases analyzing major performance indicators which can help branding managers to assess extension strategy KPIs. It provides details about market share, product line, launch, variants, color, size, net promotor score NPS, etc. Want to ace your presentation in front of a live audience Our Analyzing Major Performance Indicators Post Extension Strategies Designs PDF can help you do that by engaging all the users towards you. Slidegeeks experts have put their efforts and expertise into creating these impeccable powerpoint presentations so that you can communicate your ideas clearly. Moreover, all the templates are customizable, and easy-to-edit and downloadable. Use these for both personal and commercial use.

Call Center Process Key Performance Indicator Dashboard Mockup PDF
This slide showcases call center process measurements and key performance indicators so managers and teams can keep track of and improve performance . It includes received calls, calculating speed of answering calls , ended calls before starting conversations , average calls per minute etc. Showcasing this set of slides titled Call Center Process Key Performance Indicator Dashboard Mockup PDF. The topics addressed in these templates are Received Calls, Conversation, Abandon Rate. All the content presented in this PPT design is completely editable. Download it and make adjustments in color, background, font etc. as per your unique business setting.
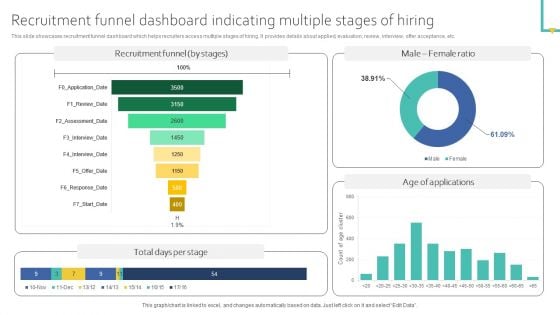
Recruitment Funnel Dashboard Indicating Multiple Stages Of Hiring Ideas PDF
This slide showcases recruitment funnel dashboard which helps recruiters access multiple stages of hiring. It provides details about applied, evaluation, review, interview, offer acceptance, etc. Get a simple yet stunning designed Recruitment Funnel Dashboard Indicating Multiple Stages Of Hiring Ideas PDF. It is the best one to establish the tone in your meetings. It is an excellent way to make your presentations highly effective. So, download this PPT today from Slidegeeks and see the positive impacts. Our easy to edit Recruitment Funnel Dashboard Indicating Multiple Stages Of Hiring Ideas PDF can be your go to option for all upcoming conferences and meetings. So, what are you waiting for Grab this template today.
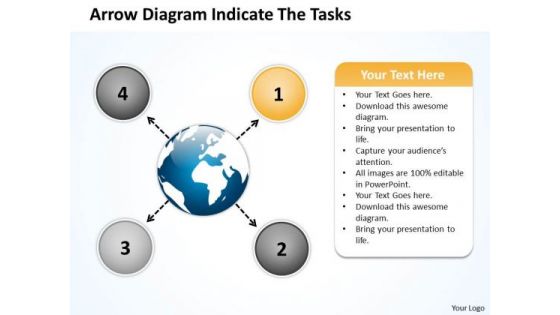
Arrow Diagram Indicate The Tasks Ppt Circular Flow Layout Process PowerPoint Slide
We present our arrow diagram indicate the tasks ppt Circular Flow Layout Process PowerPoint Slide.Download our Process and Flows PowerPoint Templates because the vision of being the market leader is clear to you. Download our Arrows PowerPoint Templates because this is a good example of the strength of teamwork. Use our Business PowerPoint Templates because this template helps you to delve on these thoughts and brief your team on the value of your depth of understanding of the subject. Download and present our Circle Charts PowerPoint Templates because the mind is always whirring with new ideas. Present our Flow Charts PowerPoint Templates because you know your business and have a vision for it.Use these PowerPoint slides for presentations relating to Arrows, choice, connect, design, direction, flows, four, info graph, instruction, layout, manual, marketing, modern, one, option, order, page, paper, pointing, process, product, promotion, sequence, simple, special, step, symbol. The prominent colors used in the PowerPoint template are Orange, Gray, Black. Presenters tell us our arrow diagram indicate the tasks ppt Circular Flow Layout Process PowerPoint Slide will help you be quick off the draw. Just enter your specific text and see your points hit home. Professionals tell us our design PowerPoint templates and PPT Slides are specially created by a professional team with vast experience. They diligently strive to come up with the right vehicle for your brilliant Ideas. PowerPoint presentation experts tell us our arrow diagram indicate the tasks ppt Circular Flow Layout Process PowerPoint Slide are Reminiscent. The feedback we get is that our direction PowerPoint templates and PPT Slides are effectively colour coded to prioritise your plans They automatically highlight the sequence of events you desire. Use our arrow diagram indicate the tasks ppt Circular Flow Layout Process PowerPoint Slide are Clever. Use our info PowerPoint templates and PPT Slides are Colorful. Get things going for you with our Arrow Diagram Indicate The Tasks Ppt Circular Flow Layout Process PowerPoint Slide. The audience will be in a favourable mood.
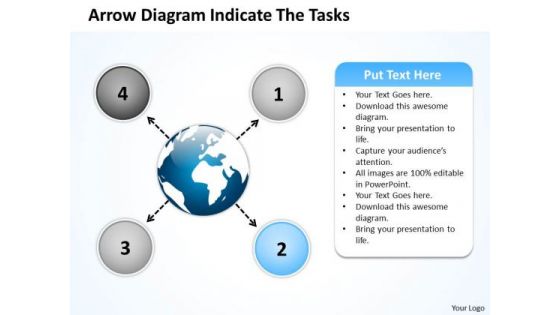
Arrow Diagram Indicate The Tasks Circular Flow Layout Process PowerPoint Slide
We present our arrow diagram indicate the tasks Circular Flow Layout Process PowerPoint Slide.Use our Process and Flows PowerPoint Templates because the atmosphere in the worplace is electric. Download and present our Arrows PowerPoint Templates because you know that the core of any organisation is the people who work for it. Use our Business PowerPoint Templates because the majestic tiger lord of all it surveys.It exudes power even when it is in repose. Download and present our Circle Charts PowerPoint Templates because you have a handle on all the targets, a master of the game, the experienced and consummate juggler. Download our Flow Charts PowerPoint Templates because this Layout can explain the relevance of the different layers and stages in getting down to your core competence, ability and desired result.Use these PowerPoint slides for presentations relating to Arrows, choice, connect, design, direction, flows, four, info graph, instruction, layout, manual, marketing, modern, one, option, order, page, paper, pointing, process, product, promotion, sequence, simple, special, step, symbol. The prominent colors used in the PowerPoint template are Blue light, Blue, Black. Presenters tell us our arrow diagram indicate the tasks Circular Flow Layout Process PowerPoint Slide are Stylish. Professionals tell us our info PowerPoint templates and PPT Slides are Fashionable. PowerPoint presentation experts tell us our arrow diagram indicate the tasks Circular Flow Layout Process PowerPoint Slide will make the presenter look like a pro even if they are not computer savvy. The feedback we get is that our connect PowerPoint templates and PPT Slides are Fashionable. Use our arrow diagram indicate the tasks Circular Flow Layout Process PowerPoint Slide are Zippy. Use our four PowerPoint templates and PPT Slides are Royal. Be a proactive manager with our Arrow Diagram Indicate The Tasks Circular Flow Layout Process PowerPoint Slide. They will make you look good.
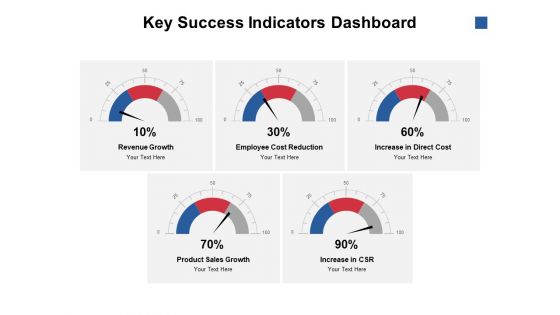
Key Success Indicators Dashboard Ppt PowerPoint Presentation Show Styles
Presenting this set of slides with name key success indicators dashboard ppt powerpoint presentation show styles. The topics discussed in these slides are revenue growth, employee cost reduction, increase in direct cost, product sales growth, increase in csr. This is a completely editable PowerPoint presentation and is available for immediate download. Download now and impress your audience.
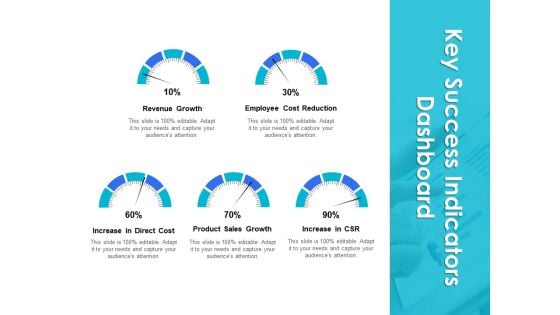
Key Success Indicators Dashboard Ppt PowerPoint Presentation Infographics Slide Portrait
Presenting this set of slides with name key success indicators dashboard ppt powerpoint presentation infographics slide portrait. The topics discussed in these slides are revenue growth, employee cost reduction, increase in direct cost, product sales growth, increase in csr. This is a completely editable PowerPoint presentation and is available for immediate download. Download now and impress your audience.
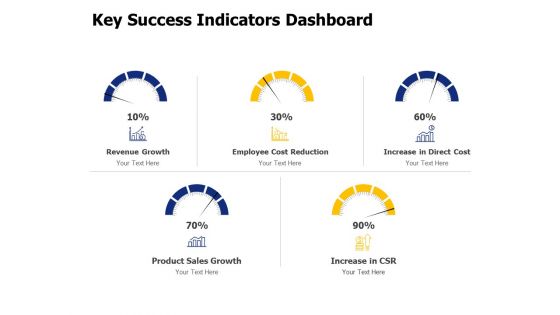
Key Success Indicators Dashboard Ppt PowerPoint Presentation Pictures Example Topics
Presenting this set of slides with name key success indicators dashboard ppt powerpoint presentation pictures example topics. The topics discussed in these slides are revenue growth, employee cost reduction, increase in direct cost, product sales growth, increase csr. This is a completely editable PowerPoint presentation and is available for immediate download. Download now and impress your audience.
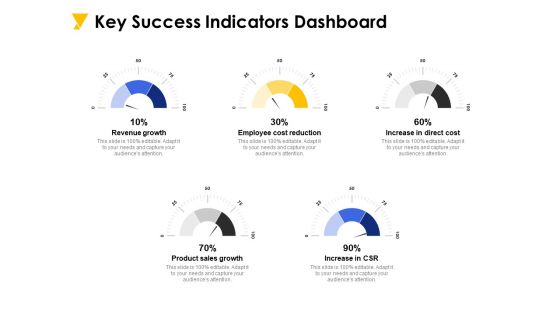
Key Success Indicators Dashboard Ppt PowerPoint Presentation Infographic Template Portfolio
Presenting this set of slides with name key success indicators dashboard ppt powerpoint presentation infographic template portfolio. The topics discussed in these slides are revenue growth, employee cost reduction, increase in direct cost, product sales growth, increase csr. This is a completely editable PowerPoint presentation and is available for immediate download. Download now and impress your audience.
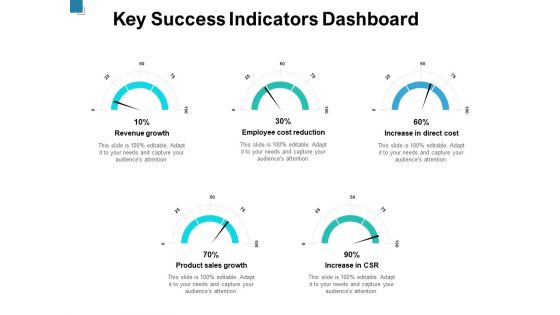
Key Success Indicators Dashboard Ppt PowerPoint Presentation File Backgrounds
Presenting this set of slides with name key success indicators dashboard ppt powerpoint presentation file backgrounds. The topics discussed in these slides are revenue growth, employee cost reduction, increase in direct cost, product sales growth, increase csr. This is a completely editable PowerPoint presentation and is available for immediate download. Download now and impress your audience.
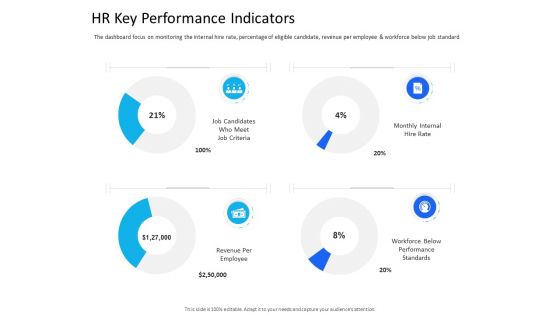
Organization Manpower Management Technology HR Key Performance Indicators Graphics PDF
Deliver an awe inspiring pitch with this creative organization manpower management technology hr key performance indicators graphics pdf bundle. Topics like criteria, workforce, performance, revenue, internal can be discussed with this completely editable template. It is available for immediate download depending on the needs and requirements of the user.
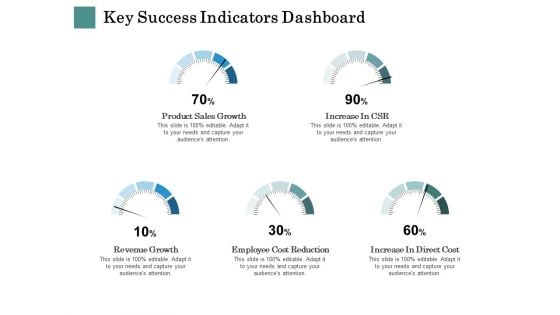
Business Strategies Key Success Indicators Dashboard Ppt Backgrounds PDF
Deliver an awe inspiring pitch with this creative business strategies key success indicators dashboard ppt backgrounds pdf bundle. Topics like revenue, growth, sales, cost, reduction can be discussed with this completely editable template. It is available for immediate download depending on the needs and requirements of the user.
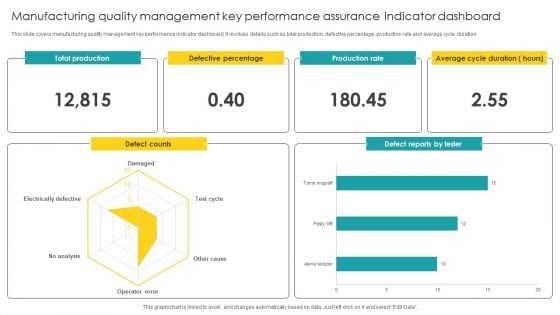
Manufacturing Quality Management Key Performance Assurance Indicator Dashboard Microsoft PDF
Pitch your topic with ease and precision using this Manufacturing Quality Management Key Performance Assurance Indicator Dashboard Microsoft PDF. This layout presents information on Quality Management, Key Performance Assurance. It is also available for immediate download and adjustment. So, changes can be made in the color, design, graphics or any other component to create a unique layout.
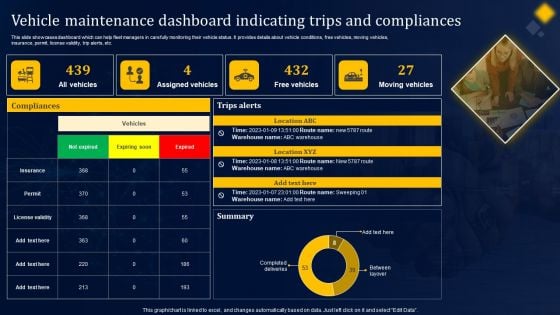
Vehicle Maintenance Dashboard Indicating Trips And Compliances Structure PDF
This slide showcases dashboard which can help fleet managers in carefully monitoring their vehicle status. It provides details about vehicle conditions, free vehicles, moving vehicles, insurance, permit, license validity, trip alerts, etc. Here you can discover an assortment of the finest PowerPoint and Google Slides templates. With these templates, you can create presentations for a variety of purposes while simultaneously providing your audience with an eye-catching visual experience. Download Vehicle Maintenance Dashboard Indicating Trips And Compliances Structure PDF to deliver an impeccable presentation. These templates will make your job of preparing presentations much quicker, yet still, maintain a high level of quality. Slidegeeks has experienced researchers who prepare these templates and write high-quality content for you. Later on, you can personalize the content by editing the Vehicle Maintenance Dashboard Indicating Trips And Compliances Structure PDF.
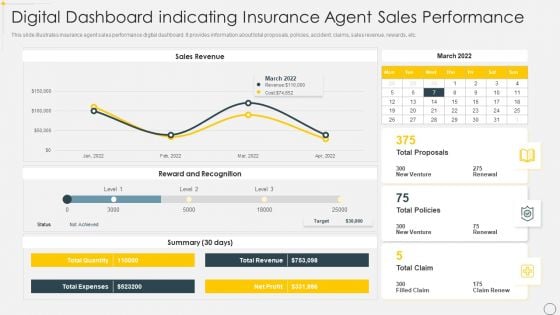
Digital Dashboard Indicating Insurance Agent Sales Performance Portrait PDF
This slide illustrates insurance agent sales performance digital dashboard. It provides information about total proposals, policies, accident, claims, sales revenue, rewards, etc. Pitch your topic with ease and precision using this Digital Dashboard Indicating Insurance Agent Sales Performance Portrait PDF. This layout presents information on Sales Revenue, Reward And Recognition. It is also available for immediate download and adjustment. So, changes can be made in the color, design, graphics or any other component to create a unique layout.
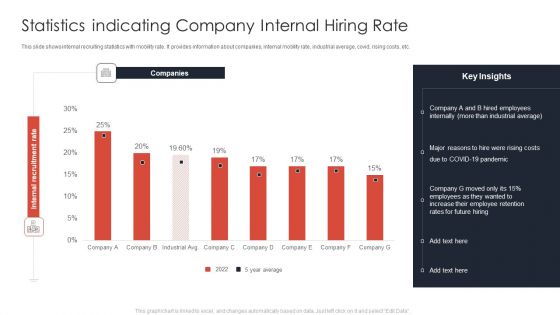
Statistics Indicating Company Internal Hiring Rate Ppt Ideas Templates PDF
This slide shows internal recruiting statistics with mobility rate. It provides information about companies, internal mobility rate, industrial average, covid, rising costs, etc. Showcasing this set of slides titled Statistics Indicating Company Internal Hiring Rate Ppt Ideas Templates PDF. The topics addressed in these templates are Companies, Employees Internally, COVID 19 Pandemic. All the content presented in this PPT design is completely editable. Download it and make adjustments in color, background, font etc. as per your unique business setting.
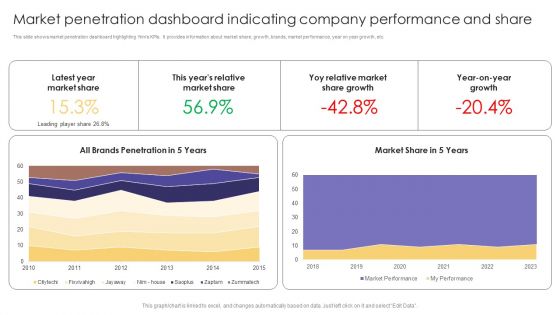
Market Penetration Dashboard Indicating Company Performance And Share Formats PDF
This slide shows market penetration dashboard highlighting firms KPIs. It provides information about market share, growth, brands, market performance, year on year growth, etc. Showcasing this set of slides titled Market Penetration Dashboard Indicating Company Performance And Share Formats PDF. The topics addressed in these templates are Latest Year, Market Share, Market Share Growth. All the content presented in this PPT design is completely editable. Download it and make adjustments in color, background, font etc. as per your unique business setting.
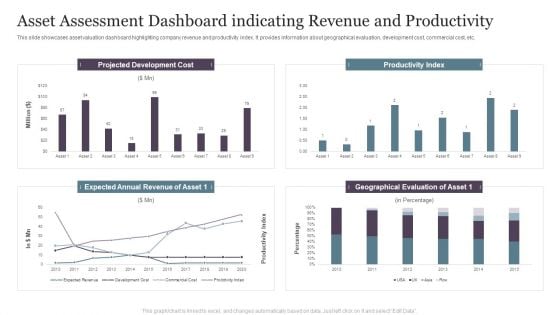
Asset Assessment Dashboard Indicating Revenue And Productivity Infographics PDF
This slide showcases asset valuation dashboard highlighting company revenue and productivity index. It provides information about geographical evaluation, development cost, commercial cost, etc.Pitch your topic with ease and precision using this Asset Assessment Dashboard Indicating Revenue And Productivity Infographics PDF. This layout presents information on Projected Development, Productivity Index, Geographical Evaluation. It is also available for immediate download and adjustment. So, changes can be made in the color, design, graphics or any other component to create a unique layout.
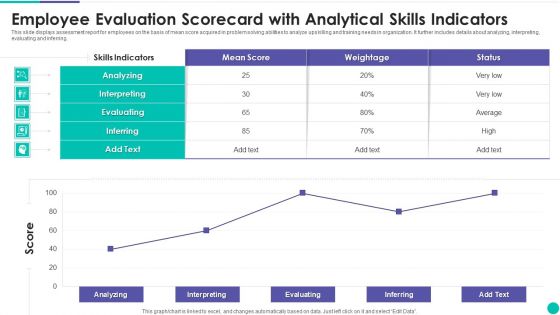
Employee Evaluation Scorecard With Analytical Skills Indicators Clipart PDF
This slide displays assessment report for employees on the basis of mean score acquired in problem solving abilities to analyze upskilling and training needs in organization. It further includes details about analyzing, interpreting, evaluating and inferring. Pitch your topic with ease and precision using this Employee Evaluation Scorecard With Analytical Skills Indicators Clipart PDF. This layout presents information on Analyzing, Interpreting, Evaluating. It is also available for immediate download and adjustment. So, changes can be made in the color, design, graphics or any other component to create a unique layout.
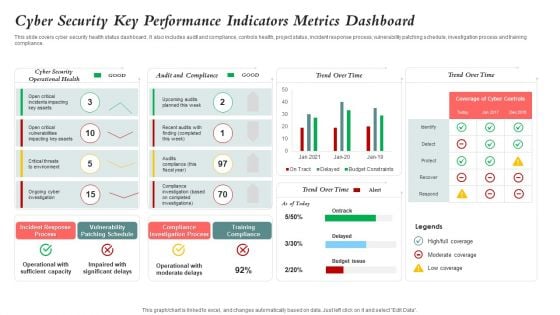
Cyber Security Key Performance Indicators Metrics Dashboard Mockup PDF
This slide covers cyber security health status dashboard . It also includes audit and compliance, controls health, project status, incident response process, vulnerability patching schedule, investigation process and training compliance. Pitch your topic with ease and precision using this Cyber Security Key Performance Indicators Metrics Dashboard Mockup PDF. This layout presents information on Cyber Security, Vulnerability Patching Schedule, Compliance Investigation Process. It is also available for immediate download and adjustment. So, changes can be made in the color, design, graphics or any other component to create a unique layout.
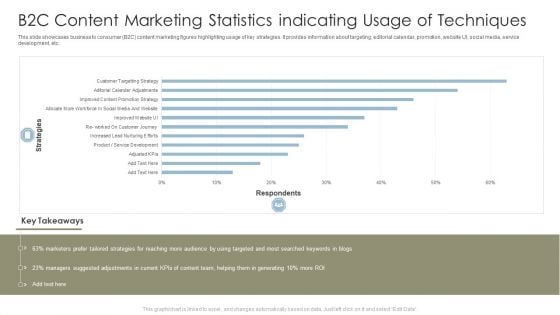
B2C Content Marketing Statistics Indicating Usage Of Techniques Sample PDF
This slide showcases business to consumer B2C content marketing figures highlighting usage of key strategies. It provides information about targeting, editorial calendar, promotion, website UI, social media, service development, etc. Pitch your topic with ease and precision using this B2C Content Marketing Statistics Indicating Usage Of Techniques Sample PDF. This layout presents information on Strategies, Marketers, Content Team. It is also available for immediate download and adjustment. So, changes can be made in the color, design, graphics or any other component to create a unique layout.
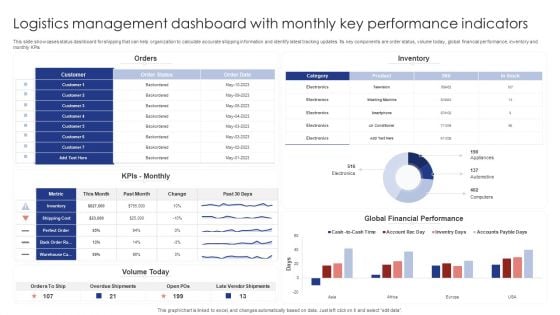
Logistics Management Dashboard With Monthly Key Performance Indicators Rules PDF
This slide showcases status dashboard for shipping that can help organization to calculate accurate shipping information and identify latest tracking updates. Its key components are order status, volume today, global financial performance, inventory and monthly KPIs. Pitch your topic with ease and precision using this Logistics Management Dashboard With Monthly Key Performance Indicators Rules PDF. This layout presents information on Orders, Inventory, Kpis Monthly. It is also available for immediate download and adjustment. So, changes can be made in the color, design, graphics or any other component to create a unique layout.
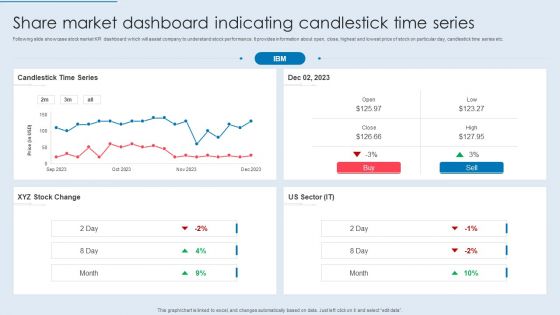
Share Market Dashboard Indicating Candlestick Time Series Formats PDF
Following slide showcase stock market KPI dashboard which will assist company to understand stock performance. It provides information about open, close, highest and lowest price of stock on particular day, candlestick time series etc. Pitch your topic with ease and precision using this Share Market Dashboard Indicating Candlestick Time Series Formats PDF. This layout presents information on Candlestick Time Series, Stock Change, US Sector. It is also available for immediate download and adjustment. So, changes can be made in the color, design, graphics or any other component to create a unique layout.

Data Mining Flowchart Indicating Customer Profiling Ppt Gallery Styles PDF
This slide showcase flowchart indicating customer profiling by using data mining which can assist companies in gathering reliable data to streamline the process of profiling. It contains details about individual data, regulations, professional, verification, mechanist, cancelled, approved and so on. Presenting Data Mining Flowchart Indicating Customer Profiling Ppt Gallery Styles PDF to dispense important information. This template comprises two stages. It also presents valuable insights into the topics including Cancelled Regulations, All Regulations, Approved Regulations. This is a completely customizable PowerPoint theme that can be put to use immediately. So, download it and address the topic impactfully.
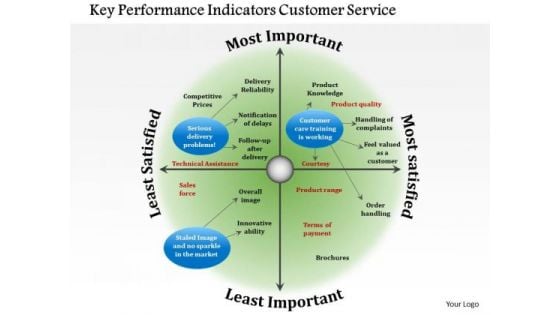
Business Framework Key Performance Indicators Customer Service PowerPoint Presentation
Our above diagram provides framework of key performance indicators for customer service. It contains circular diagram in four segments depicting concepts of delivery problems, customer care training. Download this diagram to make professional presentations on customer service.
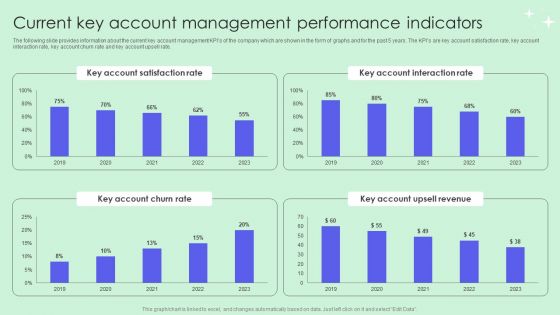
Current Key Account Management Performance Indicators Pictures PDF
The following slide provides information about the current key account management KPIs of the company which are shown in the form of graphs and for the past 5 years. The KPIs are key account satisfaction rate, key account interaction rate, key account churn rate and key account upsell rate. Are you in need of a template that can accommodate all of your creative concepts This one is crafted professionally and can be altered to fit any style. Use it with Google Slides or PowerPoint. Include striking photographs, symbols, depictions, and other visuals. Fill, move around, or remove text boxes as desired. Test out color palettes and font mixtures. Edit and save your work, or work with colleagues. Download Current Key Account Management Performance Indicators Pictures PDF and observe how to make your presentation outstanding. Give an impeccable presentation to your group and make your presentation unforgettable.
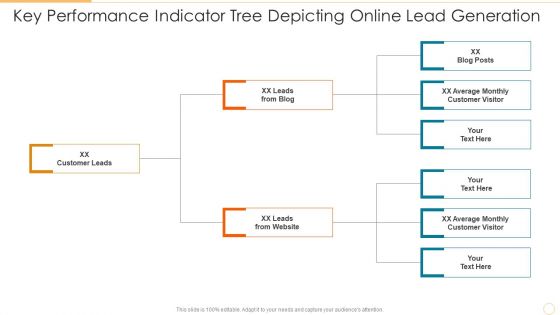
Key Performance Indicator Tree Depicting Online Lead Generation Information PDF
Persuade your audience using this key performance indicator tree depicting online lead generation information pdf. This PPT design covers three stages, thus making it a great tool to use. It also caters to a variety of topics including customer leads, leads from blog, leads from website. Download this PPT design now to present a convincing pitch that not only emphasizes the topic but also showcases your presentation skills.
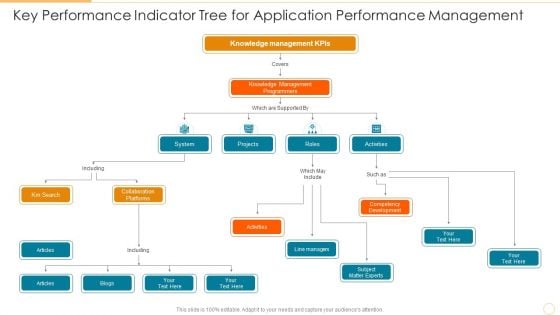
Key Performance Indicator Tree For Application Performance Management Background PDF
Persuade your audience using this key performance indicator tree for application performance management background pdf. This PPT design covers six stages, thus making it a great tool to use. It also caters to a variety of topics including collaboration platforms, competency development, knowledge management programmers. Download this PPT design now to present a convincing pitch that not only emphasizes the topic but also showcases your presentation skills.
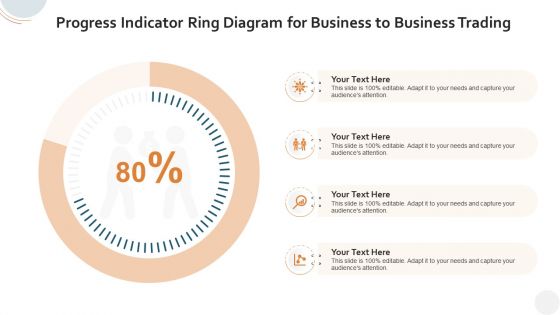
Progress Indicator Ring Diagram For Business To Business Trading Graphics PDF
Pitch your topic with ease and precision using this progress indicator ring diagram for business to business trading graphics pdf. This layout presents information on progress indicator ring diagram for business to business trading. It is also available for immediate download and adjustment. So, changes can be made in the color, design, graphics or any other component to create a unique layout.
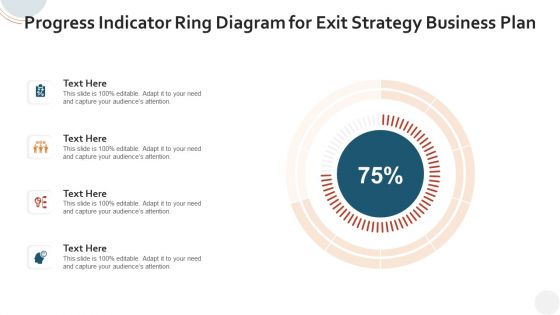
Progress Indicator Ring Diagram For Exit Strategy Business Plan Information PDF
Showcasing this set of slides titled progress indicator ring diagram for exit strategy business plan information pdf. The topics addressed in these templates are progress indicator ring diagram for exit strategy business plan. All the content presented in this PPT design is completely editable. Download it and make adjustments in color, background, font etc. as per your unique business setting.
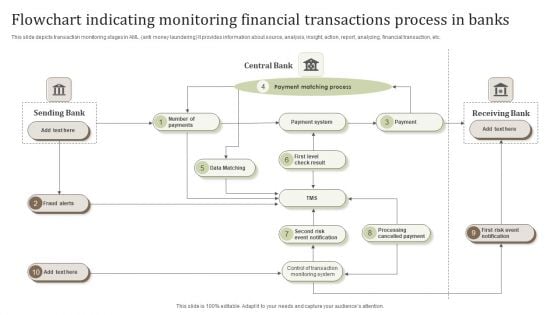
Flowchart Indicating Monitoring Financial Transactions Process In Banks Pictures PDF
This slide depicts transaction monitoring stages in AML anti money laundering It provides information about source, analysis, insight, action, report, analyzing, financial transaction, etc.Persuade your audience using this Flowchart Indicating Monitoring Financial Transactions Process In Banks Pictures PDF. This PPT design covers one stage, thus making it a great tool to use. It also caters to a variety of topics including Payment Matching Process, Cancelled Payment, Cancelled Payment. Download this PPT design now to present a convincing pitch that not only emphasizes the topic but also showcases your presentation skills.
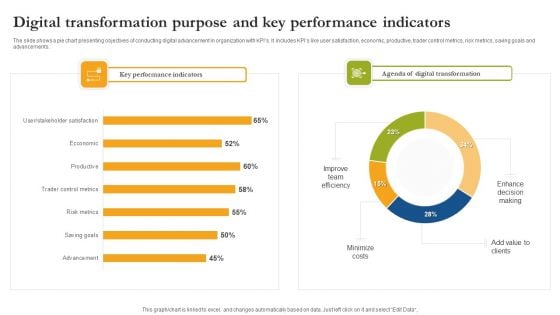
Digital Transformation Purpose And Key Performance Indicators Formats PDF
The slide shows a pie chart presenting objectives of conducting digital advancement in organization with KPIs. It includes KPIs like user satisfaction, economic, productive, trader control metrics, risk metrics, saving goals and advancements. Pitch your topic with ease and precision using this Digital Transformation Purpose And Key Performance Indicators Formats PDF. This layout presents information on Key Performance Indicators, Digital Transformation, Minimize Costs. It is also available for immediate download and adjustment. So, changes can be made in the color, design, graphics or any other component to create a unique layout.
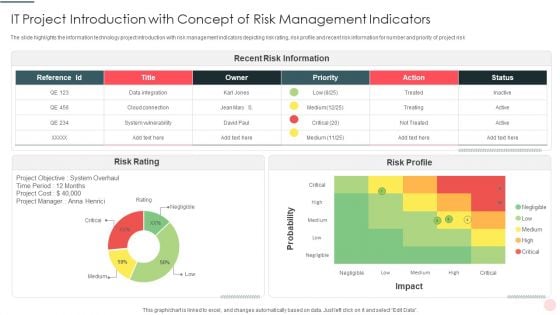
IT Project Introduction With Concept Of Risk Management Indicators Diagrams PDF
Pitch your topic with ease and precision using this IT Project Introduction With Concept Of Risk Management Indicators Diagrams PDF This layout presents information on System Vulnerability, Recent Risk Information, Probability It is also available for immediate download and adjustment. So, changes can be made in the color, design, graphics or any other component to create a unique layout.
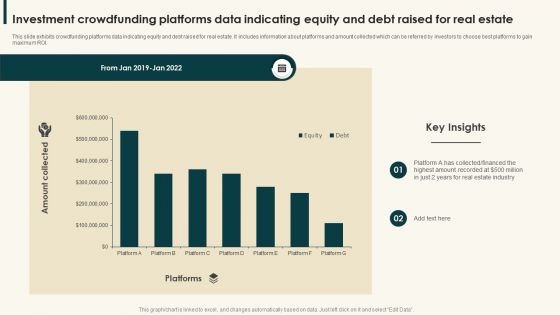
Investment Crowdfunding Platforms Data Indicating Equity And Debt Raised For Real Estate Diagrams PDF
This slide exhibits crowdfunding platforms data indicating equity and debt raised for real estate. It includes information about platforms and amount collected which can be referred by investors to choose best platforms to gain maximum ROI.Showcasing this set of slides titled Investment Crowdfunding Platforms Data Indicating Equity And Debt Raised For Real Estate Diagrams PDF. The topics addressed in these templates are Collected Financed, Highest Amount, Estate Industry. All the content presented in this PPT design is completely editable. Download it and make adjustments in color, background, font etc. as per your unique business setting.

Strategic Plan For Enterprise Key Performance Indicators Highlighting Current Problems Diagrams PDF
This slide represents the key performance indicators to track the problems faced by organization and draw effective strategies to tackle the problems. It includes key performance indicators of decline in organizational sales and customer engagement rate. Coming up with a presentation necessitates that the majority of the effort goes into the content and the message you intend to convey. The visuals of a PowerPoint presentation can only be effective if it supplements and supports the story that is being told. Keeping this in mind our experts created Strategic Plan For Enterprise Key Performance Indicators Highlighting Current Problems Diagrams PDF to reduce the time that goes into designing the presentation. This way, you can concentrate on the message while our designers take care of providing you with the right template for the situation.
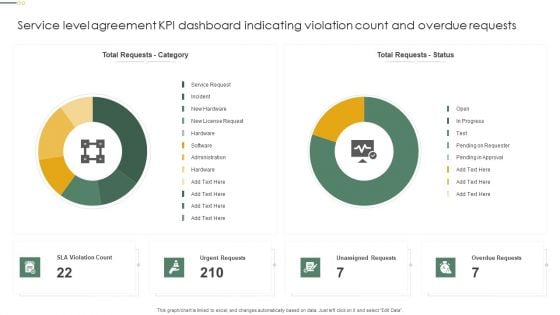
Service Level Agreement KPI Dashboard Indicating Violation Count And Overdue Requests Diagrams PDF
This graph or chart is linked to excel, and changes automatically based on data. Just left click on it and select Edit Data. Showcasing this set of slides titled Service Level Agreement KPI Dashboard Indicating Violation Count And Overdue Requests Diagrams PDF. The topics addressed in these templates are Total Requests Category, Total Requests Status, Urgent Requests. All the content presented in this PPT design is completely editable. Download it and make adjustments in color, background, font etc. as per your unique business setting.
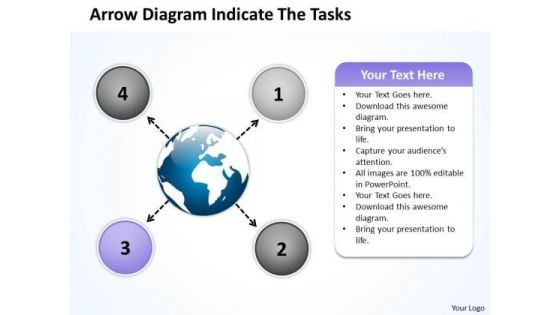
Arrow Diagram Indicate The Tasks Circular Flow Layout Process PowerPoint Slides
We present our arrow diagram indicate the tasks Circular Flow Layout Process PowerPoint Slides.Download and present our Business PowerPoint Templates because your thoughts are pointed and sharp as arrows. Present our Ring Charts PowerPoint Templates because it Draws the universal impact to highlight the similarities with your organizational structure and plans. Download our Marketing PowerPoint Templates because networking is an imperative in todays world. You need to access the views of others. Similarly you need to give access to them of your abilities. Use our Shapes PowerPoint Templates because different people with differing ideas and priorities perform together to score. Download our Process and Flows PowerPoint Templates because you have a great plan to put the pieces together, getting all the various contributors to gel for a successful completion.Use these PowerPoint slides for presentations relating to Arrows, choice, connect, design, direction, flows, four, info graph, instruction, layout, manual, marketing, modern, one, option, order, page, paper, pointing, process, product, promotion, sequence, simple, special, step, symbol. The prominent colors used in the PowerPoint template are Purple, Blue, Black. Presenters tell us our arrow diagram indicate the tasks Circular Flow Layout Process PowerPoint Slides are Majestic. Professionals tell us our info PowerPoint templates and PPT Slides are Breathtaking. PowerPoint presentation experts tell us our arrow diagram indicate the tasks Circular Flow Layout Process PowerPoint Slides are Clever. The feedback we get is that our info PowerPoint templates and PPT Slides are Nifty. Use our arrow diagram indicate the tasks Circular Flow Layout Process PowerPoint Slides are One-of-a-kind. Use our four PowerPoint templates and PPT Slides are readymade to fit into any presentation structure. Watch your plans fall into place. Our Arrow Diagram Indicate The Tasks Circular Flow Layout Process PowerPoint Slides aid in completion.
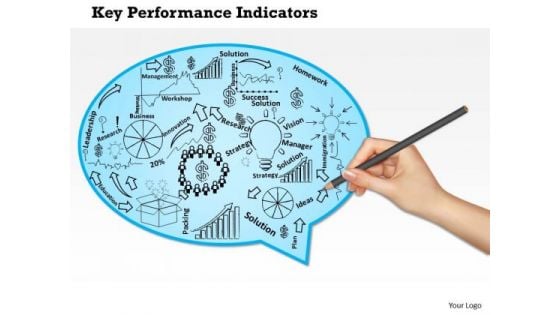
Business Framework Key Performance Indicators Of A Company PowerPoint Presentation
Our above diagram provides framework of key performance indicators for a company. This slide contains human hand drawing some objects for terms like innovation strategy, research, solution, management and leadership. Download this diagram to make professional presentations.
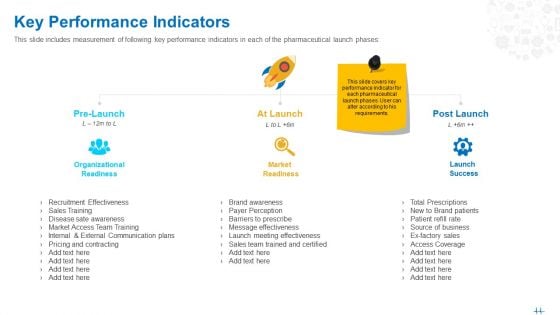
Health Clinic Marketing Key Performance Indicators Ppt Portfolio Visuals PDF
This slide includes measurement of following key performance indicators in each of the pharmaceutical launch phases This is a health clinic marketing key performance indicators ppt portfolio visuals pdf. template with various stages. Focus and dispense information on three stages using this creative set, that comes with editable features. It contains large content boxes to add your information on topics like organizational readiness, market readiness, launch success. You can also showcase facts, figures, and other relevant content using this PPT layout. Grab it now.
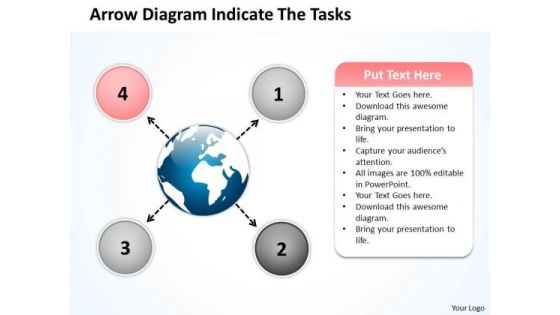
Arrow Diagram Indicate The Tasks Circle Circular Flow Layout Process PowerPoint Slides
We present our arrow diagram indicate the tasks circle Circular Flow Layout Process PowerPoint Slides.Download our Business PowerPoint Templates because this diagram helps you to show goal also clearly etched in your mind. Use our Ring Charts PowerPoint Templates because you have the ideas to develop the teams vision of where they need to be in the future. Download our Marketing PowerPoint Templates because networking is an imperative in todays world. You need to access the views of others. Similarly you need to give access to them of your abilities. Download and present our Shapes PowerPoint Templates because this slide shows each path to the smallest detail. Download our Process and Flows PowerPoint Templates because this Layout helps you to expand your plans to overcome obstacles and reassure the team that they shall continue to roll along merrily.Use these PowerPoint slides for presentations relating to Arrows, choice, connect, design, direction, flows, four, info graph, instruction, layout, manual, marketing, modern, one, option, order, page, paper, pointing, process, product, promotion, sequence, simple, special, step, symbol. The prominent colors used in the PowerPoint template are Pink, Blue, White. Presenters tell us our arrow diagram indicate the tasks circle Circular Flow Layout Process PowerPoint Slides will help you be quick off the draw. Just enter your specific text and see your points hit home. Professionals tell us our info PowerPoint templates and PPT Slides provide you with a vast range of viable options. Select the appropriate ones and just fill in your text. PowerPoint presentation experts tell us our arrow diagram indicate the tasks circle Circular Flow Layout Process PowerPoint Slides are Dazzling. The feedback we get is that our connect PowerPoint templates and PPT Slides will make you look like a winner. Use our arrow diagram indicate the tasks circle Circular Flow Layout Process PowerPoint Slides are Detailed. Use our four PowerPoint templates and PPT Slides are Spectacular. Our Arrow Diagram Indicate The Tasks Circle Circular Flow Layout Process PowerPoint Slides motivate your listeners. With our money back guarantee you have nothing to lose.
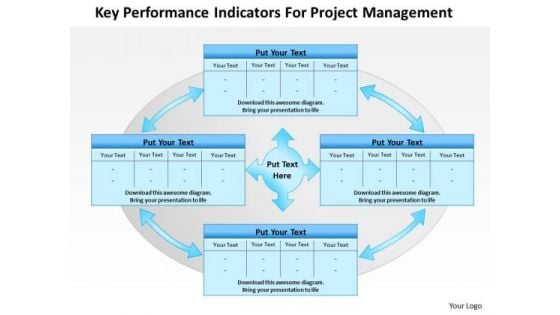
Business Framework Key Performance Indicators For Project Management PowerPoint Presentation
Our above diagram provides framework of key performance indicators for project management. It contains four interconnected text boxes. Download this diagram to make professional presentations on project management. This diagram enables the users to create their own display of the required processes in an easy way.
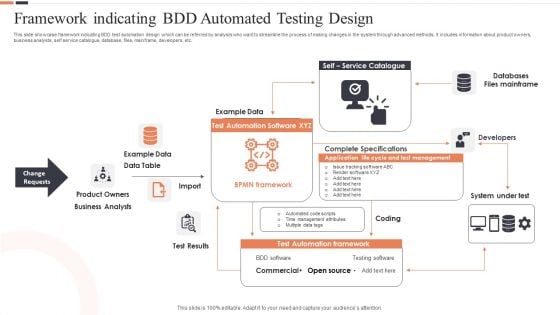
Framework Indicating Bdd Automated Testing Design Ppt Gallery Ideas PDF
This slide showcase framework indicating BDD test automation design which can be referred by analysts who want to streamline the process of making changes in the system through advanced methods. It includes information about product owners, business analysts, self service catalogue, database, files, mainframe, developers, etc. Persuade your audience using this Framework Indicating Bdd Automated Testing Design Ppt Gallery Ideas PDF. This PPT design covers four stages, thus making it a great tool to use. It also caters to a variety of topics including Example Data, Data Table, Product Owners, Business Analysts. Download this PPT design now to present a convincing pitch that not only emphasizes the topic but also showcases your presentation skills.
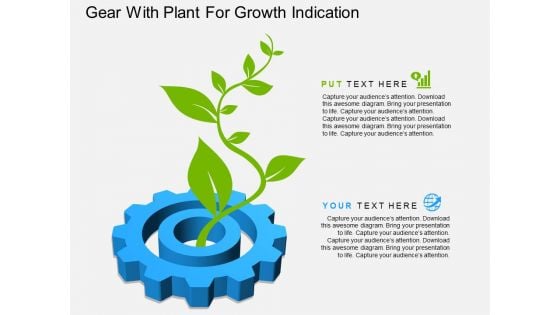
Gear With Plant For Growth Indication Powerpoint Template
This PowerPoint template has been designed with graphics of gear with plant. You may download this diagram slide to indicate growth process. Illustrate your plans to your listeners with this impressive template.
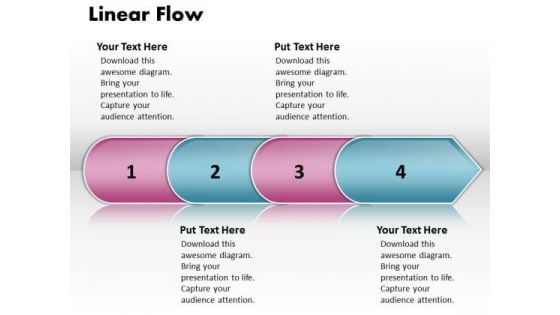
Ppt Linear Arrow 4 Phase Diagram PowerPoint Templates
PPT linear arrow 4 phase diagram PowerPoint Templates-This Four Phase PowerPoint graphic is designed specifically for corporate and academic use. Diagram is fully editable customizable-PPT linear arrow 4 phase diagram PowerPoint Templates-Arrow, Background, Collection, Completed, Concept, Confirmation, Design, Flow, Graph, Graphic, Illustration, Indication, Indicator, Information, Instruction, Interface, Internet, Layout, Measurement, Order, Phase, Pointer, Process, Progress, Reflection, Scale, Shape, Sign Be explicit with our Ppt Linear Arrow 4 Phase Diagram PowerPoint Templates. Express your views clearly and fully.
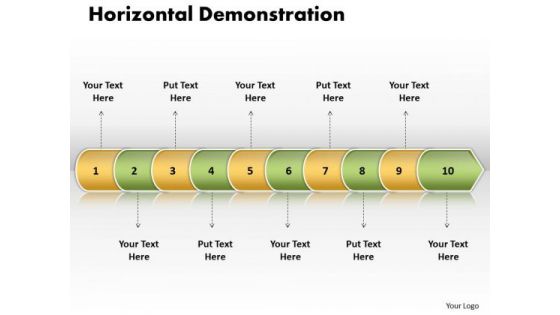
Ppt Linear Arrow 10 Phase Diagram PowerPoint Templates
PPT linear arrow 10 phase diagram PowerPoint Templates-Use this PowerPoint diagram to define basic work and data flow and quality management processes to increase efficiency of your business.-PPT linear arrow 10 phase diagram PowerPoint Templates-Arrow, Background, Collection, Completed, Concept, Confirmation, Design, Flow, Graph, Graphic, Illustration, Indication, Indicator, Information, Instruction, Interface, Internet, Layout, Measurement, Order, Phase, Pointer, Process, Progress, Reflection, Scale, Shape, Sign Start a company with our Ppt Linear Arrow 10 Phase Diagram PowerPoint Templates. Just download, type and present.
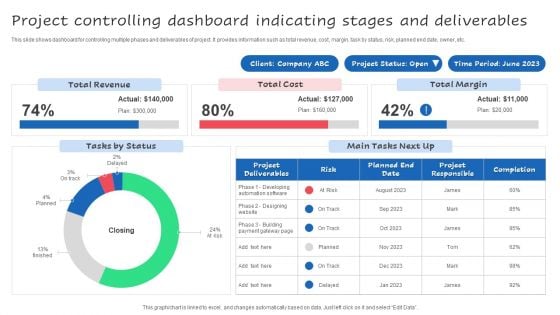
Project Controlling Dashboard Indicating Stages And Deliverables Ppt Styles Guide PDF
This slide shows dashboard for controlling multiple phases and deliverables of project. It provides information such as total revenue, cost, margin, task by status, risk, planned end date, owner, etc. Pitch your topic with ease and precision using this Project Controlling Dashboard Indicating Stages And Deliverables Ppt Styles Guide PDF. This layout presents information on Total Revenue, Total Margin, Total Cost. It is also available for immediate download and adjustment. So, changes can be made in the color, design, graphics or any other component to create a unique layout.
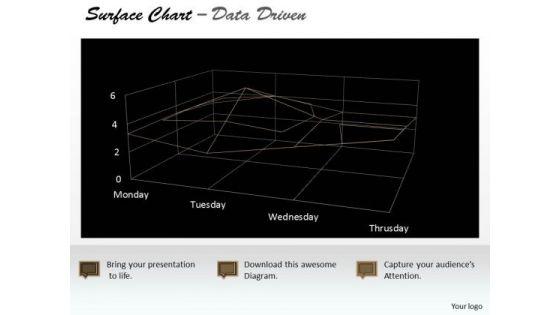
Data Analysis Template Driven Surface Chart Indicating Areas PowerPoint Slides Templates
Highlight Your Drive With Our data analysis template driven surface chart indicating areas powerpoint slides Templates . Prove The Fact That You Have Control.
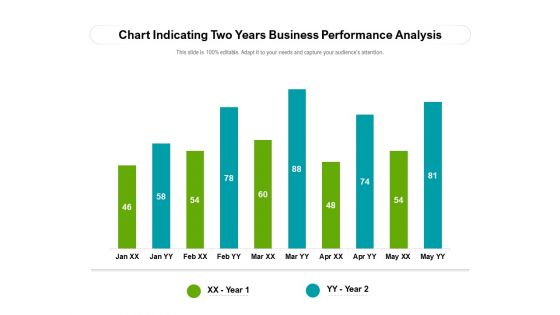
Chart Indicating Two Years Business Performance Analysis Ppt PowerPoint Presentation File Grid PDF
Showcasing this set of slides titled chart indicating two years business performance analysis ppt powerpoint presentation file grid pdf. The topics addressed in these templates are chart indicating two years business performance analysis. All the content presented in this PPT design is completely editable. Download it and make ajustments in color, background, font etc. as per your unique business setting.
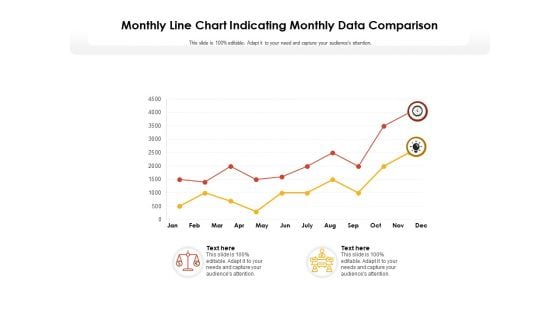
Monthly Line Chart Indicating Monthly Data Comparison Ppt PowerPoint Presentation Model Slide Portrait
Showcasing this set of slides titled monthly line chart indicating monthly data comparison ppt powerpoint presentation model slide portrait. The topics addressed in these templates are monthly line chart indicating monthly data comparison. All the content presented in this PPT design is completely editable. Download it and make adjustments in color, background, font etc. as per your unique business setting.
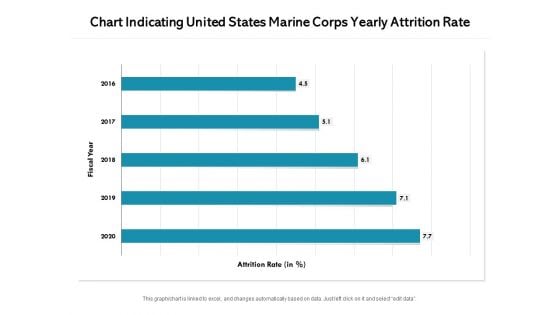
Chart Indicating United States Marine Corps Yearly Attrition Rate Ppt PowerPoint Presentation File Background Images PDF
Pitch your topic with ease and precision using this chart indicating united states marine corps yearly attrition rate ppt powerpoint presentation file background images pdf. This layout presents information on hart indicating united states marine corps yearly attrition rate. It is also available for immediate download and adjustment. So, changes can be made in the color, design, graphics or any other component to create a unique layout.
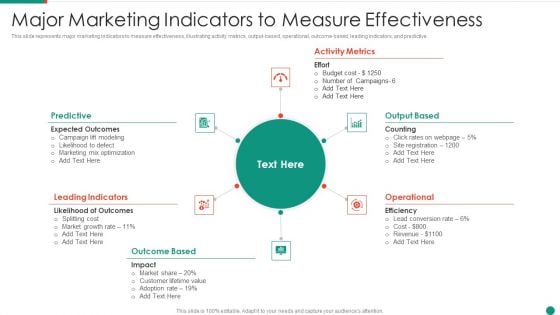
Major Marketing Indicators To Measure Effectiveness Mockup PDF
This slide represents major marketing indicators to measure effectiveness, illustrating activity metrics, output-based, operational, outcome-based, leading indicators, and predictive.Presenting Major Marketing Indicators To Measure Effectiveness Mockup PDF to dispense important information. This template comprises six stages. It also presents valuable insights into the topics including Leading Indicators, Outcome Based, Activity Metrics This is a completely customizable PowerPoint theme that can be put to use immediately. So, download it and address the topic impactfully.

Indicator Kpis Scorecard To Track Employee Personnel Performance Topics PDF
Presenting Indicator Kpis Scorecard To Track Employee Personnel Performance Topics PDF to dispense important information. This template comprises one stages. It also presents valuable insights into the topics including Key Performance Indicators, Averages, Customer Focus. This is a completely customizable PowerPoint theme that can be put to use immediately. So, download it and address the topic impactfully.
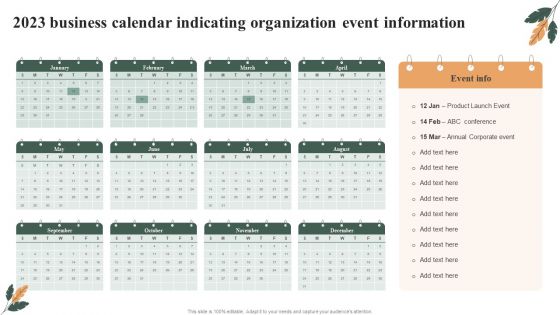
2023 Business Calendar Indicating Organization Event Information Portrait PDF
Presenting 2023 Business Calendar Indicating Organization Event Information Portrait PDF to dispense important information. This template comprises tweleve stages. It also presents valuable insights into the topics including Business Calendar Indicating, Organization Event Information. This is a completely customizable PowerPoint theme that can be put to use immediately. So, download it and address the topic impactfully.
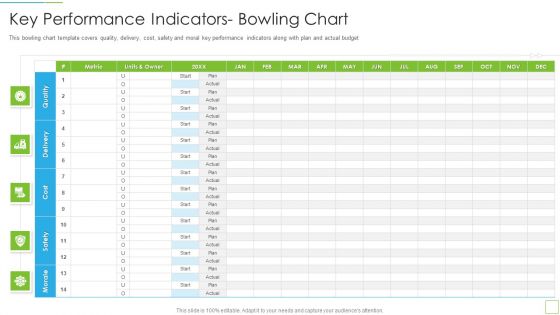
Hoshin Kanri Pitch Deck Key Performance Indicators Bowling Chart Introduction PDF
This bowling chart template covers quality, delivery, cost, safety and moral key performance indicators along with plan and actual budget Deliver an awe inspiring pitch with this creative hoshin kanri pitch deck key performance indicators bowling chart introduction pdf bundle. Topics like key performance indicators bowling chart can be discussed with this completely editable template. It is available for immediate download depending on the needs and requirements of the user.
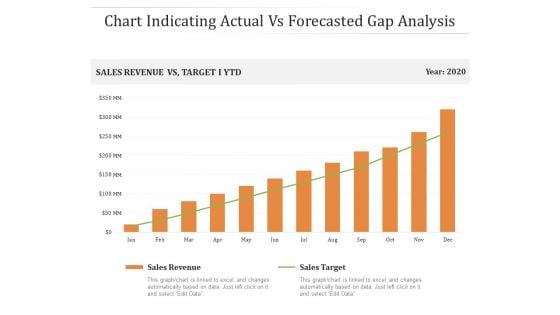
Chart Indicating Actual Vs Forecasted Gap Analysis Ppt PowerPoint Presentation Gallery Slides PDF
Presenting this set of slides with name chart indicating actual vs forecasted gap analysis ppt powerpoint presentation gallery slides pdf. The topics discussed in these slides are sales, target, revenue. This is a completely editable PowerPoint presentation and is available for immediate download. Download now and impress your audience.
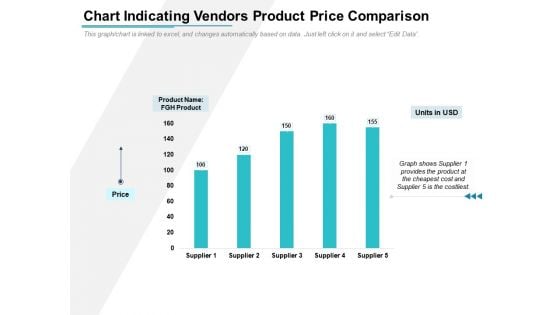
Chart Indicating Vendors Product Price Comparison Ppt PowerPoint Presentation Portfolio Infographics PDF
Showcasing this set of slides titled chart indicating vendors product price comparison ppt powerpoint presentation portfolio infographics pdf. The topics addressed in these templates are product, fgh product, units in usd, price, supplier. All the content presented in this PPT design is completely editable. Download it and make adjustments in color, background, font etc. as per your unique business setting.
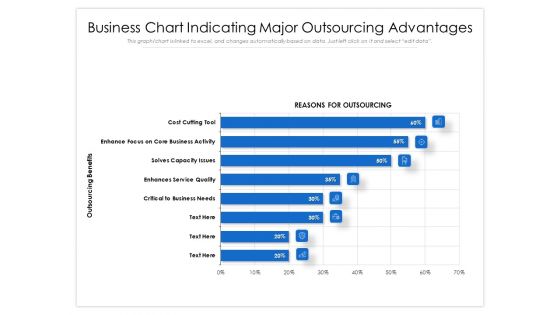
Business Chart Indicating Major Outsourcing Advantages Ppt PowerPoint Presentation File Template PDF
Showcasing this set of slides titled business chart indicating major outsourcing advantages ppt powerpoint presentation file template pdf. The topics addressed in these templates are cost, business, service. All the content presented in this PPT design is completely editable. Download it and make adjustments in color, background, font etc. as per your unique business setting.
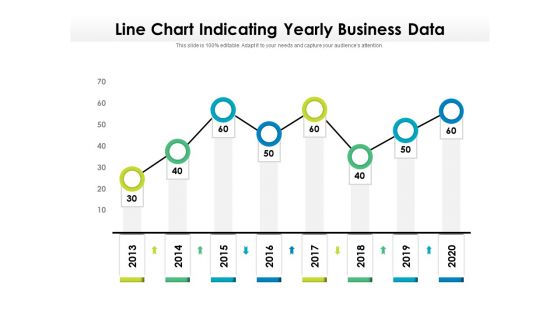
Line Chart Indicating Yearly Business Data Ppt PowerPoint Presentation Styles Deck PDF
Showcasing this set of slides titled line chart indicating yearly business data ppt powerpoint presentation styles deck pdf. The topics addressed in these templates are line chart indicating yearly business data, 2013 to 2020. All the content presented in this PPT design is completely editable. Download it and make adjustments in color, background, font etc. as per your unique business setting.
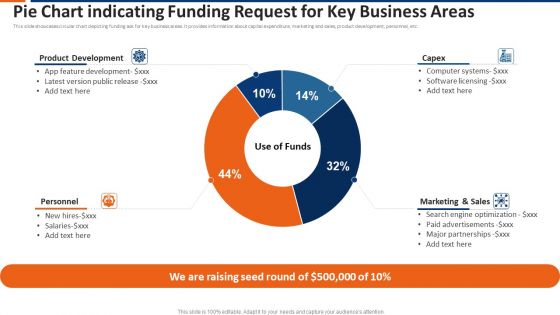
Pie Chart Indicating Funding Request For Key Business Areas Ppt Show Topics PDF
This slide showcases circular chart depicting funding ask for key business areas. It provides information about capital expenditure, marketing and sales, product development, personnel, etc. Pitch your topic with ease and precision using this pie chart indicating funding request for key business areas ppt show topics pdf. This layout presents information on product development, capex, marketing and sales, personnel. It is also available for immediate download and adjustment. So, changes can be made in the color, design, graphics or any other component to create a unique layout.

Plant With Bulb Education Growth Indication Powerpoint Template
This PowerPoint slide has been designed with graphics of plant and bulb. This diagram is designed to display education and growth. This professional slide helps in making an instant impact on viewers.
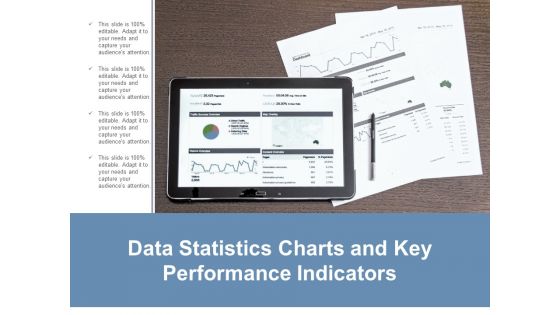
Data Statistics Charts And Key Performance Indicators Ppt Powerpoint Presentation Layouts Guide
This is a data statistics charts and key performance indicators ppt powerpoint presentation layouts guide. This is a four stage process. The stages in this process are business metrics, business kpi, business dashboard.
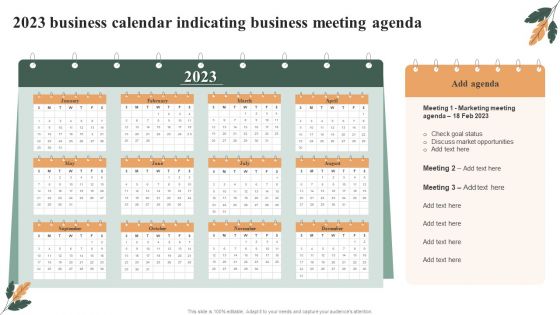
2023 Business Calendar Indicating Business Meeting Agenda Download PDF
Presenting 2023 Business Calendar Indicating Business Meeting Agenda Download PDF to dispense important information. This template comprises tweleve stages. It also presents valuable insights into the topics including Marketing Meeting, Market Opportunities, Check Goal Status. This is a completely customizable PowerPoint theme that can be put to use immediately. So, download it and address the topic impactfully.
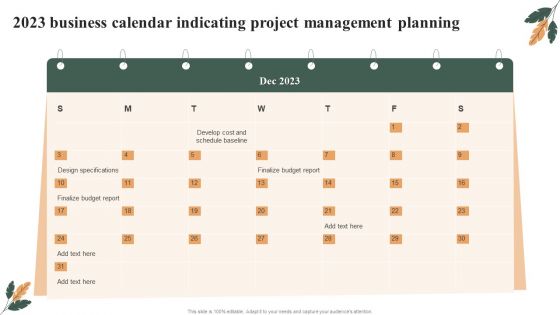
2023 Business Calendar Indicating Project Management Planning Brochure PDF
Presenting 2023 Business Calendar Indicating Project Management Planning Brochure PDF to dispense important information. This template comprises one stages. It also presents valuable insights into the topics including Design Specifications, Finalize Budget Report, Develop Cost. This is a completely customizable PowerPoint theme that can be put to use immediately. So, download it and address the topic impactfully.
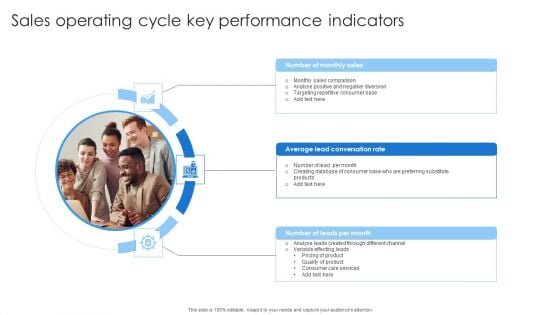
Sales Operating Cycle Key Performance Indicators Professional PDF
Presenting Sales Operating Cycle Key Performance Indicators Professional PDF to dispense important information. This template comprises three stages. It also presents valuable insights into the topics including Sales Comparison, Lead Conversation, Quality Product. This is a completely customizable PowerPoint theme that can be put to use immediately. So, download it and address the topic impactfully.
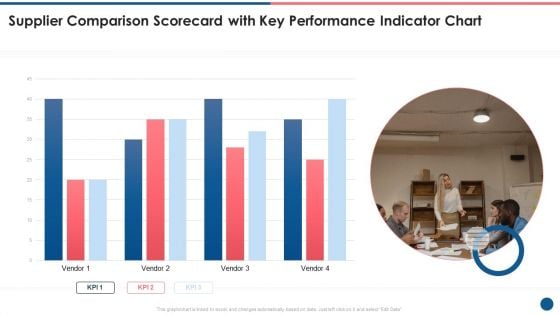
Supplier Scorecard Supplier Comparison Scorecard With Key Performance Indicator Chart Formats PDF
This is a supplier scorecard supplier comparison scorecard with key performance indicator chart formats pdf template with various stages. Focus and dispense information on one stages using this creative set, that comes with editable features. It contains large content boxes to add your information on topics like supplier comparison scorecard, key performance, indicator chart. You can also showcase facts, figures, and other relevant content using this PPT layout. Grab it now.
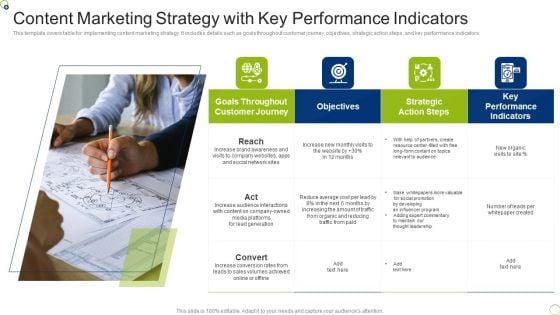
Content Marketing Strategy With Key Performance Indicators Microsoft PDF
This template covers table for implementing content marketing strategy. It includes details such as goals throughout customer journey, objectives, strategic action steps, and key performance indicators. Presenting Content Marketing Strategy With Key Performance Indicators Microsoft PDF to dispense important information. This template comprises four stages. It also presents valuable insights into the topics including Resource, Strategic, Cost. This is a completely customizable PowerPoint theme that can be put to use immediately. So, download it and address the topic impactfully.
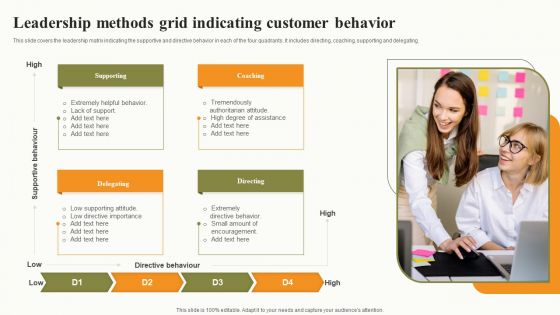
Leadership Methods Grid Indicating Customer Behavior Graphics PDF
This slide covers the leadership matrix indicating the supportive and directive behavior in each of the four quadrants. It includes directing, coaching, supporting and delegating. Presenting Leadership Methods Grid Indicating Customer Behavior Graphics PDF to dispense important information. This template comprises four stages. It also presents valuable insights into the topics including Directing, Supporting, Coaching, Delegating. This is a completely customizable PowerPoint theme that can be put to use immediately. So, download it and address the topic impactfully.
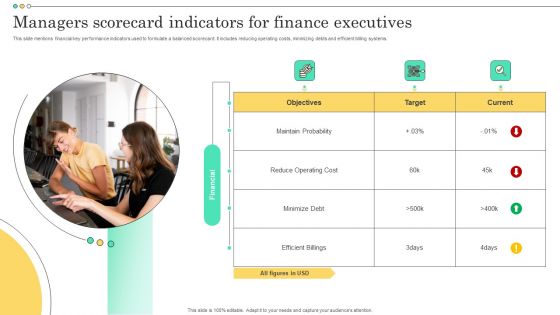
Managers Scorecard Indicators For Finance Executives Topics PDF
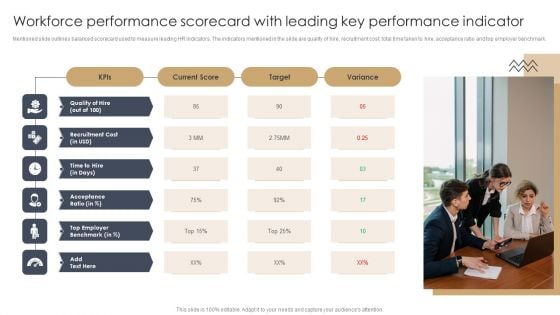
Workforce Performance Scorecard With Leading Key Performance Indicator Information PDF
Mentioned slide outlines balanced scorecard used to measure leading HR indicators. The indicators mentioned in the slide are quality of hire, recruitment cost, total time taken to hire, acceptance ratio and top employer benchmark.Presenting Workforce Performance Scorecard With Leading Key Performance Indicator Information PDF to dispense important information. This template comprises one stage. It also presents valuable insights into the topics including Top Employer, Acceptance Ratio, Recruitment Cost. This is a completely customizable PowerPoint theme that can be put to use immediately. So, download it and address the topic impactfully.
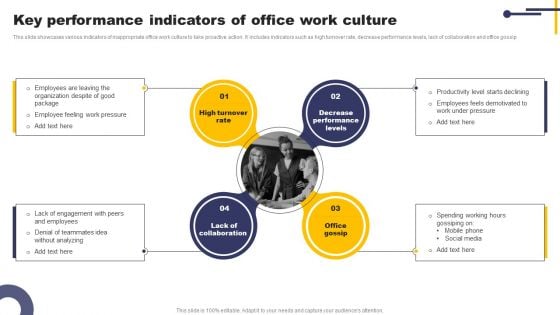
Key Performance Indicators Of Office Work Culture Inspiration PDF
This slide showcases various indicators of inappropriate office work culture to take proactive action. It includes indicators such as high turnover rate, decrease performance levels, lack of collaboration and office gossip. Presenting Key Performance Indicators Of Office Work Culture Inspiration PDF to dispense important information. This template comprises four stages. It also presents valuable insights into the topics including High Turnover Rate, Decrease Performance Levels, Office Gossip. This is a completely customizable PowerPoint theme that can be put to use immediately. So, download it and address the topic impactfully.
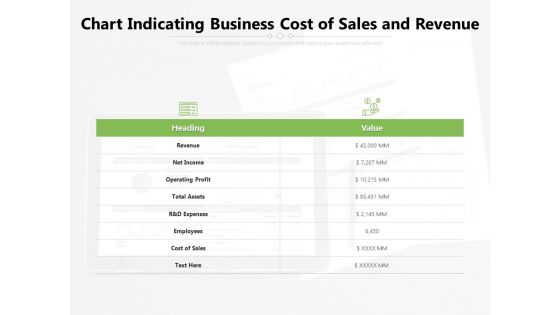
Chart Indicating Business Cost Of Sales And Revenue Ppt PowerPoint Presentation File Gridlines PDF
Presenting this set of slides with name chart indicating business cost of sales and revenue ppt powerpoint presentation file gridlines pdf. The topics discussed in these slides are revenue, operating, assets. This is a completely editable PowerPoint presentation and is available for immediate download. Download now and impress your audience.
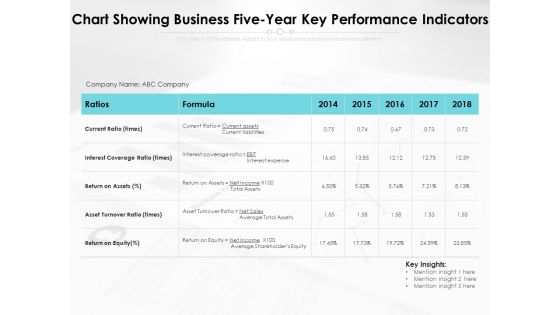
Chart Showing Business Five Year Key Performance Indicators Ppt PowerPoint Presentation File Infographics PDF
Presenting this set of slides with name chart showing business five year key performance indicators ppt powerpoint presentation file infographics pdf. The topics discussed in these slides are liabilities, equity, assets. This is a completely editable PowerPoint presentation and is available for immediate download. Download now and impress your audience.
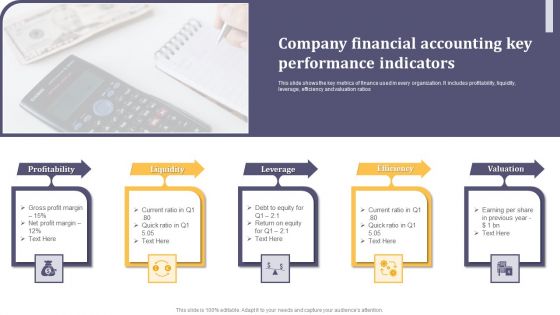
Company Financial Accounting Key Performance Indicators Ppt Slides PDF
This slide shows the key metrics of finance used in every organization. It includes profitability, liquidity, leverage, efficiency and valuation ratios. Presenting Company Financial Accounting Key Performance Indicators Ppt Slides PDF to dispense important information. This template comprises five stages. It also presents valuable insights into the topics including Profitability, Liquidity, Leverage. This is a completely customizable PowerPoint theme that can be put to use immediately. So, download it and address the topic impactfully.
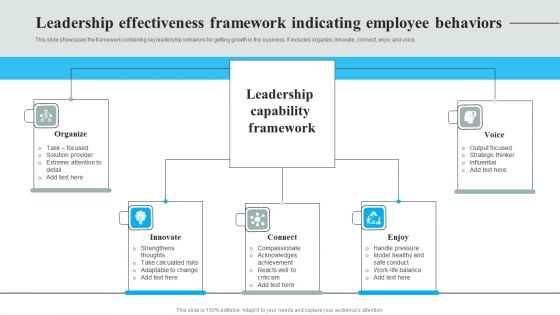
Leadership Effectiveness Framework Indicating Employee Behaviors Elements PDF
This slide showcases the framework containing key leadership behaviors for getting growth in the business. It includes organize, innovate, connect, enjoy and voice. Presenting Leadership Effectiveness Framework Indicating Employee Behaviors Elements PDF to dispense important information. This template comprises five stages. It also presents valuable insights into the topics including Organize, Innovate, Connect, Enjoy, Voice. This is a completely customizable PowerPoint theme that can be put to use immediately. So, download it and address the topic impactfully.
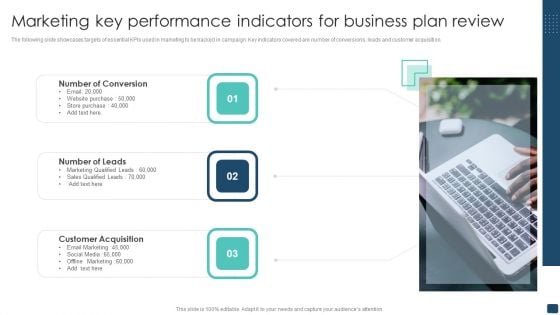
Marketing Key Performance Indicators For Business Plan Review Template PDF
The following slide showcases targets of essential KPIs used in marketing to be tracked in campaign. Key indicators covered are number of conversions, leads and customer acquisition. Presenting Marketing Key Performance Indicators For Business Plan Review Template PDF to dispense important information. This template comprises three stages. It also presents valuable insights into the topics including Number Of Conversion, Number Of Leads, Customer Acquisition. This is a completely customizable PowerPoint theme that can be put to use immediately. So, download it and address the topic impactfully.
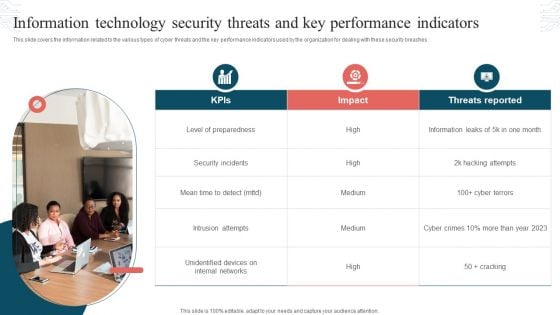
Information Technology Security Threats And Key Performance Indicators Formats PDF
This slide covers the information related to the various types of cyber threats and the key performance indicators used by the organization for dealing with these security breaches. Presenting Information Technology Security Threats And Key Performance Indicators Formats PDF to dispense important information. This template comprises three stages. It also presents valuable insights into the topics including Threats Reported, Security Incidents, Intrusion Attempts. This is a completely customizable PowerPoint theme that can be put to use immediately. So, download it and address the topic impactfully.
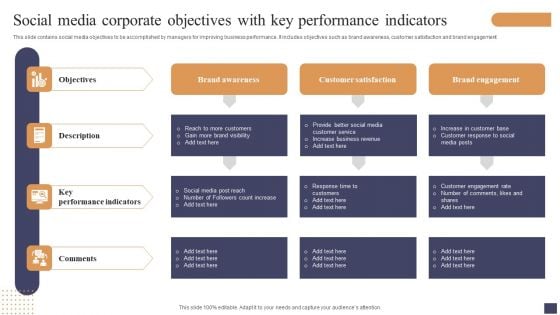
Social Media Corporate Objectives With Key Performance Indicators Pictures PDF
This slide contains social media objectives to be accomplished by managers for improving business performance. It includes objectives such as brand awareness, customer satisfaction and brand engagement. Presenting Social Media Corporate Objectives With Key Performance Indicators Pictures PDF to dispense important information. This template comprises four stages. It also presents valuable insights into the topics including Objectives, Description, Key Performance Indicators . This is a completely customizable PowerPoint theme that can be put to use immediately. So, download it and address the topic impactfully.
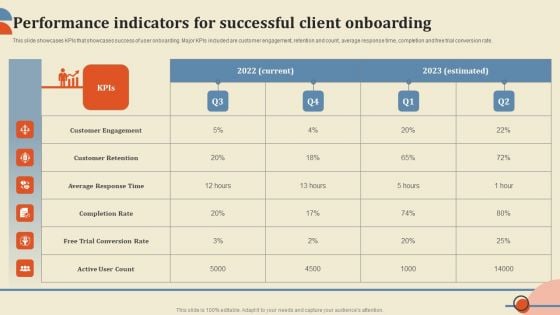
Performance Indicators For Successful Client Onboarding Brochure PDF
This slide showcases KPIs that showcases success of user onboarding. Major KPIs included are customer engagement, retention and count, average response time, completion and free trial conversion rate. Retrieve professionally designed Performance Indicators For Successful Client Onboarding Brochure PDF to effectively convey your message and captivate your listeners. Save time by selecting pre made slideshows that are appropriate for various topics, from business to educational purposes. These themes come in many different styles, from creative to corporate, and all of them are easily adjustable and can be edited quickly. Access them as PowerPoint templates or as Google Slides themes. You do not have to go on a hunt for the perfect presentation because Slidegeeks got you covered from everywhere.
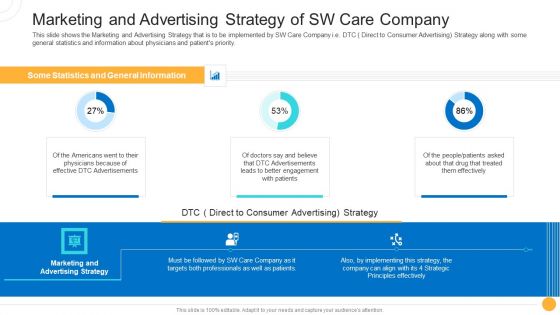
Drug Indicator Extension In A Pharmaceuticals Company Marketing And Advertising Strategy Of SW Care Company Themes PDF
This slide shows the Marketing and Advertising Strategy that is to be implemented by SW Care Company i.e. DTC Direct to Consumer Advertising Strategy along with some general statistics and information about physicians and patients priority. Deliver an awe inspiring pitch with this creative drug indicator extension in a pharmaceuticals company marketing and advertising strategy of sw care company themes pdf bundle. Topics like effective, engagement, strategic, implementing, marketing can be discussed with this completely editable template. It is available for immediate download depending on the needs and requirements of the user.
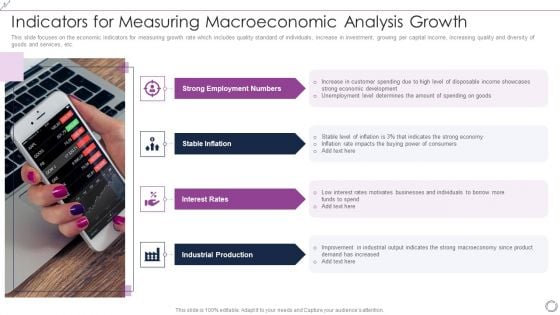
Indicators For Measuring Macroeconomic Analysis Growth Slides PDF
This slide focuses on the economic indicators for measuring growth rate which includes quality standard of individuals, increase in investment, growing per capital income, increasing quality and diversity of goods and services, etc. PresentingIndicators For Measuring Macroeconomic Analysis Growth Slides PDF to dispense important information. This template comprises four stages. It also presents valuable insights into the topics including Strong Employment Numbers, Stable Inflation, Interest Rates, Industrial Production. This is a completely customizable PowerPoint theme that can be put to use immediately. So, download it and address the topic impactfully.
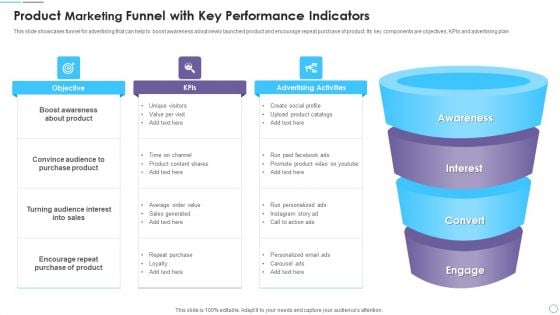
Product Marketing Funnel With Key Performance Indicators Guidelines PDF
This slide showcases funnel for advertising that can help to boost awareness about newly launched product and encourage repeat purchase of product. Its key components are objectives, KPIs and advertising plan. Presenting Product Marketing Funnel With Key Performance Indicators Guidelines PDF to dispense important information. This template comprises four stages. It also presents valuable insights into the topics including Awareness, Interest, Convert, Engage. This is a completely customizable PowerPoint theme that can be put to use immediately. So, download it and address the topic impactfully.
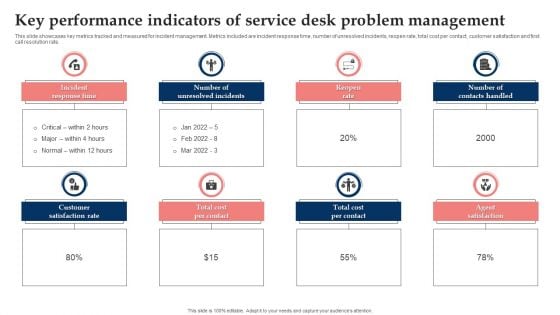
Key Performance Indicators Of Service Desk Problem Management Elements PDF
This slide showcases key metrics tracked and measured for incident management. Metrics included are incident response time, number of unresolved incidents, reopen rate, total cost per contact, customer satisfaction and first call resolution rate. Presenting Key Performance Indicators Of Service Desk Problem Management Elements PDF to dispense important information. This template comprises eight stages. It also presents valuable insights into the topics including Incident Response Time, Number Of Unresolved Incidents, Number Of Contacts Handled. This is a completely customizable PowerPoint theme that can be put to use immediately. So, download it and address the topic impactfully.
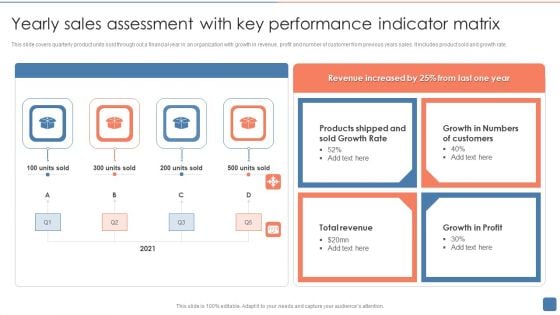
Yearly Sales Assessment With Key Performance Indicator Matrix Introduction PDF
This slide covers quarterly product units sold through out a financial year in an organization with growth in revenue, profit and number of customer from previous years sales. It includes product sold and growth rate. Presenting Yearly Sales Assessment With Key Performance Indicator Matrix Introduction PDF to dispense important information. This template comprises four stages. It also presents valuable insights into the topics including Sold Growth Rate, Customers, Growth In Profit. This is a completely customizable PowerPoint theme that can be put to use immediately. So, download it and address the topic impactfully.
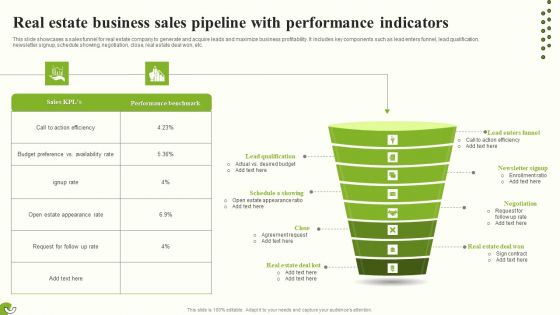
Real Estate Business Sales Pipeline With Performance Indicators Background PDF
This slide showcases a sales funnel for real estate company to generate and acquire leads and maximize business profitability. It includes key components such as lead enters funnel, lead qualification, newsletter signup, schedule showing, negotiation, close, real estate deal won, etc. Presenting Real Estate Business Sales Pipeline With Performance Indicators Background PDF to dispense important information. This template comprises eight stages. It also presents valuable insights into the topics including Budget Preference, Newsletter Signup, Real Estate Deal Won. This is a completely customizable PowerPoint theme that can be put to use immediately. So, download it and address the topic impactfully.
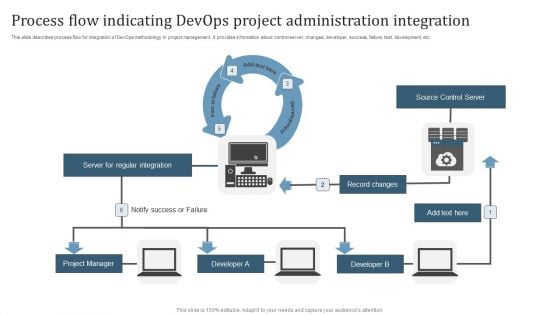
Process Flow Indicating Devops Project Administration Integration Microsoft PDF
This slide describes process flow for integration of DevOps methodology in project management. It provides information about control server, changes, developer, success, failure, test, development, etc. Presenting Process Flow Indicating Devops Project Administration Integration Microsoft PDF to dispense important information. This template comprises three stages. It also presents valuable insights into the topics including Server For Regular Integration, Source Control Server, Record Changes. This is a completely customizable PowerPoint theme that can be put to use immediately. So, download it and address the topic impactfully.
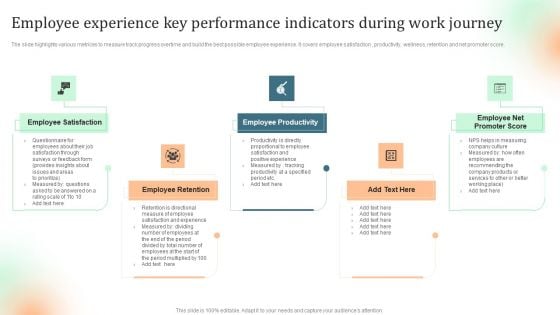
Employee Experience Key Performance Indicators During Work Journey Topics PDF
The slide highlights various metrices to measure track progress overtime and build the best possible employee experience. It covers employee satisfaction , productivity, wellness, retention and net promoter score. Presenting Employee Experience Key Performance Indicators During Work Journey Topics PDF to dispense important information. This template comprises five stages. It also presents valuable insights into the topics including Employee Productivity, Employee Retention, Employee Satisfaction. This is a completely customizable PowerPoint theme that can be put to use immediately. So, download it and address the topic impactfully.
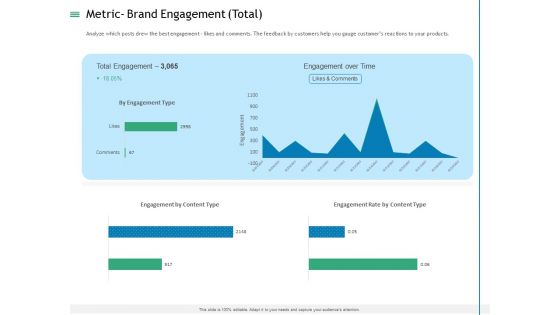
Measuring Influencer Marketing ROI Metric Brand Engagement Total Themes PDF
Analyze which posts drew the best engagement likes and comments. The feedback by customers help you gauge customers reactions to your products. Deliver an awe-inspiring pitch with this creative measuring influencer marketing roi metric brand engagement total themes pdf bundle. Topics like engagement over time, total engagement, engagement by content type can be discussed with this completely editable template. It is available for immediate download depending on the needs and requirements of the user.
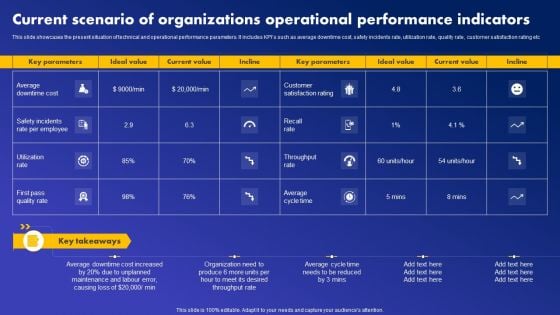
Current Scenario Of Organizations Operational Performance Indicators Professional PDF
This slide showcases the present situation of technical and operational performance parameters. It includes KPIs such as average downtime cost, safety incidents rate, utilization rate, quality rate, customer satisfaction rating etc Whether you have daily or monthly meetings, a brilliant presentation is necessary. Current Scenario Of Organizations Operational Performance Indicators Professional PDF can be your best option for delivering a presentation. Represent everything in detail using Current Scenario Of Organizations Operational Performance Indicators Professional PDF and make yourself stand out in meetings. The template is versatile and follows a structure that will cater to your requirements. All the templates prepared by Slidegeeks are easy to download and edit. Our research experts have taken care of the corporate themes as well. So, give it a try and see the results.

 Home
Home