Meter Slides
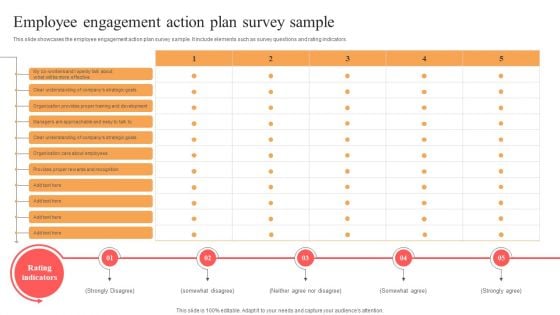
Implementing Techniques To Improve Employee Involvement Employee Engagement Action Plan Survey Sample Elements PDF
This slide showcases the employee engagement action plan survey sample. It include elements such as survey questions and rating indicators. If you are looking for a format to display your unique thoughts, then the professionally designed Implementing Techniques To Improve Employee Involvement Employee Engagement Action Plan Survey Sample Elements PDF is the one for you. You can use it as a Google Slides template or a PowerPoint template. Incorporate impressive visuals, symbols, images, and other charts. Modify or reorganize the text boxes as you desire. Experiment with shade schemes and font pairings. Alter, share or cooperate with other people on your work. Download Implementing Techniques To Improve Employee Involvement Employee Engagement Action Plan Survey Sample Elements PDF and find out how to give a successful presentation. Present a perfect display to your team and make your presentation unforgettable.
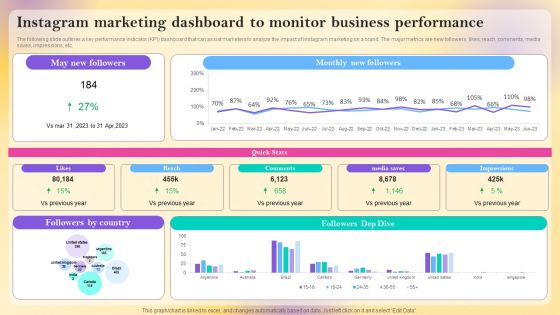
Instagram Marketing Dashboard To Monitor Business Performance Information PDF
The following slide outlines a key performance indicator KPI dashboard that can assist marketers to analyze the impact of Instagram marketing on a brand. The major metrics are new followers, likes, reach, comments, media saves, impressions, etc. This Instagram Marketing Dashboard To Monitor Business Performance Information PDF is perfect for any presentation, be it in front of clients or colleagues. It is a versatile and stylish solution for organizing your meetings. The product features a modern design for your presentation meetings. The adjustable and customizable slides provide unlimited possibilities for acing up your presentation. Slidegeeks has done all the homework before launching the product for you. So, do not wait, grab the presentation templates today
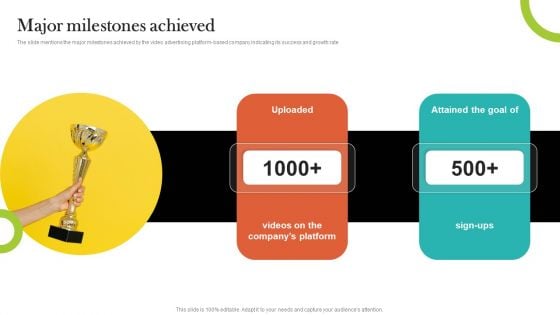
Video Promotion Service Investor Funding Elevator Pitch Deck Major Milestones Achieved Portrait PDF
The slide mentions the major milestones achieved by the video advertising platform-based company indicating its success and growth rate If you are looking for a format to display your unique thoughts, then the professionally designed Video Promotion Service Investor Funding Elevator Pitch Deck Major Milestones Achieved Portrait PDF is the one for you. You can use it as a Google Slides template or a PowerPoint template. Incorporate impressive visuals, symbols, images, and other charts. Modify or reorganize the text boxes as you desire. Experiment with shade schemes and font pairings. Alter, share or cooperate with other people on your work. Download Video Promotion Service Investor Funding Elevator Pitch Deck Major Milestones Achieved Portrait PDF and find out how to give a successful presentation. Present a perfect display to your team and make your presentation unforgettable.
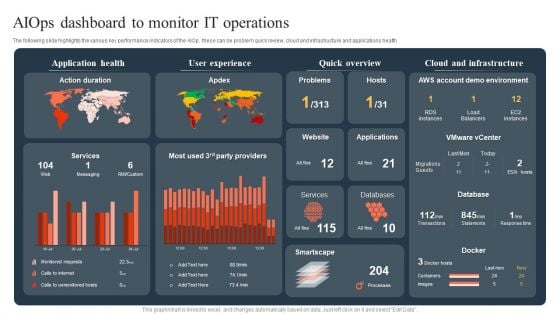
Ml And Big Data In Information Technology Processes Aiops Dashboard To Monitor IT Operations Sample PDF
The following slide highlights the various key performance indicators of the AIOp, these can be problem quick review, cloud and infrastructure and applications health If you are looking for a format to display your unique thoughts, then the professionally designed Ml And Big Data In Information Technology Processes Aiops Dashboard To Monitor IT Operations Sample PDF is the one for you. You can use it as a Google Slides template or a PowerPoint template. Incorporate impressive visuals, symbols, images, and other charts. Modify or reorganize the text boxes as you desire. Experiment with shade schemes and font pairings. Alter, share or cooperate with other people on your work. Download Ml And Big Data In Information Technology Processes Aiops Dashboard To Monitor IT Operations Sample PDF and find out how to give a successful presentation. Present a perfect display to your team and make your presentation unforgettable.
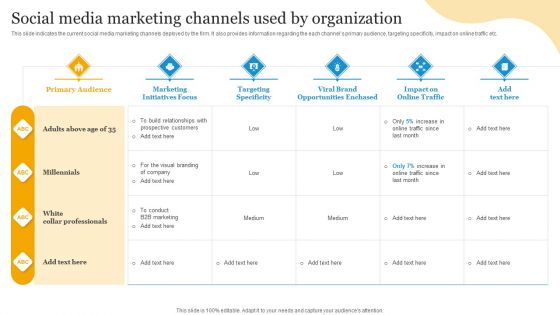
Social Media Advertising Through Twitter Social Media Marketing Channels Used By Organization Ideas PDF
This slide indicates the current social media marketing channels deployed by the firm. It also provides information regarding the each channels primary audience, targeting specificity, impact on online traffic etc. This Social Media Advertising Through Twitter Social Media Marketing Channels Used By Organization Ideas PDF is perfect for any presentation, be it in front of clients or colleagues. It is a versatile and stylish solution for organizing your meetings. The Social Media Advertising Through Twitter Social Media Marketing Channels Used By Organization Ideas PDF features a modern design for your presentation meetings. The adjustable and customizable slides provide unlimited possibilities for acing up your presentation. Slidegeeks has done all the homework before launching the product for you. So, do not wait, grab the presentation templates today
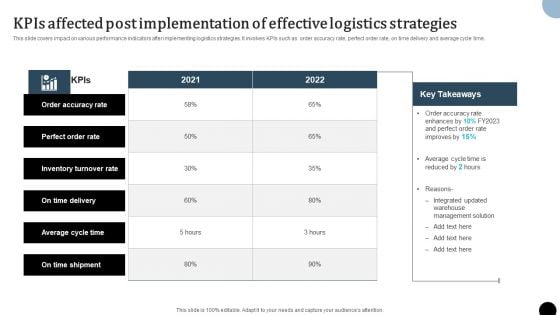
Strategy To Enhance Supply Chain Operations Kpis Affected Post Implementation Of Effective Logistics Strategies Diagrams PDF
This slide covers impact on various performance indicators after implementing logistics strategies. It involves KPIs such as order accuracy rate, perfect order rate, on time delivery and average cycle time. Presenting this PowerPoint presentation, titled Strategy To Enhance Supply Chain Operations Kpis Affected Post Implementation Of Effective Logistics Strategies Diagrams PDF, with topics curated by our researchers after extensive research. This editable presentation is available for immediate download and provides attractive features when used. Download now and captivate your audience. Presenting this Strategy To Enhance Supply Chain Operations Kpis Affected Post Implementation Of Effective Logistics Strategies Diagrams PDF. Our researchers have carefully researched and created these slides with all aspects taken into consideration. This is a completely customizable Strategy To Enhance Supply Chain Operations Kpis Affected Post Implementation Of Effective Logistics Strategies Diagrams PDF that is available for immediate downloading. Download now and make an impact on your audience. Highlight the attractive features available with our PPTs.
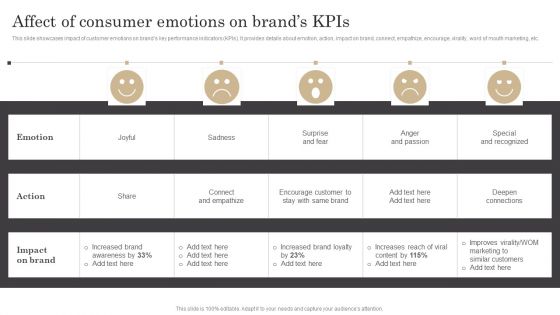
Affect Of Consumer Emotions On Brands Kpis Ppt Summary PDF
This slide showcases impact of customer emotions on brands key performance indicators KPIs. It provides details about emotion, action, impact on brand, connect, empathize, encourage, virality, word of mouth marketing, etc. If you are looking for a format to display your unique thoughts, then the professionally designed Affect Of Consumer Emotions On Brands Kpis Ppt Summary PDF is the one for you. You can use it as a Google Slides template or a PowerPoint template. Incorporate impressive visuals, symbols, images, and other charts. Modify or reorganize the text boxes as you desire. Experiment with shade schemes and font pairings. Alter, share or cooperate with other people on your work. Download Affect Of Consumer Emotions On Brands Kpis Ppt Summary PDF and find out how to give a successful presentation. Present a perfect display to your team and make your presentation unforgettable.
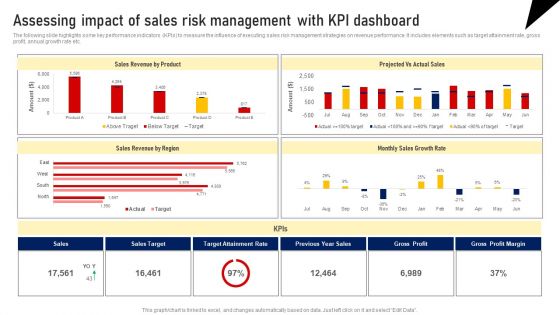
Assessing Impact Of Sales Risk Management With Kpi Dashboard Formats PDF
The following slide highlights some key performance indicators KPIs to measure the influence of executing sales risk management strategies on revenue performance. It includes elements such as target attainment rate, gross profit, annual growth rate etc. Presenting this PowerPoint presentation, titled Assessing Impact Of Sales Risk Management With Kpi Dashboard Formats PDF, with topics curated by our researchers after extensive research. This editable presentation is available for immediate download and provides attractive features when used. Download now and captivate your audience. Presenting this Assessing Impact Of Sales Risk Management With Kpi Dashboard Formats PDF. Our researchers have carefully researched and created these slides with all aspects taken into consideration. This is a completely customizable Assessing Impact Of Sales Risk Management With Kpi Dashboard Formats PDF that is available for immediate downloading. Download now and make an impact on your audience. Highlight the attractive features available with our PPTs.
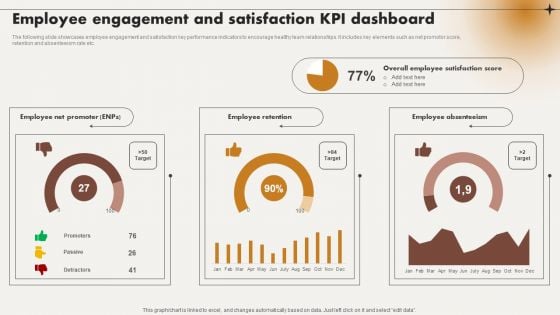
Employee Engagement And Satisfaction Kpi Dashboard Ppt Model Layouts PDF
The following slide showcases employee engagement and satisfaction key performance indicators to encourage healthy team relationships. It includes key elements such as net promotor score, retention and absenteeism rate etc. Do you know about Slidesgeeks Employee Engagement And Satisfaction Kpi Dashboard Ppt Model Layouts PDF These are perfect for delivering any kind od presentation. Using it, create PowerPoint presentations that communicate your ideas and engage audiences. Save time and effort by using our pre designed presentation templates that are perfect for a wide range of topic. Our vast selection of designs covers a range of styles, from creative to business, and are all highly customizable and easy to edit. Download as a PowerPoint template or use them as Google Slides themes.
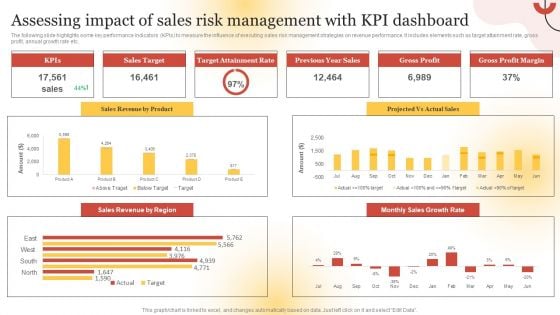
Assessing Impact Of Sales Risk Management With KPI Dashboard Guidelines PDF
The following slide highlights some key performance indicators KPIs to measure the influence of executing sales risk management strategies on revenue performance. It includes elements such as target attainment rate, gross profit, annual growth rate etc. Presenting this PowerPoint presentation, titled Assessing Impact Of Sales Risk Management With KPI Dashboard Guidelines PDF, with topics curated by our researchers after extensive research. This editable presentation is available for immediate download and provides attractive features when used. Download now and captivate your audience. Presenting this Assessing Impact Of Sales Risk Management With KPI Dashboard Guidelines PDF. Our researchers have carefully researched and created these slides with all aspects taken into consideration. This is a completely customizable Assessing Impact Of Sales Risk Management With KPI Dashboard Guidelines PDF that is available for immediate downloading. Download now and make an impact on your audience. Highlight the attractive features available with our PPTs.
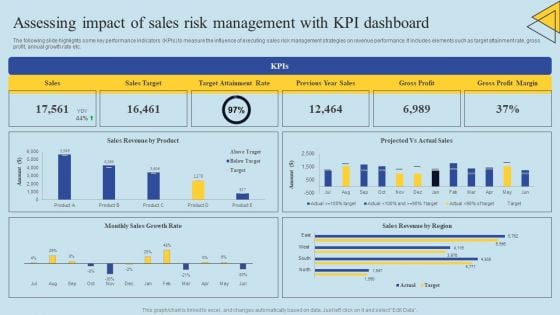
Determining Risks In Sales Administration Procedure Assessing Impact Of Sales Risk Management Sample PDF
The following slide highlights some key performance indicators KPIs to measure the influence of executing sales risk management strategies on revenue performance. It includes elements such as target attainment rate, gross profit, annual growth rate etc. If you are looking for a format to display your unique thoughts, then the professionally designed Determining Risks In Sales Administration Procedure Assessing Impact Of Sales Risk Management Sample PDF is the one for you. You can use it as a Google Slides template or a PowerPoint template. Incorporate impressive visuals, symbols, images, and other charts. Modify or reorganize the text boxes as you desire. Experiment with shade schemes and font pairings. Alter, share or cooperate with other people on your work. Download Determining Risks In Sales Administration Procedure Assessing Impact Of Sales Risk Management Sample PDF and find out how to give a successful presentation. Present a perfect display to your team and make your presentation unforgettable.
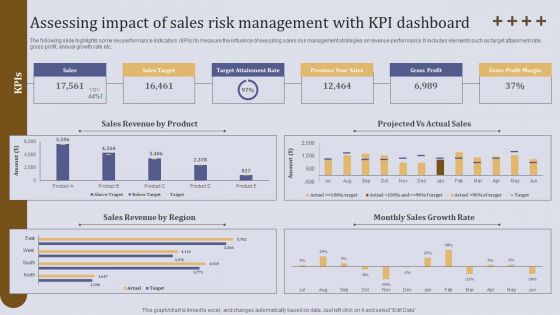
Assessing Impact Of Sales Risk Management With KPI Dashboard Ppt Professional Graphics Pictures PDF
The following slide highlights some key performance indicators KPIs to measure the influence of executing sales risk management strategies on revenue performance. It includes elements such as target attainment rate, gross profit, annual growth rate etc. Are you in need of a template that can accommodate all of your creative concepts This one is crafted professionally and can be altered to fit any style. Use it with Google Slides or PowerPoint. Include striking photographs, symbols, depictions, and other visuals. Fill, move around, or remove text boxes as desired. Test out color palettes and font mixtures. Edit and save your work, or work with colleagues. Download Assessing Impact Of Sales Risk Management With KPI Dashboard Ppt Professional Graphics Pictures PDF and observe how to make your presentation outstanding. Give an impeccable presentation to your group and make your presentation unforgettable.
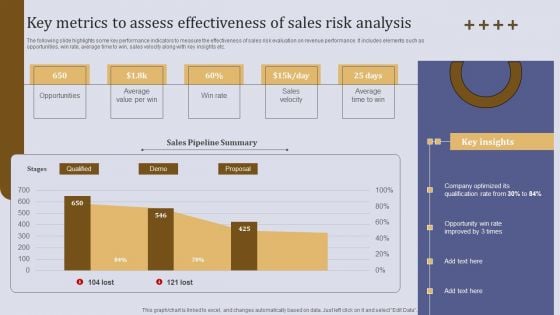
Key Metrics To Assess Effectiveness Of Sales Risk Analysis Ppt Outline Design Ideas PDF
The following slide highlights some key performance indicators to measure the effectiveness of sales risk evaluation on revenue performance. It includes elements such as opportunities, win rate, average time to win, sales velocity along with key insights etc. Retrieve professionally designed Key Metrics To Assess Effectiveness Of Sales Risk Analysis Ppt Outline Design Ideas PDF to effectively convey your message and captivate your listeners. Save time by selecting pre made slideshows that are appropriate for various topics, from business to educational purposes. These themes come in many different styles, from creative to corporate, and all of them are easily adjustable and can be edited quickly. Access them as PowerPoint templates or as Google Slides themes. You do not have to go on a hunt for the perfect presentation because Slidegeeks got you covered from everywhere.
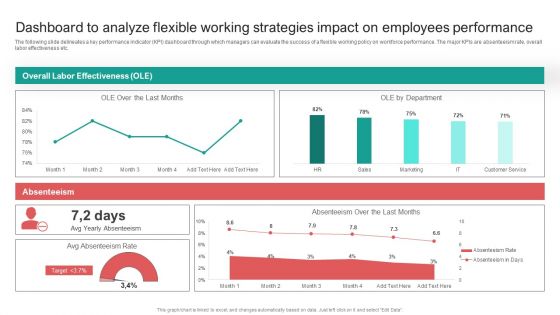
Dashboard To Analyze Flexible Working Strategies Impact On Employees Performance Infographics PDF
The following slide delineates a key performance indicator KPI dashboard through which managers can evaluate the success of a flexible working policy on workforce performance. The major KPIs are absenteeism rate, overall labor effectiveness etc. Presenting this PowerPoint presentation, titled Dashboard To Analyze Flexible Working Strategies Impact On Employees Performance Infographics PDF, with topics curated by our researchers after extensive research. This editable presentation is available for immediate download and provides attractive features when used. Download now and captivate your audience. Presenting this Dashboard To Analyze Flexible Working Strategies Impact On Employees Performance Infographics PDF. Our researchers have carefully researched and created these slides with all aspects taken into consideration. This is a completely customizable Dashboard To Analyze Flexible Working Strategies Impact On Employees Performance Infographics PDF that is available for immediate downloading. Download now and make an impact on your audience. Highlight the attractive features available with our PPTs.
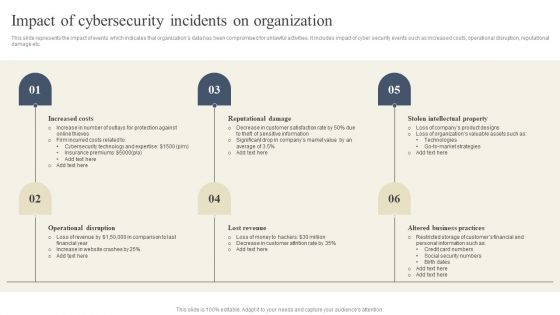
CYBER Security Breache Response Strategy Impact Of Cybersecurity Incidents On Organization Template PDF
This slide represents the impact of events which indicates that organizations data has been compromised for unlawful activities. It includes impact of cyber security events such as increased costs, operational disruption, reputational damage etc. Presenting this PowerPoint presentation, titled CYBER Security Breache Response Strategy Impact Of Cybersecurity Incidents On Organization Template PDF, with topics curated by our researchers after extensive research. This editable presentation is available for immediate download and provides attractive features when used. Download now and captivate your audience. Presenting this CYBER Security Breache Response Strategy Impact Of Cybersecurity Incidents On Organization Template PDF. Our researchers have carefully researched and created these slides with all aspects taken into consideration. This is a completely customizable CYBER Security Breache Response Strategy Impact Of Cybersecurity Incidents On Organization Template PDF that is available for immediate downloading. Download now and make an impact on your audience. Highlight the attractive features available with our PPTs.
Formulating Branding Strategy To Enhance Revenue And Sales Kpis To Measure The Success Rate Of Advertising Icons PDF
The following slide outlines multiple key performance indicators used by the marketer to evaluate the effectiveness of an online advertisement campaign. The KPIs are likes, comments, shares, clickthrough rate CTR, open rate, bounce rate, article views, audience engagement rate and subscriber growth. Do you have to make sure that everyone on your team knows about any specific topic I yes, then you should give Formulating Branding Strategy To Enhance Revenue And Sales Kpis To Measure The Success Rate Of Advertising Icons PDF a try. Our experts have put a lot of knowledge and effort into creating this impeccable Formulating Branding Strategy To Enhance Revenue And Sales Kpis To Measure The Success Rate Of Advertising Icons PDF. You can use this template for your upcoming presentations, as the slides are perfect to represent even the tiniest detail. You can download these templates from the Slidegeeks website and these are easy to edit. So grab these today.
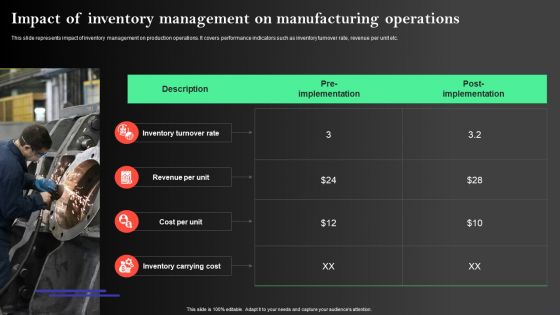
Manufacturing Operations Management Process Impact Of Inventory Management On Manufacturing Download PDF
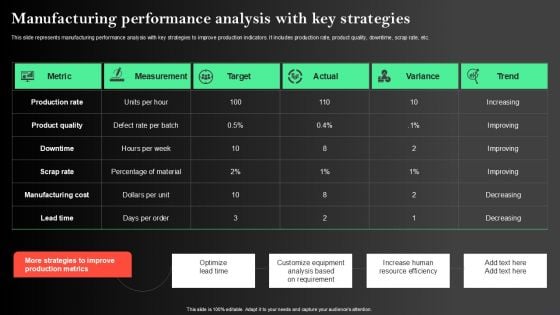
Manufacturing Operations Management Process Manufacturing Performance Analysis Inspiration PDF
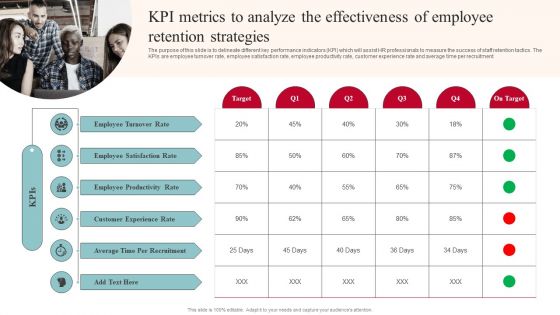
KPI Metrics To Analyze The Effectiveness Of Employee Retention Strategies Sample PDF
The purpose of this slide is to delineate different key performance indicators KPI which will assist HR professionals to measure the success of staff retention tactics. The KPIs are employee turnover rate, employee satisfaction rate, employee productivity rate, customer experience rate and average time per recruitment This KPI Metrics To Analyze The Effectiveness Of Employee Retention Strategies Sample PDF is perfect for any presentation, be it in front of clients or colleagues. It is a versatile and stylish solution for organizing your meetings. The KPI Metrics To Analyze The Effectiveness Of Employee Retention Strategies Sample PDF features a modern design for your presentation meetings. The adjustable and customizable slides provide unlimited possibilities for acing up your presentation. Slidegeeks has done all the homework before launching the product for you. So, do not wait, grab the presentation templates today

Increasing Consumer Engagement With Database Key Metrics To Measure Success Sample PDF
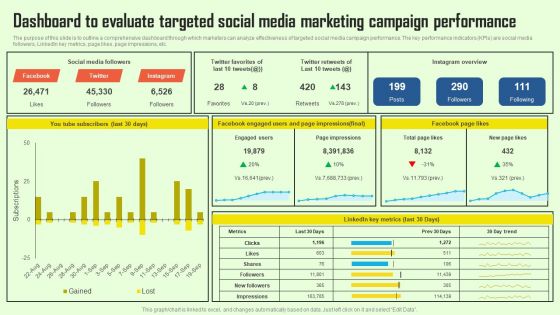
Increasing Consumer Engagement With Database Dashboard To Evaluate Targeted Social Media Portrait PDF
The purpose of this slide is to outline a comprehensive dashboard through which marketers can analyze effectiveness of targeted social media campaign performance. The key performance indicators KPIs are social media followers, LinkedIn key metrics, page likes, page impressions, etc. If you are looking for a format to display your unique thoughts, then the professionally designed Increasing Consumer Engagement With Database Dashboard To Evaluate Targeted Social Media Portrait PDF is the one for you. You can use it as a Google Slides template or a PowerPoint template. Incorporate impressive visuals, symbols, images, and other charts. Modify or reorganize the text boxes as you desire. Experiment with shade schemes and font pairings. Alter, share or cooperate with other people on your work. Download Increasing Consumer Engagement With Database Dashboard To Evaluate Targeted Social Media Portrait PDF and find out how to give a successful presentation. Present a perfect display to your team and make your presentation unforgettable.
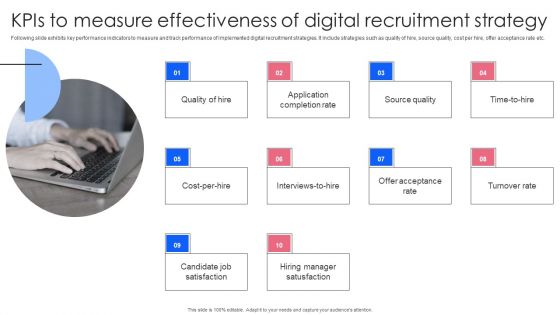
Effective Guide To Build Strong Online Hiring Strategy Kpis To Measure Effectiveness Of Digital Recruitment Introduction PDF
Following slide exhibits key performance indicators to measure and track performance of implemented digital recruitment strategies. It include strategies such as quality of hire, source quality, cost per hire, offer acceptance rate etc. Slidegeeks is one of the best resources for PowerPoint templates. You can download easily and regulate Effective Guide To Build Strong Online Hiring Strategy Kpis To Measure Effectiveness Of Digital Recruitment Introduction PDF for your personal presentations from our wonderful collection. A few clicks is all it takes to discover and get the most relevant and appropriate templates. Use our Templates to add a unique zing and appeal to your presentation and meetings. All the slides are easy to edit and you can use them even for advertisement purposes.
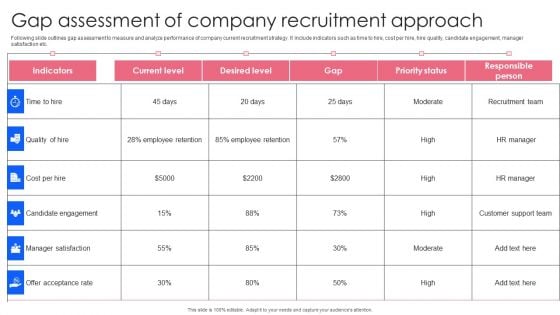
Effective Guide To Build Strong Online Hiring Strategy Gap Assessment Of Company Recruitment Approach Brochure PDF
Following slide outlines gap assessment to measure and analyze performance of company current recruitment strategy. It include indicators such as time to hire, cost per hire, hire quality, candidate engagement, manager satisfaction etc. Are you in need of a template that can accommodate all of your creative concepts This one is crafted professionally and can be altered to fit any style. Use it with Google Slides or PowerPoint. Include striking photographs, symbols, depictions, and other visuals. Fill, move around, or remove text boxes as desired. Test out color palettes and font mixtures. Edit and save your work, or work with colleagues. Download Effective Guide To Build Strong Online Hiring Strategy Gap Assessment Of Company Recruitment Approach Brochure PDF and observe how to make your presentation outstanding. Give an impeccable presentation to your group and make your presentation unforgettable.
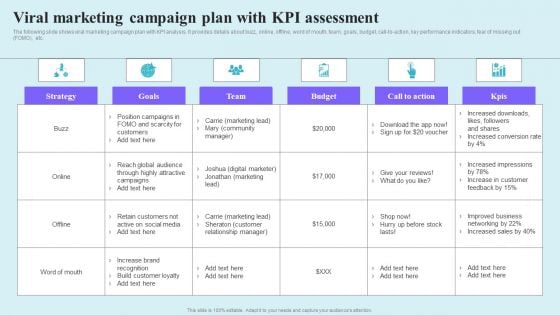
Go Viral Campaign Strategies To Increase Engagement Viral Marketing Campaign Plan With KPI Assessment Clipart PDF
The following slide shows viral marketing campaign plan with KPI analysis. It provides details about buzz, online, offline, word of mouth, team, goals, budget, call-to-action, key performance indicators, fear of missing out FOMO, etc. Do you know about Slidesgeeks Go Viral Campaign Strategies To Increase Engagement Viral Marketing Campaign Plan With KPI Assessment Clipart PDF. These are perfect for delivering any kind od presentation. Using it, create PowerPoint presentations that communicate your ideas and engage audiences. Save time and effort by using our pre designed presentation templates that are perfect for a wide range of topic. Our vast selection of designs covers a range of styles, from creative to business, and are all highly customizable and easy to edit. Download as a PowerPoint template or use them as Google Slides themes.
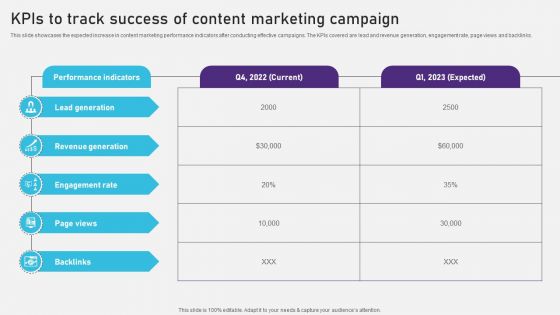
Advertising Campaign Optimization Process Kpis To Track Success Of Content Marketing Campaign Diagrams PDF
This slide showcases the expected increase in content marketing performance indicators after conducting effective campaigns. The KPIs covered are lead and revenue generation, engagement rate, page views and backlinks. Presenting this PowerPoint presentation, titled Advertising Campaign Optimization Process Kpis To Track Success Of Content Marketing Campaign Diagrams PDF, with topics curated by our researchers after extensive research. This editable presentation is available for immediate download and provides attractive features when used. Download now and captivate your audience. Presenting this Advertising Campaign Optimization Process Kpis To Track Success Of Content Marketing Campaign Diagrams PDF. Our researchers have carefully researched and created these slides with all aspects taken into consideration. This is a completely customizable Advertising Campaign Optimization Process Kpis To Track Success Of Content Marketing Campaign Diagrams PDF that is available for immediate downloading. Download now and make an impact on your audience. Highlight the attractive features available with our PPTs.
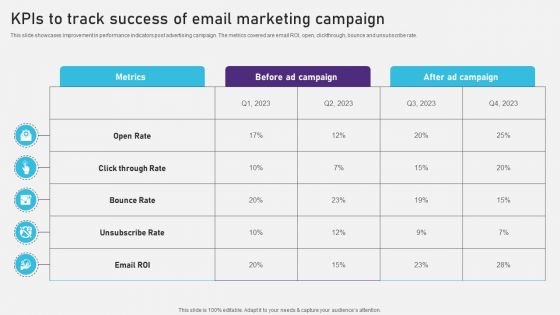
Advertising Campaign Optimization Process Kpis To Track Success Of Email Marketing Campaign Graphics PDF
This slide showcases improvement in performance indicators post advertising campaign. The metrics covered are email ROI, open, clickthrough, bounce and unsubscribe rate. Here you can discover an assortment of the finest PowerPoint and Google Slides templates. With these templates, you can create presentations for a variety of purposes while simultaneously providing your audience with an eye catching visual experience. Download Advertising Campaign Optimization Process Kpis To Track Success Of Email Marketing Campaign Graphics PDF to deliver an impeccable presentation. These templates will make your job of preparing presentations much quicker, yet still, maintain a high level of quality. Slidegeeks has experienced researchers who prepare these templates and write high quality content for you. Later on, you can personalize the content by editing the Advertising Campaign Optimization Process Kpis To Track Success Of Email Marketing Campaign Graphics PDF.
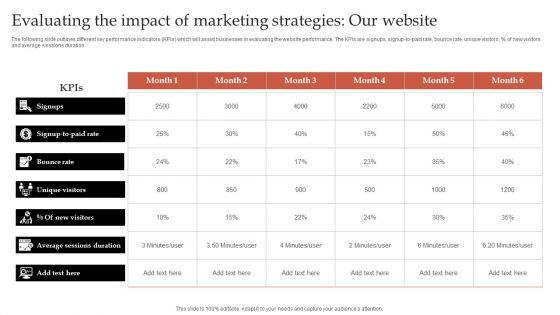
Formulating Robust Branding Strategies To Effectively Combat Evaluating The Impact Of Our Website Designs PDF
The following slide outlines different key performance indicators KPIs which will assist businesses in evaluating the website performance. The KPIs are signups, signup-to-paid rate, bounce rate, unique visitors, percent of new visitors and average sessions duration. Are you in need of a template that can accommodate all of your creative concepts This one is crafted professionally and can be altered to fit any style. Use it with Google Slides or PowerPoint. Include striking photographs, symbols, depictions, and other visuals. Fill, move around, or remove text boxes as desired. Test out color palettes and font mixtures. Edit and save your work, or work with colleagues. Download Formulating Robust Branding Strategies To Effectively Combat Evaluating The Impact Of Our Website Designs PDF and observe how to make your presentation outstanding. Give an impeccable presentation to your group and make your presentation unforgettable.
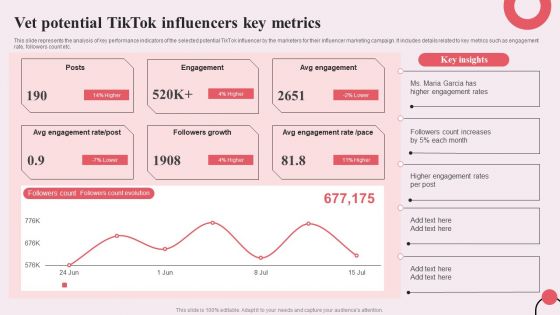
Tiktok Digital Marketing Campaign Vet Potential Tiktok Influencers Key Metrics Download PDF
This slide represents the analysis of key performance indicators of the selected potential TikTok influencer by the marketers for their influencer marketing campaign. It includes details related to key metrics such as engagement rate, followers count etc. Do you have to make sure that everyone on your team knows about any specific topic I yes, then you should give Tiktok Digital Marketing Campaign Vet Potential Tiktok Influencers Key Metrics Download PDF a try. Our experts have put a lot of knowledge and effort into creating this impeccable Tiktok Digital Marketing Campaign Vet Potential Tiktok Influencers Key Metrics Download PDF. You can use this template for your upcoming presentations, as the slides are perfect to represent even the tiniest detail. You can download these templates from the Slidegeeks website and these are easy to edit. So grab these today
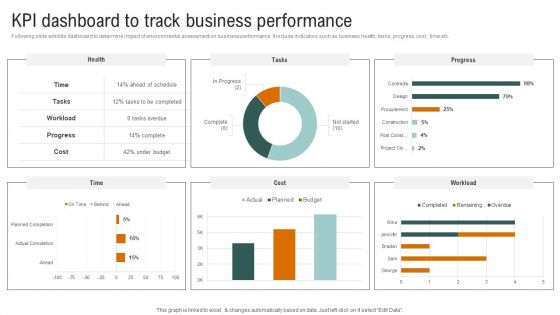
Kpi Dashboard To Track Business Performance Portrait PDF
Following slide exhibits dashboard to determine impact of environmental assessment on business performance. It include indicators such as business health, tasks, progress, cost , time etc. Do you know about Slidesgeeks Kpi Dashboard To Track Business Performance Portrait PDF These are perfect for delivering any kind od presentation. Using it, create PowerPoint presentations that communicate your ideas and engage audiences. Save time and effort by using our pre-designed presentation templates that are perfect for a wide range of topic. Our vast selection of designs covers a range of styles, from creative to business, and are all highly customizable and easy to edit. Download as a PowerPoint template or use them as Google Slides themes.
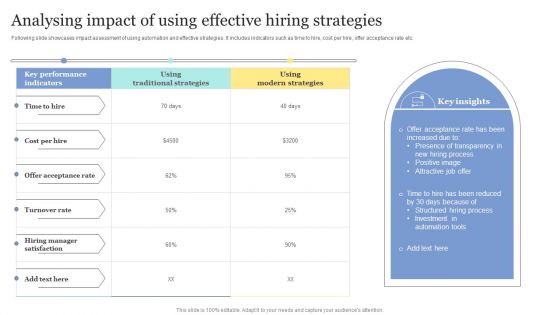
Strategic Approaches To Efficient Candidate Selection Analysing Impact Of Using Effective Hiring Strategies Infographics PDF
Following slide showcases impact assessment of using automation and effective strategies. It includes indicators such as time to hire, cost per hire, offer acceptance rate etc. Retrieve professionally designed Strategic Approaches To Efficient Candidate Selection Analysing Impact Of Using Effective Hiring Strategies Infographics PDF to effectively convey your message and captivate your listeners. Save time by selecting pre-made slideshows that are appropriate for various topics, from business to educational purposes. These themes come in many different styles, from creative to corporate, and all of them are easily adjustable and can be edited quickly. Access them as PowerPoint templates or as Google Slides themes. You do not have to go on a hunt for the perfect presentation because Slidegeeks got you covered from everywhere.
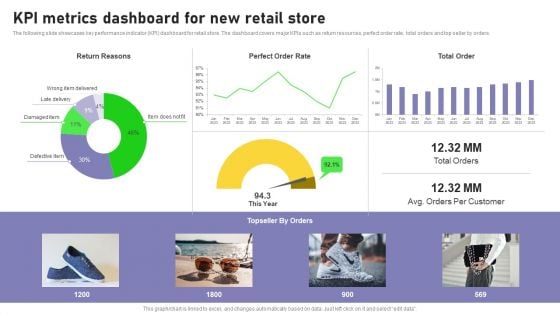
Retail Outlet Opening To Enhance Product Sale Kpi Metrics Dashboard For New Retail Store Mockup PDF
The following slide showcases key performance indicator KPI dashboard for retail store. The dashboard covers major KPIs such as return resources, perfect order rate, total orders and top seller by orders. Do you have to make sure that everyone on your team knows about any specific topic I yes, then you should give Retail Outlet Opening To Enhance Product Sale Kpi Metrics Dashboard For New Retail Store Mockup PDF a try. Our experts have put a lot of knowledge and effort into creating this impeccable Retail Outlet Opening To Enhance Product Sale Kpi Metrics Dashboard For New Retail Store Mockup PDF. You can use this template for your upcoming presentations, as the slides are perfect to represent even the tiniest detail. You can download these templates from the Slidegeeks website and these are easy to edit. So grab these today.
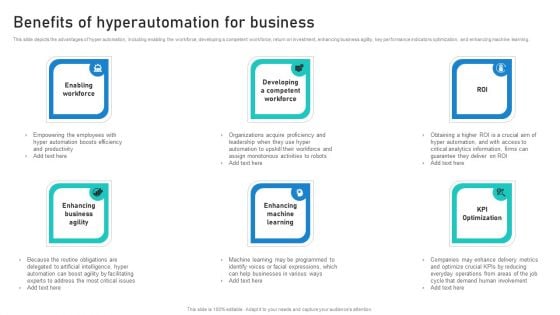
Intelligent Process Automation IPA Benefits Of Hyperautomation For Business Structure PDF
This slide depicts the advantages of hyper automation, including enabling the workforce, developing a competent workforce, return on investment, enhancing business agility, key performance indicators optimization, and enhancing machine learning. If you are looking for a format to display your unique thoughts, then the professionally designed Intelligent Process Automation IPA Benefits Of Hyperautomation For Business Structure PDF is the one for you. You can use it as a Google Slides template or a PowerPoint template. Incorporate impressive visuals, symbols, images, and other charts. Modify or reorganize the text boxes as you desire. Experiment with shade schemes and font pairings. Alter, share or cooperate with other people on your work. Download Intelligent Process Automation IPA Benefits Of Hyperautomation For Business Structure PDF and find out how to give a successful presentation. Present a perfect display to your team and make your presentation unforgettable.
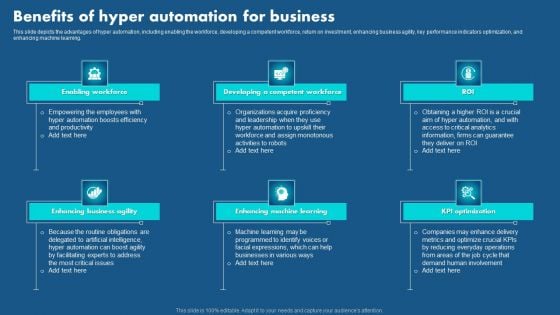
Role Of Hyperautomation In Redefining Business Benefits Of Hyper Automation Elements PDF
This slide depicts the advantages of hyper automation, including enabling the workforce, developing a competent workforce, return on investment, enhancing business agility, key performance indicators optimization, and enhancing machine learning. Are you in need of a template that can accommodate all of your creative concepts This one is crafted professionally and can be altered to fit any style. Use it with Google Slides or PowerPoint. Include striking photographs, symbols, depictions, and other visuals. Fill, move around, or remove text boxes as desired. Test out color palettes and font mixtures. Edit and save your work, or work with colleagues. Download Role Of Hyperautomation In Redefining Business Benefits Of Hyper Automation Elements PDF and observe how to make your presentation outstanding. Give an impeccable presentation to your group and make your presentation unforgettable.
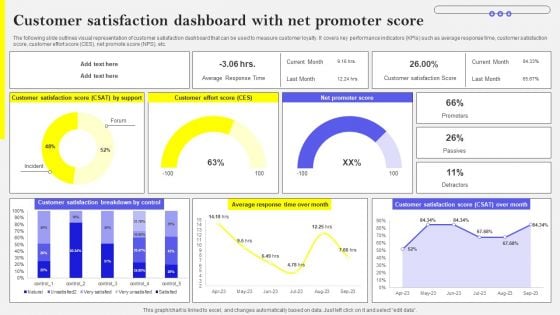
Customer Satisfaction Dashboard With Net Promoter Score Introduction PDF
The following slide outlines visual representation of customer satisfaction dashboard that can be used to measure customer loyalty. It covers key performance indicators KPIs such as average response time, customer satisfaction score, customer effort score CES, net promote score NPS, etc. Do you have to make sure that everyone on your team knows about any specific topic I yes, then you should give Customer Satisfaction Dashboard With Net Promoter Score Introduction PDF a try. Our experts have put a lot of knowledge and effort into creating this impeccable Customer Satisfaction Dashboard With Net Promoter Score Introduction PDF. You can use this template for your upcoming presentations, as the slides are perfect to represent even the tiniest detail. You can download these templates from the Slidegeeks website and these are easy to edit. So grab these today
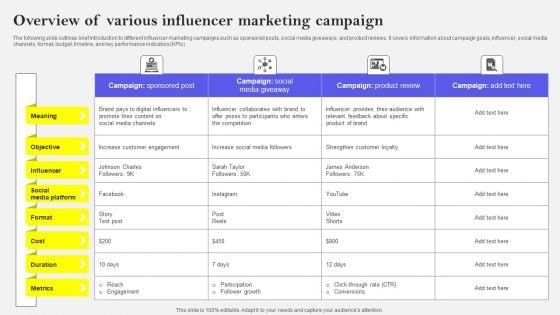
Overview Of Various Influencer Marketing Campaign Information PDF
The following slide outlines brief introduction to different influencer marketing campaigns such as sponsored posts, social media giveaways, and product reviews. It covers information about campaign goals, influencer, social media channels, format, budget, timeline, and key performance indicators KPIs Do you know about Slidesgeeks Overview Of Various Influencer Marketing Campaign Information PDF These are perfect for delivering any kind od presentation. Using it, create PowerPoint presentations that communicate your ideas and engage audiences. Save time and effort by using our pre-designed presentation templates that are perfect for a wide range of topic. Our vast selection of designs covers a range of styles, from creative to business, and are all highly customizable and easy to edit. Download as a PowerPoint template or use them as Google Slides themes.
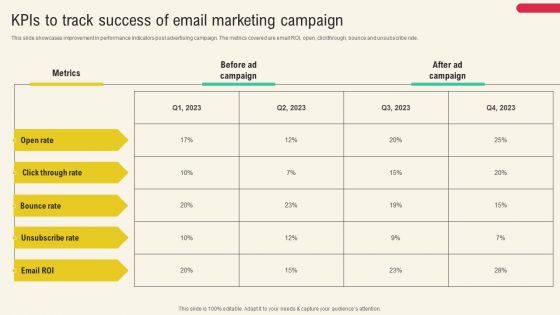
Client Acquisition Through Marketing Campaign Kpis To Track Success Of Email Marketing Campaign Themes PDF
This slide showcases improvement in performance indicators post advertising campaign. The metrics covered are email ROI, open, clickthrough, bounce and unsubscribe rate. Are you in need of a template that can accommodate all of your creative concepts This one is crafted professionally and can be altered to fit any style. Use it with Google Slides or PowerPoint. Include striking photographs, symbols, depictions, and other visuals. Fill, move around, or remove text boxes as desired. Test out color palettes and font mixtures. Edit and save your work, or work with colleagues. Download Client Acquisition Through Marketing Campaign Kpis To Track Success Of Email Marketing Campaign Themes PDF and observe how to make your presentation outstanding. Give an impeccable presentation to your group and make your presentation unforgettable.

Fitness Product Promotion Campaigns Sports Marketing Strategies Impact On Major Kpis Introduction PDF
This slide showcases major impact of sports marketing strategies on key performance indicators KPIs. It provides details about sponsored brand sales, return on investment ROI, customer base, merchandise, social media followers, etc. Retrieve professionally designed Fitness Product Promotion Campaigns Sports Marketing Strategies Impact On Major Kpis Introduction PDF to effectively convey your message and captivate your listeners. Save time by selecting pre-made slideshows that are appropriate for various topics, from business to educational purposes. These themes come in many different styles, from creative to corporate, and all of them are easily adjustable and can be edited quickly. Access them as PowerPoint templates or as Google Slides themes. You do not have to go on a hunt for the perfect presentation because Slidegeeks got you covered from everywhere.
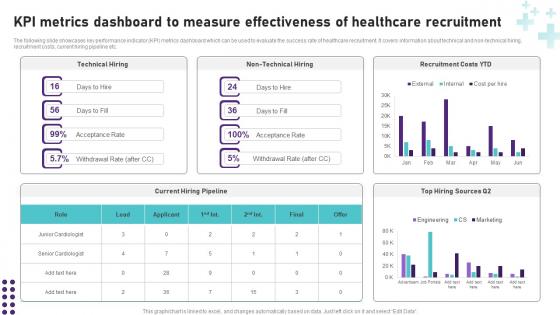
KPI Metrics Dashboard To Measure Healthcare Operational Areas Healthcare Brochure PDF
Retrieve professionally designed KPI Metrics Dashboard To Measure Healthcare Operational Areas Healthcare Brochure PDF to effectively convey your message and captivate your listeners. Save time by selecting pre-made slideshows that are appropriate for various topics, from business to educational purposes. These themes come in many different styles, from creative to corporate, and all of them are easily adjustable and can be edited quickly. Access them as PowerPoint templates or as Google Slides themes. You do not have to go on a hunt for the perfect presentation because Slidegeeks got you covered from everywhere. The following slide showcases key performance indicator KPI metrics dashboard which can be used to evaluate the success rate of healthcare recruitment. It covers information about technical and non-technical hiring, recruitment costs, current hiring pipeline etc.
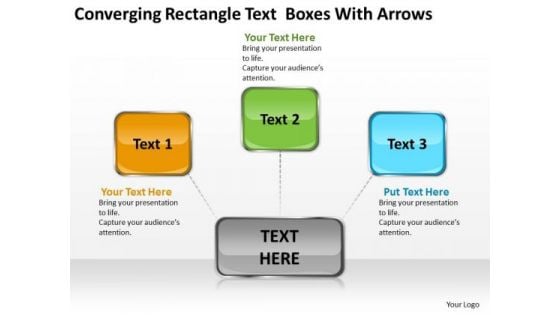
Converging Rectangle Text Boxes With Arrows Diagram Software PowerPoint Templates
We present our converging rectangle text boxes with arrows Diagram Software PowerPoint templates.Present our Advertising PowerPoint Templates because they represent the proress in our lives. Use our Boxes PowerPoint Templates because stable ideas are the building blocks of a sucessful structure. Present our Business PowerPoint Templates because you have had a great year or so business wise. It is time to celebrate the efforts of your team. Download and present our Shapes PowerPoint Templates because you can Bullet-point your thoughts and ideas to profitably accomplish every step of every stage along the way. Present our Symbol PowerPoint Templates because they are the indicators of the path you have in mind.Use these PowerPoint slides for presentations relating to abstract, arrows, art, banner, block, blue, box, bright, business, color, colorful, concept, conceptual, connection, creative, cube, design, different, element, empty, form, frame, graphic, green, group, idea, illustration, match, message, order, part, piece, place, puzzle, red, shape, solution, special, speech, square, strategy, symbol, template, text, usable, vector, web, website. The prominent colors used in the PowerPoint template are Yellow, Green, Blue. Customers tell us our converging rectangle text boxes with arrows Diagram Software PowerPoint templates are Glamorous. PowerPoint presentation experts tell us our blue PowerPoint templates and PPT Slides are Perfect. People tell us our converging rectangle text boxes with arrows Diagram Software PowerPoint templates are Playful. People tell us our banner PowerPoint templates and PPT Slides are Nifty. Customers tell us our converging rectangle text boxes with arrows Diagram Software PowerPoint templates are Classic. People tell us our bright PowerPoint templates and PPT Slides are Delightful. Make the greatest presentation ever with our Converging Rectangle Text Boxes With Arrows Diagram Software PowerPoint Templates. Dont waste time struggling with PowerPoint. Let us do it for you.
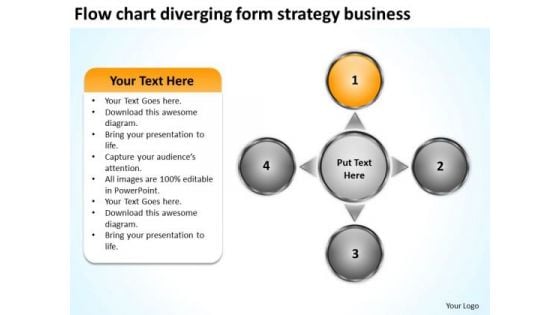
Form Strategy Business PowerPoint Presentations Cycle Arrow Process Templates
We present our form strategy business powerpoint presentations Cycle Arrow Process templates.Download our Circle Charts PowerPoint Templates because honesty is the best policy has an ardent follower in you. Use our Arrows PowerPoint Templates because they are the indicators of the path you have in mind. Download our Business PowerPoint Templates because your fledgling career is in the chrysallis stage. Nurture it and watch it grow into a beautiful butterfly. Download our Shapes PowerPoint Templates because you will be able to Highlight your ideas broad-based on strong fundamentals and illustrate how they step by step acheive the set growth factor. Download and present our Flow Charts PowerPoint Templates because you have an idea of which you are sure.Use these PowerPoint slides for presentations relating to Analysis, Analyze, Background, Blank, Business, Businessman, Center, Central, Chart, Component, Concept, Connect, Core, Decentralize, Diagram, Disperse, Disseminate, Distribute, Divide, Education, Element, Empty, Expand, Flow, Gist, Group, Industry, Link, Management, Manager, Part, Plan, Process, Scatter, Separate, Spread, Strategy, Support, Surround, Template, Transfer. The prominent colors used in the PowerPoint template are Orange, Gray, Black. We assure you our form strategy business powerpoint presentations Cycle Arrow Process templates are Quaint. We assure you our Center PowerPoint templates and PPT Slides are designed by a team of presentation professionals. Customers tell us our form strategy business powerpoint presentations Cycle Arrow Process templates are the best it can get when it comes to presenting. Presenters tell us our Center PowerPoint templates and PPT Slides are Perfect. You can be sure our form strategy business powerpoint presentations Cycle Arrow Process templates are Energetic. The feedback we get is that our Central PowerPoint templates and PPT Slides are Stunning. Our Form Strategy Business PowerPoint Presentations Cycle Arrow Process Templates can be bewitching. Put your audience under your spell.
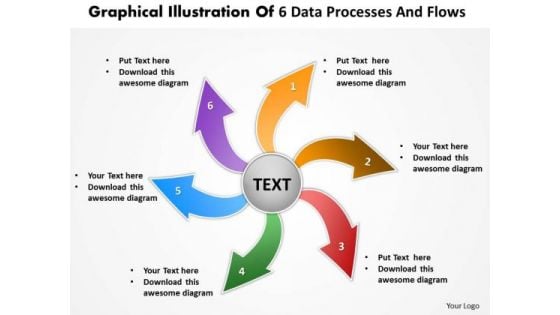
Illustration Of 6 Data Processes And Flows Circular Chart PowerPoint Templates
We present our illustration of 6 data processes and flows Circular Chart PowerPoint templates.Present our Arrows PowerPoint Templates because they are the indicators of the path you have in mind. Download our Circle Charts PowerPoint Templates because the ideas and plans are on your finger tips. Present our Shapes PowerPoint Templates because it shows how one can contribute to the overall feeling of well-being. Download our Business PowerPoint Templates because it will demonstrate the strength of character under severe stress. Shine the torch ahead and bring the light to shine on all. Present our Flow Charts PowerPoint Templates because you know what it takes to keep it fit and healthy.Use these PowerPoint slides for presentations relating to achievement, aim, around, arrow, blue, center, chart, circle, circular, connection, cursor, cycle, cyclic, decisions, direction, flow, graph, graphic, group, icon, illustration, isolated, loop, motion, movement, point, pointer, recycle, recycling, reuse, ring, rotation, round, sign, spin, symbol, target, team, teamwork, technology, turn, wheel, white. The prominent colors used in the PowerPoint template are Red, Green, Blue. Presenters tell us our illustration of 6 data processes and flows Circular Chart PowerPoint templates are Perfect. You can be sure our arrow PowerPoint templates and PPT Slides are Ultra. Professionals tell us our illustration of 6 data processes and flows Circular Chart PowerPoint templates are Nifty. People tell us our center PowerPoint templates and PPT Slides are Handsome. People tell us our illustration of 6 data processes and flows Circular Chart PowerPoint templates are Youthful. Professionals tell us our around PowerPoint templates and PPT Slides are Fancy. Address problems with our Illustration Of 6 Data Processes And Flows Circular Chart PowerPoint Templates. Download without worries with our money back guaranteee.
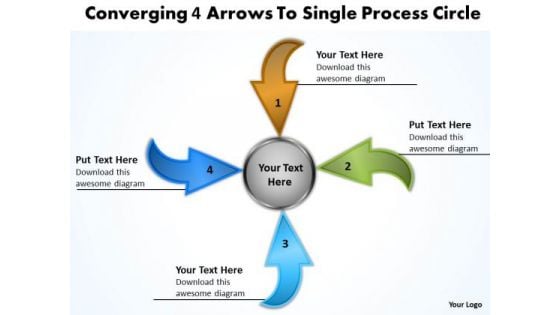
Converging 4 Arrows To Single Process Circle Pie Diagram PowerPoint Templates
We present our converging 4 arrows to single process circle Pie Diagram PowerPoint templates.Download and present our Arrows PowerPoint Templates because you will be able to Highlight your ideas broad-based on strong fundamentals and illustrate how they step by step acheive the set growth factor. Use our Circle Charts PowerPoint Templates because you can present your opinions in this field using our impressive templates. Download our Shapes PowerPoint Templates because displaying your ideas and highlighting your ability will accelerate the growth of your company and yours. Download and present our Business PowerPoint Templates because your ideas too are pinpointedly focused on you goals. Present our Flow Charts PowerPoint Templates because you can Unravel the desired and essential elements of your overall strategy.Use these PowerPoint slides for presentations relating to arrow, arrowheads, badge, banner, blue, button, cerulean, cobalt, colored, colorful, connection, cursor, cyan, design element, designator, directional, download, emblem, gray shadow, green, icon, indicator, interface, internet, link, load, magenta, marker, matted, menu tool, navigation panel, next, orientation, page site, pictogram, pink, pointer, red, right, satined, sign, signpost, smooth, symbol, upload, vector illustration, web, web 2.0, white background. The prominent colors used in the PowerPoint template are Blue, Brown, Green. Presenters tell us our converging 4 arrows to single process circle Pie Diagram PowerPoint templates are Nostalgic. You can be sure our banner PowerPoint templates and PPT Slides are Radiant. Professionals tell us our converging 4 arrows to single process circle Pie Diagram PowerPoint templates are Stylish. People tell us our colored PowerPoint templates and PPT Slides will generate and maintain the level of interest you desire. They will create the impression you want to imprint on your audience. People tell us our converging 4 arrows to single process circle Pie Diagram PowerPoint templates are Handsome. Professionals tell us our banner PowerPoint templates and PPT Slides are Efficient. Carry your thoughts on our Converging 4 Arrows To Single Process Circle Pie Diagram PowerPoint Templates. They will take them that much further.
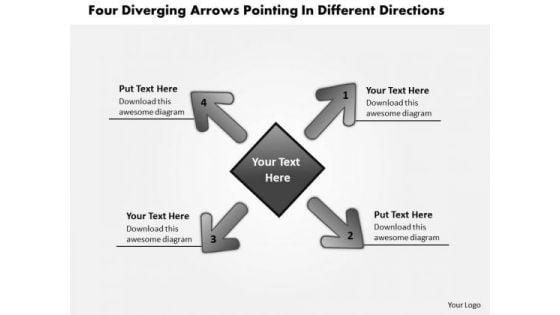
Pointing Different Directions Relative Circular Flow Arrow Process PowerPoint Templates
We present our pointing different directions Relative Circular Flow Arrow Process PowerPoint templates.Download and present our Process and Flows PowerPoint Templates because they will Amplify your views and plans for getting ahead and then the manner in which you intend staying ahead. Present our Business PowerPoint Templates because a lot of dissimilar elements needing to gel to strike the deal. Download and present our Shapes PowerPoint Templates because they enhance the essence of your viable ideas. Present our Arrows PowerPoint Templates because our templates emphasises your views. Use our Marketing PowerPoint Templates because you have a handle on all the targets, a master of the game, the experienced and consummate juggler.Use these PowerPoint slides for presentations relating to Arrowheads, blue, button,cerulean, circle, circulation, cobalt,colorful, cyan, cycle, element,emblem, grayshadow, green,icon, indicator, interface, internet, label,link, load, marker, motion, movement,navigationpanel, next, orientation, pagsite, pink, pointer, previous, process, reload, rotation, satined, sign, signpost,smooth, sticker, sticky, symbol. The prominent colors used in the PowerPoint template are Gray, Black, White. Customers tell us our pointing different directions Relative Circular Flow Arrow Process PowerPoint templates are Great. We assure you our cobalt PowerPoint templates and PPT Slides are Romantic. PowerPoint presentation experts tell us our pointing different directions Relative Circular Flow Arrow Process PowerPoint templates are Dazzling. People tell us our circulation PowerPoint templates and PPT Slides are Luxurious. We assure you our pointing different directions Relative Circular Flow Arrow Process PowerPoint templates are Wistful. Use our cobalt PowerPoint templates and PPT Slides are Festive. Aspire to any fancy with our Pointing Different Directions Relative Circular Flow Arrow Process PowerPoint Templates. Put your thoughts in creative mode.
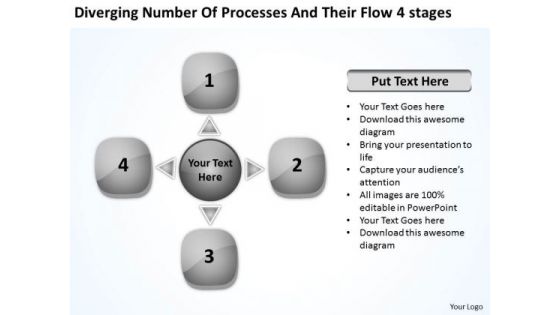
Number Of Processes And Their Stages Cycle Motion Chart PowerPoint Templates
We present our number of processes and their stages Cycle Motion Chart PowerPoint templates.Download our Symbol PowerPoint Templates because they are the indicators of the path you have in mind. Download and present our Arrows PowerPoint Templates because you can get advantage to prioritise your ideas. Present our Business PowerPoint Templates because you too have got the framework of your companys growth in place. Download our Shapes PowerPoint Templates because knowledge is power goes the popular saying. Download and present our Process and Flows PowerPoint Templates because the ideas and plans are on your finger tips.Use these PowerPoint slides for presentations relating to Abstract, Arrows, Blank, Business, Central, Centralized, Chart, Circle, Circular, Circulation, Concept, Conceptual, Converging, Design, Diagram, Empty, Executive, Five, Icon, Idea, Illustration, Management, Map, Mapping, Organization, Outwards, Pointing, Procedure, Process, Relationship, Strategy, Template. The prominent colors used in the PowerPoint template are White, Gray, Black. Use our number of processes and their stages Cycle Motion Chart PowerPoint templates are Festive. We assure you our Centralized PowerPoint templates and PPT Slides are Beautiful. People tell us our number of processes and their stages Cycle Motion Chart PowerPoint templates provide great value for your money. Be assured of finding the best projection to highlight your words. PowerPoint presentation experts tell us our Blank PowerPoint templates and PPT Slides are Colorful. PowerPoint presentation experts tell us our number of processes and their stages Cycle Motion Chart PowerPoint templates are Endearing. Use our Blank PowerPoint templates and PPT Slides are Stunning. Consolidate successes with our Number Of Processes And Their Stages Cycle Motion Chart PowerPoint Templates. Download without worries with our money back guaranteee.
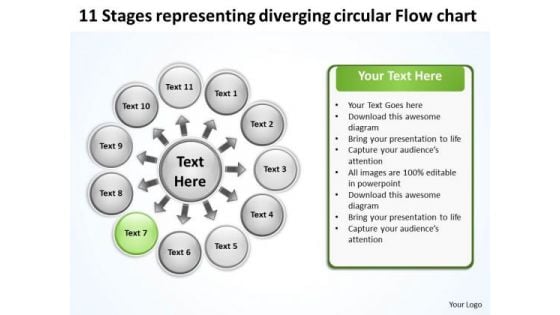
Representing Diverging Circular Flow Chart Relative Cycle Arrow Diagram PowerPoint Templates
We present our representing diverging circular flow chart Relative Cycle Arrow Diagram PowerPoint templates.Download and present our Ring charts PowerPoint Templates because you can present your opinions in this field using our impressive templates. Download and present our Circle charts PowerPoint Templates because stable ideas are the building blocks of a sucessful structure. Use our Business PowerPoint Templates because it illustrates the city with a lasting tryst with resilience. You epitomise the qualities that give your city its fame. Present our Marketing PowerPoint Templates because customer satisfaction is a mantra of the marketplace. Building a loyal client base is an essential element of your business. Use our Process and Flows PowerPoint Templates because all elements of the venture are equally critical.Use these PowerPoint slides for presentations relating to Button,cerulean, circle, circulation, cobalt,colorful, cyan, cycle, element,emblem, grayshadow, green,icon, indicator, interface, internet, label,link, load, marker, motion, movement,navigationpanel, next, orientation, pagsite, pink, pointer, previous, process, reload, rotation, satined, sign, signpost,smooth, sticker, sticky, symbol. The prominent colors used in the PowerPoint template are Green, Black, White. Customers tell us our representing diverging circular flow chart Relative Cycle Arrow Diagram PowerPoint templates are designed by a team of presentation professionals. We assure you our element PowerPoint templates and PPT Slides are readymade to fit into any presentation structure. PowerPoint presentation experts tell us our representing diverging circular flow chart Relative Cycle Arrow Diagram PowerPoint templates are Detailed. People tell us our circle PowerPoint templates and PPT Slides are Striking. We assure you our representing diverging circular flow chart Relative Cycle Arrow Diagram PowerPoint templates are Endearing. Use our circulation PowerPoint templates and PPT Slides are Delightful. Cross continents with our Representing Diverging Circular Flow Chart Relative Cycle Arrow Diagram PowerPoint Templates. Your thoughts will cover the earth.
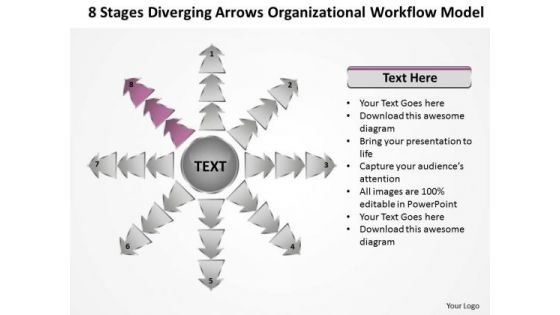
Arrows Organizational Workflow Model Ppt Circular Layout Process PowerPoint Templates
We present our arrows organizational workflow model ppt Circular Layout Process PowerPoint templates.Present our Process and Flows PowerPoint Templates because it helps you to clearly delegate the different tasks along with their necessary resources and responsibilities. Download and present our Arrows PowerPoint Templates because you can Highlight the key components of your entire manufacturing/ business process. Present our Shapes PowerPoint Templates because you will be able to Highlight these individual targets and the paths to their achievement. Download our Business PowerPoint Templates because it will demonstrate the strength of character under severe stress. Shine the torch ahead and bring the light to shine on all. Download and present our Signs PowerPoint Templates because they are the indicators of the path you have in mind.Use these PowerPoint slides for presentations relating to Arrow, background, banner,blue, , choice, concept,creative, design, direction, flow, four,illustration, infographic, instruction, label,layout, manual, marketing, modern, next,number, offer, one, options, order, pointer, process, product,promotion, sequence, simple, special,step, symbol. The prominent colors used in the PowerPoint template are Blue, Black, White. You can be sure our arrows organizational workflow model ppt Circular Layout Process PowerPoint templates are Stylish. PowerPoint presentation experts tell us our banner PowerPoint templates and PPT Slides are Magnificent. Professionals tell us our arrows organizational workflow model ppt Circular Layout Process PowerPoint templates are Second to none. Presenters tell us our choice PowerPoint templates and PPT Slides are Great. Professionals tell us our arrows organizational workflow model ppt Circular Layout Process PowerPoint templates have awesome images to get your point across. Customers tell us our design PowerPoint templates and PPT Slides are Awesome. Give your thoughts a fair complexion. Brighten it up with our the colors of our Arrows Organizational Workflow Model Ppt Circular Layout Process PowerPoint Templates.
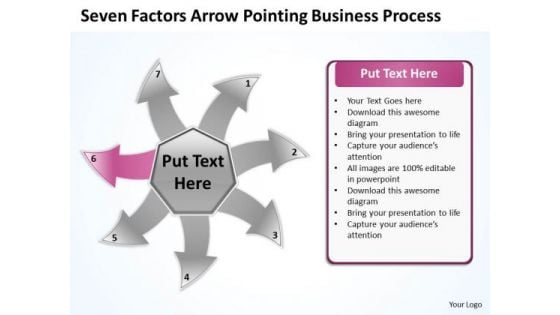
Free Business PowerPoint Templates Process Cycle Circular Flow Layout Chart
We present our free business powerpoint templates process cycle Circular Flow Layout Chart.Use our Communication PowerPoint Templates because the plans are in your head, stage by stage, year by year. Present our Arrows PowerPoint Templates because you have had your share of being a goldfish in a small bowl.you are ready to launch out and spread your wings. Download and present our Circle Charts PowerPoint Templates because they are the indicators of the path you have in mind. Download our Business PowerPoint Templates because your thoughts are pointed and sharp as arrows. Present our Shapes PowerPoint Templates because your group can behave steady in the top bracket.Use these PowerPoint slides for presentations relating to Arrow, Bio, Business, Chart, Circle, Concept, Control, Cycle, Design, Development, Diagram, Eco, Ecology, Environmental, Evaluate, Flow, Flowchart, Fresh, Graphic, Green, Idea, Infographic, Iterative, Life, Lifecycle, Management, Method, Model, Natural, Nature, Organic, Process, Quality, Recycle, Research, Schema, Spiral, Step, Strategy, Success, System. The prominent colors used in the PowerPoint template are Pink, Gray, White. Customers tell us our free business powerpoint templates process cycle Circular Flow Layout Chart are Adorable. Customers tell us our Concept PowerPoint templates and PPT Slides are Tranquil. Presenters tell us our free business powerpoint templates process cycle Circular Flow Layout Chart are Romantic. PowerPoint presentation experts tell us our Design PowerPoint templates and PPT Slides are Tranquil. Customers tell us our free business powerpoint templates process cycle Circular Flow Layout Chart are Efficient. Professionals tell us our Chart PowerPoint templates and PPT Slides provide you with a vast range of viable options. Select the appropriate ones and just fill in your text. Our Free Business PowerPoint Templates Process Cycle Circular Flow Layout Chart remain within bounds. They will never exceed their brief.
Ppt Template Continous Way To Show 4 Stages Firm Process 1 Design
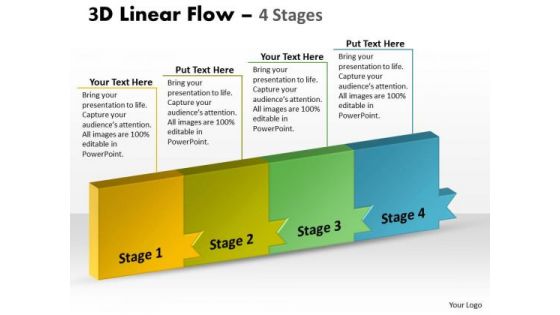
We present our PPT template continuous way to show 4 stages firm Process 1 design. Use our Advertising PowerPoint Templates because, they are indicators of the path you have in mind. Use our Business PowerPoint Templates because; now imprint them on the minds of your audience via our slides. Use our Shapes PowerPoint Templates because, Goal Pie Chart Template: - You have a clear vision of the cake you want. Use our Process and Flows PowerPoint Templates because, transmit your thoughts via our slides and prod your team to action. Use our Finance PowerPoint Templates because, the core of any organization is the people who work for it. Use these PowerPoint slides for presentations relating to Abstract, Algorithm, Arrow, Business, Chart, Color, Connection, Design, Development, Direction, Element, Flow, Graph, Linear, Management, Model, Organization, Plan, Process, Program, Section, Segment, Set, Sign, Solution, Strategy, Symbol, Technology. The prominent colors used in the PowerPoint template are Yellow, Blue, and Green Deliver education with our Ppt Template Continous Way To Show 4 Stages Firm Process 1 Design. Cover the course in a systematic manner.

Steps To Calculate Inflation Using Asset Price Indices Strategies For Inflation A Tactical Guide Fin SS V
This slide shows step by step process which can be used to calculate inflation rate by using asset price indices. It includes stages such as select year, identify assets,, collect price data and interpret results. From laying roadmaps to briefing everything in detail, our templates are perfect for you. You can set the stage with your presentation slides. All you have to do is download these easy-to-edit and customizable templates. Steps To Calculate Inflation Using Asset Price Indices Strategies For Inflation A Tactical Guide Fin SS V will help you deliver an outstanding performance that everyone would remember and praise you for. Do download this presentation today. This slide shows step by step process which can be used to calculate inflation rate by using asset price indices. It includes stages such as select year, identify assets,, collect price data and interpret results.
Finance Metrics Dashboard Indicating Account Receivable And Account Payable Demonstration PDF
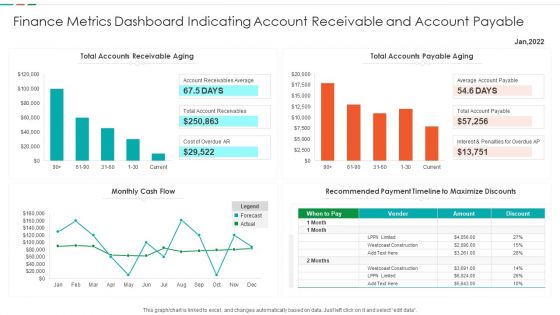
This graph or chart is linked to excel, and changes automatically based on data. Just left click on it and select edit data. Showcasing this set of slides titled Finance Metrics Dashboard Indicating Account Receivable And Account Payable Demonstration PDF. The topics addressed in these templates are Total Accounts Receivable, Total Accounts Payable, Recommended Payment Timeline, Monthly Cash Flow. All the content presented in this PPT design is completely editable. Download it and make adjustments in color, background, font etc. as per your unique business setting.
Service Level Agreement KPI Dashboard Indicating Violation Count And Overdue Requests Diagrams PDF
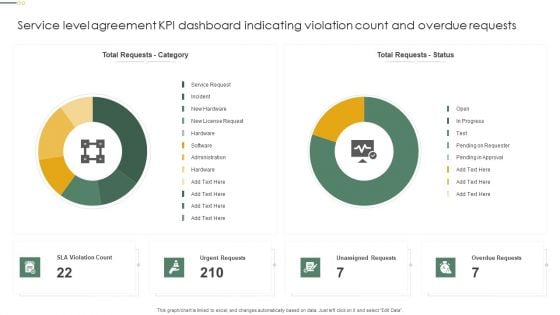
This graph or chart is linked to excel, and changes automatically based on data. Just left click on it and select Edit Data. Showcasing this set of slides titled Service Level Agreement KPI Dashboard Indicating Violation Count And Overdue Requests Diagrams PDF. The topics addressed in these templates are Total Requests Category, Total Requests Status, Urgent Requests. All the content presented in this PPT design is completely editable. Download it and make adjustments in color, background, font etc. as per your unique business setting.

Key Performance Indicators For Power Strategy Template Pdf
This slide shows key performance indicators for energy plan. The purpose of this slide is to highlight main key performance indicators that should be considered for performance measurement. It include indicators such as facility wide units and process unit levels, etc.Pitch your topic with ease and precision using this Key Performance Indicators For Power Strategy Template Pdf This layout presents information on Electricity Consumption, Process Measuring, Temperature Steam Systems It is also available for immediate download and adjustment. So, changes can be made in the color, design, graphics or any other component to create a unique layout. This slide shows key performance indicators for energy plan. The purpose of this slide is to highlight main key performance indicators that should be considered for performance measurement. It include indicators such as facility wide units and process unit levels, etc.
Various Signs Indicating Unfit Quality Control Guide For Food PPT Template
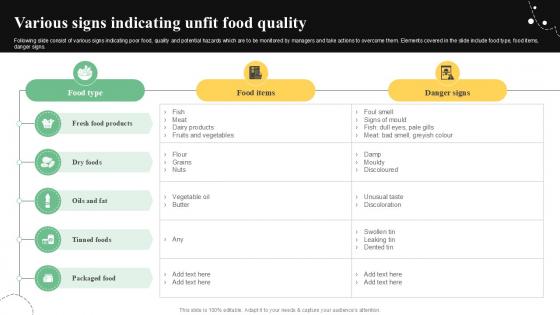
Following slide consist of various signs indicating poor food, quality and potential hazards which are to be monitored by managers and take actions to overcome them. Elements covered in the slide include food type, food items, danger signs. Formulating a presentation can take up a lot of effort and time, so the content and message should always be the primary focus. The visuals of the PowerPoint can enhance the presenters message, so our Various Signs Indicating Unfit Quality Control Guide For Food PPT Template was created to help save time. Instead of worrying about the design, the presenter can concentrate on the message while our designers work on creating the ideal templates for whatever situation is needed. Slidegeeks has experts for everything from amazing designs to valuable content, we have put everything into Various Signs Indicating Unfit Quality Control Guide For Food PPT Template Following slide consist of various signs indicating poor food, quality and potential hazards which are to be monitored by managers and take actions to overcome them. Elements covered in the slide include food type, food items, danger signs.
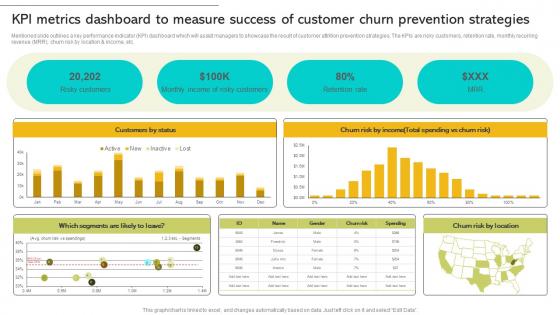
Implementing Strategies To Enhance Kpi Metrics Dashboard To Measure Success Of Customer Churn Ideas PDF
Mentioned slide outlines a key performance indicator KPI dashboard which will assist managers to showcase the result of customer attrition prevention strategies. The KPIs are risky customers, retention rate, monthly recurring revenue MRR, churn risk by location and income, etc. Explore a selection of the finest Implementing Strategies To Enhance Kpi Metrics Dashboard To Measure Success Of Customer Churn Ideas PDF here. With a plethora of professionally designed and pre-made slide templates, you can quickly and easily find the right one for your upcoming presentation. You can use our Implementing Strategies To Enhance Kpi Metrics Dashboard To Measure Success Of Customer Churn Ideas PDF to effectively convey your message to a wider audience. Slidegeeks has done a lot of research before preparing these presentation templates. The content can be personalized and the slides are highly editable. Grab templates today from Slidegeeks. Mentioned slide outlines a key performance indicator KPI dashboard which will assist managers to showcase the result of customer attrition prevention strategies. The KPIs are risky customers, retention rate, monthly recurring revenue MRR, churn risk by location and income, etc.
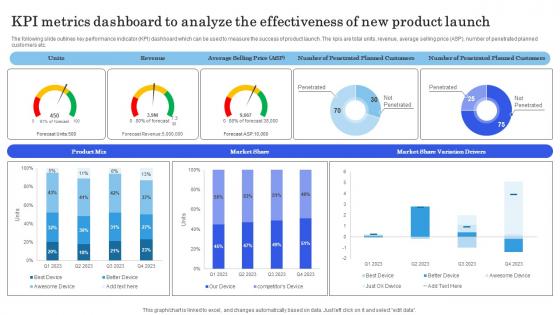
Launching New Commodity Kpi Metrics Dashboard To Analyze The Effectiveness Demonstration Pdf
The following slide outlines key performance indicator KPI dashboard which can be used to measure the success of product launch. The kpis are total units, revenue, average selling price ASP, number of penetrated planned customers etc. Explore a selection of the finest Launching New Commodity Kpi Metrics Dashboard To Analyze The Effectiveness Demonstration Pdf here. With a plethora of professionally designed and pre-made slide templates, you can quickly and easily find the right one for your upcoming presentation. You can use our Launching New Commodity Kpi Metrics Dashboard To Analyze The Effectiveness Demonstration Pdf to effectively convey your message to a wider audience. Slidegeeks has done a lot of research before preparing these presentation templates. The content can be personalized and the slides are highly editable. Grab templates today from Slidegeeks. The following slide outlines key performance indicator KPI dashboard which can be used to measure the success of product launch. The kpis are total units, revenue, average selling price ASP, number of penetrated planned customers etc.
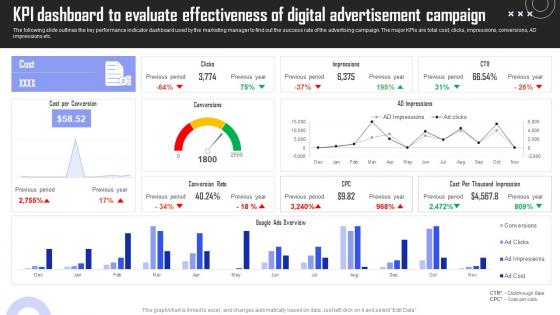
KPI Dashboard Evaluate Brand Building Techniques To Gain Competitive Edge Template Pdf
The following slide outlines the key performance indicator dashboard used by the marketing manager to find out the success rate of the advertising campaign. The major KPIs are total cost, clicks, impressions, conversions, AD impressions etc. Explore a selection of the finest KPI Dashboard Evaluate Brand Building Techniques To Gain Competitive Edge Template Pdf here. With a plethora of professionally designed and pre made slide templates, you can quickly and easily find the right one for your upcoming presentation. You can use our KPI Dashboard Evaluate Brand Building Techniques To Gain Competitive Edge Template Pdf to effectively convey your message to a wider audience. Slidegeeks has done a lot of research before preparing these presentation templates. The content can be personalized and the slides are highly editable. Grab templates today from Slidegeeks. The following slide outlines the key performance indicator dashboard used by the marketing manager to find out the success rate of the advertising campaign. The major KPIs are total cost, clicks, impressions, conversions, AD impressions etc.
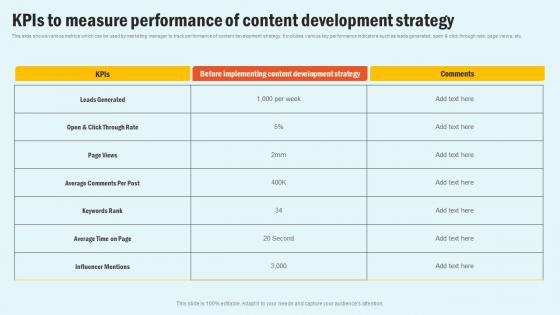
KPIs To Measure Performance Of Enhancing Website Performance With Search Engine Content Elements Pdf
This slide shows various metrics which can be used by marketing manager to track performance of content development strategy. It includes various key performance indicators such as leads generated, open and click through rate, page views, etc. Explore a selection of the finest KPIs To Measure Performance Of Enhancing Website Performance With Search Engine Content Elements Pdf here. With a plethora of professionally designed and pre made slide templates, you can quickly and easily find the right one for your upcoming presentation. You can use our KPIs To Measure Performance Of Enhancing Website Performance With Search Engine Content Elements Pdf to effectively convey your message to a wider audience. Slidegeeks has done a lot of research before preparing these presentation templates. The content can be personalized and the slides are highly editable. Grab templates today from Slidegeeks. This slide shows various metrics which can be used by marketing manager to track performance of content development strategy. It includes various key performance indicators such as leads generated, open and click through rate, page views, etc.
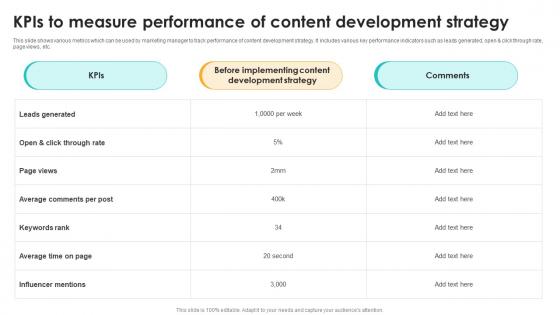
Kpis To Measure Performance Of Content Development Strategy Seo Content Plan To Drive Strategy SS V
This slide shows various metrics which can be used by marketing manager to track performance of content development strategy. It includes various key performance indicators such as leads generated, open and click through rate, page views, etc. Explore a selection of the finest Kpis To Measure Performance Of Content Development Strategy Seo Content Plan To Drive Strategy SS V here. With a plethora of professionally designed and pre-made slide templates, you can quickly and easily find the right one for your upcoming presentation. You can use our Kpis To Measure Performance Of Content Development Strategy Seo Content Plan To Drive Strategy SS V to effectively convey your message to a wider audience. Slidegeeks has done a lot of research before preparing these presentation templates. The content can be personalized and the slides are highly editable. Grab templates today from Slidegeeks. This slide shows various metrics which can be used by marketing manager to track performance of content development strategy. It includes various key performance indicators such as leads generated, open and click through rate, page views, etc.
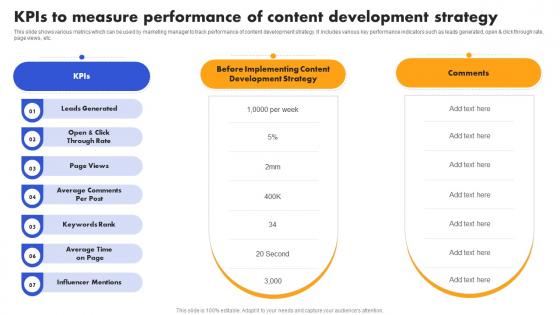
SEO Strategy To Improve ROI Kpis To Measure Performance Of Content Strategy SS V
This slide shows various metrics which can be used by marketing manager to track performance of content development strategy. It includes various key performance indicators such as leads generated, open and click through rate, page views, etc. Explore a selection of the finest SEO Strategy To Improve ROI Kpis To Measure Performance Of Content Strategy SS V here. With a plethora of professionally designed and pre-made slide templates, you can quickly and easily find the right one for your upcoming presentation. You can use our SEO Strategy To Improve ROI Kpis To Measure Performance Of Content Strategy SS V to effectively convey your message to a wider audience. Slidegeeks has done a lot of research before preparing these presentation templates. The content can be personalized and the slides are highly editable. Grab templates today from Slidegeeks. This slide shows various metrics which can be used by marketing manager to track performance of content development strategy. It includes various key performance indicators such as leads generated, open and click through rate, page views, etc.
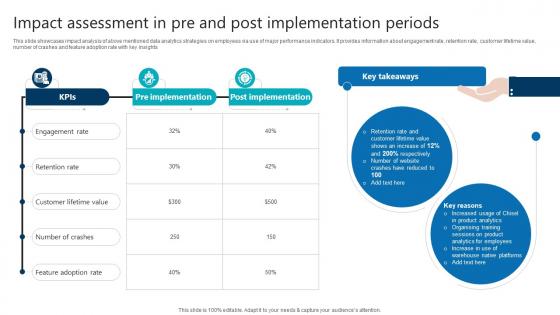
Impact Assessment In Pre And Post Implementation Periods Product Analytics Implementation Data Analytics V
This slide showcases impact analysis of above mentioned data analytics strategies on employees via use of major performance indicators. It provides information about engagement rate, retention rate, customer lifetime value, number of crashes and feature adoption rate with key insights Explore a selection of the finest Impact Assessment In Pre And Post Implementation Periods Product Analytics Implementation Data Analytics V here. With a plethora of professionally designed and pre-made slide templates, you can quickly and easily find the right one for your upcoming presentation. You can use our Impact Assessment In Pre And Post Implementation Periods Product Analytics Implementation Data Analytics V to effectively convey your message to a wider audience. Slidegeeks has done a lot of research before preparing these presentation templates. The content can be personalized and the slides are highly editable. Grab templates today from Slidegeeks. This slide showcases impact analysis of above mentioned data analytics strategies on employees via use of major performance indicators. It provides information about engagement rate, retention rate, customer lifetime value, number of crashes and feature adoption rate with key insights


 Continue with Email

 Home
Home


