Meter Slides
Managing Organization Finance Financial Analysis Of The Companys Capital Structure Ppt Icon Show PDF
Presenting this set of slides with name managing organization finance financial analysis of the companys capital structure ppt icon show pdf. This is a six stage process. The stages in this process are value of beta less than one indicates a stocks risk less than market risk, rate of return require for an equity investment, rate of amount a company pays on its current debt. This is a completely editable PowerPoint presentation and is available for immediate download. Download now and impress your audience.
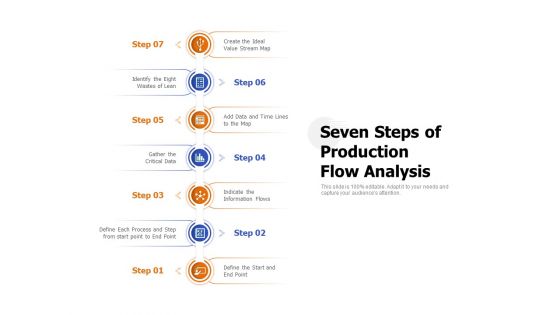
Seven Steps Of Production Flow Analysis Ppt PowerPoint Presentation Portfolio Information PDF
Presenting this set of slides with name seven steps of production flow analysis ppt powerpoint presentation portfolio information pdf. This is a aeven stage process. The stages in this process are create the ideal value stream map, identify the eight wastes of lean, add data and time lines to the map, gather the critical data, indicate the information flows, define each process and step from start point to end point, define the start and end point. This is a completely editable PowerPoint presentation and is available for immediate download. Download now and impress your audience.
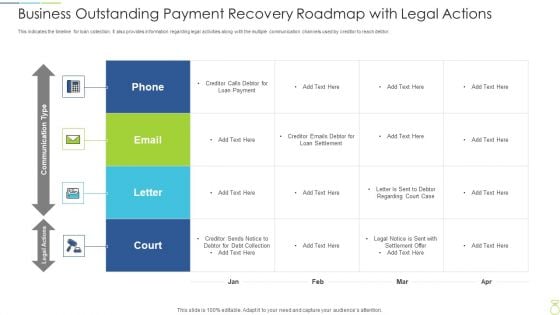
Business Outstanding Payment Recovery Roadmap With Legal Actions Structure PDF
This indicates the timeline for loan collection. It also provides information regarding legal activities along with the multiple communication channels used by creditor to reach debtor. Showcasing this set of slides titled business outstanding payment recovery roadmap with legal actions structure pdf. The topics addressed in these templates are business outstanding payment recovery roadmap with legal actions. All the content presented in this PPT design is completely editable. Download it and make adjustments in color, background, font etc. as per your unique business setting.
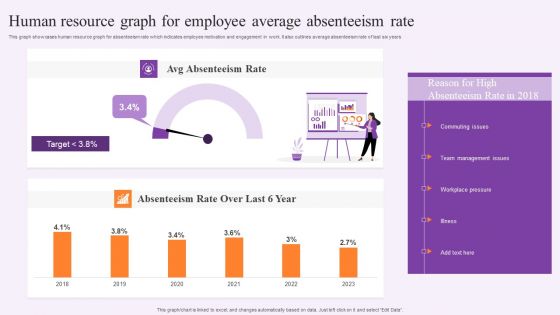
Human Resource Graph For Employee Average Absenteeism Rate Information PDF
This graph showcases human resource graph for absenteeism rate which indicates employee motivation and engagement in work. It also outlines average absenteeism rate of last six years. Showcasing this set of slides titled Human Resource Graph For Employee Average Absenteeism Rate Information PDF. The topics addressed in these templates are Team Management Issues, Workplace Pressure, Absenteeism Rate. All the content presented in this PPT design is completely editable. Download it and make adjustments in color, background, font etc. as per your unique business setting.
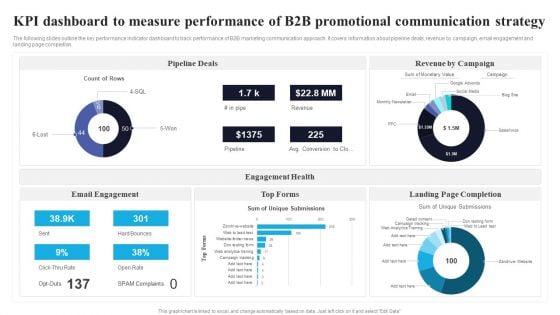
KPI Dashboard To Measure Performance Of B2B Promotional Communication Strategy Mockup PDF
The following slides outline the key performance indicator dashboard to track performance of B2B marketing communication approach. It covers information about pipeline deals, revenue by campaign, email engagement and landing page completion. Pitch your topic with ease and precision using this KPI Dashboard To Measure Performance Of B2B Promotional Communication Strategy Mockup PDF. This layout presents information on Pipeline Deals, Engagement Health, Email Engagement. It is also available for immediate download and adjustment. So, changes can be made in the color, design, graphics or any other component to create a unique layout.
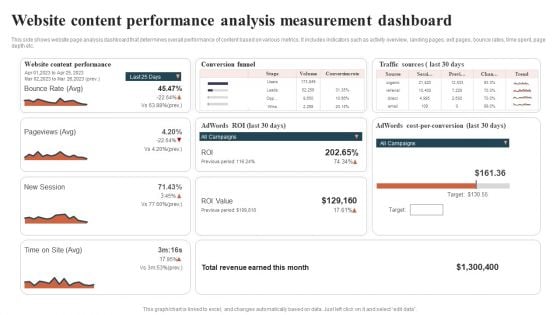
Website Content Performance Analysis Measurement Dashboard Guidelines PDF
This side shows website page analysis dashboard that determines overall performance of content based on various metrics. It includes indicators such as activity overview, landing pages, exit pages, bounce rates, time spent, page depth etc. Showcasing this set of slides titled Website Content Performance Analysis Measurement Dashboard Guidelines PDF. The topics addressed in these templates are Conversion Funnel, Traffic Sources, Total Revenue. All the content presented in this PPT design is completely editable. Download it and make adjustments in color, background, font etc. as per your unique business setting.
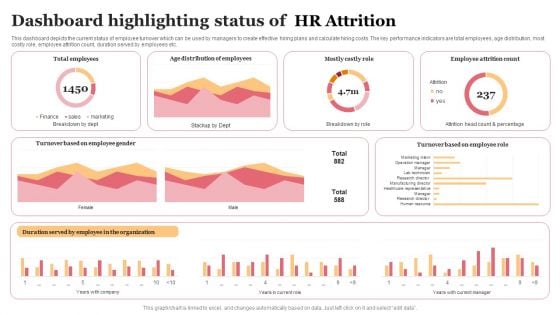
Dashboard Highlighting Status Of Clipart PDF
This dashboard depicts the current status of employee turnover which can be used by managers to create effective hiring plans and calculate hiring costs. The key performance indicators are total employees, age distribution, most costly role, employee attrition count, duration served by employees etc. Showcasing this set of slides titled Dashboard Highlighting Status Of Clipart PDF. The topics addressed in these templates are Dashboard Highlighting Status, HR Attrition. All the content presented in this PPT design is completely editable. Download it and make adjustments in color, background, font etc. as per your unique business setting.
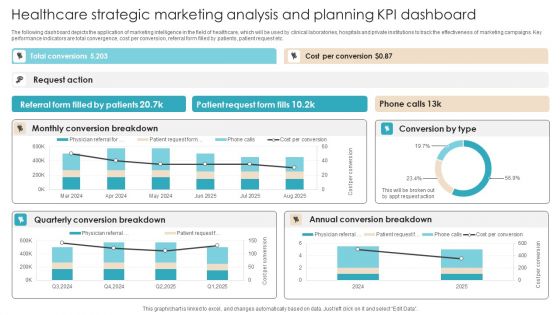
Healthcare Strategic Marketing Analysis And Planning Kpi Dashboard Elements PDF
The following dashboard depicts the application of marketing intelligence in the field of healthcare, which will be used by clinical laboratories, hospitals and private institutions to track the effectiveness of marketing campaigns. Key performance indicators are total convergence, cost per conversion, referral form filled by patients, patient request etc. Showcasing this set of slides titled Healthcare Strategic Marketing Analysis And Planning Kpi Dashboard Elements PDF. The topics addressed in these templates are Quarterly Conversion Breakdown, Annual Conversion Breakdown, Patient Request. All the content presented in this PPT design is completely editable. Download it and make adjustments in color, background, font etc. as per your unique business setting.
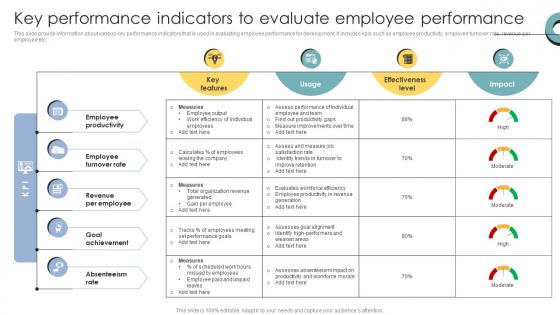
Skill Enhancement Performance Key Performance Indicators To Evaluate Employee Performance
This slide provide information about various key performance indicators that is used in evaluating employee performance for development. It includes kpis such as employee productivity, employee turnover rate, revenue per employee etc. Get a simple yet stunning designed Skill Enhancement Performance Key Performance Indicators To Evaluate Employee Performance. It is the best one to establish the tone in your meetings. It is an excellent way to make your presentations highly effective. So, download this PPT today from Slidegeeks and see the positive impacts. Our easy-to-edit Skill Enhancement Performance Key Performance Indicators To Evaluate Employee Performance can be your go-to option for all upcoming conferences and meetings. So, what are you waiting for Grab this template today. This slide provide information about various key performance indicators that is used in evaluating employee performance for development. It includes kpis such as employee productivity, employee turnover rate, revenue per employee etc.
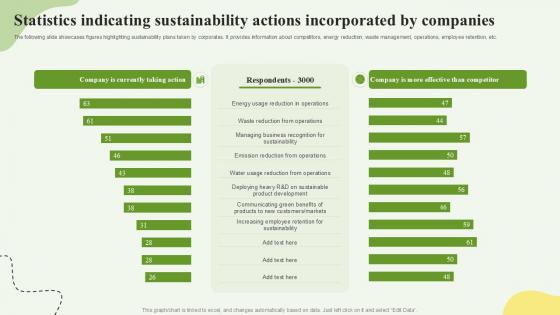
Statistics Indicating Sustainability Actions Incorporated By Companies Ppt Example SS
This slide represents the pyramid showing the performance of the human resource department of an organization. It includes details related to recruitment and selection, talent management, leadership capability, performance culture and strategic advantage. There are so many reasons you need a Statistics Indicating Sustainability Actions Incorporated By Companies Ppt Example SS The first reason is you can not spend time making everything from scratch, Thus, Slidegeeks has made presentation templates for you too. You can easily download these templates from our website easily. This slide represents the pyramid showing the performance of the human resource department of an organization. It includes details related to recruitment and selection, talent management, leadership capability, performance culture and strategic advantage.

Metrics To Gauge The Health Of Sales Pipeline Brochure PDF
This slide shows comparison of sales pipeline metrics Number of deals in sales pipeline, average deal size, win rate etc. of company with the industry average. Deliver and pitch your topic in the best possible manner with this Metrics To Gauge The Health Of Sales Pipeline Brochure PDF. Use them to share invaluable insights on Metrics To Gauge The Health Of Sales Pipeline and impress your audience. This template can be altered and modified as per your expectations. So, grab it now.
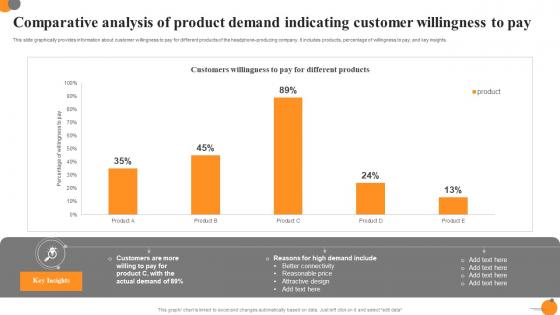
Comparative Analysis Of Product Demand Indicating Customer Willingness To Pay Ppt Gallery Influencers Pdf
This slide graphically provides information about customer willingness to pay for different products of the headphone-producing company. It includes products, percentage of willingness to pay, and key insights. Pitch your topic with ease and precision using this Comparative Analysis Of Product Demand Indicating Customer Willingness To Pay Ppt Gallery Influencers Pdf. This layout presents information on Customers, Willingness To Pay, Different Products. It is also available for immediate download and adjustment. So, changes can be made in the color, design, graphics or any other component to create a unique layout. This slide graphically provides information about customer willingness to pay for different products of the headphone-producing company. It includes products, percentage of willingness to pay, and key insights.
Linkedin Content Strategies Ad Campaign Performance Indicators Tracking MKT SS V
This slide covers dashboard to measure the performance of ad campaigns on LinkedIn platform. The purpose of this template is to provide the company an overview on the outcomes of running ad campaigns on LinkedIn. It includes performance based on impressions, CTR, engagement rates, CPC, CPM, etc. There are so many reasons you need a Linkedin Content Strategies Ad Campaign Performance Indicators Tracking MKT SS V. The first reason is you can not spend time making everything from scratch, Thus, Slidegeeks has made presentation templates for you too. You can easily download these templates from our website easily. This slide covers dashboard to measure the performance of ad campaigns on LinkedIn platform. The purpose of this template is to provide the company an overview on the outcomes of running ad campaigns on LinkedIn. It includes performance based on impressions, CTR, engagement rates, CPC, CPM, etc.

Cybersecurity Key Performance Indicators With Applications Summary Pdf
Pitch your topic with ease and precision using this Cybersecurity Key Performance Indicators With Applications Summary Pdf This layout presents information on Identify Weaknesses, Review Improvement, Security Policies It is also available for immediate download and adjustment. So, changes can be made in the color, design, graphics or any other component to create a unique layout. This slide showcases the cyber security key performance indicators with applications which helps an organization to determine readiness. It include details such as security policies, identify weaknesses, obligation to compliance framework, etc.
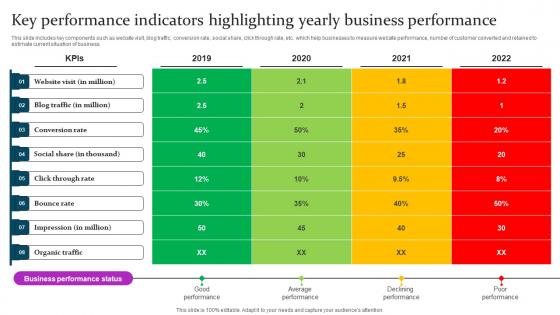
Key Performance Indicators Marketing Mix Communication Guide Client Elements Pdf
This slide includes key components such as website visit, blog traffic, conversion rate, social share, click through rate, etc. which help businesses to measure website performance, number of customer converted and retained to estimate current situation of business. Whether you have daily or monthly meetings, a brilliant presentation is necessary. Key Performance Indicators Marketing Mix Communication Guide Client Elements Pdf can be your best option for delivering a presentation. Represent everything in detail using Key Performance Indicators Marketing Mix Communication Guide Client Elements Pdf and make yourself stand out in meetings. The template is versatile and follows a structure that will cater to your requirements. All the templates prepared by Slidegeeks are easy to download and edit. Our research experts have taken care of the corporate themes as well. So, give it a try and see the results. This slide includes key components such as website visit, blog traffic, conversion rate, social share, click through rate, etc. which help businesses to measure website performance, number of customer converted and retained to estimate current situation of business.
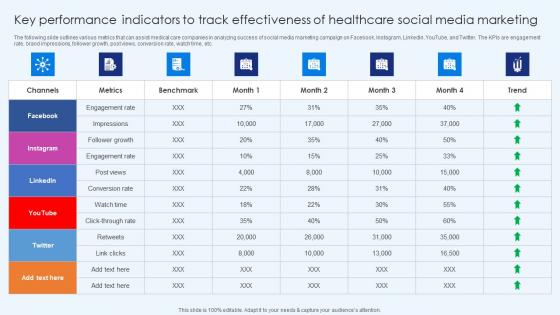
Key Performance Indicators To Tracks Effectiveness Healthcare Promotion Diagrams Pdf
The following slide outlines various metrics that can assist medical care companies in analyzing success of social media marketing campaign on Facebook, Instagram, LinkedIn, YouTube, and Twitter. The KPIs are engagement rate, brand impressions, follower growth, post views, conversion rate, watch time, etc. Slidegeeks has constructed Key Performance Indicators To Tracks Effectiveness Healthcare Promotion Diagrams Pdf after conducting extensive research and examination. These presentation templates are constantly being generated and modified based on user preferences and critiques from editors. Here, you will find the most attractive templates for a range of purposes while taking into account ratings and remarks from users regarding the content. This is an excellent jumping-off point to explore our content and will give new users an insight into our top-notch PowerPoint Templates. The following slide outlines various metrics that can assist medical care companies in analyzing success of social media marketing campaign on Facebook, Instagram, LinkedIn, YouTube, and Twitter. The KPIs are engagement rate, brand impressions, follower growth, post views, conversion rate, watch time, etc.
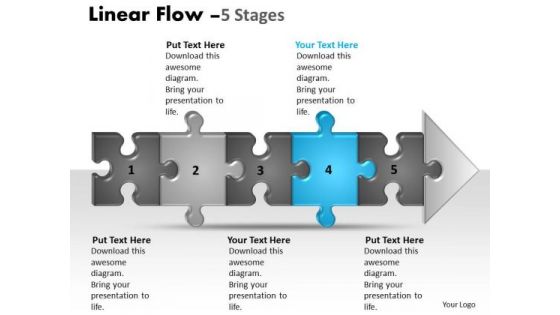
Flow Ppt Linear 5 Phase Diagram Style1 Time Management PowerPoint Design
We present our flow PPT Linear 5 phase diagram style1 time management PowerPoint design. Use our Puzzles or Jigsaws PowerPoint Templates because, Saves your time a prized possession, an ideal aid to give an ideal presentation. Use our Game Pieces PowerPoint Templates because; inform your team ofyour ideas using our illustrative slides. Use our Finance PowerPoint Templates because, they are indicators of the path you have in mind. Use our Shapes PowerPoint Templates because; demonstrate how they contribute to the larger melting pot. Use our Business PowerPoint Templates because, Cycle Template: - Rolling along while gathering profits along the way is the aim. Use these PowerPoint slides for presentations relating to abstract, algorithm, arrow, block diagram, business, chart, color, connection, design, development, diagram, direction, element, flow, graph, linear, linear diagram, management, organization, plan, process, section, segment, set, sign, solution, strategy, symbol, technology, vector. The prominent colors used in the PowerPoint template are Blue, Gray, and Black Help them discover new faith with our Flow Ppt Linear 5 Phase Diagram Style1 Time Management PowerPoint Design. Convert them to your line of thinking.
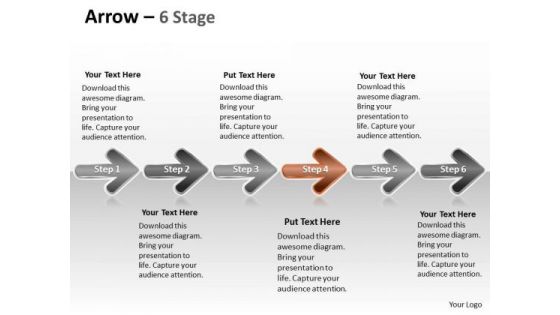
Usa Ppt Background Linear Abstraction By 6 Arrows Business Management PowerPoint 5 Design
We present our USA PPT Background Linear Abstraction by 6 arrows business management power point 5 design. Use our Arrows PowerPoint Templates because, Readymade PowerPoint templates for slides to show. Use our Sign PowerPoint Templates because, you have the process in your head, our template design showing will illuminate your thoughts. Use our Shapes PowerPoint Templates because; Employ the right colors for your brilliant ideas. Use our Business PowerPoint Templates because, guaranteed to focus the minds of your team. Use our Process and Flows PowerPoint Templates because, you have what it takes to grow. Use these PowerPoint slides for presentations relating to arrow, badge, banner, button, colorful, connection, cursor, cyan, design element, designator, directional, download, emblem, icon, indicator, internet, link, load, magenta, marker, pictogram, pointer, right, stained, sign, signpost, symbol, upload, vector . The prominent colors used in the PowerPoint template are Brown, Gray, and Black Our Usa Ppt Background Linear Abstraction By 6 Arrows Business Management PowerPoint 5 Design are good for brainstorming. They give rise to brilliant thoughts.
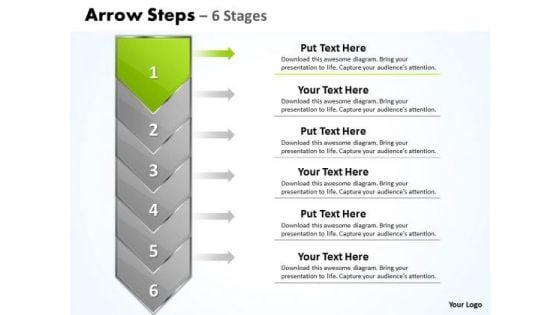
Process PowerPoint Template Arrow 6 Stages 1 Communication Skills Design
We present our process PowerPoint template arrow 6 stages 1 communication skills design. Use our Abstract PowerPoint Templates because; now imprint them on the minds of your audience via our slides. Use our Symbol PowerPoint Templates because, Its also been said that prevention is better than cure, either way you have a store of knowledge for sure. Use our Arrows PowerPoint Templates because, aesthetically designed to make a great first impression this template highlights. Use our Business PowerPoint Templates because, they are indicators of the path you have in mind. Use our Process and Flows PowerPoint Templates because, Brainstorming Light Bulbs: - The atmosphere in the workplace is electric. Use these PowerPoint slides for presentations relating to Arrow, Background, Business, Chart, Diagram, Financial, Graphic, Gray, Icon, Illustration, Management, Orange, Perspective, Planning, Process, Process, Stages, Steps, Text. The prominent colors used in the PowerPoint template are Green, Gray, and Black Announce your arrival on the stage with our Process PowerPoint Template Arrow 6 Stages 1 Communication Skills Design. They allow you to make a grand entry,
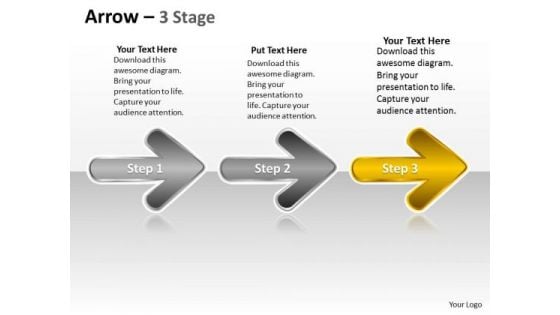
Ppt Series Of Continual Free Custom Presentation PowerPoint Charts Plan 4 Image
We present our PPT series of continual free custom presentation PowerPoint charts plan 4 Image. Use our Symbol PowerPoint Templates because, Brilliant ideas are your forte. Use our Shapes PowerPoint Templates because, Focus on each one and investigate which one would be the best fit for your needs. Use our Signs PowerPoint Templates because; Focus the light on the path to sure shot success. Use our Business PowerPoint Templates because; now imprint them on the minds of your audience via our slides. Use our Arrows PowerPoint Templates because; educate your staff on the means to provide the required support for speedy recovery. Use these PowerPoint slides for presentations relating to arrow, arrowheads, badge, banner, cerulean, colored, colorful, connection, design element, designator, directional, download, emblem, indicator, interface, internet, magenta, marker, matted, menu tool, navigation panel, next, orientation, page site, pictogram, pointer, sign. The prominent colors used in the PowerPoint template are Yellow, Gray, and White Subscribe to our Ppt Series Of Continual Free Custom Presentation PowerPoint Charts Plan 4 Image and receive success. Be assured of finding the best projection to highlight your words.

Pastry Shop Market Entry Plan Ppt Powerpoint Presentation GTM V
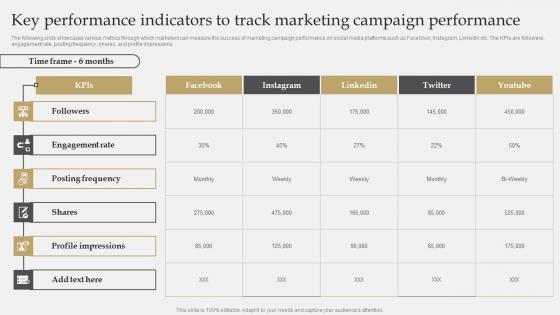
IT Industry Market Research Key Performance Indicators To Track Marketing Campaign Rules Pdf
The following slide showcases various metrics through which marketers can measure the success of marketing campaign performance on social media platforms such as Facebook, Instagram, LinkedIn etc. The KPIs are followers, engagement rate, posting frequency, shares, and profile impressions. Whether you have daily or monthly meetings, a brilliant presentation is necessary. IT Industry Market Research Key Performance Indicators To Track Marketing Campaign Rules Pdf can be your best option for delivering a presentation. Represent everything in detail using IT Industry Market Research Key Performance Indicators To Track Marketing Campaign Rules Pdf and make yourself stand out in meetings. The template is versatile and follows a structure that will cater to your requirements. All the templates prepared by Slidegeeks are easy to download and edit. Our research experts have taken care of the corporate themes as well. So, give it a try and see the results. The following slide showcases various metrics through which marketers can measure the success of marketing campaign performance on social media platforms such as Facebook, Instagram, LinkedIn etc. The KPIs are followers, engagement rate, posting frequency, shares, and profile impressions.
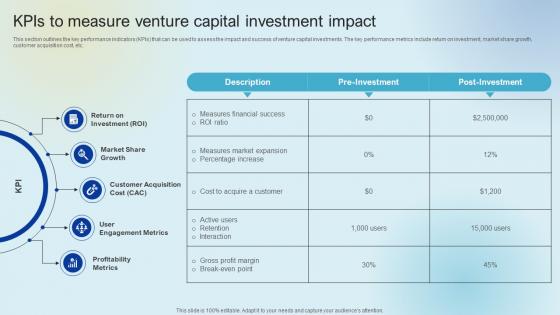
KPIs To Measure Venture Capital Investment Raising Venture Capital A Holistic Approach Fin SS V
This section outlines the key performance indicators KPIs that can be used to assess the impact and success of venture capital investments. The key performance metrics include return on investment, market share growth, customer acquisition cost, etc. This modern and well-arranged KPIs To Measure Venture Capital Investment Raising Venture Capital A Holistic Approach Fin SS V provides lots of creative possibilities. It is very simple to customize and edit with the Powerpoint Software. Just drag and drop your pictures into the shapes. All facets of this template can be edited with Powerpoint, no extra software is necessary. Add your own material, put your images in the places assigned for them, adjust the colors, and then you can show your slides to the world, with an animated slide included. This section outlines the key performance indicators KPIs that can be used to assess the impact and success of venture capital investments. The key performance metrics include return on investment, market share growth, customer acquisition cost, etc.
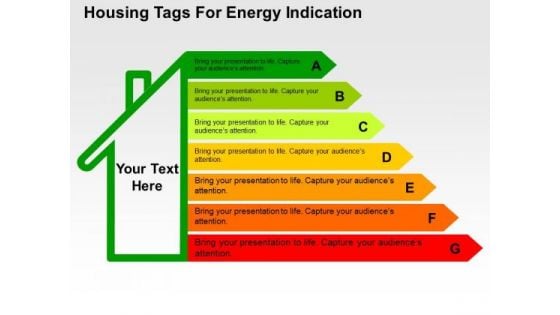
Housing Tags For Energy Indication PowerPoint Template
This business diagram has been designed with graphic of housing tags. This diagram contains the concept of energy saving. This diagram slide can be used to make impressive presentations.
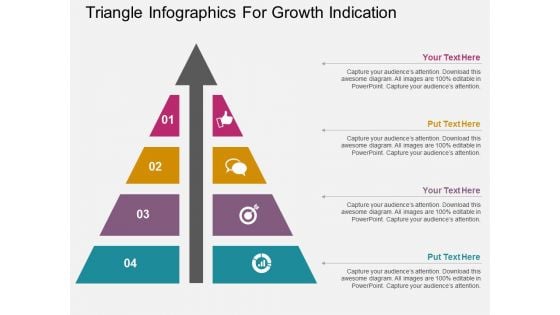
Triangle Infographics For Growth Indication Powerpoint Template
Our above PPT slide has been designed triangle infographic with growth arrow. This PowerPoint template is suitable to present strategic management for business growth. Use this business diagram to present your work in a more smart and precise manner.

Ppt Background Beeline Flow Arrow Diagram Project Management PowerPoint 7 Design
We present our PPT Background beeline flow arrow diagram project management PowerPoint 7 design. Use our Arrows PowerPoint Templates because, an innovative slide design depicting driving home the relevance of a steady rhythm. Use our Symbol PowerPoint Templates because, which of late have been proving to be a hassle. Use our Business PowerPoint Templates because; Lay down the fundamentals to build upon. Use our Shapes PowerPoint Templates because, they are indicators of the path you have in mind. Use our Process and Flows PowerPoint Templates because, now fire the arrows to emblazon the desired path by which you will achieve anticipated results. Use these PowerPoint slides for presentations relating to abstract, age, ancient, antique, arrows, art, artistic, background, colorful, colors, contemporary, decoration, design, dirt, dirty, dynamic, edge, elegant, element, frame, future, futuristic, grunge, illustration, linear, lines, modern, old, oldest, orange, paper, pattern, place, pointer, poster, red, retro, scratch, stop, text, texture, vintage. The prominent colors used in the PowerPoint template are Blue, Gray, and Black Create an absorbing atmosphere with our Ppt Background Beeline Flow Arrow Diagram Project Management PowerPoint 7 Design. Ensure your audience remains attentive.
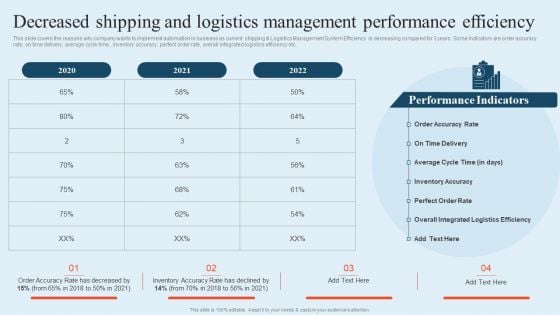
Integrating Logistics Automation Solution Decreased Shipping And Logistics Management Performance Ppt File Background Image PDF
This slide covers the reasons why company wants to implement automation in business as current shipping and Logistics Management System Efficiency is decreasing compared for 3 years. Some indicators are order accuracy rate, on time delivery, average cycle time , inventory accuracy, perfect order rate, overall integrated logistics efficiency etc. Here you can discover an assortment of the finest PowerPoint and Google Slides templates. With these templates, you can create presentations for a variety of purposes while simultaneously providing your audience with an eye-catching visual experience. Download Integrating Logistics Automation Solution Decreased Shipping And Logistics Management Performance Ppt File Background Image PDF to deliver an impeccable presentation. These templates will make your job of preparing presentations much quicker, yet still, maintain a high level of quality. Slidegeeks has experienced researchers who prepare these templates and write high-quality content for you. Later on, you can personalize the content by editing the Integrating Logistics Automation Solution Decreased Shipping And Logistics Management Performance Ppt File Background Image PDF.
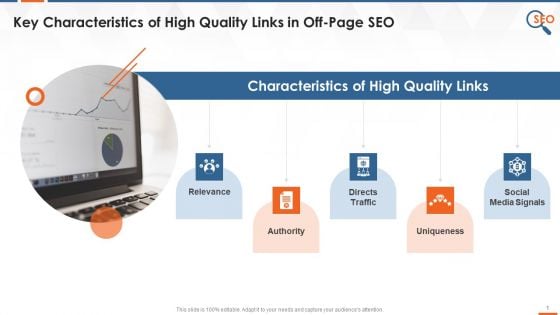
Must Have Characteristics Of High Quality Links Training Ppt
This slide indicates the major features of high-quality backlinks in off-page SEO. The key characteristics discussed are relevance, authority, directs traffic, and uniqueness.
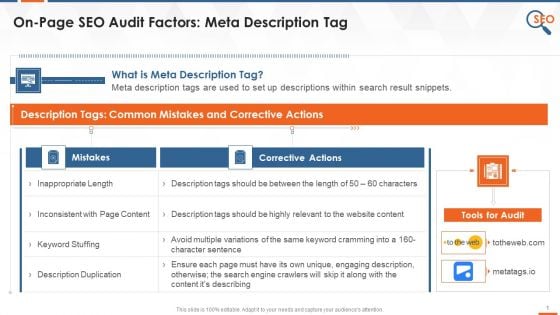
On Page SEO Audit Factor Meta Description Tag Training Ppt
This slide indicates the common meta description tag mistakes in the On-Page SEO audit. It also contains details of audit tools and corrective actions.
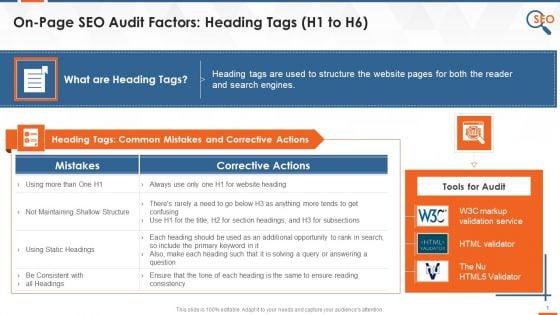
On Page SEO Audit Factor Heading Tags Training Ppt
This slide indicates the common heading tags issues in On-Page SEO audit. It also contains details of audit tools and corrective actions.
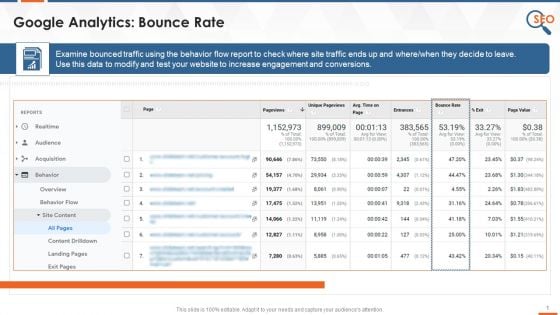
Google Analytics SEO Tool To Monitor Bounce Rate Training Ppt
This slide indicates how the Google Analytics tool is used in SEO to examine the bounced traffic to increase engagement and conversions.

Google Analytics SEO Tool To Monitor Search Queries Training Ppt
This slide indicates how the Google Analytics tool is used in SEO to track search queries by effectively syncing the search console account.
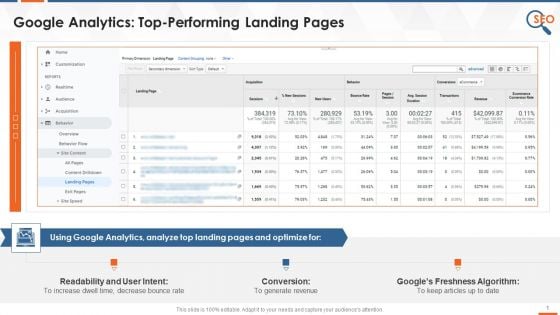
Google Analytics SEO Tool To Track Landing Pages Training Ppt
This slide indicates how the Google Analytics tool is used in SEO to track the performance of top landing pages on multiple factors.
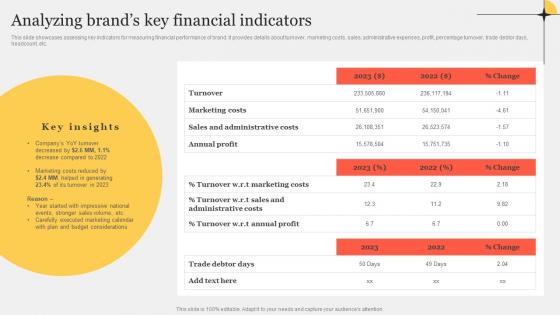
Analyzing Brands Key Financial Indicators Improving Customer Interaction Through Microsoft Pdf
This slide showcases assessing key indicators for measuring financial performance of brand. It provides details about turnover, marketing costs, sales, administrative expenses, profit, percentage turnover, trade debtor days, headcount, etc.Find highly impressive Analyzing Brands Key Financial Indicators Improving Customer Interaction Through Microsoft Pdf on Slidegeeks to deliver a meaningful presentation. You can save an ample amount of time using these presentation templates. No need to worry to prepare everything from scratch because Slidegeeks experts have already done a huge research and work for you. You need to download Analyzing Brands Key Financial Indicators Improving Customer Interaction Through Microsoft Pdf for your upcoming presentation. All the presentation templates are 100Precent editable and you can change the color and personalize the content accordingly. Download now. This slide showcases assessing key indicators for measuring financial performance of brand. It provides details about turnover, marketing costs, sales, administrative expenses, profit, percentage turnover, trade debtor days, headcount, etc.
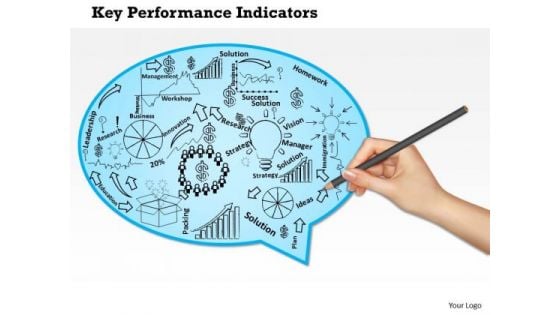
Business Framework Key Performance Indicators Of A Company PowerPoint Presentation
Our above diagram provides framework of key performance indicators for a company. This slide contains human hand drawing some objects for terms like innovation strategy, research, solution, management and leadership. Download this diagram to make professional presentations.
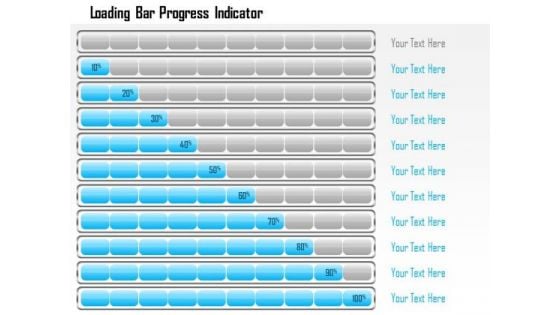
Business Framework Loading Bar Progress Indicator PowerPoint Presentation
This business diagram displays bar progress indicators. This business slide contains the concept of business growth shown in multiple levels. Use this diagram to present and compare data in an impressive manner.
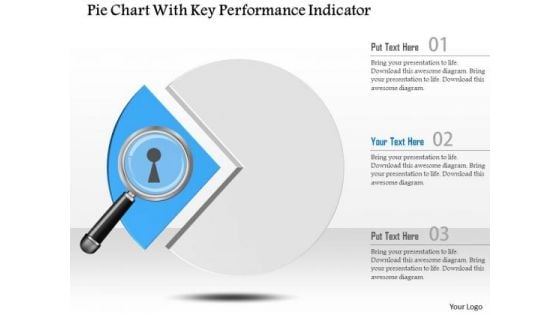
Business Diagram Pie Chart With Key Performance Indicator Presentation Template
This power point template slide has been crafted with graphic of pie chart and magnifier. This PPT contains the concept of performance indication. Use this PPT for data technology and business related presentations.

Gear With Plant For Growth Indication Powerpoint Template
This PowerPoint template has been designed with graphics of gear with plant. You may download this diagram slide to indicate growth process. Illustrate your plans to your listeners with this impressive template.
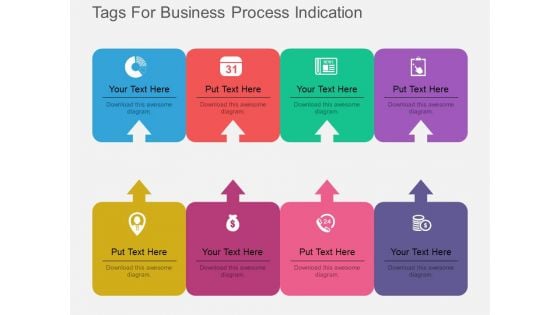
Eight Tags For Business Process Indication Powerpoint Template
Our above PPT slide contains graphics of eight text tags with icons. This PowerPoint template may be used to display business process steps. Use this diagram to impart more clarity to data and to create more sound impact on viewers.
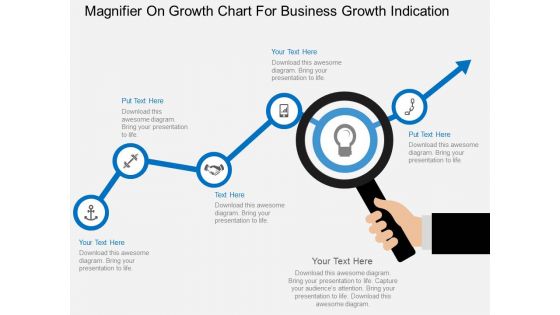
Magnifier On Growth Chart For Business Growth Indication Powerpoint Template
This business slide contains graphics of magnifier on growth chart. This PowerPoint template helps to display business planning and analysis. Use this diagram to impart more clarity to concept and to create more sound impact on viewers.

Three Arrows For Business Process Indication Powerpoint Template
This business slide displays diagram of three arrows with icons. Download this diagram to display information in visual manner. Visual effect of this diagram helps in maintaining the flow of the discussion and provides more clarity to the subject.
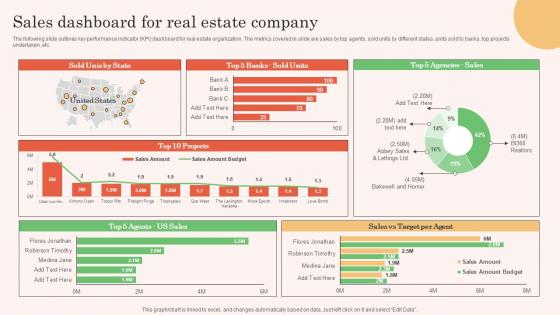
Sales Dashboard For Real Estate Company Real Estate Property Marketing Demonstration Pdf
The following slide outlines key performance indicator KPI dashboard for real estate organization. The metrics covered in slide are sales by top agents, sold units by different states, units sold to banks, top projects undertaken, etc.Make sure to capture your audiences attention in your business displays with our gratis customizable Sales Dashboard For Real Estate Company Real Estate Property Marketing Demonstration Pdf. These are great for business strategies, office conferences, capital raising or task suggestions. If you desire to acquire more customers for your tech business and ensure they stay satisfied, create your own sales presentation with these plain slides. The following slide outlines key performance indicator KPI dashboard for real estate organization. The metrics covered in slide are sales by top agents, sold units by different states, units sold to banks, top projects undertaken, etc.
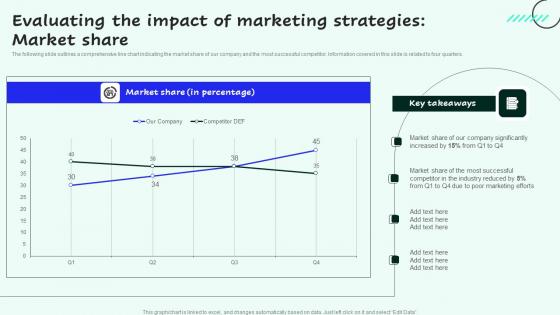
Evaluating The Impact Of Marketing Strategies For Enhancing Sales And Profitability Elements Pdf
The following slide outlines a comprehensive line chart indicating the market share of our company and the most successful competitor. Information covered in this slide is related to four quarters.Present like a pro with Evaluating The Impact Of Marketing Strategies For Enhancing Sales And Profitability Elements Pdf Create beautiful presentations together with your team, using our easy to use presentation slides. Share your ideas in real time and make changes on the fly by downloading our templates. So whether you are in the office, on the go, or in a remote location, you can stay in sync with your team and present your ideas with confidence. With Slidegeeks presentation got a whole lot easier. Grab these presentations today. The following slide outlines a comprehensive line chart indicating the market share of our company and the most successful competitor. Information covered in this slide is related to four quarters.
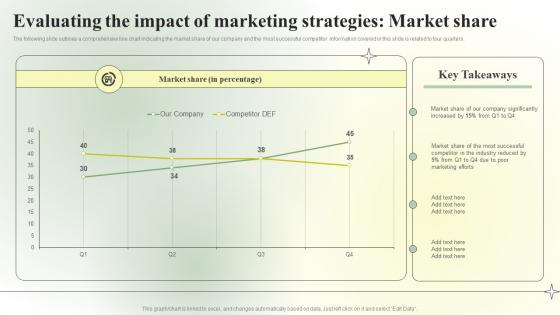
Competitive Branding Strategic Evaluating The Impact Of Marketing Infographics PDF
The following slide outlines a comprehensive line chart indicating the market share of our company and the most successful competitor. Information covered in this slide is related to four quarters. From laying roadmaps to briefing everything in detail, our templates are perfect for you. You can set the stage with your presentation slides. All you have to do is download these easy-to-edit and customizable templates. Competitive Branding Strategic Evaluating The Impact Of Marketing Infographics PDF will help you deliver an outstanding performance that everyone would remember and praise you for. Do download this presentation today. The following slide outlines a comprehensive line chart indicating the market share of our company and the most successful competitor. Information covered in this slide is related to four quarters.
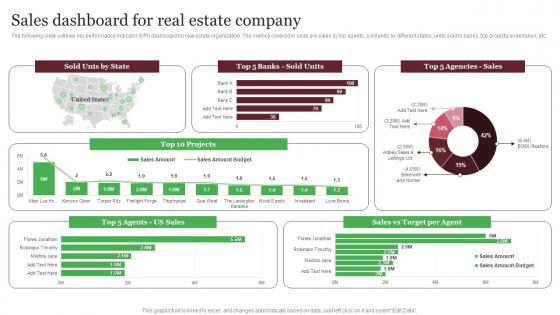
Sales Dashboard For Real Estate Company Out Of The Box Real Designs Pdf
The following slide outlines key performance indicator KPI dashboard for real estate organization. The metrics covered in slide are sales by top agents, sold units by different states, units sold to banks, top projects undertaken, etc. Make sure to capture your audiences attention in your business displays with our gratis customizable Sales Dashboard For Real Estate Company Out Of The Box Real Designs Pdf These are great for business strategies, office conferences, capital raising or task suggestions. If you desire to acquire more customers for your tech business and ensure they stay satisfied, create your own sales presentation with these plain slides. The following slide outlines key performance indicator KPI dashboard for real estate organization. The metrics covered in slide are sales by top agents, sold units by different states, units sold to banks, top projects undertaken, etc.
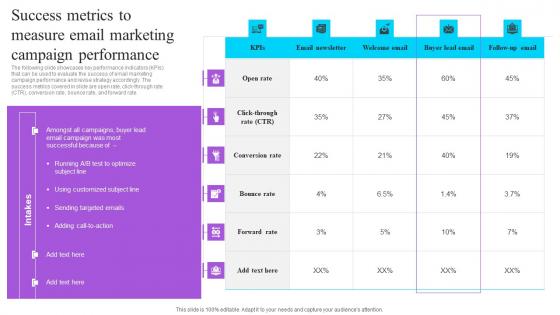
Success Metrics To Measure Email Marketing Campaign Performance Effective GTM Techniques Introduction PDF
The following slide showcases key performance indicators KPIs that can be used to evaluate the success of email marketing campaign performance and revise strategy accordingly. The success metrics covered in slide are open rate, click-through rate CTR, conversion rate, bounce rate, and forward rate. From laying roadmaps to briefing everything in detail, our templates are perfect for you. You can set the stage with your presentation slides. All you have to do is download these easy-to-edit and customizable templates. Success Metrics To Measure Email Marketing Campaign Performance Effective GTM Techniques Introduction PDF will help you deliver an outstanding performance that everyone would remember and praise you for. Do download this presentation today. The following slide showcases key performance indicators KPIs that can be used to evaluate the success of email marketing campaign performance and revise strategy accordingly. The success metrics covered in slide are open rate, click-through rate CTR, conversion rate, bounce rate, and forward rate.
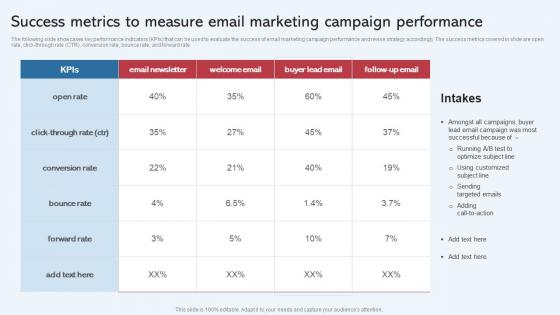
Success Metrics To Measure Email Marketing Campaign Effective Startup Promotion Plan Mockup Pdf
The following slide showcases key performance indicators KPIs that can be used to evaluate the success of email marketing campaign performance and revise strategy accordingly. The success metrics covered in slide are open rate, click through rate CTR, conversion rate, bounce rate, and forward rate. From laying roadmaps to briefing everything in detail, our templates are perfect for you. You can set the stage with your presentation slides. All you have to do is download these easy to edit and customizable templates. Success Metrics To Measure Email Marketing Campaign Effective Startup Promotion Plan Mockup Pdf will help you deliver an outstanding performance that everyone would remember and praise you for. Do download this presentation today. The following slide showcases key performance indicators KPIs that can be used to evaluate the success of email marketing campaign performance and revise strategy accordingly. The success metrics covered in slide are open rate, click through rate CTR, conversion rate, bounce rate, and forward rate.
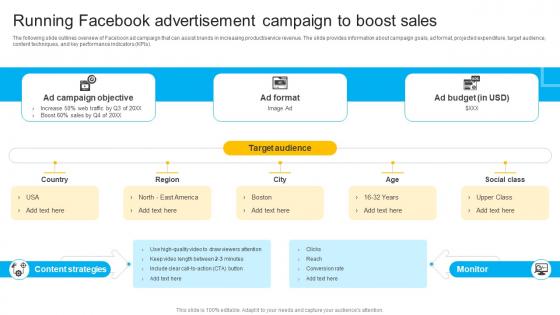
How To Create Cost Effective Running Facebook Advertisement Campaign Strategy SS V
The following slide outlines overview of Facebook ad campaign that can assist brands in increasing product or service revenue. The slide provides information about campaign goals, ad format, projected expenditure, target audience, content techniques, and key performance indicators KPIs. From laying roadmaps to briefing everything in detail, our templates are perfect for you. You can set the stage with your presentation slides. All you have to do is download these easy-to-edit and customizable templates. How To Create Cost Effective Running Facebook Advertisement Campaign Strategy SS V will help you deliver an outstanding performance that everyone would remember and praise you for. Do download this presentation today. The following slide outlines overview of Facebook ad campaign that can assist brands in increasing product or service revenue. The slide provides information about campaign goals, ad format, projected expenditure, target audience, content techniques, and key performance indicators KPIs.

Facebook Marketing Techniques Running Facebook Advertisement Campaign Strategy SS V
The following slide outlines overview of Facebook ad campaign that can assist brands in increasing product service revenue. The slide provides information about campaign goals, ad format, projected expenditure, target audience, content techniques, and key performance indicators KPIs . From laying roadmaps to briefing everything in detail, our templates are perfect for you. You can set the stage with your presentation slides. All you have to do is download these easy-to-edit and customizable templates. Facebook Marketing Techniques Running Facebook Advertisement Campaign Strategy SS V will help you deliver an outstanding performance that everyone would remember and praise you for. Do download this presentation today. The following slide outlines overview of Facebook ad campaign that can assist brands in increasing product service revenue. The slide provides information about campaign goals, ad format, projected expenditure, target audience, content techniques, and key performance indicators KPIs .

Marketing Growth Strategy To Kpis To Measure Success Of Influencer Marketing Strategy SS V
The following slide outlines different success metrics through which marketing executives can measure effectiveness of influencer marketing campaigns. The key performance indicators KPIs outlined in slide are brand reach, impressions, followers growth, click-through rate CTR, customer engagement rate, etc. From laying roadmaps to briefing everything in detail, our templates are perfect for you. You can set the stage with your presentation slides. All you have to do is download these easy-to-edit and customizable templates. Marketing Growth Strategy To Kpis To Measure Success Of Influencer Marketing Strategy SS V will help you deliver an outstanding performance that everyone would remember and praise you for. Do download this presentation today. The following slide outlines different success metrics through which marketing executives can measure effectiveness of influencer marketing campaigns. The key performance indicators KPIs outlined in slide are brand reach, impressions, followers growth, click-through rate CTR, customer engagement rate, etc.
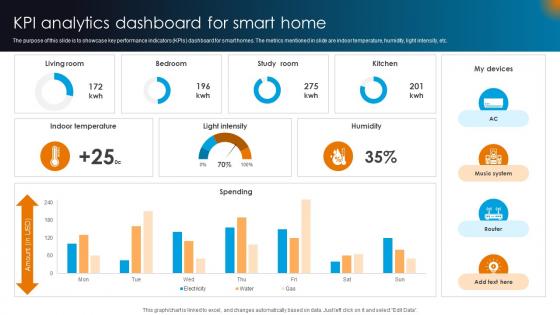
Integrating AI With IoT Kpi Analytics Dashboard For Smart Home IoT SS V
The purpose of this slide is to showcase key performance indicators KPIs dashboard for smart homes. The metrics mentioned in slide are indoor temperature, humidity, light intensity, etc. Are you searching for a Integrating AI With IoT Kpi Analytics Dashboard For Smart Home IoT SS V that is uncluttered, straightforward, and original Its easy to edit, and you can change the colors to suit your personal or business branding. For a presentation that expresses how much effort you have put in, this template is ideal With all of its features, including tables, diagrams, statistics, and lists, its perfect for a business plan presentation. Make your ideas more appealing with these professional slides. Download Integrating AI With IoT Kpi Analytics Dashboard For Smart Home IoT SS V from Slidegeeks today. The purpose of this slide is to showcase key performance indicators KPIs dashboard for smart homes. The metrics mentioned in slide are indoor temperature, humidity, light intensity, etc.
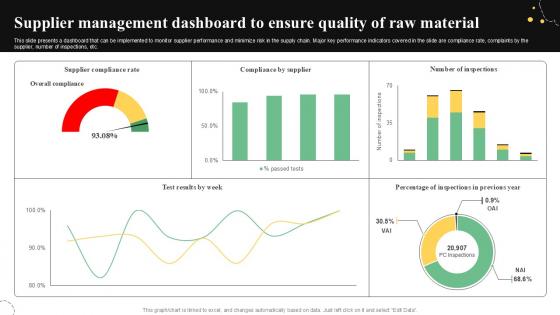
Supplier Management Dashboard Quality Control Guide For Food PPT Sample
This slide presents a dashboard that can be implemented to monitor supplier performance and minimize risk in the supply chain. Major key performance indicators covered in the slide are compliance rate, complaints by the supplier, number of inspections, etc. Present like a pro with Supplier Management Dashboard Quality Control Guide For Food PPT Sample. Create beautiful presentations together with your team, using our easy-to-use presentation slides. Share your ideas in real-time and make changes on the fly by downloading our templates. So whether you are in the office, on the go, or in a remote location, you can stay in sync with your team and present your ideas with confidence. With Slidegeeks presentation got a whole lot easier. Grab these presentations today. This slide presents a dashboard that can be implemented to monitor supplier performance and minimize risk in the supply chain. Major key performance indicators covered in the slide are compliance rate, complaints by the supplier, number of inspections, etc.
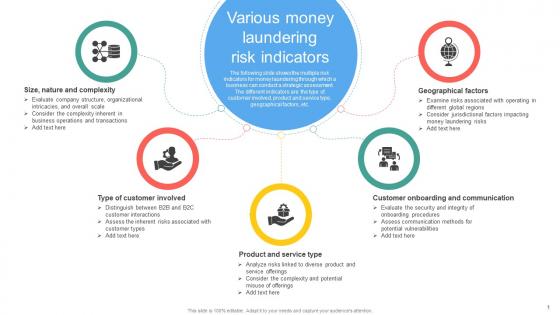
Various Money Laundering Risk Indicators Mapping Out The Anti Money Fin SS V
The following slide shows the multiple risk indicators for money laundering through which a business can conduct a strategic assessment. The different indicators are the type of customer involved, product and service type, geographical factors, etc. Find highly impressive Various Money Laundering Risk Indicators Mapping Out The Anti Money Fin SS V on Slidegeeks to deliver a meaningful presentation. You can save an ample amount of time using these presentation templates. No need to worry to prepare everything from scratch because Slidegeeks experts have already done a huge research and work for you. You need to download Various Money Laundering Risk Indicators Mapping Out The Anti Money Fin SS V for your upcoming presentation. All the presentation templates are 100 percent editable and you can change the color and personalize the content accordingly. Download now The following slide shows the multiple risk indicators for money laundering through which a business can conduct a strategic assessment. The different indicators are the type of customer involved, product and service type, geographical factors, etc.
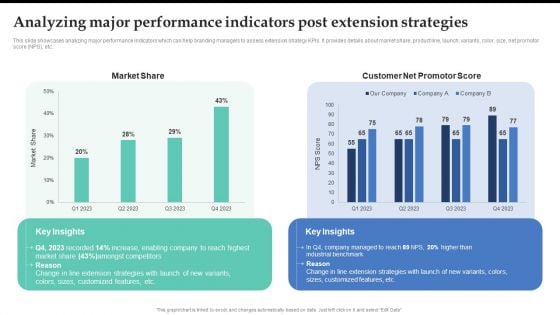
Analyzing Major Performance Indicators Post Extension Strategies Topics PDF
This slide showcases analyzing major performance indicators which can help branding managers to assess extension strategy KPIs. It provides details about market share, product line, launch, variants, color, size, net promotor score NPS, etc. From laying roadmaps to briefing everything in detail, our templates are perfect for you. You can set the stage with your presentation slides. All you have to do is download these easy-to-edit and customizable templates. Analyzing Major Performance Indicators Post Extension Strategies Topics PDF will help you deliver an outstanding performance that everyone would remember and praise you for. Do download this presentation today.
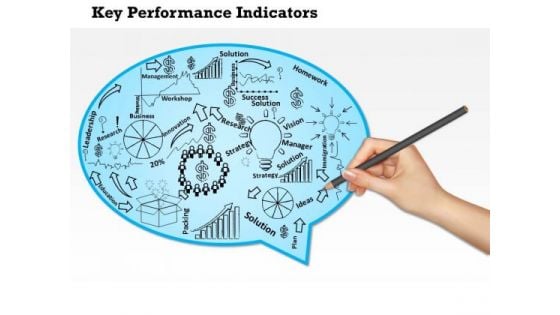
Business Diagram Key Performance Indicators Of A Company PowerPoint Ppt Presentation
Our above diagram provides framework of key performance indicators for a company. This slide contains human hand drawing some objects for terms like innovation strategy, research, solution, management and leadership. Download this diagram to make professional presentations.
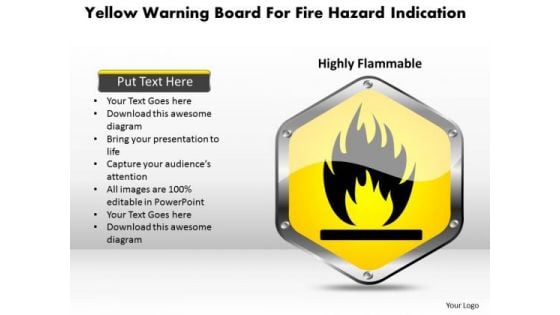
Business Diagram Yellow Warning Board For Fire Hazard Indication Presentation Template
Display the warning of fire hazard and its indication for safety. These measures may be well explained with this exclusive diagram template. Use this slide to build professional presentations for your audience.
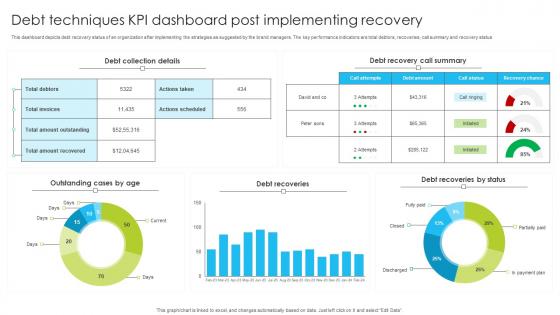
Debt Techniques KPI Dashboard Post Implementing Recovery Information Pdf
This dashboard depicts debt recovery status of an organization after implementing the strategies as suggested by the brand managers. The key performance indicators are total debtors, recoveries, call summary and recovery status. Showcasing this set of slides titled Debt Techniques KPI Dashboard Post Implementing Recovery Information Pdf. The topics addressed in these templates are Debt Techniques, KPI Dashboard, Post Implementing Recovery. All the content presented in this PPT design is completely editable. Download it and make adjustments in color, background, font etc. as per your unique business setting. This dashboard depicts debt recovery status of an organization after implementing the strategies as suggested by the brand managers. The key performance indicators are total debtors, recoveries, call summary and recovery status.

Stoplight Traffic Signal Go Indication Ppt PowerPoint Presentation Complete Deck
This stoplight traffic signal go indication ppt powerpoint presentation complete deck acts as backup support for your ideas, vision, thoughts, etc. Use it to present a thorough understanding of the topic. This PPT slideshow can be utilized for both in-house and outside presentations depending upon your needs and business demands. Entailing twelve slides with a consistent design and theme, this template will make a solid use case. As it is intuitively designed, it suits every business vertical and industry. All you have to do is make a few tweaks in the content or any other component to design unique presentations. The biggest advantage of this complete deck is that it can be personalized multiple times once downloaded. The color, design, shapes, and other elements are free to modify to add personal touches. You can also insert your logo design in this PPT layout. Therefore a well-thought and crafted presentation can be delivered with ease and precision by downloading this stoplight traffic signal go indication ppt powerpoint presentation complete deck PPT slideshow.
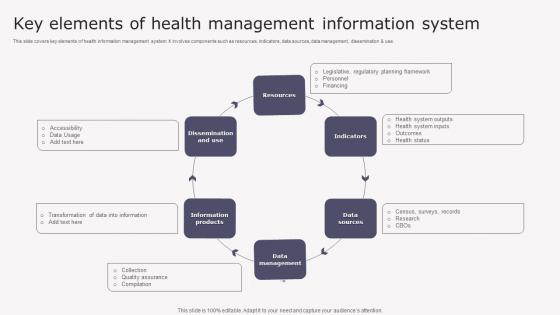
Key Elements Health Transforming Medicare Services Using Health Information Pdf
This slide covers key elements of health information management system. It involves components such as resources, indicators, data sources, data management, dissemination and use. Make sure to capture your audiences attention in your business displays with our gratis customizable Key Elements Health Transforming Medicare Services Using Health Information Pdf. These are great for business strategies, office conferences, capital raising or task suggestions. If you desire to acquire more customers for your tech business and ensure they stay satisfied, create your own sales presentation with these plain slides. This slide covers key elements of health information management system. It involves components such as resources, indicators, data sources, data management, dissemination and use.
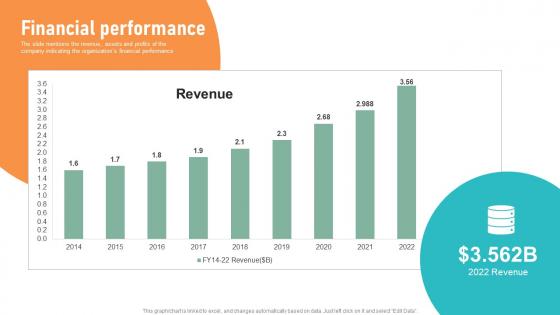
Financial Performance Circuit Designing Company Investor Fund Raising Pitch Deck Themes Pdf
The slide mentions the revenue, assets and profits of the company indicating the organizations financial performance From laying roadmaps to briefing everything in detail, our templates are perfect for you. You can set the stage with your presentation slides. All you have to do is download these easy to edit and customizable templates. Financial Performance Circuit Designing Company Investor Fund Raising Pitch Deck Themes Pdf will help you deliver an outstanding performance that everyone would remember and praise you for. Do download this presentation today. The slide mentions the revenue, assets and profits of the company indicating the organizations financial performance


 Continue with Email

 Home
Home


