Metrics Dashboard
Online Customer Interaction Dashboard For Tracking Website Performance Diagrams PDF
This slide covers the KPI dashboard for analyzing the company website. It includes metrics such as conversions, conversion rate, sessions, stickiness, bounce rate, engagement, etc. Deliver an awe inspiring pitch with this creative Online Customer Interaction Dashboard For Tracking Website Performance Diagrams PDF bundle. Topics like Conversions Rate, Conversions, Engagement can be discussed with this completely editable template. It is available for immediate download depending on the needs and requirements of the user.
Online Customer Interaction Referral Program Performance Tracking Dashboard Sample PDF
This slide covers the KPI dashboard for analyzing referral campaign results. It includes metrics such as total revenue generated, monthly recurring revenue, new customers, clicks, cancelled customers, paying customers, etc. Deliver an awe inspiring pitch with this creative Online Customer Interaction Referral Program Performance Tracking Dashboard Sample PDF bundle. Topics like Revenue Generated, Recurring Revenue, Paying Customers can be discussed with this completely editable template. It is available for immediate download depending on the needs and requirements of the user.
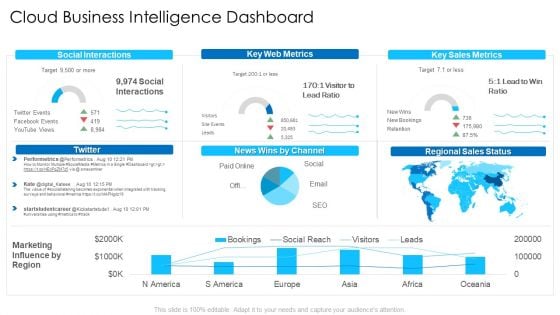
Cloud Business Intelligence Dashboard Microsoft PDF
Deliver an awe inspiring pitch with this creative cloud business intelligence dashboard microsoft pdf bundle. Topics like social interactions, key web metrics, regional sales status can be discussed with this completely editable template. It is available for immediate download depending on the needs and requirements of the user.
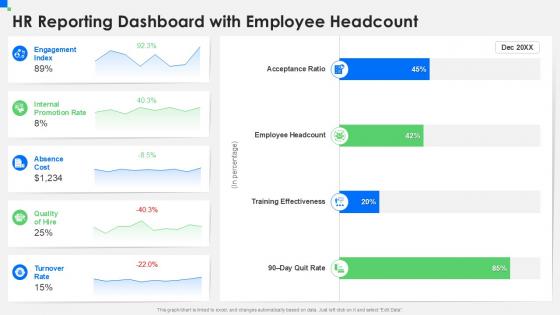
HR Reporting Dashboard With Employee Headcount
Do you have to make sure that everyone on your team knows about any specific topic I yes, then you should give HR Reporting Dashboard With Employee Headcount a try. Our experts have put a lot of knowledge and effort into creating this impeccable HR Reporting Dashboard With Employee Headcount. You can use this template for your upcoming presentations, as the slides are perfect to represent even the tiniest detail. You can download these templates from the Slidegeeks website and these are easy to edit. So grab these today Our HR Reporting Dashboard with Employee Headcount template is expertly designed to provide a visually appealing and organized layout for tracking and presenting key HR data. It offers a clear overview of employee metrics, helping you communicate important insights regarding workforce demographics and staffing levels.
Corporate Branding Performance Tracking Dashboard Effective Brand Maintenance Pictures Pdf
This slide provides information regarding corporate branding performance tracking dashboard in terms of leads, conversion metrics, web traffic, etc. Find highly impressive Corporate Branding Performance Tracking Dashboard Effective Brand Maintenance Pictures Pdf on Slidegeeks to deliver a meaningful presentation. You can save an ample amount of time using these presentation templates. No need to worry to prepare everything from scratch because Slidegeeks experts have already done a huge research and work for you. You need to download Corporate Branding Performance Tracking Dashboard Effective Brand Maintenance Pictures Pdf for your upcoming presentation. All the presentation templates are 100 percent editable and you can change the color and personalize the content accordingly. Download now. This slide provides information regarding corporate branding performance tracking dashboard in terms of leads, conversion metrics, web traffic, etc.
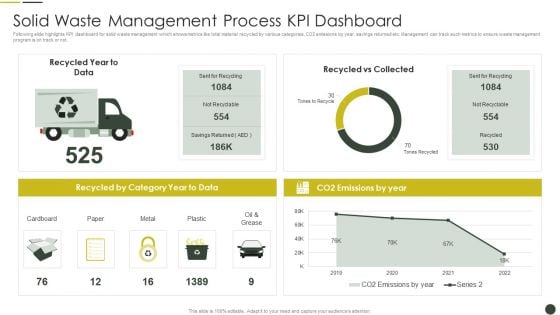
Solid Waste Management Process KPI Dashboard Pictures PDF
Following slide highlights KPI dashboard for solid waste management which shows metrics like total material recycled by various categories, CO2 emissions by year, savings returned etc. Management can track such metrics to ensure waste management program is on track or not.Showcasing this set of slides titled Solid Waste Management Process KPI Dashboard Pictures PDF The topics addressed in these templates are Recycled Category, Sent Recycling, Tones Recycle All the content presented in this PPT design is completely editable. Download it and make adjustments in color, background, font etc. as per your unique business setting.
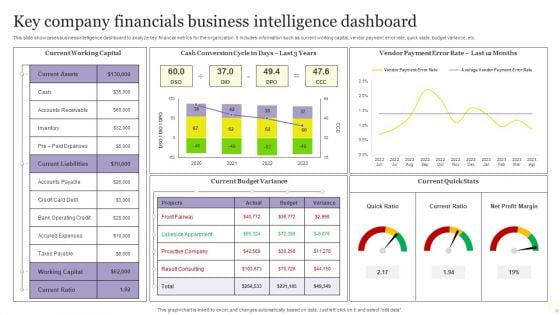
Key Company Financials Business Intelligence Dashboard Graphics PDF
This slide showcases business intelligence dashboard to analyze key financial metrics for the organization. It includes information such as current working capital, vendor payment error rate, quick stats, budget variance, etc. Showcasing this set of slides titled Key Company Financials Business Intelligence Dashboard Graphics PDF. The topics addressed in these templates are Key Company Financials, Business Intelligence Dashboard. All the content presented in this PPT design is completely editable. Download it and make adjustments in color, background, font etc. as per your unique business setting.
Sales Performance Evaluation Summary Dashboard Icons Pdf
This slide showcase Product sales performance summary dashboard to measure insights to ensure product success in marketplace. It includes elements such as total revenue, product sold, store orders, online orders, sales distribution etc.Showcasing this set of slides titled Sales Performance Evaluation Summary Dashboard Icons Pdf The topics addressed in these templates are Sales Distribution, Inventory Turnover Ratio, Order Comparison All the content presented in this PPT design is completely editable. Download it and make adjustments in color, background, font etc. as per your unique business setting. This slide showcase Product sales performance summary dashboard to measure insights to ensure product success in marketplace. It includes elements such as total revenue, product sold, store orders, online orders, sales distribution etc.
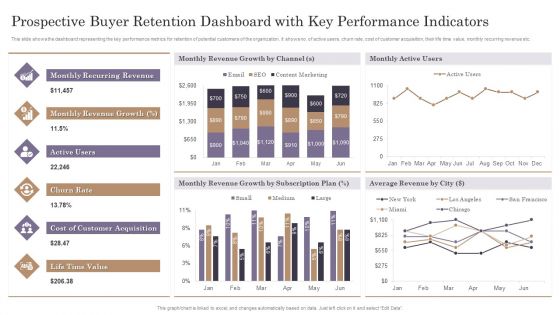
Prospective Buyer Retention Dashboard With Key Performance Indicators Themes PDF
This slide shows the dashboard representing the key performance metrics for retention of potential customers of the organization. It shows no. of active users, churn rate, cost of customer acquisition, their life time value, monthly recurring revenue etc.Pitch your topic with ease and precision using this Prospective Buyer Retention Dashboard With Key Performance Indicators Themes PDF. This layout presents information on Recurring Revenue, Revenue Growth, Customer Acquisition. It is also available for immediate download and adjustment. So, changes can be made in the color, design, graphics or any other component to create a unique layout.
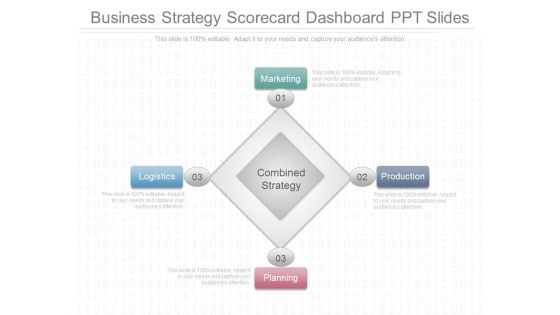
Business Strategy Scorecard Dashboard Ppt Slides
This is a business strategy scorecard dashboard ppt slides. This is a five stage process. The stages in this process are marketing, logistics, production, planning, combined strategy.
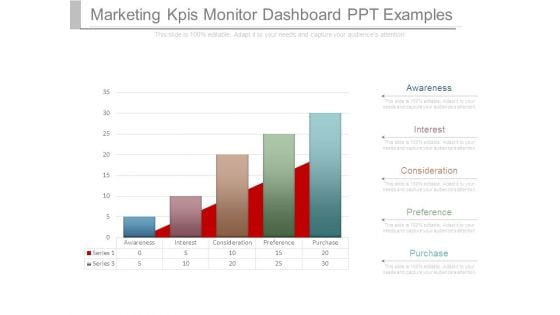
Marketing Kpis Monitor Dashboard Ppt Examples
This is a marketing kpis monitor dashboard ppt examples. This is a five stage process. The stages in this process are awareness, interest, consideration, preference, purchase.
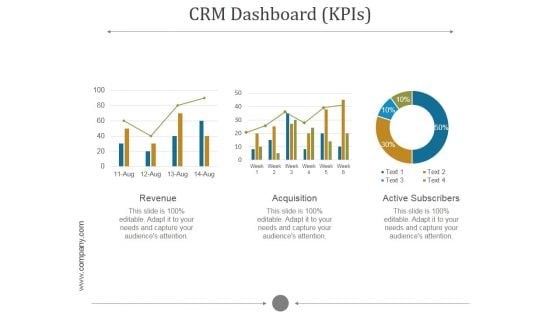
Crm Dashboard Kpis Ppt PowerPoint Presentation Pictures
This is a crm dashboard kpis ppt powerpoint presentation pictures. This is a five stage process. The stages in this process are revenue, acquisition, active subscribers.
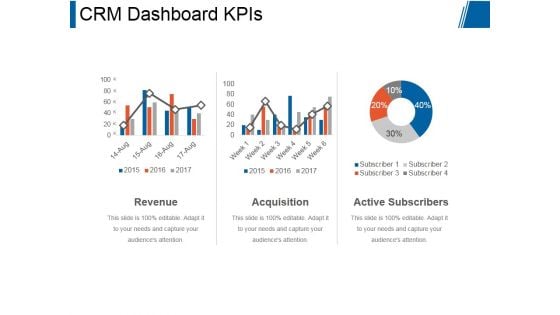
Crm Dashboard Kpis Ppt PowerPoint Presentation Rules
This is a crm dashboard kpis ppt powerpoint presentation rules. This is a three stage process. The stages in this process are revenue, acquisition, active subscribers.
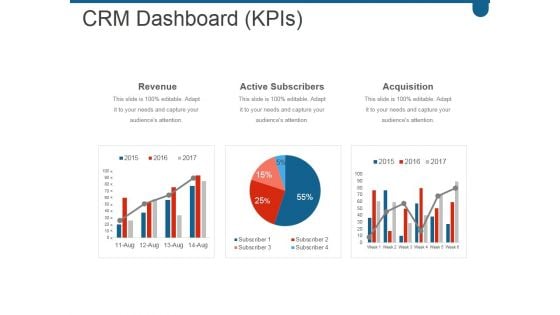
Crm Dashboard Kpis Ppt PowerPoint Presentation Layouts
This is a crm dashboard kpis ppt powerpoint presentation layouts. This is a three stage process. The stages in this process are revenue, active subscribers, acquisition.
Manufacturing And Kpis Dashboard Icon Clipart PDF
Presenting Manufacturing And Kpis Dashboard Icon Clipart PDF to dispense important information. This template comprises three stages. It also presents valuable insights into the topics including Manufacturing And Kpis, Dashboard Icon. This is a completely customizable PowerPoint theme that can be put to use immediately. So, download it and address the topic impactfully.
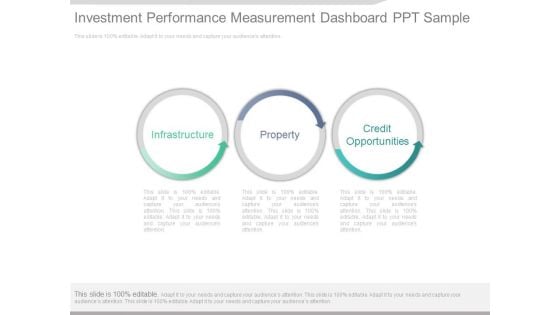
Investment Performance Measurement Dashboard Ppt Sample
This is an investment performance measurement dashboard ppt sample. This is a three stage process. The stages in this process are infrastructure, property, credit opportunities.
Online Customer Interaction Loyalty Program Performance Tracking Dashboard Rules PDF
This slide covers the KPI dashboard for analyzing customer loyalty campaign results. It includes metrics such as revenue, liability, NQP accrued, transaction count, members, redemption ratio, etc.Deliver an awe inspiring pitch with this creative Online Customer Interaction Loyalty Program Performance Tracking Dashboard Rules PDF bundle. Topics like Revenue Liability, Transaction Count, Redemption Ratio can be discussed with this completely editable template. It is available for immediate download depending on the needs and requirements of the user.
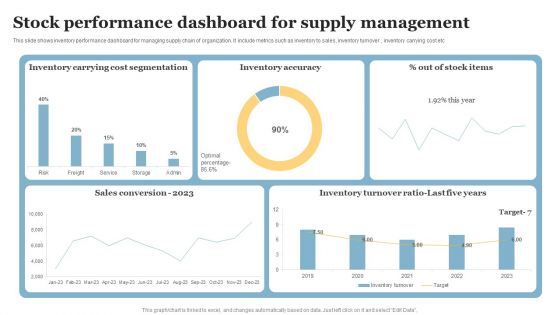
Stock Performance Dashboard For Supply Management Template PDF
This slide shows inventory performance dashboard for managing supply chain of organization. It include metrics such as inventory to sales, inventory turnover , inventory carrying cost etc. Showcasing this set of slides titled Stock Performance Dashboard For Supply Management Template PDF. The topics addressed in these templates are Inventory Carrying, Cost Segmentation, Inventory Accuracy. All the content presented in this PPT design is completely editable. Download it and make adjustments in color, background, font etc. as per your unique business setting.
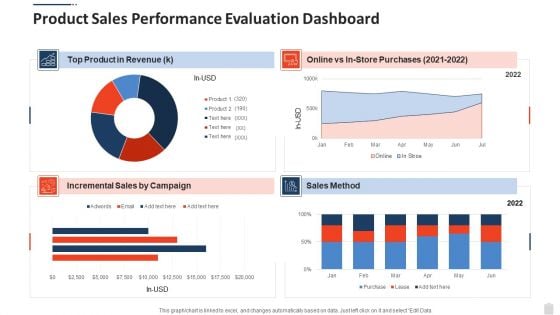
Product Sales Performance Evaluation Dashboard Graphics PDF
Pitch your topic with ease and precision using this product sales performance evaluation dashboard graphics pdf. This layout presents information on product sales performance evaluation dashboard. It is also available for immediate download and adjustment. So, changes can be made in the color, design, graphics or any other component to create a unique layout.
Client Support Performance Tracking Dashboard Template PDF
This slide shows KPI dashboard which can be used by organizations to track customer service delivery dashboard. It includes customer satisfaction score, total cases received, cases responses, etc. Showcasing this set of slides titled Client Support Performance Tracking Dashboard Template PDF. The topics addressed in these templates are Customer Satisfaction Score, Average, Cases By Product. All the content presented in this PPT design is completely editable. Download it and make adjustments in color, background, font etc. as per your unique business setting.
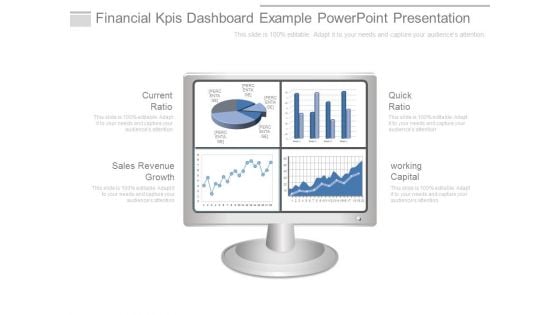
Financial Kpis Dashboard Example Powerpoint Presentation
This is a financial kpis dashboard example powerpoint presentation. This is a four stage process. The stages in this process are current ratio, sales revenue growth, quick ratio, working capital.
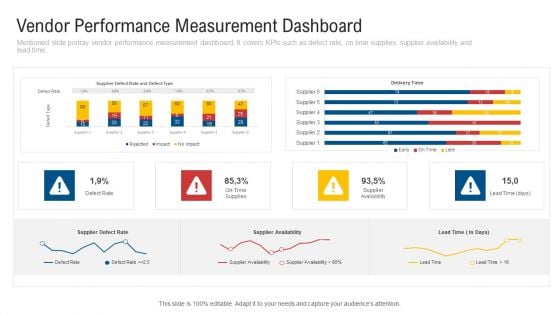
Vendor Performance Measurement Dashboard Brochure PDF
Mentioned slide portray vendor performance measurement dashboard. It covers KPIs such as defect rate, on time supplies, supplier availability and lead time. Deliver an awe inspiring pitch with this creative vendor performance measurement dashboard brochure pdf bundle. Topics like supplier defect rate, supplier availability, lead time can be discussed with this completely editable template. It is available for immediate download depending on the needs and requirements of the user.
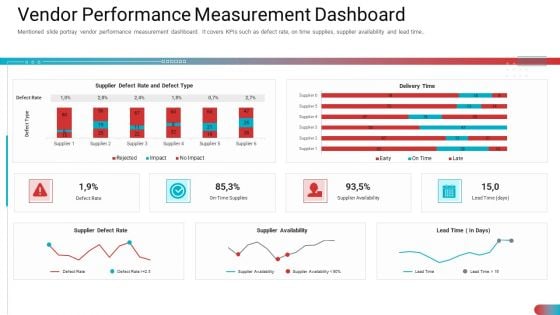
Vendor Performance Measurement Dashboard Inspiration PDF
Mentioned slide portray vendor performance measurement dashboard. It covers KPIs such as defect rate, on time supplies, supplier availability and lead time. Deliver and pitch your topic in the best possible manner with this vendor performance measurement dashboard inspiration pdf. Use them to share invaluable insights on supplier defect rate, supplier availability, lead time and impress your audience. This template can be altered and modified as per your expectations. So, grab it now.
KPI Dashboard Of Client Support Icons PDF
This slide shows customer service delivery key performance indicators dashboard. It includes KPIs such as issues received, average time to close issues, first call resolution, top performers, etc. Pitch your topic with ease and precision using this KPI Dashboard Of Client Support Icons PDF. This layout presents information on KPI Dashboard, Client Support. It is also available for immediate download and adjustment. So, changes can be made in the color, design, graphics or any other component to create a unique layout.
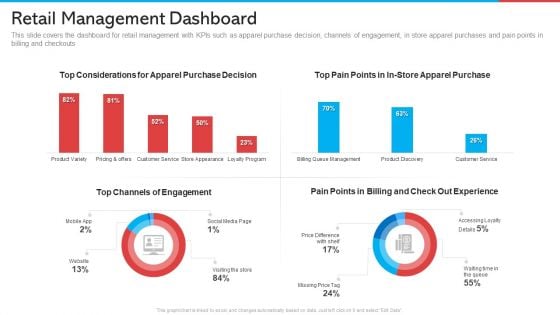
Retail Management Dashboard Retail Marketing Guidelines PDF
This slide covers the dashboard for retail management with KPIs such as apparel purchase decision, channels of engagement, in store apparel purchases and pain points in billing and checkouts Deliver an awe inspiring pitch with this creative retail management dashboard retail marketing guidelines pdf bundle. Topics like retail management dashboard can be discussed with this completely editable template. It is available for immediate download depending on the needs and requirements of the user.
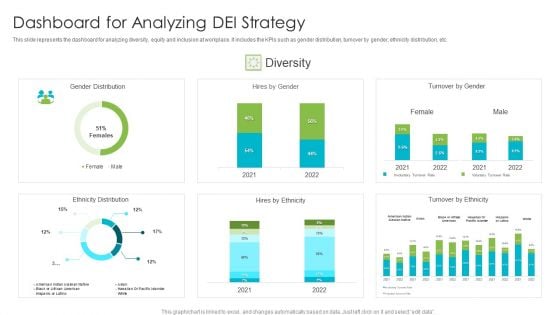
Dashboard For Analyzing DEI Strategy Template PDF
This slide represents the dashboard for analyzing diversity, equity and inclusion at workplace. It includes the KPIs such as gender distribution, turnover by gender, ethnicity distribution, etc. Showcasing this set of slides titled Dashboard For Analyzing DEI Strategy Template PDF. The topics addressed in these templates are Dashboard, Analyzing Dei Strategy. All the content presented in this PPT design is completely editable. Download it and make adjustments in color, background, font etc. as per your unique business setting.
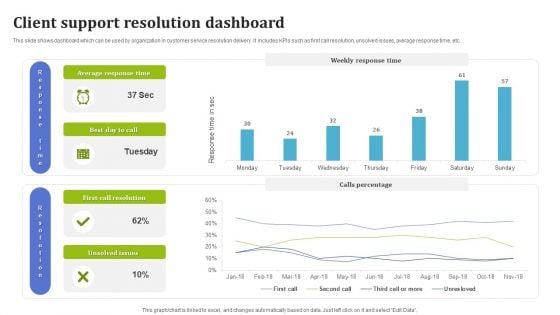
Client Support Resolution Dashboard Graphics PDF
This slide shows dashboard which can be used by organization in customer service resolution delivery. It includes KPIs such as first call resolution, unsolved issues, average response time, etc. Pitch your topic with ease and precision using this Client Support Resolution Dashboard Graphics PDF. This layout presents information on Client Support, Resolution Dashboard. It is also available for immediate download and adjustment. So, changes can be made in the color, design, graphics or any other component to create a unique layout.
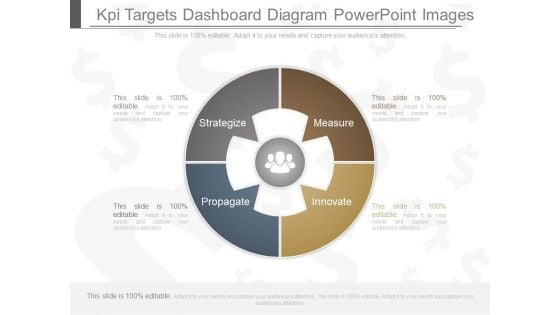
Kpi Targets Dashboard Diagram Powerpoint Images
This is a kpi targets dashboard diagram powerpoint images. This is a four stage process. The stages in this process are strategize, measure, propagate, innovate.
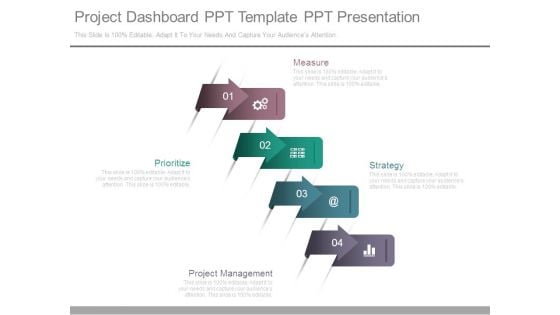
Project Dashboard Ppt Template Ppt Presentation
This is a project dashboard ppt template ppt presentation. This is a four stage process. The stages in this process are measure, strategy, project management, prioritize.

Client Acquisition Cost Measurement Dashboard Infographics PDF
This slide shows a Client Acquisition Cost CAC Measurement Dashboard with details such as total customers, employee satisfaction rate, number of trials, monthly active users, NPS net promoter score etc. Deliver an awe inspiring pitch with this creative client acquisition cost measurement dashboard infographics pdf bundle. Topics like funnel conversion rate, opportunity, key takeaways can be discussed with this completely editable template. It is available for immediate download depending on the needs and requirements of the user.

B2B Prospects Performance Measurement Dashboard Ideas PDF
This slide provides information regarding B2B performance tracking dashboard to measure leads, MQL, SQL, customers, revenue goals, total media spend. Deliver an awe inspiring pitch with this creative b2b prospects performance measurement dashboard ideas pdf bundle. Topics like ineffective in managing requirements, essential points are catered, understanding of company can be discussed with this completely editable template. It is available for immediate download depending on the needs and requirements of the user.
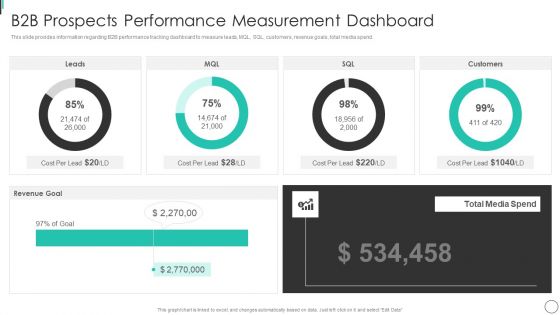
B2B Prospects Performance Measurement Dashboard Guidelines PDF
This slide provides information regarding B2B performance tracking dashboard to measure leads, MQL, SQL, customers, revenue goals, total media spend. Deliver an awe inspiring pitch with this creative B2B Prospects Performance Measurement Dashboard Guidelines PDF bundle. Topics like Customers, Leads, Revenue Goal can be discussed with this completely editable template. It is available for immediate download depending on the needs and requirements of the user.

KPI Dashboard Showcasing Product Management Guidelines PDF
This slide showcases dashboard providing product development team performance status with determined KPIs. It provides details such as product development team score, average result scores and result KPIs. Pitch your topic with ease and precision using this KPI Dashboard Showcasing Product Management Guidelines PDF. This layout presents information on Average Rating, Innovation, Design. It is also available for immediate download and adjustment. So, changes can be made in the color, design, graphics or any other component to create a unique layout.
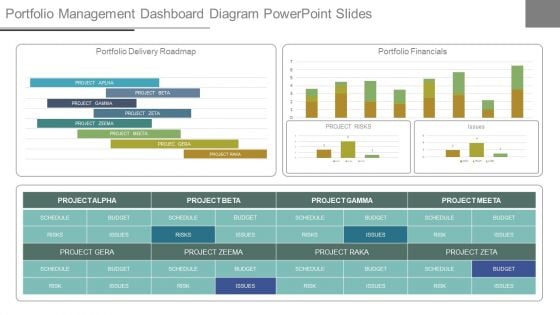
Portfolio Management Dashboard Diagram Powerpoint Slides
This is a portfolio management dashboard diagram powerpoint slides. This is a three stage process. The stages in this process are portfolio delivery roadmap, portfolio financials, project alpha, project beeta, project gama, project zeta, project zeema, schedule, risks, issues, budget.
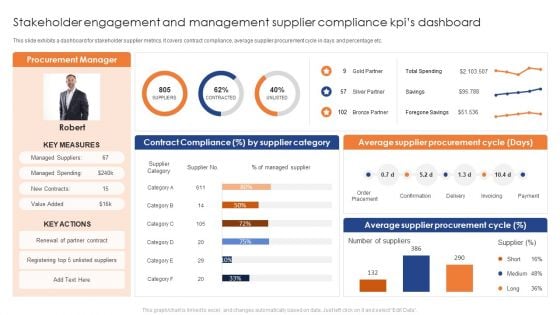
Stakeholder Engagement And Management Supplier Compliance Kpis Dashboard Pictures PDF
This slide exhibits a dashboard for stakeholder supplier metrics. It covers contract compliance, average supplier procurement cycle in days and percentage etc. Showcasing this set of slides titled Stakeholder Engagement And Management Supplier Compliance Kpis Dashboard Pictures PDF. The topics addressed in these templates are Average Supplier Procurement Cycle, Average Supplier Procurement Cycle . All the content presented in this PPT design is completely editable. Download it and make adjustments in color, background, font etc. as per your unique business setting.
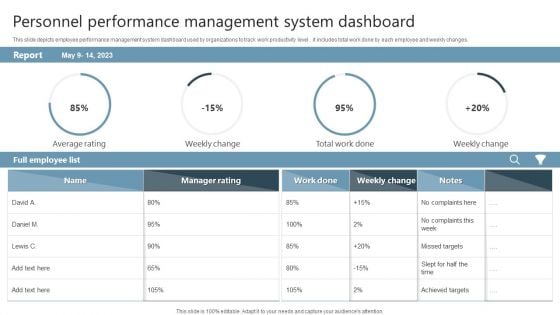
Personnel Performance Management System Dashboard Infographics PDF
This slide depicts employee performance management system dashboard used by organizations to track work productivity level . it includes total work done by each employee and weekly changes. Showcasing this set of slides titled Personnel Performance Management System Dashboard Infographics PDF. The topics addressed in these templates are Full Employee List, Manager Rating, Work Done. All the content presented in this PPT design is completely editable. Download it and make adjustments in color, background, font etc. as per your unique business setting.
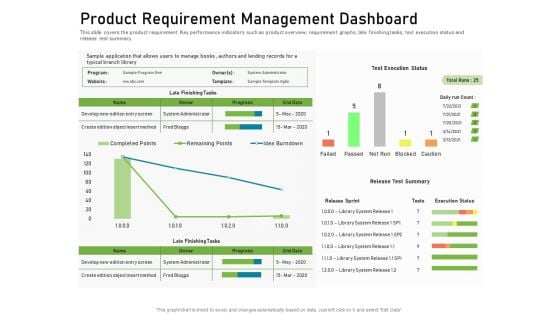
Product Requirement Management Dashboard Graphics PDF
This slide covers the product requirement Key performance indicators such as product overview, requirement graphs, late finishing tasks, text execution status and release test summary. Deliver and pitch your topic in the best possible manner with this product requirement management dashboard graphics pdf. Use them to share invaluable insights on product requirement management dashboard and impress your audience. This template can be altered and modified as per your expectations. So, grab it now.
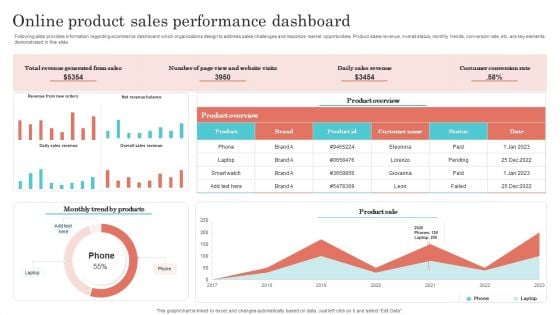
Online Product Sales Performance Dashboard Designs PDF
Following slide provides information regarding ecommerce dashboard which organizations design to address sales challenges and maximize market opportunities. Product sales revenue, overall status, monthly trends, conversion rate, etc. are key elements demonstrated in this slide. Showcasing this set of slides titled Online Product Sales Performance Dashboard Designs PDF. The topics addressed in these templates are Revenue Generated From Sales, Daily Sales Revenue, Costumer Conversion Rate. All the content presented in this PPT design is completely editable. Download it and make adjustments in color, background, font etc. as per your unique business setting.
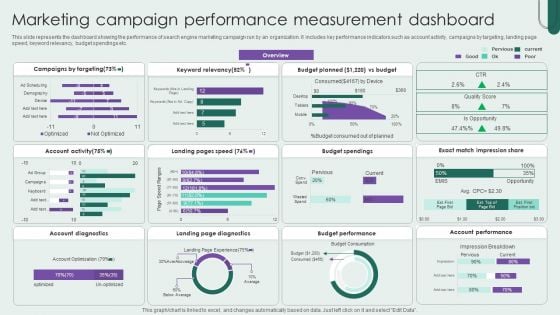
Marketing Campaign Performance Measurement Dashboard Download PDF
This slide represents the dashboard showing the performance of search engine marketing campaign run by an organization. It includes key performance indicators such as account activity, campaigns by targeting, landing page speed, keyword relevancy, budget spendings etc. Showcasing this set of slides titled Marketing Campaign Performance Measurement Dashboard Download PDF. The topics addressed in these templates are Keyword Relevancy, Campaigns By Targeting, Budget. All the content presented in this PPT design is completely editable. Download it and make adjustments in color, background, font etc. as per your unique business setting.
Cart Recovery Dashboard Ppt Outline Icon PDF
Measure which email campaigns brought the most recovery, which age group responded the best, and other KPIs via a dashboard. Deliver an awe-inspiring pitch with this creative cart recovery dashboard ppt outline icon pdf bundle. Topics like recovery by the numbers, recovery breakdown, revenue per email rpe can be discussed with this completely editable template. It is available for immediate download depending on the needs and requirements of the user.
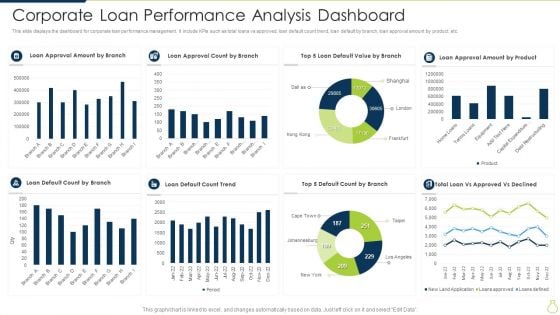
Corporate Loan Performance Analysis Dashboard Slides PDF
This slide displays the dashboard for corporate loan performance management. It include KPIs such as total loans vs approved, loan default count trend, loan default by branch, loan approval amount by product, etc. Showcasing this set of slides titled Corporate Loan Performance Analysis Dashboard Slides PDF. The topics addressed in these templates are Loan Default Count Trend, Loan Approval Count By Branch, Loan Approval Amount By Product. All the content presented in this PPT design is completely editable. Download it and make adjustments in color, background, font etc. as per your unique business setting.
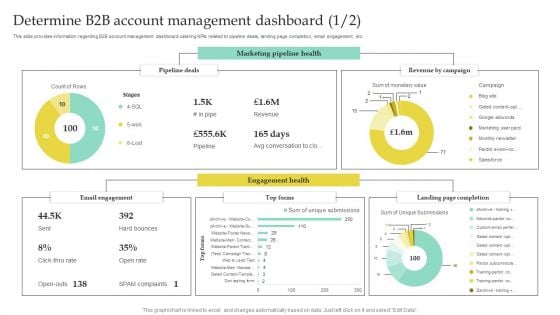
Determine B2B Account Management Dashboard Slides PDF
This slide provides information regarding B2B account management dashboard catering KPIs related to pipeline deals, landing page completion, email engagement, etc. Crafting an eye catching presentation has never been more straightforward. Let your presentation shine with this tasteful yet straightforward Determine B2B Account Management Dashboard Slides PDF template. It offers a minimalistic and classy look that is great for making a statement. The colors have been employed intelligently to add a bit of playfulness while still remaining professional. Construct the ideal Determine B2B Account Management Dashboard Slides PDF that effortlessly grabs the attention of your audience Begin now and be certain to wow your customers.
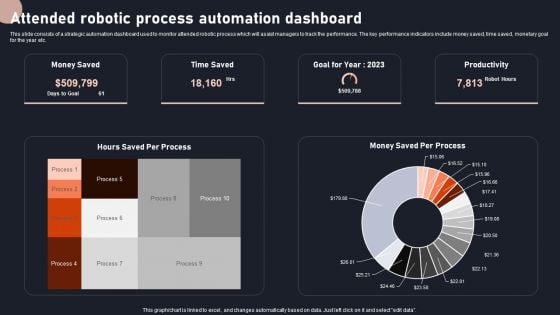
Attended Robotic Process Automation Dashboard Rules PDF
This slide consists of a strategic automation dashboard used to monitor attended robotic process which will assist managers to track the performance. The key performance indicators include money saved, time saved, monetary goal for the year etc. Showcasing this set of slides titled Attended Robotic Process Automation Dashboard Rules PDF. The topics addressed in these templates are Productivity, Goal, Process Automation Dashboard. All the content presented in this PPT design is completely editable. Download it and make adjustments in color, background, font etc. as per your unique business setting.
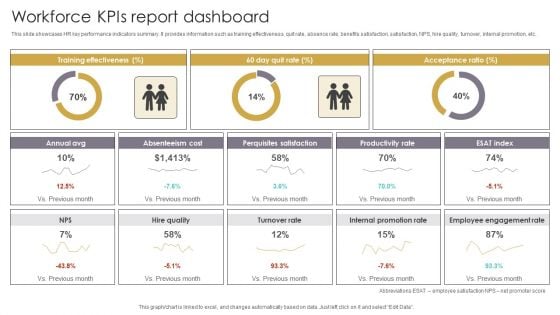
Workforce Kpis Report Dashboard Slides PDF
This slide showcases HR key performance indicators summary. It provides information such as training effectiveness, quit rate, absence rate, benefits satisfaction, satisfaction, NPS, hire quality, turnover, internal promotion, etc. Pitch your topic with ease and precision using this Workforce Kpis Report Dashboard Slides PDF. This layout presents information on Acceptance Ratio, Absenteeism Cost, Perquisites Satisfaction. It is also available for immediate download and adjustment. So, changes can be made in the color, design, graphics or any other component to create a unique layout.
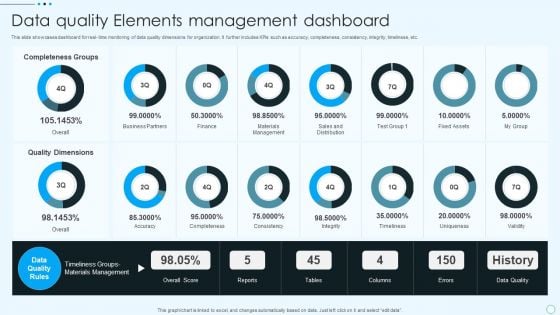
Data Quality Elements Management Dashboard Download PDF
This slide showcases dashboard for real- time monitoring of data quality dimensions for organization. It further includes KPIs such as accuracy, completeness, consistency, integrity, timeliness, etc. Showcasing this set of slides titled Data Quality Elements Management Dashboard Download PDF. The topics addressed in these templates are Quality Dimensions, Accuracy, Completeness, Consistency, Integrity, Timeliness. All the content presented in this PPT design is completely editable. Download it and make adjustments in color, background, font etc. as per your unique business setting.
Sales Performance Monthly Strategy Dashboard Icons PDF
Below slide showcases the monthly dashboard of sales performance . Company can measure and evaluate their monthly sales performance using key factors that are sales comparison, monthly sales, planned vs actual sales and gross margin by Pitch your topic with ease and precision using this sales performance monthly strategy dashboard icons pdf. This layout presents information on sales performance monthly strategy dashboard. It is also available for immediate download and adjustment. So, changes can be made in the color, design, graphics or any other component to create a unique layout.
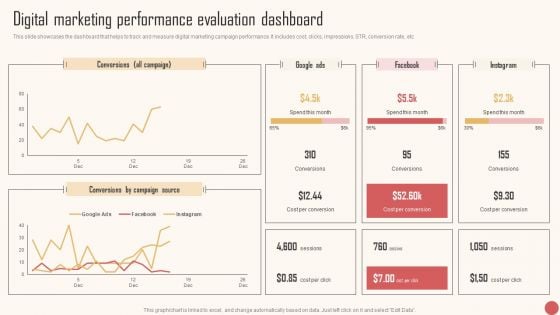
Digital Marketing Performance Evaluation Dashboard Microsoft PDF
This slide showcases the dashboard that helps to track and measure digital marketing campaign performance. It includes cost, clicks, impressions, STR, conversion rate, etc. Create an editable Digital Marketing Performance Evaluation Dashboard Microsoft PDF that communicates your idea and engages your audience. Whether you are presenting a business or an educational presentation, pre-designed presentation templates help save time. Digital Marketing Performance Evaluation Dashboard Microsoft PDF is highly customizable and very easy to edit, covering many different styles from creative to business presentations. Slidegeeks has creative team members who have crafted amazing templates. So, go and get them without any delay.

Monthly Product Sales Analysis Dashboard Infographics PDF
This slide illustrates a dashboard for product sales review to measure to help business monitor and improve productivity, employee engagement and meet revenue targets. It covers product names with sales reps, lead conversion, response time and outbound calls. Showcasing this set of slides titled Monthly Product Sales Analysis Dashboard Infographics PDF. The topics addressed in these templates are Lead Conversion Rate, Outbound Calls, Sales Analysis Dashboard. All the content presented in this PPT design is completely editable. Download it and make adjustments in color, background, font etc. as per your unique business setting.
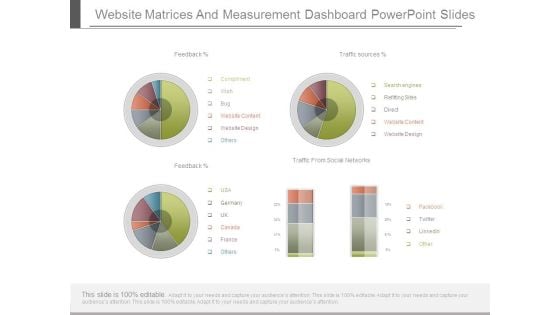
Website Matrices And Measurement Dashboard Powerpoint Slides
This is a website matrices and measurement dashboard powerpoint slides. This is a four stage process. The stages in this process are feedback, compliment, wish, bug, website content, website design, others, traffic sources, search engines, refitting sites, direct, website content, website design, traffic from social networks, usa, germany, uk, canada, france, facebook, twitter, linkedin.
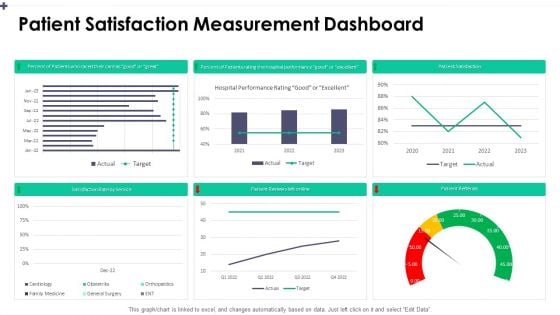
Patient Satisfaction Measurement Dashboard Slide2 Guidelines PDF
Deliver an awe inspiring pitch with this creative patient satisfaction measurement dashboard slide2 guidelines pdf bundle. Topics like percent of patients, percent of patients rating, patient reviews left online can be discussed with this completely editable template. It is available for immediate download depending on the needs and requirements of the user.
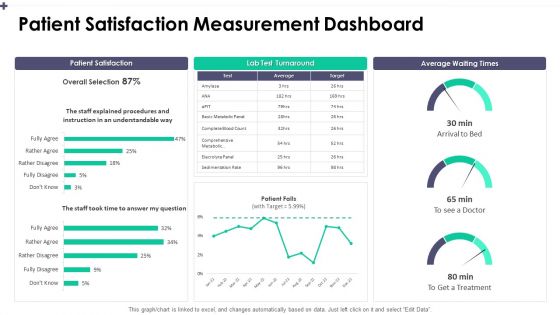
Patient Satisfaction Measurement Dashboard Graphics PDF
Deliver and pitch your topic in the best possible manner with this patient satisfaction measurement dashboard graphics pdf. Use them to share invaluable insights on patient satisfaction, lab test turnaround, average waiting times and impress your audience. This template can be altered and modified as per your expectations. So, grab it now.
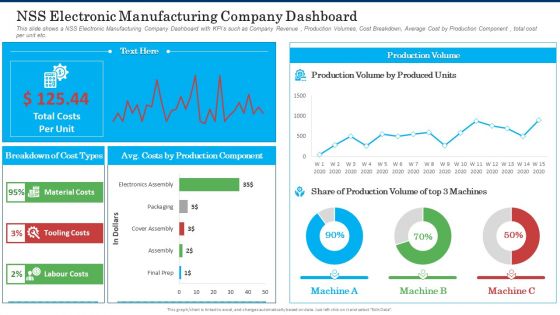
NSS Electronic Manufacturing Company Dashboard Topics PDF
This slide shows a NSS Electronic Manufacturing Company Dashboard with KPIs such as Company Revenue , Production Volumes, Cost Breakdown, Average Cost by Production Component , total cost per unit etc. Deliver an awe inspiring pitch with this creative nss electronic manufacturing company dashboard topics pdf bundle. Topics like material costs, tooling costs, labour costs, total costs per unit can be discussed with this completely editable template. It is available for immediate download depending on the needs and requirements of the user.

Vendor Compliance Monitoring Dashboard Background PDF
Following slide shows vendor compliance monitoring dashboard. It covers KPIs namely top supplier by partner status, average procurement cycle time and average procurement cycle. Deliver and pitch your topic in the best possible manner with this vendor compliance monitoring dashboard background pdf. Use them to share invaluable insights on suppliers, procurement and impress your audience. This template can be altered and modified as per your expectations. So, grab it now.

Vendor Compliance Monitoring Dashboard Template PDF
Following slide shows vendor compliance monitoring dashboard. It covers KPIs namely top supplier by partner status, average procurement cycle time and average procurement cycle. Deliver an awe-inspiring pitch with this creative vendor compliance monitoring dashboard template pdf. bundle. Topics like rate of contract compliance by supplier category, procurement cycle time, procurement cycle, top suppliers by partner status can be discussed with this completely editable template. It is available for immediate download depending on the needs and requirements of the user.

Dashboard Showing Production Quality Defects Guidelines PDF
This following slide exhibits a dashboard providing KPI of manufacturing quality. Major KPIs under this are total and defective production, average cycle duration and production rate.Showcasing this set of slides titled Dashboard Showing Production Quality Defects Guidelines PDF The topics addressed in these templates are Count Of Defects By Type, Defects Reported By Tester, Defective Production All the content presented in this PPT design is completely editable. Download it and make adjustments in color, background, font etc. as per your unique business setting.
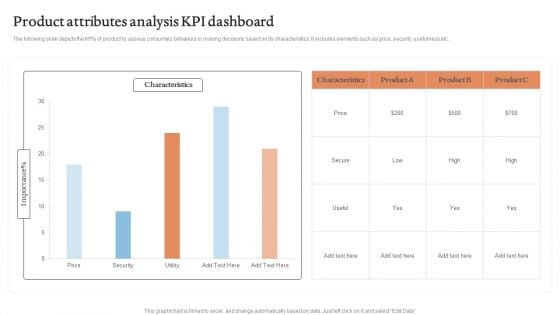
Product Attributes Analysis KPI Dashboard Graphics PDF
The following slide depicts the KPIs of product to assess consumers behaviour in making decisions based on its characteristics. It includes elements such as price, security, usefulness etc.Showcasing this set of slides titled Product Attributes Analysis KPI Dashboard Graphics PDF. The topics addressed in these templates are Characteristics, Product Attributes, Analysis KPI Dashboard. All the content presented in this PPT design is completely editable. Download it and make adjustments in color, background, font etc. as per your unique business setting.
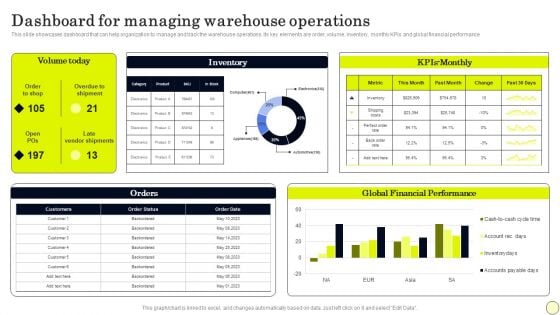
Dashboard For Managing Warehouse Operations Diagrams PDF
This slide showcases dashboard that can help organization to manage and track the warehouse operations. Its key elements are order, volume, inventory, monthly KPIs and global financial performance. Presenting this PowerPoint presentation, titled Dashboard For Managing Warehouse Operations Diagrams PDF, with topics curated by our researchers after extensive research. This editable presentation is available for immediate download and provides attractive features when used. Download now and captivate your audience. Presenting this Dashboard For Managing Warehouse Operations Diagrams PDF. Our researchers have carefully researched and created these slides with all aspects taken into consideration. This is a completely customizable Dashboard For Managing Warehouse Operations Diagrams PDF that is available for immediate downloading. Download now and make an impact on your audience. Highlight the attractive features available with our PPTs.
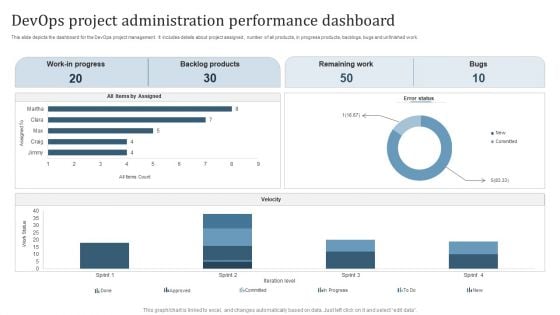
Devops Project Administration Performance Dashboard Themes PDF
This slide depicts the dashboard for the DevOps project management. It includes details about project assigned, number of all products, in progress products, backlogs, bugs and unfinished work. Pitch your topic with ease and precision using this Devops Project Administration Performance Dashboard Themes PDF. This layout presents information on Work In Progress, Backlog Products, Remaining Work, Bugs. It is also available for immediate download and adjustment. So, changes can be made in the color, design, graphics or any other component to create a unique layout.
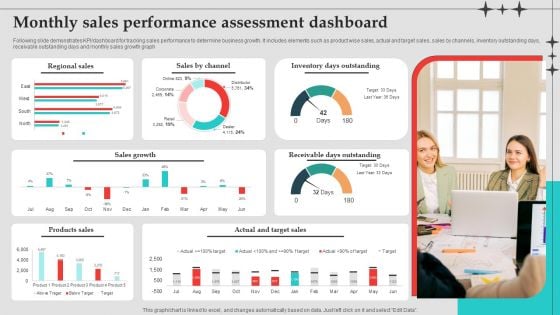
Monthly Sales Performance Assessment Dashboard Download PDF
Following slide demonstrates KPI or dashboard for tracking sales performance to determine business growth. It includes elements such as product wise sales, actual and target sales, sales by channels, inventory outstanding days, receivable outstanding days and monthly sales growth graph. Showcasing this set of slides titled Monthly Sales Performance Assessment Dashboard Download PDF. The topics addressed in these templates are Sales Growth, Inventory Days Outstanding, Target Sales. All the content presented in this PPT design is completely editable. Download it and make adjustments in color, background, font etc. as per your unique business setting.
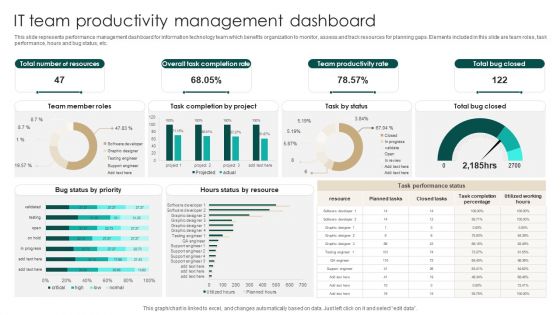
IT Team Productivity Management Dashboard Introduction PDF
This slide represents performance management dashboard for information technology team which benefits organization to monitor, assess and track resources for planning gaps. Elements included in this slide are team roles, task performance, hours and bug status, etc. Pitch your topic with ease and precision using this IT Team Productivity Management Dashboard Introduction PDF. This layout presents information on Total Number Resources, Overall Task Completion Rate, Team Productivity Rate. It is also available for immediate download and adjustment. So, changes can be made in the color, design, graphics or any other component to create a unique layout.


 Continue with Email

 Home
Home


