Metrics Dashboard
Product Sales Performance Tracking Dashboard Introduction PDF
This slide provides information regarding dashboard utilized by firm to monitor sales performance of products offered. The performance is tracked through revenues generated, online vs offline purchases, cost of goods sold, etc. Are you in need of a template that can accommodate all of your creative concepts This one is crafted professionally and can be altered to fit any style. Use it with Google Slides or PowerPoint. Include striking photographs, symbols, depictions, and other visuals. Fill, move around, or remove text boxes as desired. Test out color palettes and font mixtures. Edit and save your work, or work with colleagues. Download Product Sales Performance Tracking Dashboard Introduction PDF and observe how to make your presentation outstanding. Give an impeccable presentation to your group and make your presentation unforgettable.

PIM Software Solution Report Dashboard Mockup PDF
This slide covers the dashboard with active product information and performance report. It also includes product KPIs such as active products, missing products, items sold by category, and top 5 products. Pitch your topic with ease and precision using this PIM Software Solution Report Dashboard Mockup PDF. This layout presents information on Product Information, Product Performance, Missing Product Details. It is also available for immediate download and adjustment. So, changes can be made in the color, design, graphics or any other component to create a unique layout.
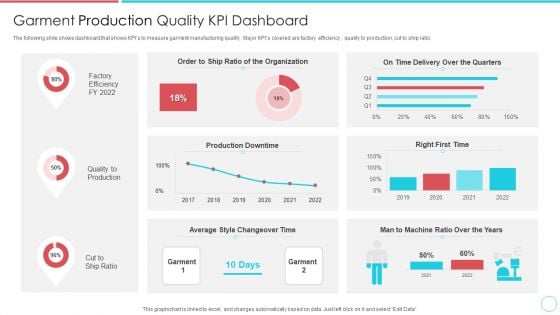
Garment Production Quality KPI Dashboard Portrait PDF
The following slide shows dashboard that shows KPIs to measure garment manufacturing quality . Major KPIs covered are factory efficiency , quality to production, cut to ship ratio.Pitch your topic with ease and precision using this Garment Production Quality KPI Dashboard Portrait PDF This layout presents information on Production Downtime, Time Delivery Over The Quarters, Average Style Changeover Time It is also available for immediate download and adjustment. So, changes can be made in the color, design, graphics or any other component to create a unique layout.
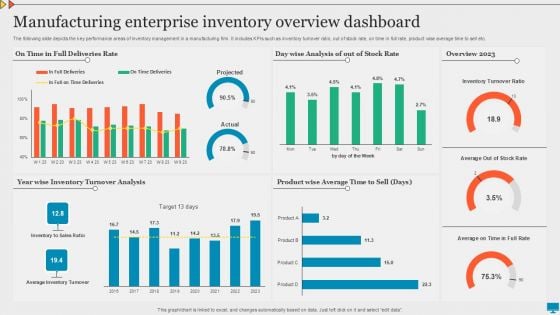
Manufacturing Enterprise Inventory Overview Dashboard Graphics PDF
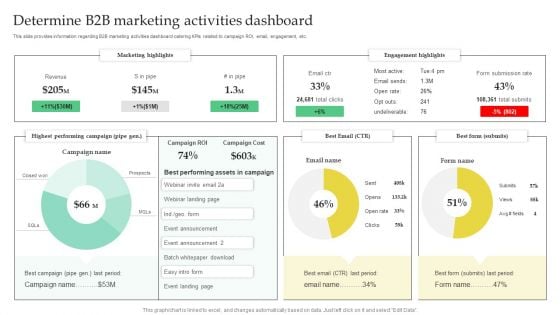
Determine B2B Marketing Activities Dashboard Professional PDF
This slide provides information regarding B2B marketing activities dashboard catering KPIs related to campaign ROI, email, engagement, etc. Formulating a presentation can take up a lot of effort and time, so the content and message should always be the primary focus. The visuals of the PowerPoint can enhance the presenters message, so our Determine B2B Marketing Activities Dashboard Professional PDF was created to help save time. Instead of worrying about the design, the presenter can concentrate on the message while our designers work on creating the ideal templates for whatever situation is needed. Slidegeeks has experts for everything from amazing designs to valuable content, we have put everything into Determine B2B Marketing Activities Dashboard Professional PDF.
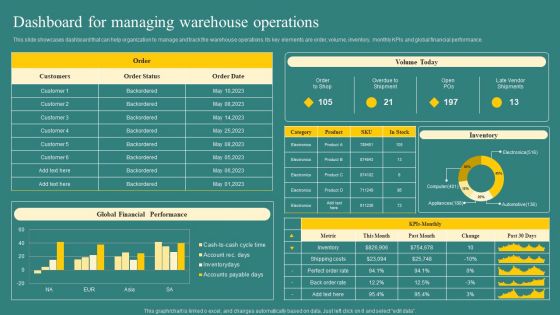
Dashboard For Managing Warehouse Operations Mockup PDF
This slide showcases dashboard that can help organization to manage and track the warehouse operations. Its key elements are order, volume, inventory, monthly KPIs and global financial performance. Here you can discover an assortment of the finest PowerPoint and Google Slides templates. With these templates, you can create presentations for a variety of purposes while simultaneously providing your audience with an eye catching visual experience. Download Dashboard For Managing Warehouse Operations Mockup PDF to deliver an impeccable presentation. These templates will make your job of preparing presentations much quicker, yet still, maintain a high level of quality. Slidegeeks has experienced researchers who prepare these templates and write high quality content for you. Later on, you can personalize the content by editing the Dashboard For Managing Warehouse Operations Mockup PDF.
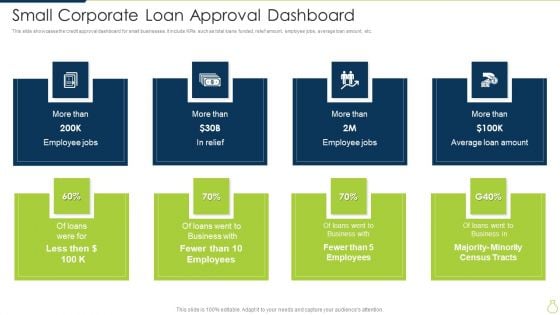
Small Corporate Loan Approval Dashboard Diagrams PDF
This slide showcases the credit approval dashboard for small businesses. It include KPIs such as total loans funded, relief amount, employee jobs, average loan amount, etc. Persuade your audience using this Small Corporate Loan Approval Dashboard Diagrams PDF. This PPT design covers eight stages, thus making it a great tool to use. It also caters to a variety of topics including Business, Loans, Census Tracts. Download this PPT design now to present a convincing pitch that not only emphasizes the topic but also showcases your presentation skills.
Company Financials Performance Tracking Dashboard Brochure PDF
This slide illustrates KPI dashboard that can be used by organizations to track their financial performance on company basis. Kpis covered in the slide are contract status, revenue, cost of goods, overdue and task status. Showcasing this set of slides titled Company Financials Performance Tracking Dashboard Brochure PDF. The topics addressed in these templates are Report Shortcut, Revenue Cost, Overdue Task. All the content presented in this PPT design is completely editable. Download it and make adjustments in color, background, font etc. as per your unique business setting.
Investment Project Prioritization KPI Dashboard Icons PDF
This slide covers project management dashboard for ranking and filtering capital projects. It also include KPIs such as top projects by NPV, top projects by IRR, investor amount, return amount, etc. Showcasing this set of slides titled Investment Project Prioritization KPI Dashboard Icons PDF. The topics addressed in these templates are Project Performance, Top Project NPV, Top Project IRR. All the content presented in this PPT design is completely editable. Download it and make adjustments in color, background, font etc. as per your unique business setting.
Tracking Goals Alignment KPI Dashboard Guidelines PDF
This slide showcases a tracking dashboard for determining the alignment and progress percentage of the assigned objectives. It also includes the objective evaluation KPIs such as active objectives, overall progress, total employees, objective as per employees, aligned, organizational and departmental objectives. Pitch your topic with ease and precision using this Tracking Goals Alignment KPI Dashboard Guidelines PDF. This layout presents information on Employee, Organizational Objectives, Departmental Objectives. It is also available for immediate download and adjustment. So, changes can be made in the color, design, graphics or any other component to create a unique layout.
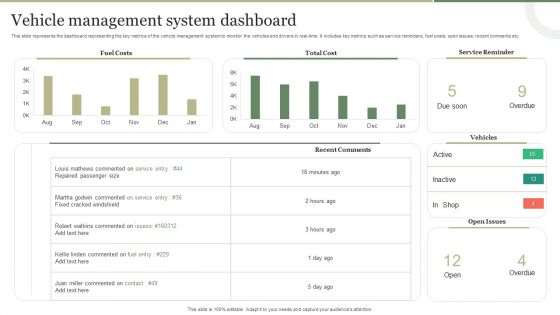
Vehicle Management System Dashboard Graphics PDF
This slide represents the dashboard to help fleet managers to monitor the vehicles and the drivers in real-time. It represents KPIs such as vehicle status, service reminders, open issues, inspections summary, service costs etc. Pitch your topic with ease and precision using this Vehicle Management System Dashboard Graphics PDF. This layout presents information on Vehicle Management System, Representing Maintenance Status. It is also available for immediate download and adjustment. So, changes can be made in the color, design, graphics or any other component to create a unique layout.
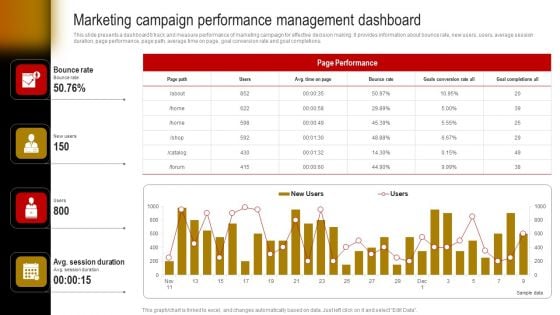
Marketing Campaign Performance Management Dashboard Professional PDF
This slide presents a dashboard ti track and measure performance of marketing campaign for effective decision making. It provides information about bounce rate, new users, users, average session duration, page performance, page path, average time on page, goal conversion rate and goal completions. Do you have to make sure that everyone on your team knows about any specific topic I yes, then you should give Marketing Campaign Performance Management Dashboard Professional PDF a try. Our experts have put a lot of knowledge and effort into creating this impeccable Marketing Campaign Performance Management Dashboard Professional PDF. You can use this template for your upcoming presentations, as the slides are perfect to represent even the tiniest detail. You can download these templates from the Slidegeeks website and these are easy to edit. So grab these today.
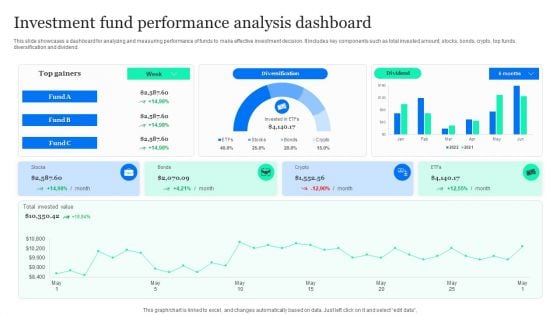
Investment Fund Performance Analysis Dashboard Professional PDF
This slide showcases a dashboard for analyzing and measuring performance of funds to make effective investment decision. It includes key components such as total invested amount, stocks, bonds, crypto, top funds, diversification and dividend. Pitch your topic with ease and precision using this Investment Fund Performance Analysis Dashboard Professional PDF. This layout presents information on Diversification, Invested Value, Bonds. It is also available for immediate download and adjustment. So, changes can be made in the color, design, graphics or any other component to create a unique layout.
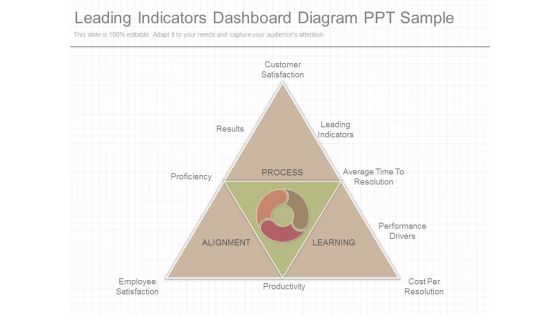
Leading Indicators Dashboard Diagram Ppt Sample
This is a leading indicators dashboard diagram ppt sample. This is a five stage process. The stages in this process are customer satisfaction, leading indicators, average time to resolution, performance drivers, cost per resolution, productivity, employee satisfaction, proficiency, results, process, learning, alignment.

Balance Scorecard Index Dashboard Ppt Slides
This is a balance scorecard index dashboard ppt slides. This is a one stage process. The stages in this process are sales by month, gross revenue, customer retention, executive scorecard, measures, status, trend, financial, option, customer, internal processes, learning and growth.
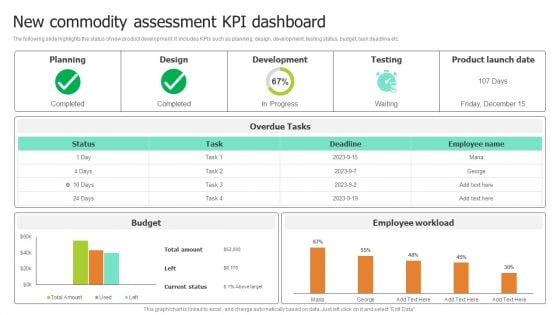
New Commodity Assessment Kpi Dashboard Pictures PDF
The following slide highlights the status of new product development. It includes KPIs such as planning, design, development, testing status, budget, task deadline etc.Showcasing this set of slides titled New Commodity Assessment Kpi Dashboard Pictures PDF. The topics addressed in these templates are Development, Product Launch Date, Overdue Tasks. All the content presented in this PPT design is completely editable. Download it and make adjustments in color, background, font etc. as per your unique business setting.
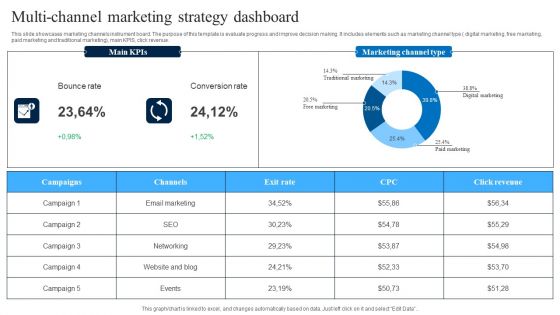
Multi Channel Marketing Strategy Dashboard Slides PDF
This slide showcases marketing channels instrument board. The purpose of this template is evaluate progress and improve decision making. It includes elements such as marketing channel type digital marketing, free marketing, paid marketing and traditional marketing, main KPIS, click revenue. Pitch your topic with ease and precision using this Multi Channel Marketing Strategy Dashboard Slides PDF. This layout presents information on Bounce Rate, Conversion Rate, Marketing Channel Type. It is also available for immediate download and adjustment. So, changes can be made in the color, design, graphics or any other component to create a unique layout.
Workforce Productivity Tracking Report Dashboard Background PDF
The given below slide depicts the KPIs of work stream status to assess progress and stagnation. It includes elements such as budget, risk, action plan, work stream timeline, highlights etc. Showcasing this set of slides titled Workforce Productivity Tracking Report Dashboard Background PDF. The topics addressed in these templates are High Technology Turnover, Workforce Health Safety Risk, Plan Employee Training. All the content presented in this PPT design is completely editable. Download it and make adjustments in color, background, font etc. as per your unique business setting.
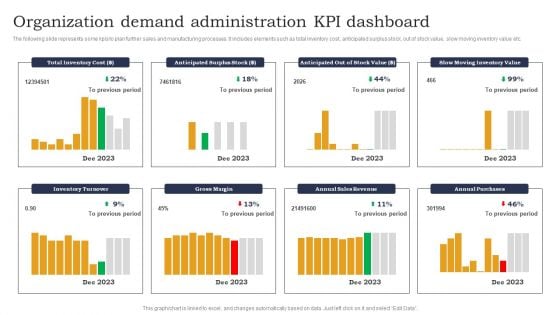
Organization Demand Administration KPI Dashboard Designs PDF
The following slide represents some kpis to plan further sales and manufacturing processes. It includes elements such as total inventory cost, anticipated surplus stock, out of stock value, slow moving inventory value etc. Pitch your topic with ease and precision using this Organization Demand Administration KPI Dashboard Designs PDF. This layout presents information on Anticipated Surplus Stock, Out Of Stock, Slow Moving Inventory. It is also available for immediate download and adjustment. So, changes can be made in the color, design, graphics or any other component to create a unique layout.
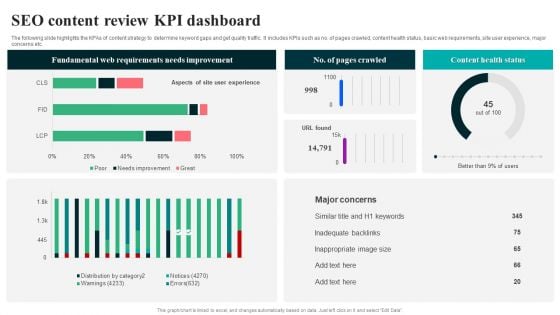
SEO Content Review KPI Dashboard Summary PDF
The following slide highlights the KPAs of content strategy to determine keyword gaps and get quality traffic. It includes KPIs such as no. of pages crawled, content health status, basic web requirements, site user experience, major concerns etc. Pitch your topic with ease and precision using this SEO Content Review KPI Dashboard Summary PDF. This layout presents information on Fundamental Web Requirements, Needs Improvement. It is also available for immediate download and adjustment. So, changes can be made in the color, design, graphics or any other component to create a unique layout.
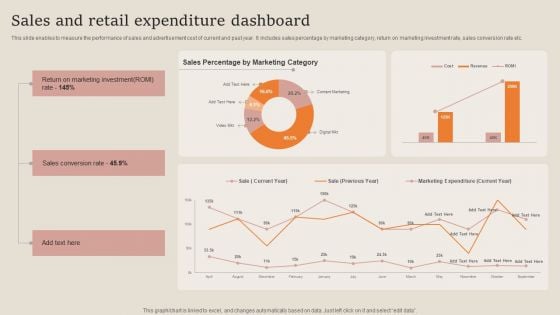
Sales And Retail Expenditure Dashboard Guidelines PDF
This slide enables to measure the performance of sales and advertisement cost of current and past year. It includes sales percentage by marketing category, return on marketing investment rate, sales conversion rate etc. Pitch your topic with ease and precision using this Sales And Retail Expenditure Dashboard Guidelines PDF. This layout presents information on Sales Conversion Rate, Marketing Investment. It is also available for immediate download and adjustment. So, changes can be made in the color, design, graphics or any other component to create a unique layout.
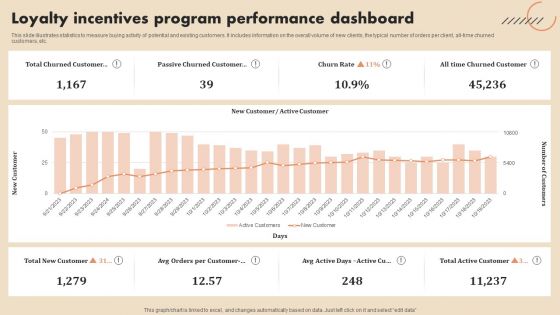
Loyalty Incentives Program Performance Dashboard Microsoft PDF
This slide illustrates statistics to measure buying activity of potential and existing customers. It includes information on the overall volume of new clients, the typical number of orders per client, all time churned customers, etc.Showcasing this set of slides titled Loyalty Incentives Program Performance Dashboard Microsoft PDF. The topics addressed in these templates are Total Churned Customer, Passive Churned Customer. All the content presented in this PPT design is completely editable. Download it and make adjustments in color, background, font etc. as per your unique business setting.
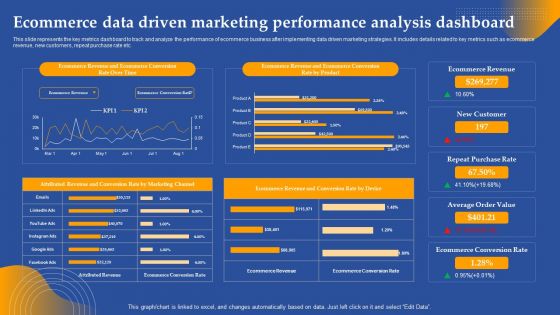
Ecommerce Data Driven Marketing Performance Analysis Dashboard Ppt Visual Aids Styles PDF
This slide represents the key metrics dashboard to track and analyze the performance of ecommerce business after implementing data driven marketing strategies. It includes details related to key metrics such as ecommerce revenue, new customers, repeat purchase rate etc. Slidegeeks has constructed Ecommerce Data Driven Marketing Performance Analysis Dashboard Ppt Visual Aids Styles PDF after conducting extensive research and examination. These presentation templates are constantly being generated and modified based on user preferences and critiques from editors. Here, you will find the most attractive templates for a range of purposes while taking into account ratings and remarks from users regarding the content. This is an excellent jumping off point to explore our content and will give new users an insight into our top notch PowerPoint Templates.
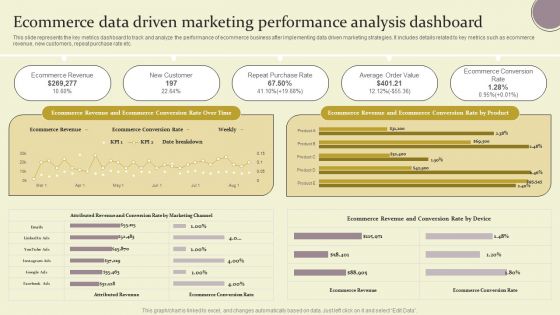
Ecommerce Data Driven Marketing Performance Analysis Dashboard Ppt Pictures Demonstration PDF
This slide represents the key metrics dashboard to track and analyze the performance of ecommerce business after implementing data driven marketing strategies. It includes details related to key metrics such as ecommerce revenue, new customers, repeat purchase rate etc. Slidegeeks has constructed Ecommerce Data Driven Marketing Performance Analysis Dashboard Ppt Pictures Demonstration PDF after conducting extensive research and examination. These presentation templates are constantly being generated and modified based on user preferences and critiques from editors. Here, you will find the most attractive templates for a range of purposes while taking into account ratings and remarks from users regarding the content. This is an excellent jumping off point to explore our content and will give new users an insight into our top notch PowerPoint Templates.
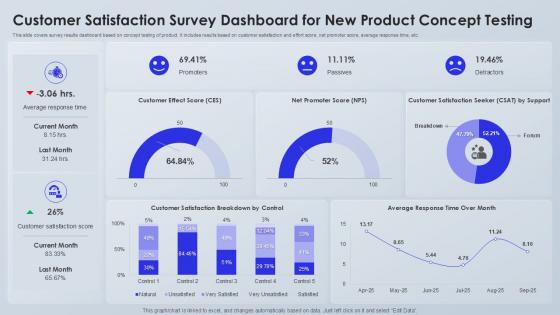
Customer Satisfaction Survey Dashboard For New Product Concept Testing
Find a pre-designed and impeccable Customer Satisfaction Survey Dashboard For New Product Concept Testing. The templates can ace your presentation without additional effort. You can download these easy-to-edit presentation templates to make your presentation stand out from others. So, what are you waiting for Download the template from Slidegeeks today and give a unique touch to your presentation. This slide highlights the survey results dashboard, focusing on product concept testing. It involves key metrics such as customer satisfaction, effort score, net promoter score, and average response time, providing valuable insights to refine and improve the product.
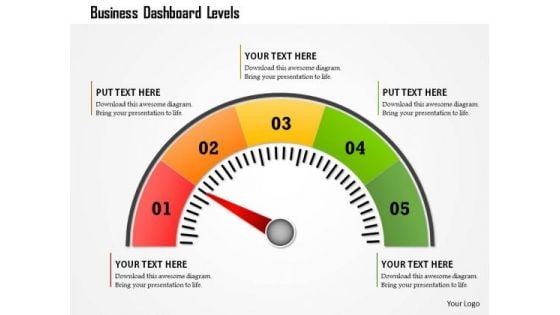
Business Framework Business Dashboard Levels PowerPoint Presentation
This business diagram displays colored meter with multiple levels. Use this diagram to display business process. This diagram can be used to indicate performance measures. This is an excellent diagram to impress your audiences.
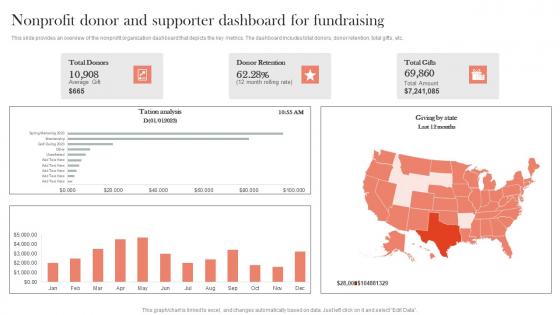
Non profit Donor And Supporter Dashboard For Efficient Nonprofit Marketing Template Pdf
This slide provides an overview of the nonprofit organization dashboard that depicts the key metrics. The dashboard includes total donors, donor retention, total gifts, etc.Create an editable Non profit Donor And Supporter Dashboard For Efficient Nonprofit Marketing Template Pdf that communicates your idea and engages your audience. Whether you are presenting a business or an educational presentation, pre-designed presentation templates help save time. Non profit Donor And Supporter Dashboard For Efficient Nonprofit Marketing Template Pdf is highly customizable and very easy to edit, covering many different styles from creative to business presentations. Slidegeeks has creative team members who have crafted amazing templates. So, go and get them without any delay. This slide provides an overview of the nonprofit organization dashboard that depicts the key metrics. The dashboard includes total donors, donor retention, total gifts, etc.
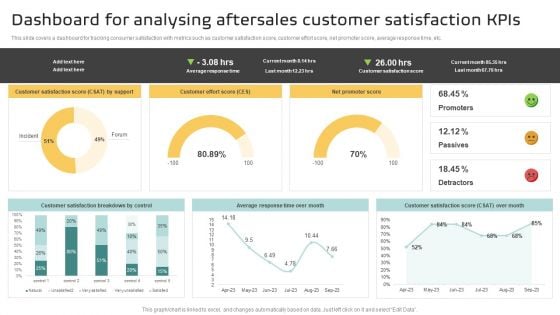
Dashboard For Analysing Aftersales Customer Satisfaction Kpis Information PDF
This slide covers a dashboard for tracking consumer satisfaction with metrics such as customer satisfaction score, customer effort score, net promoter score, average response time, etc. Find a pre designed and impeccable Dashboard For Analysing Aftersales Customer Satisfaction Kpis Information PDF. The templates can ace your presentation without additional effort. You can download these easy to edit presentation templates to make your presentation stand out from others. So, what are you waiting for Download the template from Slidegeeks today and give a unique touch to your presentation.
KPI Dashboard For Tracking Customer Retention Infographics PDF
This slide covers the dashboard for analyzing customer loyalty with metrics such as NPS, loyal customer rate, premium users, CLV, customer churn, revenue churn, net retention, MRR growth, etc. Slidegeeks is one of the best resources for PowerPoint templates. You can download easily and regulate KPI Dashboard For Tracking Customer Retention Infographics PDF for your personal presentations from our wonderful collection. A few clicks is all it takes to discover and get the most relevant and appropriate templates. Use our Templates to add a unique zing and appeal to your presentation and meetings. All the slides are easy to edit and you can use them even for advertisement purposes.
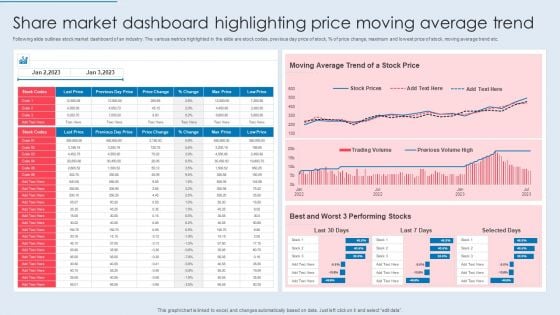
Share Market Dashboard Highlighting Price Moving Average Trend Themes PDF
Following slide outlines stock market dashboard of an industry. The various metrics highlighted in the slide are stock codes, previous day price of stock, percent of price change, maximum and lowest price of stock, moving average trend etc. Pitch your topic with ease and precision using this Share Market Dashboard Highlighting Price Moving Average Trend Themes PDF. This layout presents information on Moving Average, Stock Price, Performing Stocks. It is also available for immediate download and adjustment. So, changes can be made in the color, design, graphics or any other component to create a unique layout.
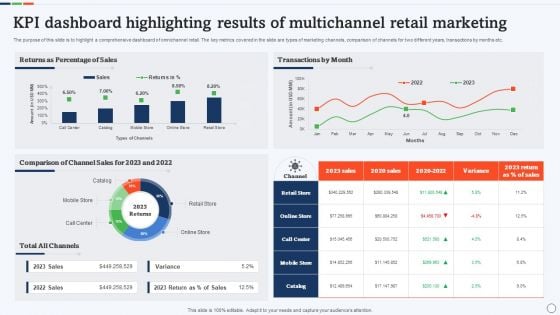
KPI Dashboard Highlighting Results Of Multichannel Retail Marketing Rules PDF
The purpose of this slide is to highlight a comprehensive dashboard of omnichannel retail. The key metrics covered in the slide are types of marketing channels, comparison of channels for two different years, transactions by months etc. Pitch your topic with ease and precision using this KPI Dashboard Highlighting Results Of Multichannel Retail Marketing Rules PDF. This layout presents information on Comparison Of Channel Sales, Percentage Of Sales, Transactions By Month. It is also available for immediate download and adjustment. So, changes can be made in the color, design, graphics or any other component to create a unique layout.
Increasing Customer Kpi Dashboard For Tracking Customer Retention Download PDF
This slide covers the dashboard for analyzing customer loyalty with metrics such as NPS, loyal customer rate, premium users, CLV, customer churn, revenue churn, net retention, MRR growth, etc. From laying roadmaps to briefing everything in detail, our templates are perfect for you. You can set the stage with your presentation slides. All you have to do is download these easy-to-edit and customizable templates. Increasing Customer Kpi Dashboard For Tracking Customer Retention Download PDF will help you deliver an outstanding performance that everyone would remember and praise you for. Do download this presentation today.
Dashboard For Tracking Aftersales Customer Services Team Performance Designs PDF
This slide covers the KPI dashboard for ticket tracking. It includes metrics such as tickets by month, service level, and details of customer service department agents. Boost your pitch with our creative Dashboard For Tracking Aftersales Customer Services Team Performance Designs PDF. Deliver an awe inspiring pitch that will mesmerize everyone. Using these presentation templates you will surely catch everyones attention. You can browse the ppts collection on our website. We have researchers who are experts at creating the right content for the templates. So you do not have to invest time in any additional work. Just grab the template now and use them.
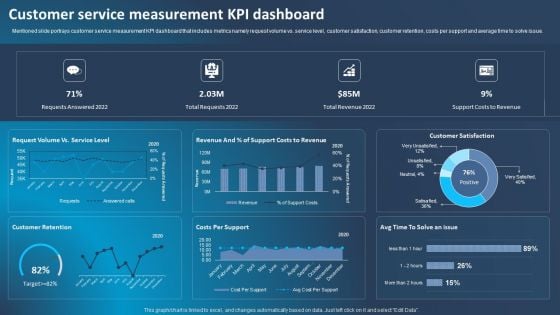
Improving Corporate Performance Customer Service Measurement Kpi Dashboard Microsoft PDF
Mentioned slide portrays customer service measurement KPI dashboard that includes metrics namely request volume vs. service level, customer satisfaction, customer retention, costs per support and average time to solve issue. Do you have to make sure that everyone on your team knows about any specific topic I yes, then you should give Improving Corporate Performance Customer Service Measurement Kpi Dashboard Microsoft PDF a try. Our experts have put a lot of knowledge and effort into creating this impeccable Improving Corporate Performance Customer Service Measurement Kpi Dashboard Microsoft PDF. You can use this template for your upcoming presentations, as the slides are perfect to represent even the tiniest detail. You can download these templates from the Slidegeeks website and these are easy to edit. So grab these today.
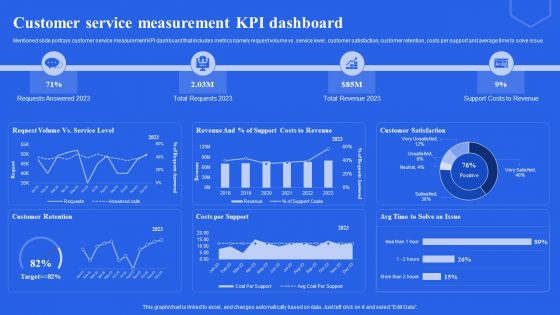
Customer Service Measurement KPI Dashboard Ppt File Portfolio PDF
Mentioned slide portrays customer service measurement KPI dashboard that includes metrics namely request volume vs. service level, customer satisfaction, customer retention, costs per support and average time to solve issue. Do you have to make sure that everyone on your team knows about any specific topic I yes, then you should give Customer Service Measurement KPI Dashboard Ppt File Portfolio PDF a try. Our experts have put a lot of knowledge and effort into creating this impeccable Customer Service Measurement KPI Dashboard Ppt File Portfolio PDF. You can use this template for your upcoming presentations, as the slides are perfect to represent even the tiniest detail. You can download these templates from the Slidegeeks website and these are easy to edit. So grab these today.
Monthly Sales Performance Tracking And Monitoring Dashboard Sample PDF
This slide showcases a dashboard presenting various metrics to measure and analyze sales performance for revenue growth. It includes key components such as number of sales, revenue, profit, cost, sales revenue, sales increment, cost analysis and cross sell. Do you have to make sure that everyone on your team knows about any specific topic I yes, then you should give Monthly Sales Performance Tracking And Monitoring Dashboard Sample PDF a try. Our experts have put a lot of knowledge and effort into creating this impeccable Monthly Sales Performance Tracking And Monitoring Dashboard Sample PDF. You can use this template for your upcoming presentations, as the slides are perfect to represent even the tiniest detail. You can download these templates from the Slidegeeks website and these are easy to edit. So grab these today.
Employee Performance Tracking And Management Dashboard Ideas PDF
This slide showcases a dashboard presenting various metrics to measure and analyze employee overall performance. It outlines information about average absenteeism rate, yearly average overtime hours, training costs and overall labor effectiveness. Do you have an important presentation coming up Are you looking for something that will make your presentation stand out from the rest Look no further than Employee Performance Tracking And Management Dashboard Ideas PDF. With our professional designs, you can trust that your presentation will pop and make delivering it a smooth process. And with Slidegeeks, you can trust that your presentation will be unique and memorable. So why wait Grab Employee Performance Tracking And Management Dashboard Ideas PDF today and make your presentation stand out from the rest.
Employee Performance Tracking And Management Dashboard Pictures PDF
This slide showcases a dashboard presenting various metrics to measure and analyze employee overall performance. It outlines information about average absenteeism rate, yearly average overtime hours, training costs and overall labor effectiveness. Find highly impressive Employee Performance Tracking And Management Dashboard Pictures PDF on Slidegeeks to deliver a meaningful presentation. You can save an ample amount of time using these presentation templates. No need to worry to prepare everything from scratch because Slidegeeks experts have already done a huge research and work for you. You need to download Employee Performance Tracking And Management Dashboard Pictures PDF for your upcoming presentation. All the presentation templates are 100 percent editable and you can change the color and personalize the content accordingly. Download now.
Employee Performance Tracking And Management Dashboard Designs PDF
This slide showcases a dashboard presenting various metrics to measure and analyze employee overall performance. It outlines information about average absenteeism rate, yearly average overtime hours, training costs and overall labor effectiveness. Formulating a presentation can take up a lot of effort and time, so the content and message should always be the primary focus. The visuals of the PowerPoint can enhance the presenters message, so our Employee Performance Tracking And Management Dashboard Designs PDF was created to help save time. Instead of worrying about the design, the presenter can concentrate on the message while our designers work on creating the ideal templates for whatever situation is needed. Slidegeeks has experts for everything from amazing designs to valuable content, we have put everything into Employee Performance Tracking And Management Dashboard Designs PDF
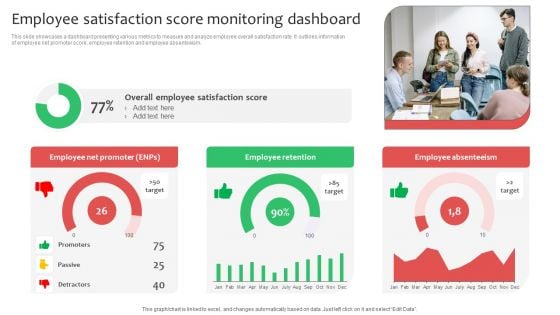
Employee Satisfaction Score Monitoring Dashboard Ppt Infographics Deck PDF
This slide showcases a dashboard presenting various metrics to measure and analyze employee overall satisfaction rate. It outlines information of employee net promoter score, employee retention and employee absenteeism. This Employee Satisfaction Score Monitoring Dashboard Ppt Infographics Deck PDF from Slidegeeks makes it easy to present information on your topic with precision. It provides customization options, so you can make changes to the colors, design, graphics, or any other component to create a unique layout. It is also available for immediate download, so you can begin using it right away. Slidegeeks has done good research to ensure that you have everything you need to make your presentation stand out. Make a name out there for a brilliant performance.
Monthly Sales Performance Tracking And Monitoring Dashboard Inspiration PDF
This slide showcases a dashboard presenting various metrics to measure and analyze sales performance for revenue growth. It includes key components such as number of sales, revenue, profit, cost, sales revenue, sales increment, cost analysis and cross sell. Coming up with a presentation necessitates that the majority of the effort goes into the content and the message you intend to convey. The visuals of a PowerPoint presentation can only be effective if it supplements and supports the story that is being told. Keeping this in mind our experts created Monthly Sales Performance Tracking And Monitoring Dashboard Inspiration PDF to reduce the time that goes into designing the presentation. This way, you can concentrate on the message while our designers take care of providing you with the right template for the situation.
Online Product Planning Ecommerce Management KPIS And Dashboard Ppt Professional Example PDF
Presenting this set of slides with name online product planning ecommerce management kpis and dashboard ppt professional example pdf. This is a two stage process. The stages in this process are kpi metrics, kpi dashboards. This is a completely editable PowerPoint presentation and is available for immediate download. Download now and impress your audience.
Ecommerce Management Kpis And Dashboard Ppt PowerPoint Presentation Show Layouts PDF
Presenting this set of slides with name ecommerce management kpis and dashboard ppt powerpoint presentation show layouts pdf. This is a two stage process. The stages in this process are kpi metrics, kpi dashboards. This is a completely editable PowerPoint presentation and is available for immediate download. Download now and impress your audience.
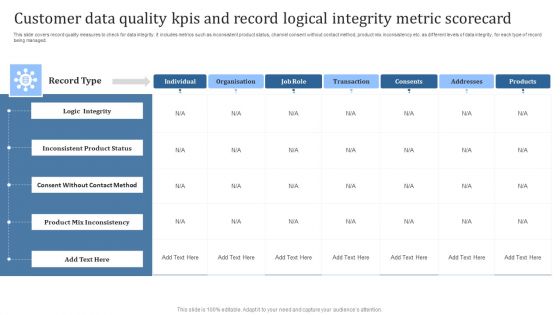
Customer Data Quality Kpis And Record Logical Integrity Metric Scorecard Introduction PDF
This slide covers record quality measures to check for data integrity. It includes metrics such as inconsistent product status, channel consent without contact method, product mix inconsistency etc. as different levels of data integrity, for each type of record being managed. Showcasing this set of slides titled Customer Data Quality Kpis And Record Logical Integrity Metric Scorecard Introduction PDF. The topics addressed in these templates are Logic Integrity, Inconsistent Product Status. All the content presented in this PPT design is completely editable. Download it and make adjustments in color, background, font etc. as per your unique business setting.
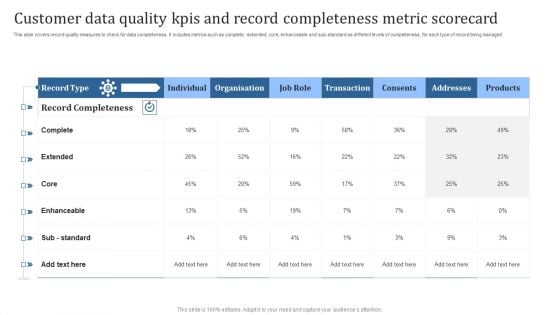
Customer Data Quality Kpis And Record Completeness Metric Scorecard Brochure PDF
This slide covers record quality measures to check for data completeness. It includes metrics such as complete, extended, core, enhanceable and sub-standard as different levels of completeness, for each type of record being managed. Showcasing this set of slides titled Customer Data Quality Kpis And Record Completeness Metric Scorecard Brochure PDF. The topics addressed in these templates are Complete, Enhanceable, Core. All the content presented in this PPT design is completely editable. Download it and make adjustments in color, background, font etc. as per your unique business setting.
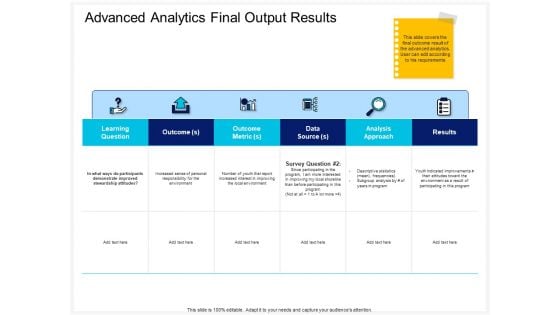
Enterprise Problem Solving And Intellect Advanced Analytics Final Output Results Metric Designs PDF
Presenting this set of slides with name enterprise problem solving and intellect advanced analytics final output results metric designs pdf. The topics discussed in these slides are learning question, outcome, outcome metric, data source analysis approach, results. This is a completely editable PowerPoint presentation and is available for immediate download. Download now and impress your audience.
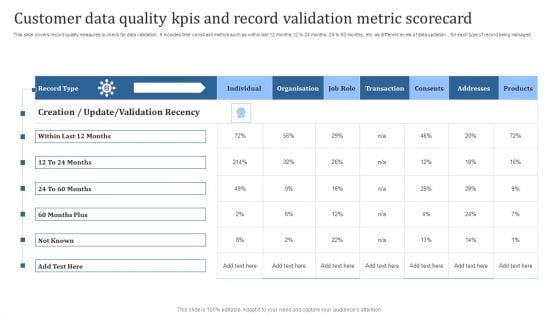
Customer Data Quality Kpis And Record Validation Metric Scorecard Introduction PDF
Showcasing this set of slides titled Customer Data Quality Kpis And Record Validation Metric Scorecard Introduction PDF. The topics addressed in these templates are Data Quality Kpis, Record Validation, Metric Scorecard. All the content presented in this PPT design is completely editable. Download it and make adjustments in color, background, font etc. as per your unique business setting.
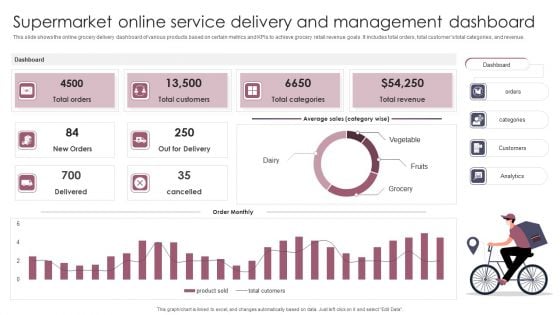
Supermarket Online Service Delivery And Management Dashboard Formats PDF
This slide shows the online grocery delivery dashboard of various products based on certain metrics and KPIs to achieve grocery retail revenue goals. It includes total orders, total customers total categories, and revenue. Showcasing this set of slides titled Supermarket Online Service Delivery And Management Dashboard Formats PDF. The topics addressed in these templates are Total Revenue, Total Customers, Dashboard. All the content presented in this PPT design is completely editable. Download it and make adjustments in color, background, font etc. as per your unique business setting.
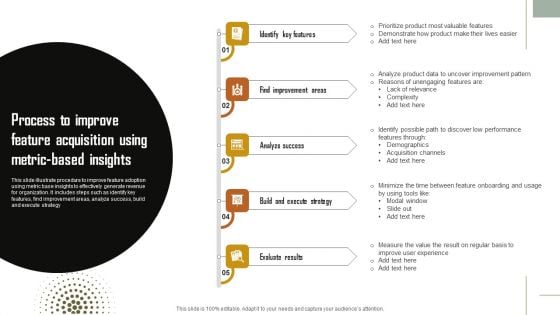
Process To Improve Feature Acquisition Using Metric Based Insights Topics PDF
This slide illustrate procedure to improve feature adoption using metric base insights to effectively generate revenue for organization. It includes steps such as identify key features, find improvement areas, analyze success, build and execute strategy. Persuade your audience using this Process To Improve Feature Acquisition Using Metric Based Insights Topics PDF. This PPT design covers five stages, thus making it a great tool to use. It also caters to a variety of topics including Analyze Success, Build And Execute Strategy, Evaluate Results. Download this PPT design now to present a convincing pitch that not only emphasizes the topic but also showcases your presentation skills.
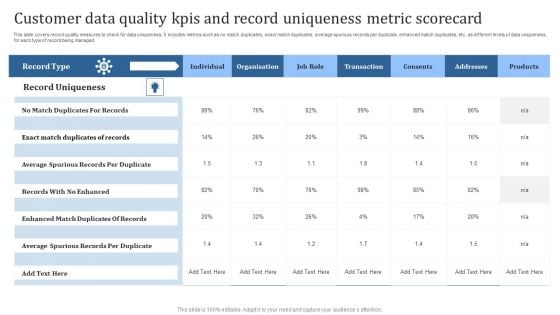
Customer Data Quality Kpis And Record Uniqueness Metric Scorecard Background PDF
Pitch your topic with ease and precision using this Customer Data Quality Kpis And Record Uniqueness Metric Scorecard Background PDF. This layout presents information on Average Spurious, Records Per Duplicate. It is also available for immediate download and adjustment. So, changes can be made in the color, design, graphics or any other component to create a unique layout.
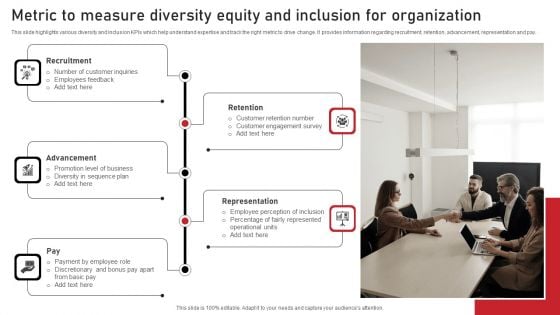
Metric To Measure Diversity Equity And Inclusion For Organization Elements PDF
This slide highlights various diversity and inclusion KPIs which help understand expertise and track the right metric to drive change. It provides information regarding recruitment, retention, advancement, representation and pay. Persuade your audience using this Metric To Measure Diversity Equity And Inclusion For Organization Elements PDF. This PPT design covers five stages, thus making it a great tool to use. It also caters to a variety of topics including Recruitment, Advancement, Representation. Download this PPT design now to present a convincing pitch that not only emphasizes the topic but also showcases your presentation skills.
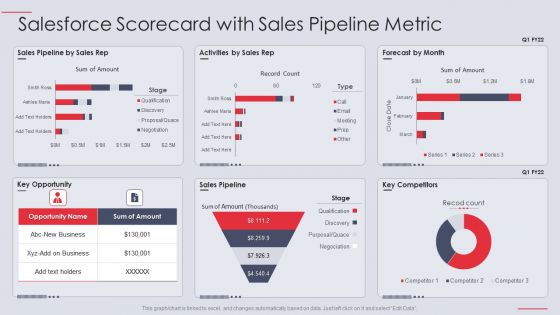
Salesforce Scorecard With Sales Pipeline Metric Ppt PowerPoint Presentation Professional Diagrams PDF
Deliver and pitch your topic in the best possible manner with this Salesforce Scorecard With Sales Pipeline Metric Ppt PowerPoint Presentation Professional Diagrams PDF Use them to share invaluable insights on Activities Sales, Sales Pipeline, Key Competitors and impress your audience. This template can be altered and modified as per your expectations. So, grab it now.
Google Adwords Strategic Campaign Performance Tracking Dashboard Icons PDF
This slide showcases KPI dashboard for real time tracking of performance metrics for google adwords campaign. It includes elements such as cost interactions, impressions, device, etc. Showcasing this set of slides titled Google Adwords Strategic Campaign Performance Tracking Dashboard Icons PDF. The topics addressed in these templates are Campaign Performance Device, Interaction Rate Cost Device, Daily Cost Device. All the content presented in this PPT design is completely editable. Download it and make adjustments in color, background, font etc. as per your unique business setting.
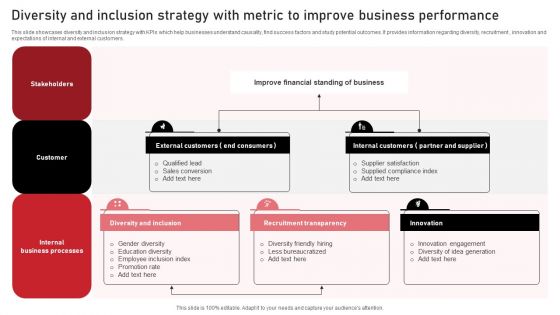
Diversity And Inclusion Strategy With Metric To Improve Business Performance Information PDF
This slide showcases diversity and inclusion strategy with KPIs which help businesses understand causality, find success factors and study potential outcomes. It provides information regarding diversity, recruitment , innovation and expectations of internal and external customers. Pitch your topic with ease and precision using this Diversity And Inclusion Strategy With Metric To Improve Business Performance Information PDF. This layout presents information on Stakeholders, Customer, Business Processes. It is also available for immediate download and adjustment. So, changes can be made in the color, design, graphics or any other component to create a unique layout.
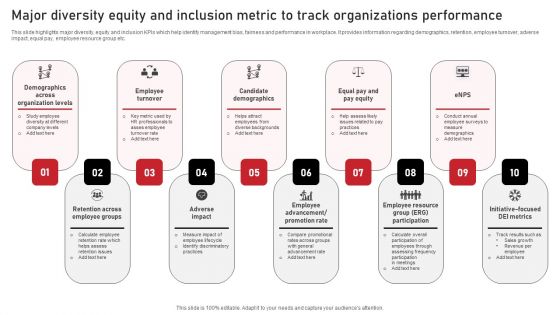
Major Diversity Equity And Inclusion Metric To Track Organizations Performance Diagrams PDF
This slide highlights major diversity, equity and inclusion KPIs which help identify management bias, fairness and performance in workplace. It provides information regarding demographics, retention, employee turnover, adverse impact, equal pay, employee resource group etc. Presenting Major Diversity Equity And Inclusion Metric To Track Organizations Performance Diagrams PDF to dispense important information. This template comprises ten stages. It also presents valuable insights into the topics including Employee Turnover, Candidate Demographics, Adverse Impact. This is a completely customizable PowerPoint theme that can be put to use immediately. So, download it and address the topic impactfully.
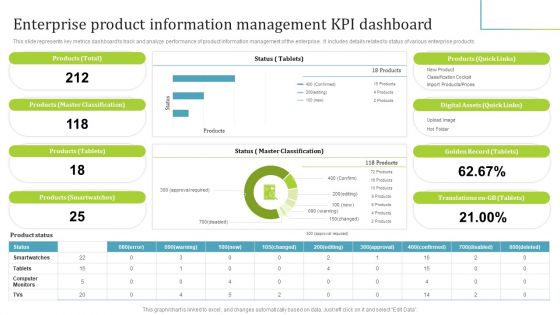
PIM Software Deployment To Enhance Conversion Rates Enterprise Product Information Management KPI Dashboard Infographics PDF
This slide represents key metrics dashboard to track and analyze performance of product information management of the enterprise. It includes details related to status of various enterprise products. Here you can discover an assortment of the finest PowerPoint and Google Slides templates. With these templates, you can create presentations for a variety of purposes while simultaneously providing your audience with an eye catching visual experience. Download PIM Software Deployment To Enhance Conversion Rates Enterprise Product Information Management KPI Dashboard Infographics PDF to deliver an impeccable presentation. These templates will make your job of preparing presentations much quicker, yet still, maintain a high level of quality. Slidegeeks has experienced researchers who prepare these templates and write high quality content for you. Later on, you can personalize the content by editing the PIM Software Deployment To Enhance Conversion Rates Enterprise Product Information Management KPI Dashboard Infographics PDF.
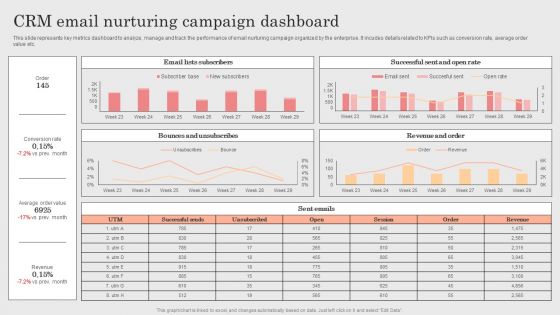
Integrating CRM Solution To Acquire Potential Customers CRM Email Nurturing Campaign Dashboard Template PDF
This slide represents key metrics dashboard to analyze, manage and track the performance of email nurturing campaign organized by the enterprise. It incudes details related to KPIs such as conversion rate, average order value etc. If you are looking for a format to display your unique thoughts, then the professionally designed Integrating CRM Solution To Acquire Potential Customers CRM Email Nurturing Campaign Dashboard Template PDF is the one for you. You can use it as a Google Slides template or a PowerPoint template. Incorporate impressive visuals, symbols, images, and other charts. Modify or reorganize the text boxes as you desire. Experiment with shade schemes and font pairings. Alter, share or cooperate with other people on your work. Download Integrating CRM Solution To Acquire Potential Customers CRM Email Nurturing Campaign Dashboard Template PDF and find out how to give a successful presentation. Present a perfect display to your team and make your presentation unforgettable.
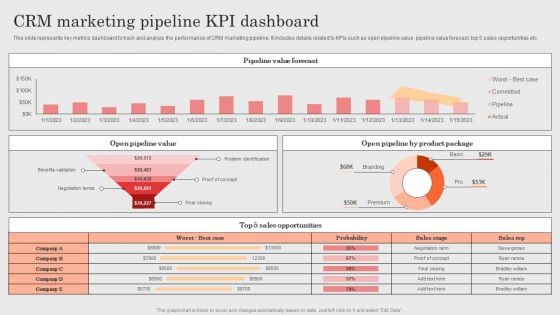
Integrating CRM Solution To Acquire Potential Customers CRM Marketing Pipeline KPI Dashboard Background PDF
This slide represents key metrics dashboard to track and analyze the performance of CRM marketing pipeline. It includes details related to KPIs such as open pipeline value, pipeline value forecast, top 5 sales opportunities etc. Crafting an eye catching presentation has never been more straightforward. Let your presentation shine with this tasteful yet straightforward Integrating CRM Solution To Acquire Potential Customers CRM Marketing Pipeline KPI Dashboard Background PDF template. It offers a minimalistic and classy look that is great for making a statement. The colors have been employed intelligently to add a bit of playfulness while still remaining professional. Construct the ideal Integrating CRM Solution To Acquire Potential Customers CRM Marketing Pipeline KPI Dashboard Background PDF that effortlessly grabs the attention of your audience. Begin now and be certain to wow your customers.
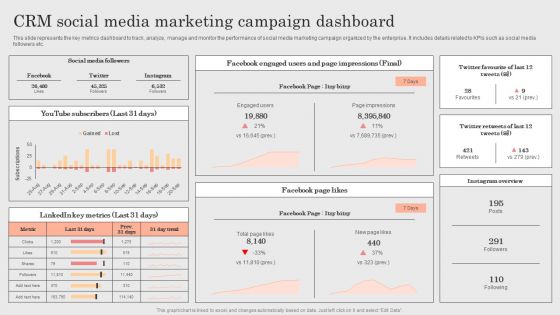
Integrating CRM Solution To Acquire Potential Customers CRM Social Media Marketing Campaign Dashboard Template PDF
This slide represents the key metrics dashboard to track, analyze, manage and monitor the performance of social media marketing campaign organized by the enterprise. It includes details related to KPIs such as social media followers etc. Formulating a presentation can take up a lot of effort and time, so the content and message should always be the primary focus. The visuals of the PowerPoint can enhance the presenters message, so our Integrating CRM Solution To Acquire Potential Customers CRM Social Media Marketing Campaign Dashboard Template PDF was created to help save time. Instead of worrying about the design, the presenter can concentrate on the message while our designers work on creating the ideal templates for whatever situation is needed. Slidegeeks has experts for everything from amazing designs to valuable content, we have put everything into Integrating CRM Solution To Acquire Potential Customers CRM Social Media Marketing Campaign Dashboard Template PDF
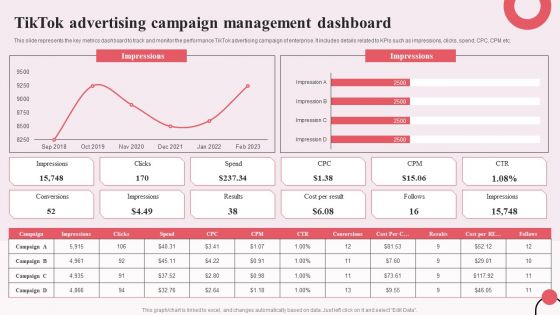
Tiktok Digital Marketing Campaign Tiktok Advertising Campaign Management Dashboard Designs PDF
This slide represents the key metrics dashboard to track and monitor the performance TikTok advertising campaign of enterprise. It includes details related to KPIs such as impressions, clicks, spend, CPC, CPM etc. Formulating a presentation can take up a lot of effort and time, so the content and message should always be the primary focus. The visuals of the PowerPoint can enhance the presenters message, so our Tiktok Digital Marketing Campaign Tiktok Advertising Campaign Management Dashboard Designs PDF was created to help save time. Instead of worrying about the design, the presenter can concentrate on the message while our designers work on creating the ideal templates for whatever situation is needed. Slidegeeks has experts for everything from amazing designs to valuable content, we have put everything into Tiktok Digital Marketing Campaign Tiktok Advertising Campaign Management Dashboard Designs PDF


 Continue with Email

 Home
Home


