Money Icon
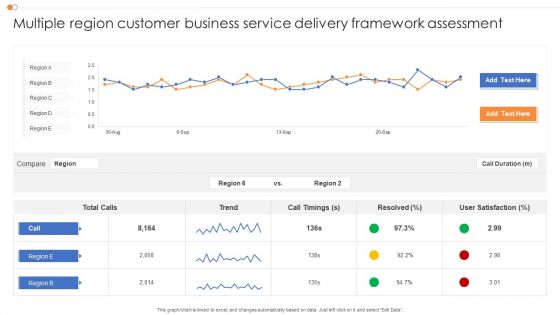
Multiple Region Customer Business Service Delivery Framework Assessment Themes PDF
Pitch your topic with ease and precision using this Multiple Region Customer Business Service Delivery Framework Assessment Themes PDF. This layout presents information on Customer, Business, Service. It is also available for immediate download and adjustment. So, changes can be made in the color, design, graphics or any other component to create a unique layout.
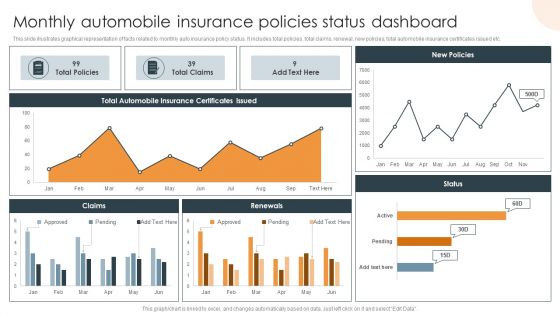
Monthly Automobile Insurance Policies Status Dashboard Themes PDF
Showcasing this set of slides titled Monthly Automobile Insurance Policies Status Dashboard Themes PDF. The topics addressed in these templates are Monthly Automobile, Insurance Policies, Status Dashboard. All the content presented in this PPT design is completely editable. Download it and make adjustments in color, background, font etc. as per your unique business setting.

Employee Salary Analysis Dashboard With Non Salary Benefits Themes PDF
Showcasing this set of slides titled Employee Salary Analysis Dashboard With Non Salary Benefits Themes PDF. The topics addressed in these templates are Employee Salary Analysis, Dashboard Non Salary Benefits . All the content presented in this PPT design is completely editable. Download it and make adjustments in color, background, font etc. as per your unique business setting.
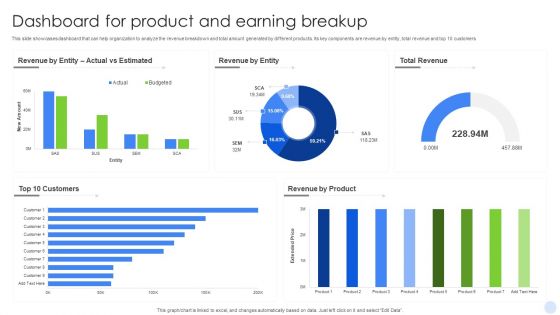
Dashboard For Product And Earning Breakup Themes PDF
Pitch your topic with ease and precision using this Dashboard For Product And Earning Breakup Themes PDF. This layout presents information on Product, Earning Breakup. It is also available for immediate download and adjustment. So, changes can be made in the color, design, graphics or any other component to create a unique layout.
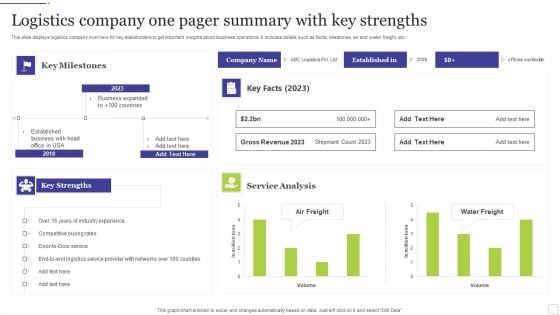
Logistics Company One Pager Summary With Key Strengths Themes PDF
Pitch your topic with ease and precision using this Logistics Company One Pager Summary With Key Strengths Themes PDF. This layout presents information on Company One, Pager Summary. It is also available for immediate download and adjustment. So, changes can be made in the color, design, graphics or any other component to create a unique layout.
Chart Growth Business PowerPoint Template 0910
Arrow pointing to the higher financial chart bar 3d illustration Enter onto your new path with our Chart Growth Business PowerPoint Template 0910. Your thoughts will make a solid beginning.
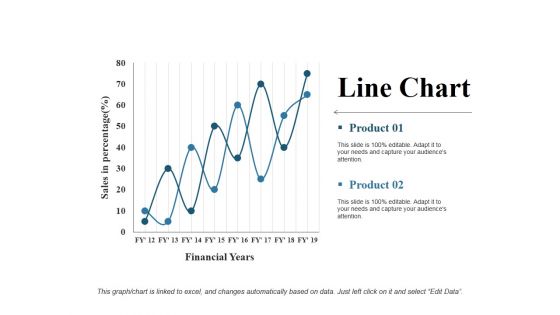
Line Chart Ppt PowerPoint Presentation Gallery Rules
This is a line chart ppt powerpoint presentation gallery rules. This is a two stage process. The stages in this process are financial years, product, sales in percentage, line chart, growth.
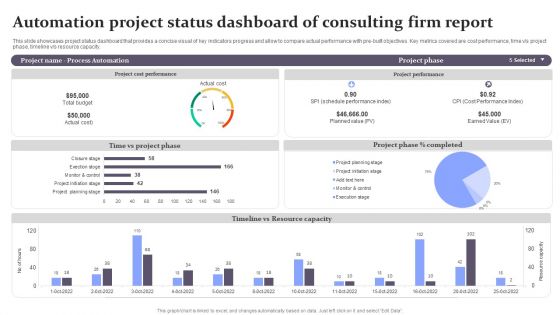
Automation Project Status Dashboard Of Consulting Firm Report Background PDF
This slide showcases project status dashboard that provides a concise visual of key indicators progress and allow to compare actual performance with pre-built objectives. Key metrics covered are cost performance, time v or s project phase, timeline v or s resource capacity. Showcasing this set of slides titled Automation Project Status Dashboard Of Consulting Firm Report Background PDF. The topics addressed in these templates are Project Phase, Planned Value, Cost Performance Index. All the content presented in this PPT design is completely editable. Download it and make adjustments in color, background, font etc. as per your unique business setting.
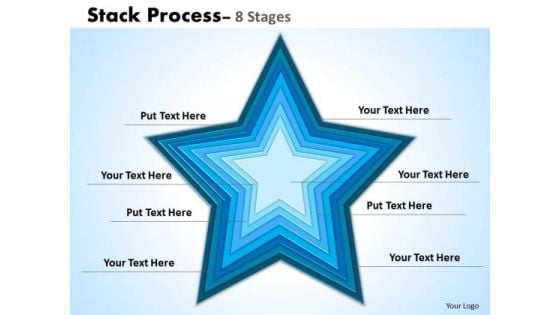
Business Finance Strategy Development Stack Consulting Diagram
Get Out Of The Dock With Our Business Finance Strategy Development Stack Consulting Diagram Powerpoint Templates. Your Mind Will Be Set Free. Play The Doctor With Our Business Finance Strategy Development Stack Consulting Diagram Powerpoint Templates. Control Operations With Your Ideas.
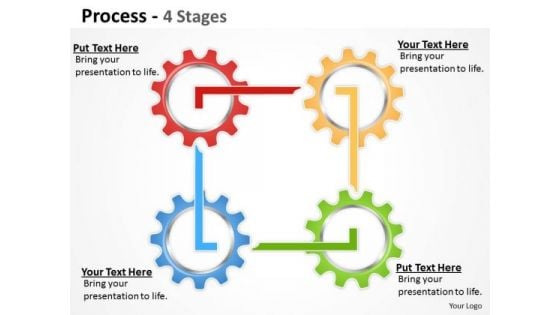
Sales Diagram Process Business Finance Strategy Development
Good Camaraderie Is A Key To Teamwork. Our Sales Diagram Process Business Finance Strategy Development Powerpoint Templates Can Be A Cementing Force. Our Sales Diagram Process Business Finance Strategy Development Powerpoint Templates Are An Agent Of Change. Let Your Thoughts Go Down Uncharted Courses.
Financial Crisis Business PowerPoint Themes And PowerPoint Slides 0211
Microsoft PowerPoint Theme and Slides with playing cubes with an inscription financial crisis Go far with our Financial Crisis Business PowerPoint Themes And PowerPoint Slides 0211. They have the ability to carry you through.
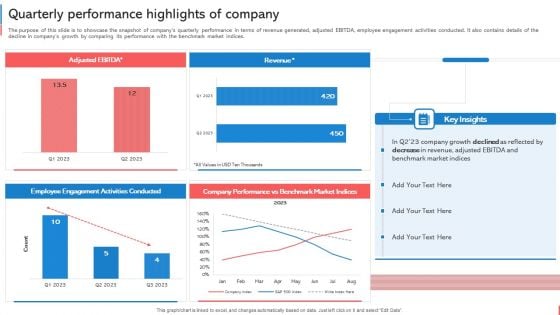
Company Budget Analysis Quarterly Performance Highlights Of Company Ideas PDF
The purpose of this slide is to showcase the snapshot of companys quarterly performance in terms of revenue generated, adjusted EBITDA, employee engagement activities conducted. It also contains details of the decline in companys growth by comparing its performance with the benchmark market indices. Formulating a presentation can take up a lot of effort and time, so the content and message should always be the primary focus. The visuals of the PowerPoint can enhance the presenters message, so our Company Budget Analysis Quarterly Performance Highlights Of Company Ideas PDF was created to help save time. Instead of worrying about the design, the presenter can concentrate on the message while our designers work on creating the ideal templates for whatever situation is needed. Slidegeeks has experts for everything from amazing designs to valuable content, we have put everything into Company Budget Analysis Quarterly Performance Highlights Of Company Ideas PDF.
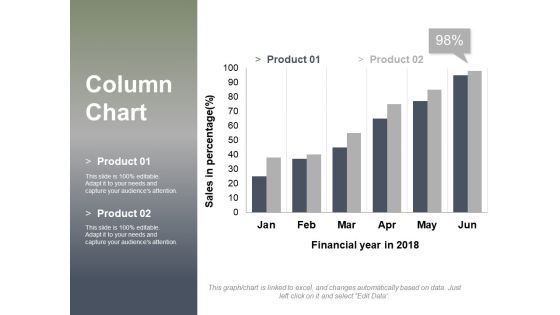
Column Chart Ppt PowerPoint Presentation Layouts Design Inspiration
This is a column chart ppt powerpoint presentation layouts design inspiration. This is a two stage process. The stages in this process are sales in percentage, financial year in, graph, business, finance, marketing.

Funnel Chart For Joint Venture Marketing Powerpoint Slides
This PowerPoint template has been designed with graphics of funnel chart. This PPT slide can be used to display joint venture marketing. You can download finance PowerPoint template to prepare awesome presentations.
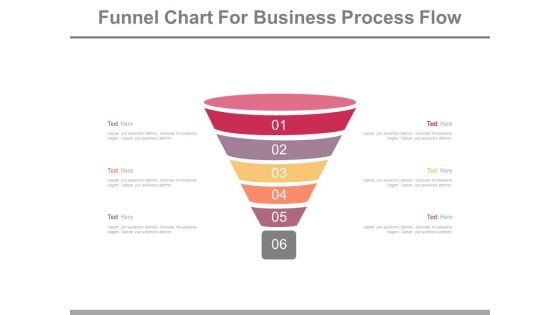
Six Steps Funnel Chart For Business Powerpoint Slides
This PowerPoint template has been designed with professional graphics of funnel chart. This PPT slide can be used to display steps of sales process. You can download finance PowerPoint template to prepare awesome presentations.
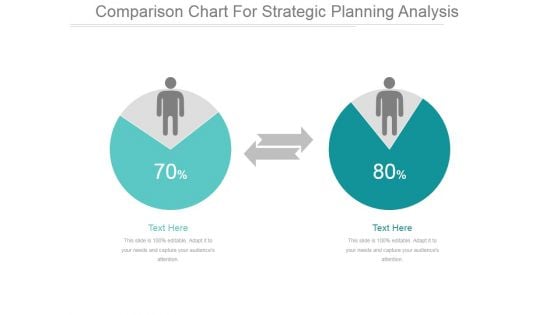
Comparison Chart For Strategic Planning Analysis Ppt PowerPoint Presentation Example
This is a comparison chart for strategic planning analysis ppt powerpoint presentation example. This is a two stage process. The stages in this process are business, finance, marketing, strategy, success.
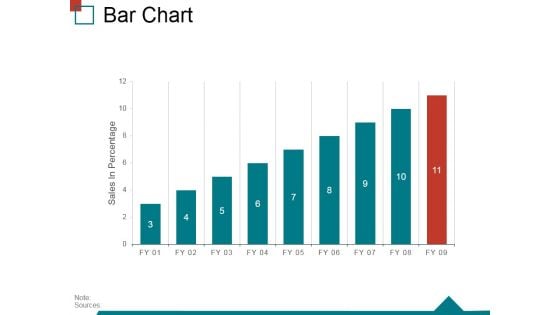
Bar Chart Ppt PowerPoint Presentation Infographic Template Skills
This is a bar chart ppt powerpoint presentation infographic template skills. This is a nine stage process. The stages in this process are sales in percentage, finance, business, marketing, strategy, success.
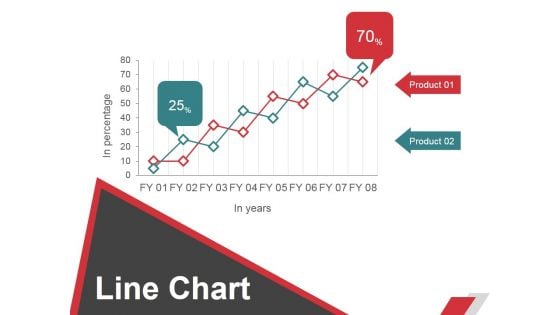
Line Chart Ppt PowerPoint Presentation File Graphic Images
This is a line chart ppt powerpoint presentation file graphic images. This is a two stage process. The stages in this process are business, strategy, marketing, planning, growth strategy, finance.
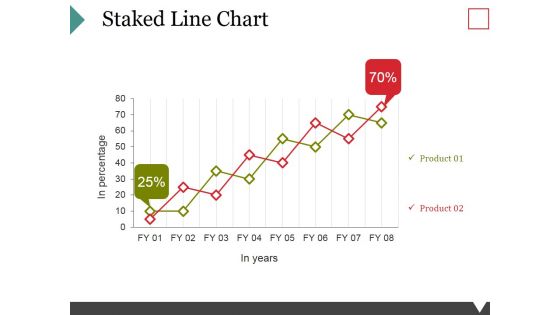
Staked Line Chart Ppt PowerPoint Presentation Model Graphics Download
This is a staked line chart ppt powerpoint presentation model graphics download. This is a two stage process. The stages in this process are business, marketing, growth, finance, management.

Donut Pie Chart Ppt PowerPoint Presentation Infographics Outfit
This is a donut pie chart ppt powerpoint presentation infographics outfit. This is a three stage process. The stages in this process are business, strategy, analysis, planning, dashboard, finance.
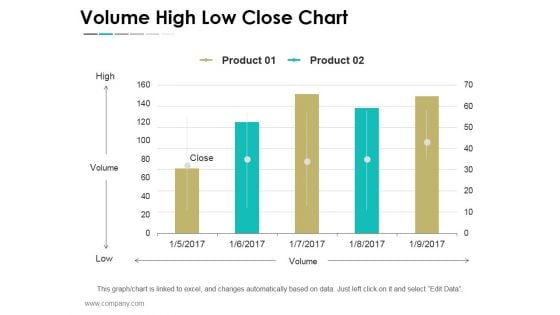
Volume High Low Close Chart Ppt PowerPoint Presentation Show Outfit
This is a volume high low close chart ppt powerpoint presentation show outfit. This is a five stage process. The stages in this process are business, strategy, marketing, success, finance, growth.
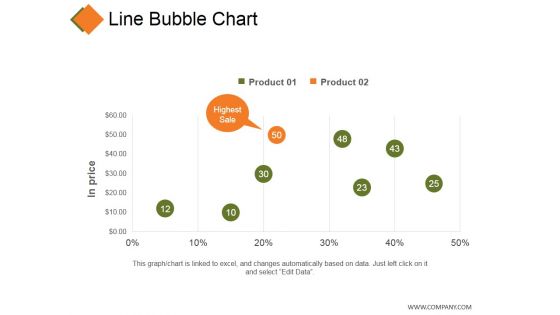
Line Bubble Chart Ppt PowerPoint Presentation Professional Infographic Template
This is a line bubble chart ppt powerpoint presentation professional infographic template. This is a five stage process. The stages in this process are product, in price, highest sale, business, finance.
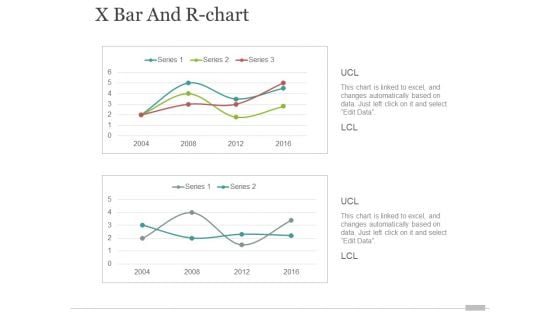
x bar and r chart ppt powerpoint presentation portfolio elements
This is a x bar and r chart ppt powerpoint presentation portfolio elements. This is a two stage process. The stages in this process are finance, business, marketing, growth.
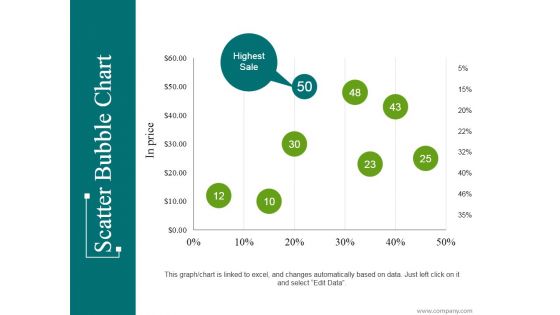
Scatter Bubble Chart Ppt PowerPoint Presentation Infographic Template Introduction
This is a scatter bubble chart ppt powerpoint presentation infographic template introduction. This is a eight stage process. The stages in this process are highest sale, business, marketing, percentage, finance.

Donut Pie Chart Ppt PowerPoint Presentation File Example Introduction
This is a donut pie chart ppt powerpoint presentation file example introduction. This is a three stage process. The stages in this process are business, marketing, finance, planning, analysis.
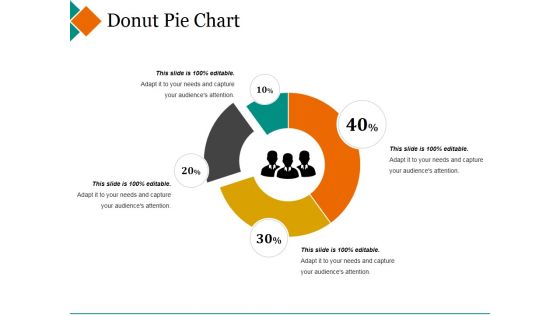
Donut Pie Chart Ppt PowerPoint Presentation Pictures Design Inspiration
This is a donut pie chart ppt powerpoint presentation pictures design inspiration. This is a four stage process. The stages in this process are maximum, donut, minimum, percentage, finance.
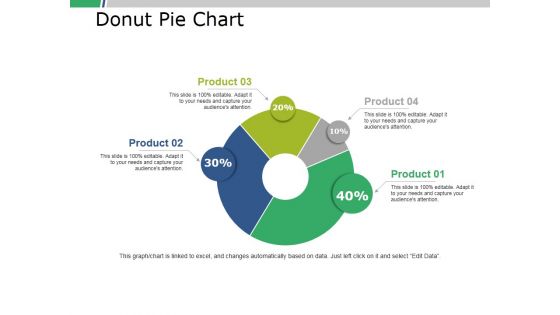
Donut Pie Chart Ppt PowerPoint Presentation Portfolio Slide Download
This is a donut pie chart ppt powerpoint presentation portfolio slide download. This is a four stage process. The stages in this process are business, marketing, finance, percent, donut.
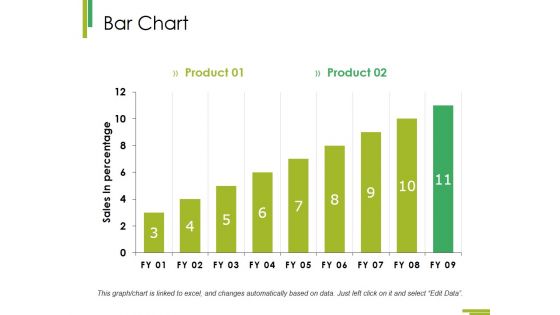
Bar Chart Ppt PowerPoint Presentation Infographic Template Master Slide
This is a bar chart ppt powerpoint presentation infographic template master slide. This is a two stage process. The stages in this process are growth, finance, business, analysis, marketing.
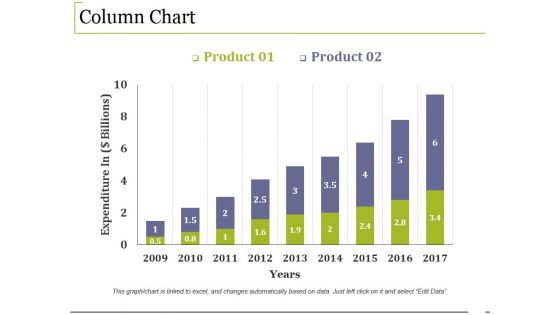
Column Chart Ppt PowerPoint Presentation Infographic Template Example File
This is a column chart ppt powerpoint presentation infographic template example file. This is a two stage process. The stages in this process are growth, finance, business, marketing, analysis.
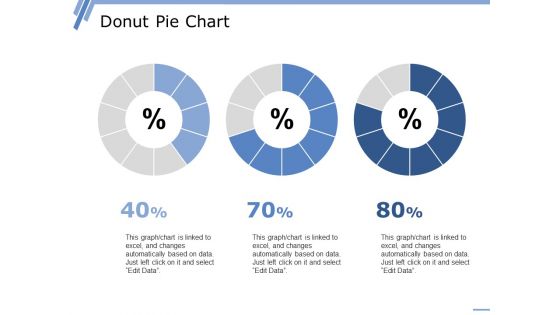
Donut Pie Chart Ppt PowerPoint Presentation Professional Graphic Images
This is a donut pie chart ppt powerpoint presentation professional graphic images. This is a three stage process. The stages in this process are percentage, finance, donut, business, marketing.
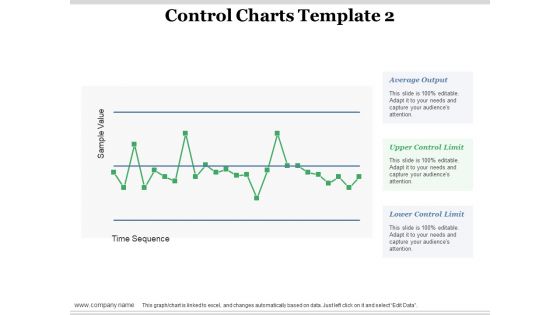
Control Charts Time Sequence Ppt PowerPoint Presentation Layouts Microsoft
This is a control charts time sequence ppt powerpoint presentation layouts microsoft. This is a one stage process. The stages in this process are average output, upper control limit, lower control limit, finance, business.
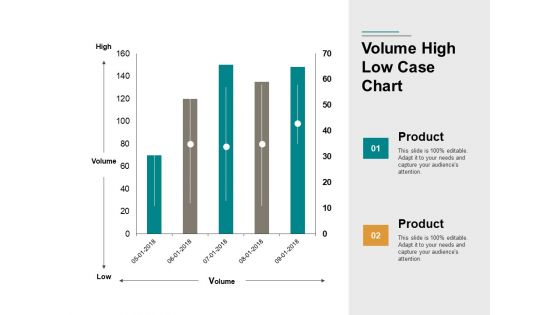
Volume High Low Case Chart Ppt PowerPoint Presentation Portfolio Images
This is a volume high low case chart ppt powerpoint presentation portfolio images. This is a two stage process. The stages in this process are finance, business, marketing, management.
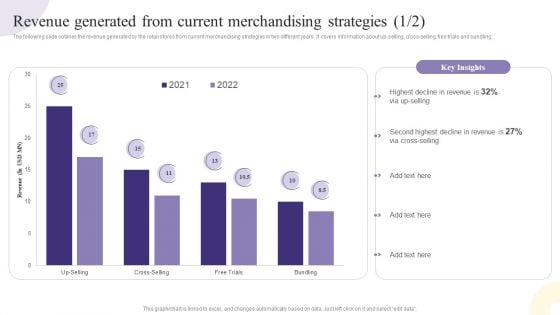
Revenue Generated From Current Merchandising Strategies Mockup PDF
The following slide outlines the revenue generated by the retail stores from current merchandising strategies in two different years. It covers information about up-selling, cross-selling, free trials and bundling. Are you searching for a Revenue Generated From Current Merchandising Strategies Mockup PDF that is uncluttered, straightforward, and original Its easy to edit, and you can change the colors to suit your personal or business branding. For a presentation that expresses how much effort you have put in, this template is ideal With all of its features, including tables, diagrams, statistics, and lists, its perfect for a business plan presentation. Make your ideas more appealing with these professional slides. Download Revenue Generated From Current Merchandising Strategies Mockup PDF from Slidegeeks today.
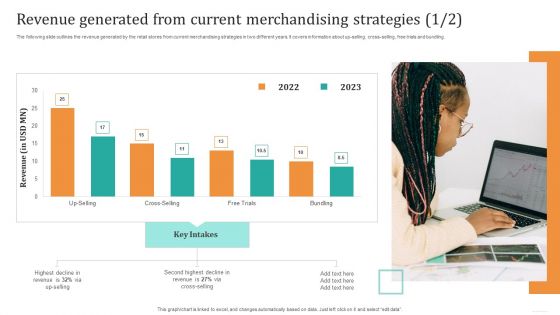
Revenue Generated From Current Merchandising Strategies Elements PDF
The following slide outlines the revenue generated by the retail stores from current merchandising strategies in two different years. It covers information about up-selling, cross-selling, free trials and bundling. Are you searching for a Revenue Generated From Current Merchandising Strategies Elements PDF that is uncluttered, straightforward, and original Its easy to edit, and you can change the colors to suit your personal or business branding. For a presentation that expresses how much effort you have put in, this template is ideal With all of its features, including tables, diagrams, statistics, and lists, its perfect for a business plan presentation. Make your ideas more appealing with these professional slides. Download Revenue Generated From Current Merchandising Strategies Elements PDF from Slidegeeks today.
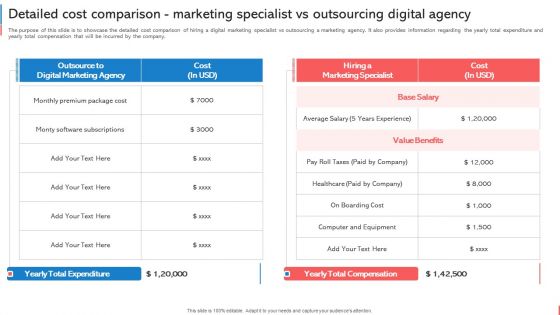
Company Budget Analysis Detailed Cost Comparison Marketing Specialist Vs Outsourcing Diagrams PDF
The purpose of this slide is to showcase the detailed cost comparison of hiring a digital marketing specialist vs outsourcing a marketing agency. It also provides information regarding the yearly total expenditure and yearly total compensation that will be incurred by the company. There are so many reasons you need a Company Budget Analysis Detailed Cost Comparison Marketing Specialist Vs Outsourcing Diagrams PDF. The first reason is you cant spend time making everything from scratch, Thus, Slidegeeks has made presentation templates for you too. You can easily download these templates from our website easily.
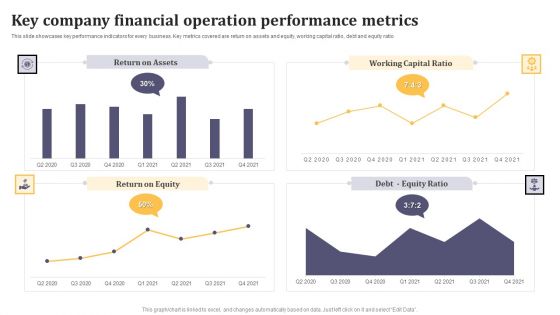
Key Company Financial Operation Performance Metrics Ppt Infographic Template Example Introduction PDF
This slide showcases key performance indicators for every business. Key metrics covered are return on assets and equity, working capital ratio, debt and equity ratio. Showcasing this set of slides titled Key Company Financial Operation Performance Metrics Ppt Infographic Template Example Introduction PDF. The topics addressed in these templates are Return on Assets, Working Capital Ratio, Return on Equity. All the content presented in this PPT design is completely editable. Download it and make adjustments in color, background, font etc. as per your unique business setting.
Online Video Streaming Site Capital Raising Elevator Circular Diagram Rules PDF
This is a online video streaming site capital raising elevator circular diagram rules pdf template with various stages. Focus and dispense information on four stages using this creative set, that comes with editable features. It contains large content boxes to add your information on topics like circular diagram. You can also showcase facts, figures, and other relevant content using this PPT layout. Grab it now.
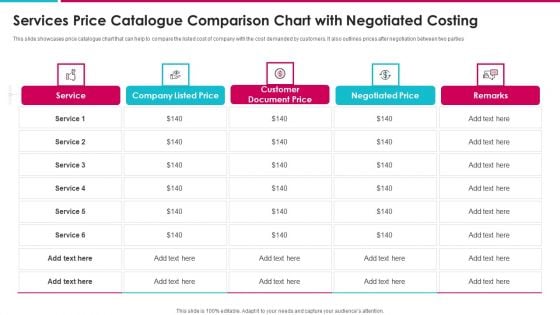
Services Price Catalogue Comparison Chart With Negotiated Costing Topics PDF
This slide showcases price catalogue chart that can help to compare the listed cost of company with the cost demanded by customers. It also outlines prices after negotiation between two parties Pitch your topic with ease and precision using this services price catalogue comparison chart with negotiated costing topics pdf. This layout presents information on service, company listed price, customer document price, negotiated price. It is also available for immediate download and adjustment. So, changes can be made in the color, design, graphics or any other component to create a unique layout.
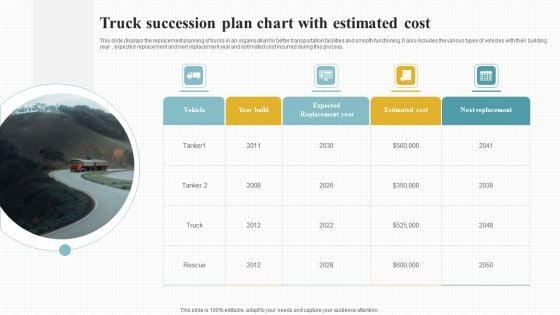
Truck Succession Plan Chart With Estimated Cost Pictures PDF
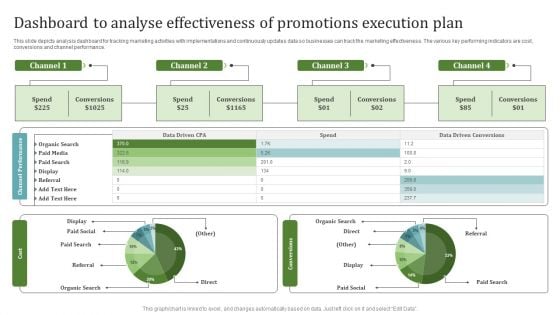
Dashboard To Analyse Effectiveness Of Promotions Execution Plan Diagrams PDF
This slide depicts analysis dashboard for tracking marketing activities with implementations and continuously updates data so businesses can track the marketing effectiveness. The various key performing indicators are cost, conversions and channel performance. Showcasing this set of slides titled Dashboard To Analyse Effectiveness Of Promotions Execution Plan Diagrams PDF. The topics addressed in these templates are Channel Performance, Cost, Conversions. All the content presented in this PPT design is completely editable. Download it and make adjustments in color, background, font etc. as per your unique business setting.
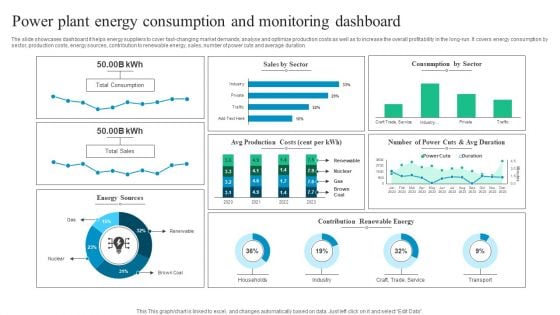
Power Plant Energy Consumption And Monitoring Dashboard Diagrams PDF
The slide showcases dashboard it helps energy suppliers to cover fast-changing market demands, analyse and optimize production costs as well as to increase the overall profitability in the long-run. It covers energy consumption by sector, production costs, energy sources, contribution to renewable energy, sales, number of power cuts and average duration. Pitch your topic with ease and precision using this Power Plant Energy Consumption And Monitoring Dashboard Diagrams PDF. This layout presents information on Power Plant Energy Consumption, Monitoring Dashboard. It is also available for immediate download and adjustment. So, changes can be made in the color, design, graphics or any other component to create a unique layout.
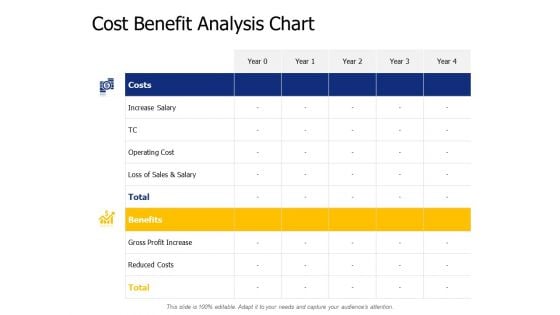
Cost Benefit Analysis Chart Ppt PowerPoint Presentation Portfolio Aids
Presenting this set of slides with name cost benefit analysis chart ppt powerpoint presentation portfolio aids. The topics discussed in these slides are increase salary, operating cost, loss sales and salary, benefits, gross profit increase. This is a completely editable PowerPoint presentation and is available for immediate download. Download now and impress your audience.
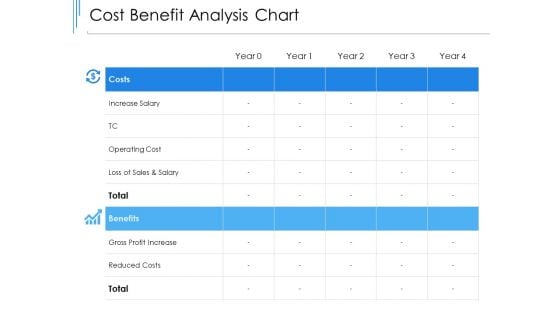
Cost Benefit Analysis Chart Ppt PowerPoint Presentation Gallery Example Introduction
Presenting this set of slides with name cost benefit analysis chart ppt powerpoint presentation gallery example introduction. The topics discussed in these slides are increase salary, operating cost, loss sales and salary, benefits, gross profit increase. This is a completely editable PowerPoint presentation and is available for immediate download. Download now and impress your audience.
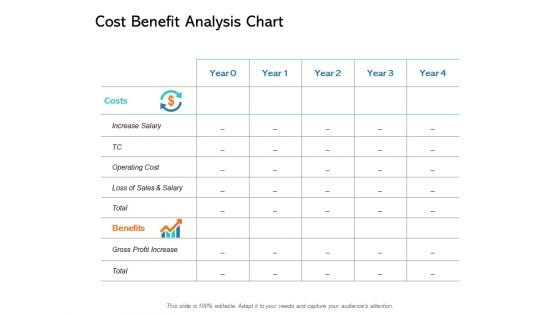
Cost Benefit Analysis Chart Ppt PowerPoint Presentation File Backgrounds
Presenting this set of slides with name cost benefit analysis chart ppt powerpoint presentation file backgrounds. The topics discussed in these slides are increase salary, operating cost, loss sales and salary, benefits, gross profit increase. This is a completely editable PowerPoint presentation and is available for immediate download. Download now and impress your audience.
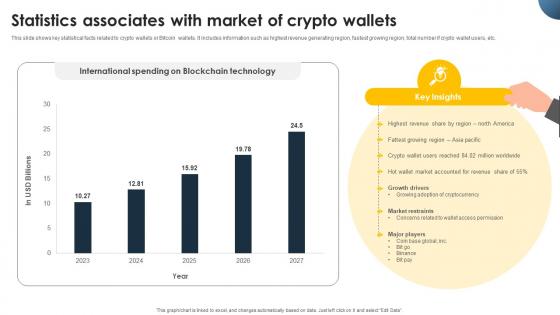
Complete Beginners Guide Statistics Associates With Market Of Crypto Wallets Fin SS V
This slide shows key statistical facts related to crypto wallets or Bitcoin wallets. It includes information such as highest revenue generating region, fastest growing region, total number if crypto wallet users, etc. Create an editable Complete Beginners Guide Statistics Associates With Market Of Crypto Wallets Fin SS V that communicates your idea and engages your audience. Whether you are presenting a business or an educational presentation, pre-designed presentation templates help save time. Complete Beginners Guide Statistics Associates With Market Of Crypto Wallets Fin SS V is highly customizable and very easy to edit, covering many different styles from creative to business presentations. Slidegeeks has creative team members who have crafted amazing templates. So, go and get them without any delay. This slide shows key statistical facts related to crypto wallets or Bitcoin wallets. It includes information such as highest revenue generating region, fastest growing region, total number if crypto wallet users, etc.
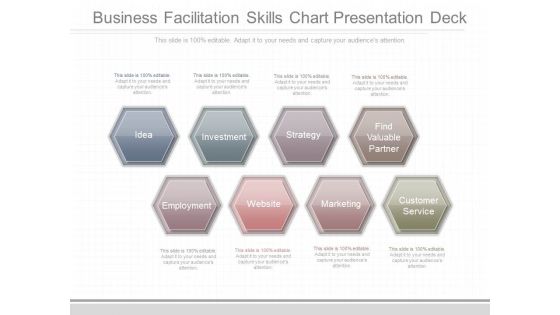
Business Facilitation Skills Chart Presentation Deck
This is a business facilitation skills chart presentation deck. This is a eight stage process. The stages in this process are idea, investment, strategy, find valuable partner, employment, website, marketing, customer service.
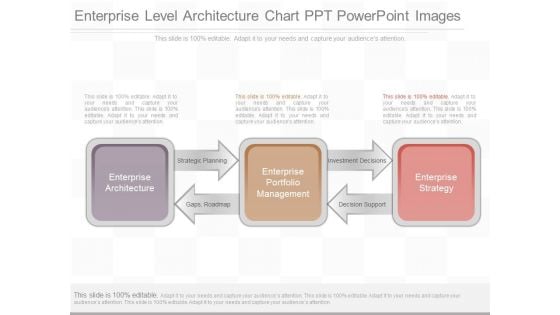
Enterprise Level Architecture Chart Ppt Powerpoint Images
This is a enterprise level architecture chart ppt powerpoint images. This is a three stage process. The stages in this process are enterprise architecture, strategic planning, gaps, roadmap, enterprise portfolio management, investment decisions, decision support, enterprise strategy.
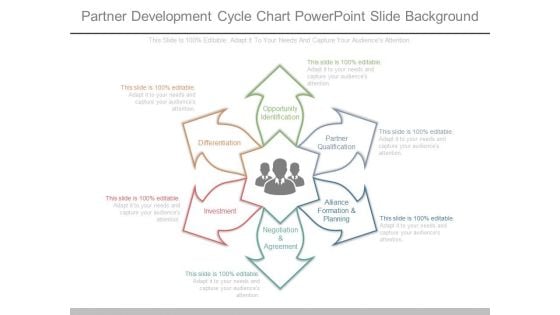
Partner Development Cycle Chart Powerpoint Slide Background
This is a partner development cycle chart powerpoint slide background. This is a six stage process. The stages in this process are opportunity identification, partner qualification, alliance formation and planning, negotiation and agreement, investment, differentiation.
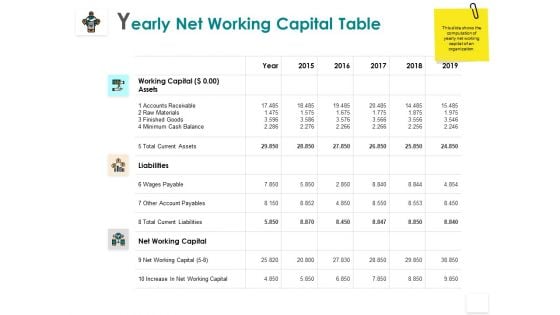
Yearly Net Working Capital Table Liabilities Minimum Ppt PowerPoint Presentation Infographic Template Diagrams
Presenting this set of slides with name yearly net working capital table liabilities minimum ppt powerpoint presentation infographic template diagrams. The topics discussed in these slides are liabilities, increase, business, planning, strategy. This is a completely editable PowerPoint presentation and is available for immediate download. Download now and impress your audience.
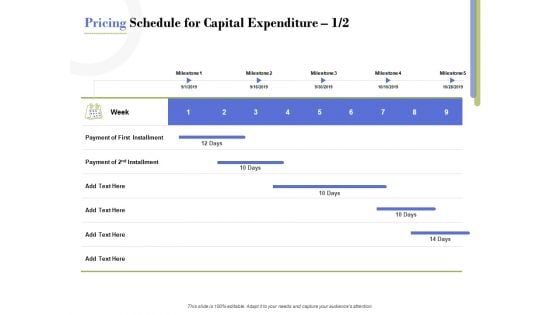
Capex Proposal Template Pricing Schedule For Capital Expenditure First Diagrams PDF
Presenting this set of slides with name capex proposal template pricing schedule for capital expenditure first diagrams pdf. The topics discussed in these slides are milestone, installment, payment. This is a completely editable PowerPoint presentation and is available for immediate download. Download now and impress your audience.
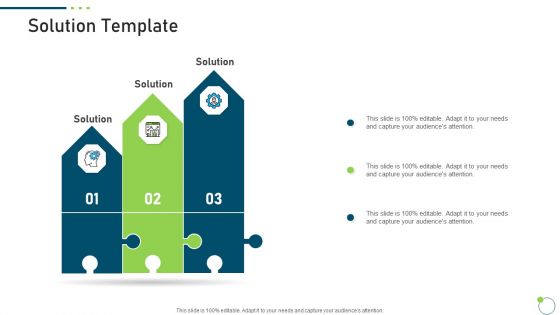
Investor Pitch Deck New Venture Capital Raising Solution Template Diagrams PDF
This is a investor pitch deck new venture capital raising solution template diagrams pdf template with various stages. Focus and dispense information on three stages using this creative set, that comes with editable features. It contains large content boxes to add your information on topics like solution. You can also showcase facts, figures, and other relevant content using this PPT layout. Grab it now.
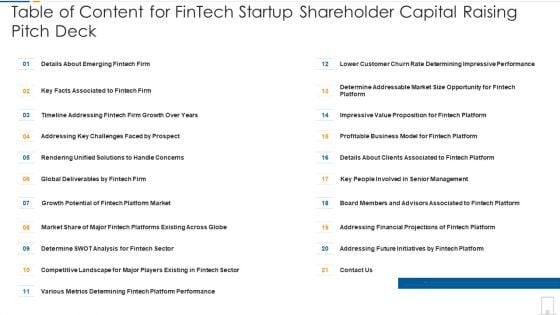
Table Of Content For Fintech Startup Shareholder Capital Raising Pitch Deck Diagrams PDF
Deliver and pitch your topic in the best possible manner with this table of content for fintech startup shareholder capital raising pitch deck diagrams pdf. Use them to share invaluable insights on platform performance, timeline addressing, business model and impress your audience. This template can be altered and modified as per your expectations. So, grab it now.
Post It Notes Edutech Investor Capital Raising Pitch Deck Diagrams PDF
Presenting post it notes edutech investor capital raising pitch deck diagrams pdf to provide visual cues and insights. Share and navigate important information on four stages that need your due attention. This template can be used to pitch topics like post it notes. In addtion, this PPT design contains high resolution images, graphics, etc, that are easily editable and available for immediate download.
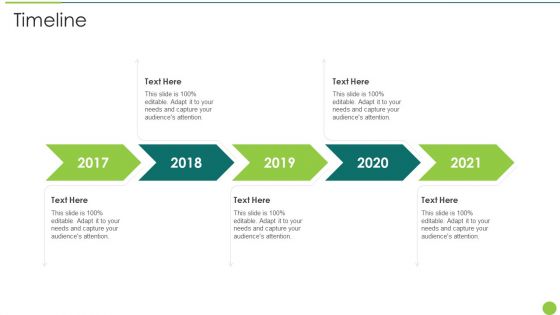
Fintech Service Company Capital Raising Elevator Pitch Deck Timeline Diagrams PDF
Presenting fintech service company capital raising elevator pitch deck timeline diagrams pdf to provide visual cues and insights. Share and navigate important information on five stages that need your due attention. This template can be used to pitch topics like timeline 2017 to 2021. In addtion, this PPT design contains high resolution images, graphics, etc, that are easily editable and available for immediate download.
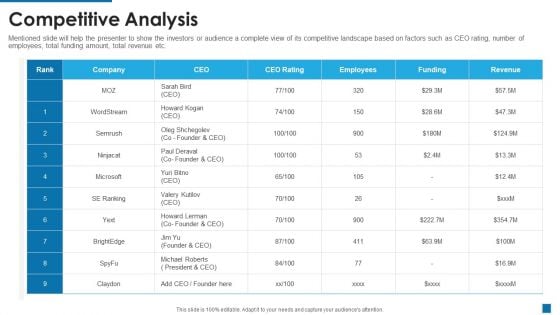
Moz Investor Capital Raising Competitive Analysis Ppt Infographic Template Diagrams PDF
Deliver and pitch your topic in the best possible manner with this moz investor capital raising competitive analysis ppt infographic template diagrams pdf. Use them to share invaluable insights on competitive analysis and impress your audience. This template can be altered and modified as per your expectations. So, grab it now.
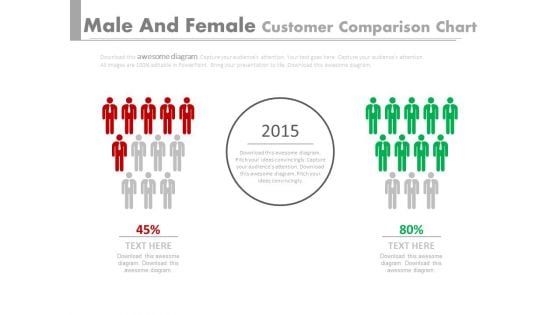
Red Green Teams Comparison Chart Powerpoint Slides
This PPT slide displays graphics of two red and green teams. Use this PPT design to display comparison of teams performances. This PowerPoint template can be customized as per requirements of business education or any other theme.
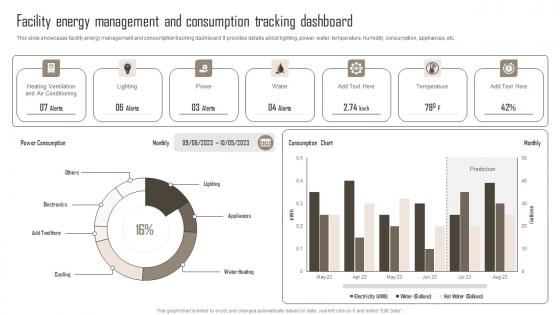
Facility Energy Management Comprehensive Guide For Building Management Diagrams Pdf
This slide showcases facility energy management and consumption tracking dashboard. It provides details about lighting, power, water, temperature, humidity, consumption, appliances, etc. If you are looking for a format to display your unique thoughts, then the professionally designed Facility Energy Management Comprehensive Guide For Building Management Diagrams Pdf is the one for you. You can use it as a Google Slides template or a PowerPoint template. Incorporate impressive visuals, symbols, images, and other charts. Modify or reorganize the text boxes as you desire. Experiment with shade schemes and font pairings. Alter, share or cooperate with other people on your work. Download Facility Energy Management Comprehensive Guide For Building Management Diagrams Pdf and find out how to give a successful presentation. Present a perfect display to your team and make your presentation unforgettable. This slide showcases facility energy management and consumption tracking dashboard. It provides details about lighting, power, water, temperature, humidity, consumption, appliances, etc.
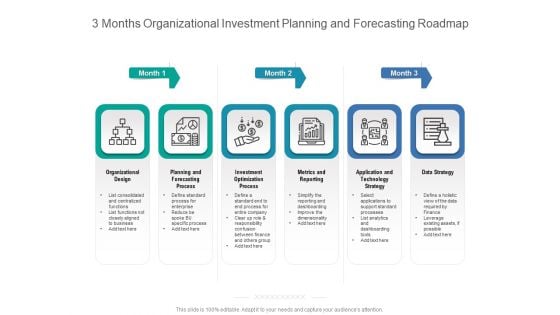
3 Months Organizational Investment Planning And Forecasting Roadmap Introduction
Presenting our jaw dropping 3 months organizational investment planning and forecasting roadmap introduction. You can alternate the color, font size, font type, and shapes of this PPT layout according to your strategic process. This PPT presentation is compatible with Google Slides and is available in both standard screen and widescreen aspect ratios. You can also download this well researched PowerPoint template design in different formats like PDF, JPG, and PNG. So utilize this visually appealing design by clicking the download button given below.
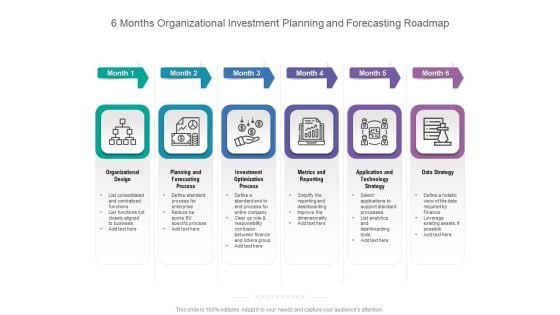
6 Months Organizational Investment Planning And Forecasting Roadmap Sample
Presenting our jaw dropping 6 months organizational investment planning and forecasting roadmap sample. You can alternate the color, font size, font type, and shapes of this PPT layout according to your strategic process. This PPT presentation is compatible with Google Slides and is available in both standard screen and widescreen aspect ratios. You can also download this well researched PowerPoint template design in different formats like PDF, JPG, and PNG. So utilize this visually appealing design by clicking the download button given below.
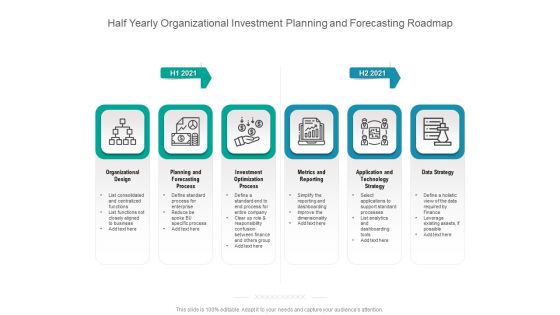
Half Yearly Organizational Investment Planning And Forecasting Roadmap Template
Presenting our jaw dropping half yearly organizational investment planning and forecasting roadmap template. You can alternate the color, font size, font type, and shapes of this PPT layout according to your strategic process. This PPT presentation is compatible with Google Slides and is available in both standard screen and widescreen aspect ratios. You can also download this well researched PowerPoint template design in different formats like PDF, JPG, and PNG. So utilize this visually appealing design by clicking the download button given below.


 Continue with Email

 Home
Home


