Money Icon
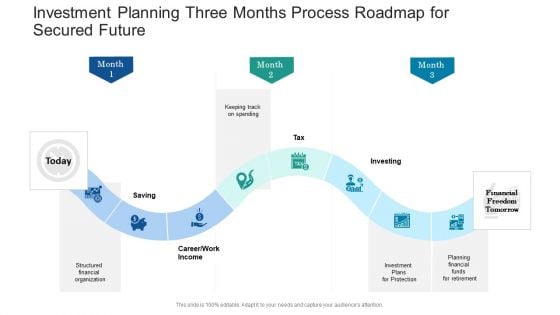
Investment Planning Three Months Process Roadmap For Secured Future Slides
Presenting our jaw dropping investment planning three months process roadmap for secured future slides. You can alternate the color, font size, font type, and shapes of this PPT layout according to your strategic process. This PPT presentation is compatible with Google Slides and is available in both standard screen and widescreen aspect ratios. You can also download this well researched PowerPoint template design in different formats like PDF, JPG, and PNG. So utilize this visually appealing design by clicking the download button given below.
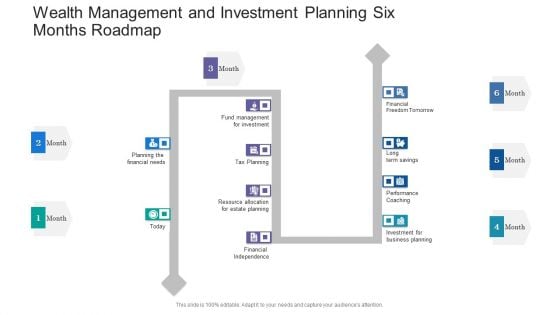
Wealth Management And Investment Planning Six Months Roadmap Template
Presenting the wealth management and investment planning six months roadmap template. The template includes a roadmap that can be used to initiate a strategic plan. Not only this, the PowerPoint slideshow is completely editable and you can effortlessly modify the font size, font type, and shapes according to your needs. This PPT slide can be easily reached in standard screen and widescreen aspect ratios. The set is also available in various formats like PDF, PNG, and JPG. So download and use it multiple times as per your knowledge.
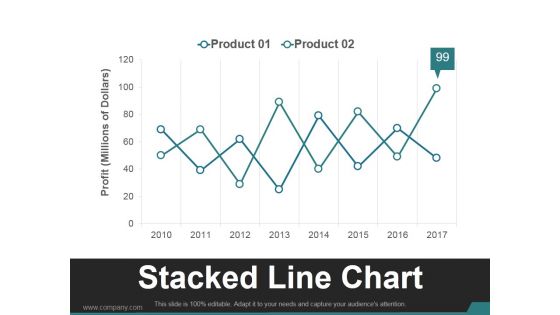
Stacked Line Chart Ppt PowerPoint Presentation Outline
This is a stacked line chart ppt powerpoint presentation outline. This is a two stage process. The stages in this process are business, marketing, product, line chart, management.
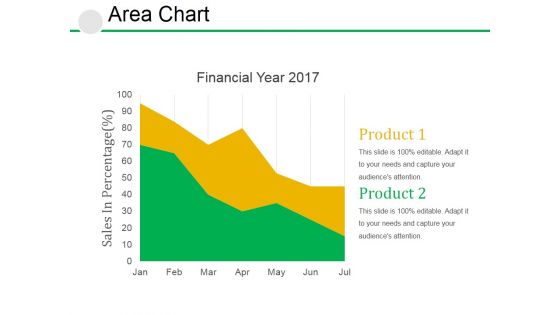
Area Chart Ppt PowerPoint Presentation Gallery Sample
This is a area chart ppt powerpoint presentation gallery sample. This is a two stage process. The stages in this process are area chart, growth, strategy, analysis, business.

Collection Of Quality Assurance PPT Five Phases Of Project Management Structure PDF
Following slide shows five phases of project management that can be used by a firm to effectively plan for multiple projects. Phases covered are conception and initiation, defining and planning, launch or execution, performance or control and project close. This is a collection of quality assurance ppt five phases of project management structure pdf template with various stages. Focus and dispense information on five stages using this creative set, that comes with editable features. It contains large content boxes to add your information on topics like planning, project close, resources required, resources allocation. You can also showcase facts, figures, and other relevant content using this PPT layout. Grab it now.
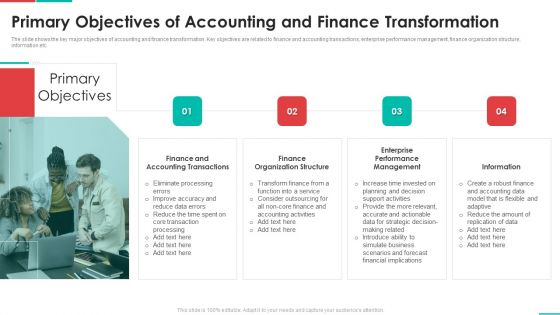
Roadmap For Financial Accounting Transformation Primary Objectives Of Accounting And Finance Transformation Themes PDF
The slide shows the key major objectives of accounting and finance transformation. Key objectives are related to finance and accounting transactions, enterprise performance management, finance organization structure, information etc. Presenting roadmap for financial accounting transformation primary objectives of accounting and finance transformation themes pdf to provide visual cues and insights. Share and navigate important information on four stages that need your due attention. This template can be used to pitch topics like finance and accounting transactions, finance organization structure, enterprise performance management, information. In addtion, this PPT design contains high resolution images, graphics, etc, that are easily editable and available for immediate download.
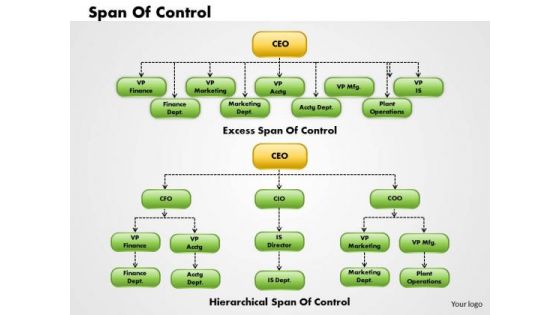
Business Framework Organization Chart 1 PowerPoint Presentation
This image slide has been designed to display span of control flow chart. Use this image slide, in your presentations to depict human resource management in business. This image slide will enhance the quality of your presentations.
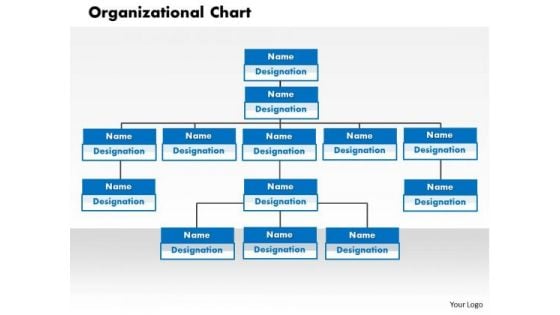
Business Framework Organizational Chart PowerPoint Presentation
This image slide has been designed to display organizational flow chart. Use this image slide, in your presentations to depict human resource management in business designation. This image slide will enhance the quality of your presentations.
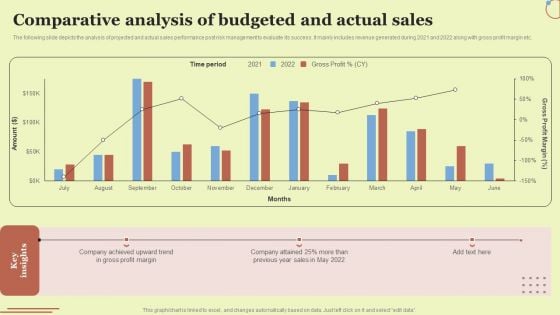
Comparative Analysis Of Budgeted And Actual Sales Rules PDF
The following slide depicts the analysis of projected and actual sales performance post risk management to evaluate its success. It mainly includes revenue generated during 2021 and 2022 along with gross profit margin etc. This Comparative Analysis Of Budgeted And Actual Sales Rules PDF from Slidegeeks makes it easy to present information on your topic with precision. It provides customization options, so you can make changes to the colors, design, graphics, or any other component to create a unique layout. It is also available for immediate download, so you can begin using it right away. Slidegeeks has done good research to ensure that you have everything you need to make your presentation stand out. Make a name out there for a brilliant performance.
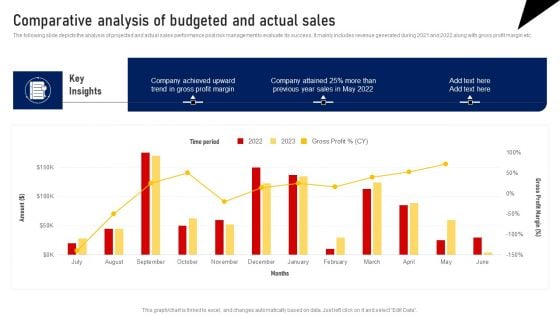
Comparative Analysis Of Budgeted And Actual Sales Template PDF
The following slide depicts the analysis of projected and actual sales performance post risk management to evaluate its success. It mainly includes revenue generated during 2021 and 2022 along with gross profit margin etc. This Comparative Analysis Of Budgeted And Actual Sales Template PDF from Slidegeeks makes it easy to present information on your topic with precision. It provides customization options, so you can make changes to the colors, design, graphics, or any other component to create a unique layout. It is also available for immediate download, so you can begin using it right away. Slidegeeks has done good research to ensure that you have everything you need to make your presentation stand out. Make a name out there for a brilliant performance.
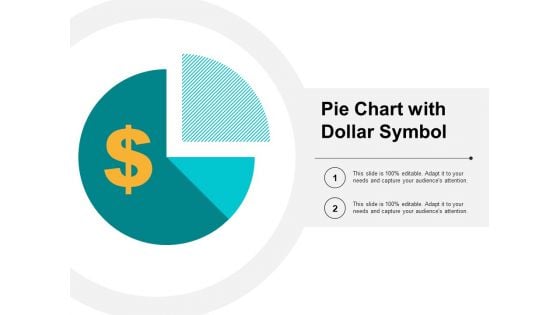
Pie Chart With Dollar Symbol Ppt PowerPoint Presentation Infographic Template Graphics Design
This is a pie chart with dollar symbol ppt powerpoint presentation infographic template graphics design. This is a two stage process. The stages in this process are sectioned circle, segmented circle, partitioned circle.
Experimental Control Pie Chart With Dollar Symbol Ppt Powerpoint Presentation Infographics Background Images
This is a experimental control pie chart with dollar symbol ppt powerpoint presentation infographics background images. This is a four stage process. The stages in this process are exploratory, experimental, investigational.
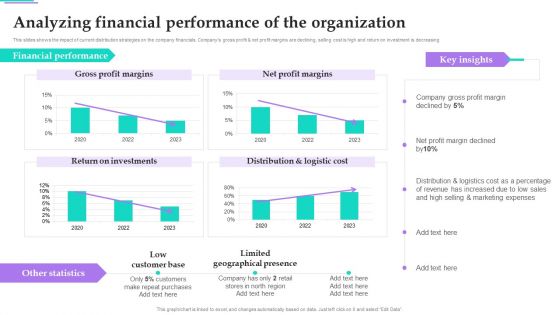
Distribution Strategies For Increasing Analyzing Financial Performance Of The Organization Microsoft PDF
This slides shows the impact of current distribution strategies on the company financials. Companys gross profit and net profit margins are declining, selling cost is high and return on investment is decreasing. There are so many reasons you need a Distribution Strategies For Increasing Analyzing Financial Performance Of The Organization Microsoft PDF. The first reason is you cant spend time making everything from scratch, Thus, Slidegeeks has made presentation templates for you too. You can easily download these templates from our website easily.

Financial Ratios Chart Ppt PowerPoint Presentation Complete Deck With Slides
Pitch yourself both in house and outside by utilizing this complete deck. This financial ratios chart ppt powerpoint presentation complete deck with slides focuses on key fundamentals of the topic, displayed using different slides. With a total of fifteen slides, this template is the best tool you can use to persuade your audience. It will not only help you create great presentations but also induce strategic thinking because of its well researched content and graphics. You can easily personalize any of the elements to suit your unique business setting. Additionally, it can be saved in PNG, JPG, and PDF formats to save your time and resources.
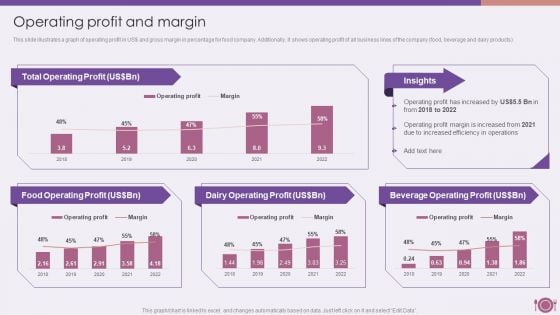
Packaged Food Firm Description Operating Profit And Margin Diagrams PDF
The slide highlights the organizational hierarchy chart for company. It depicts board of directors, chairman, chief executing officer, president, chief operating officer, chief of research and development,, chief of operations, chief of finance, chief of corporate compliance and chief of human resource.Deliver an awe inspiring pitch with this creative Packaged Food Firm Description Operating Profit And Margin Diagrams PDF bundle. Topics like Operating Officer, Research Development, Chief Marketing can be discussed with this completely editable template. It is available for immediate download depending on the needs and requirements of the user.
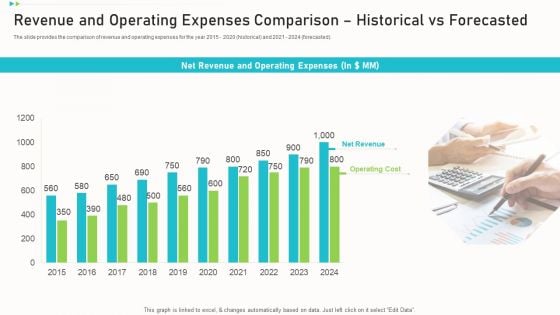
Revenue And Operating Expenses Comparison Historical Vs Forecasted Summary PDF
The slide provides the comparison of revenue and operating expenses for the year 2015 - 2020 historical and 2021 - 2024 forecasted. Deliver an awe inspiring pitch with this creative revenue and operating expenses comparison historical vs forecasted summary pdf bundle. Topics like net revenue, operating cost, operating expenses can be discussed with this completely editable template. It is available for immediate download depending on the needs and requirements of the user.
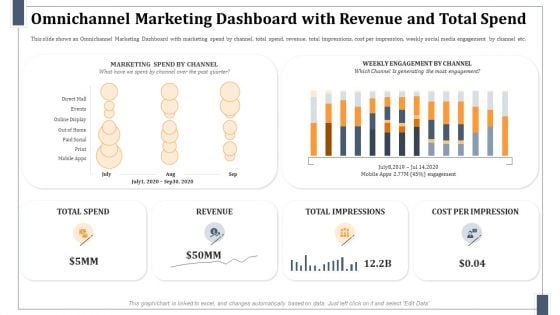
Omnichannel Marketing Dashboard With Revenue And Total Spend Formats PDF
This slide shows an Omnichannel Marketing Dashboard with marketing spend by channel, total spend, revenue, total impressions, cost per impression, weekly social media engagement by channel etc. Deliver and pitch your topic in the best possible manner with this omnichannel marketing dashboard with revenue and total spend formats pdf. Use them to share invaluable insights on revenue, impressions, marketing and impress your audience. This template can be altered and modified as per your expectations. So, grab it now.
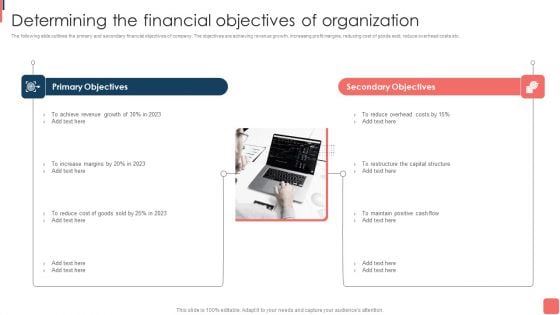
Effective Financial Planning Assessment Techniques Determining The Financial Objectives Of Organization Inspiration PDF
The following slide outlines the primary and secondary financial objectives of company. The objectives are achieving revenue growth, increasing profit margins, reducing cost of goods sold, reduce overhead costs etc. Whether you have daily or monthly meetings, a brilliant presentation is necessary. Effective Financial Planning Assessment Techniques Determining The Financial Objectives Of Organization Inspiration PDF can be your best option for delivering a presentation. Represent everything in detail using Effective Financial Planning Assessment Techniques Determining The Financial Objectives Of Organization Inspiration PDF and make yourself stand out in meetings. The template is versatile and follows a structure that will cater to your requirements. All the templates prepared by Slidegeeks are easy to download and edit. Our research experts have taken care of the corporate themes as well. So, give it a try and see the results.
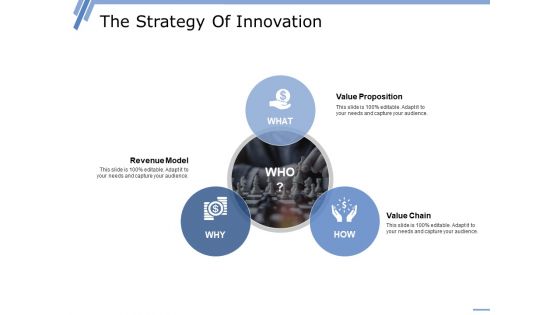
The Strategy Of Innovation Ppt PowerPoint Presentation Outline Display
This is a the strategy of innovation ppt powerpoint presentation outline display. This is a three stage process. The stages in this process are value proposition, value chain, revenue model.
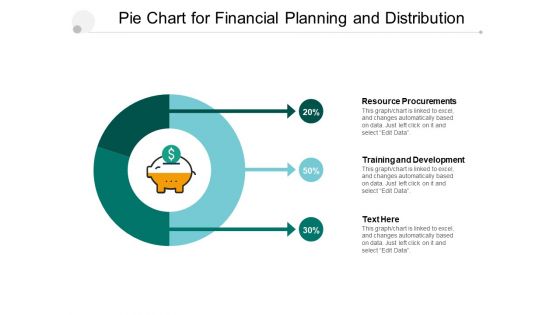
Pie Chart For Financial Planning And Distribution Ppt PowerPoint Presentation File Deck
Presenting this set of slides with name pie chart for financial planning and distribution ppt powerpoint presentation file deck. The topics discussed in these slides are pie chart, finance, donut chart. This is a completely editable PowerPoint presentation and is available for immediate download. Download now and impress your audience.

Business Diagram 3d Lock With Pie Graph For Result Representation PowerPoint Slide
This Power Point diagram has been crafted with pie chart in shape of lock. It contains diagram of lock pie chart to compare and present data in an effective manner. Use this diagram to build professional presentations for your viewers.
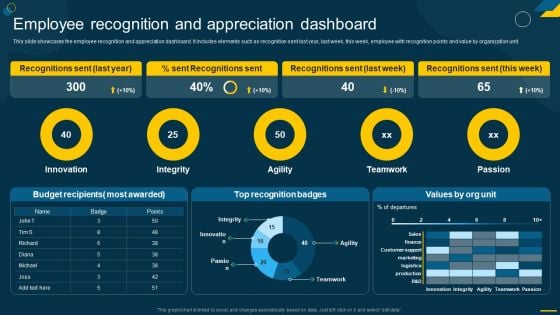
Engaging Employees Strategic Employee Recognition And Appreciation Dashboard Themes PDF
This slide showcases the employee recognition and appreciation dashboard. It includes elements such as recognition sent last year, last week, this week, employee with recognition points and value by organization unit. Slidegeeks is here to make your presentations a breeze with Engaging Employees Strategic Employee Recognition And Appreciation Dashboard Themes PDF With our easy-to-use and customizable templates, you can focus on delivering your ideas rather than worrying about formatting. With a variety of designs to choose from, youre sure to find one that suits your needs. And with animations and unique photos, illustrations, and fonts, you can make your presentation pop. So whether youre giving a sales pitch or presenting to the board, make sure to check out Slidegeeks first.
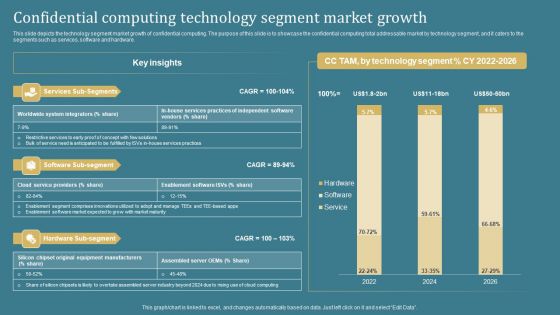
Confidential Computing System Technology Confidential Computing Technology Segment Themes PDF
This slide depicts the technology segment market growth of confidential computing. The purpose of this slide is to showcase the confidential computing total addressable market by technology segment, and it caters to the segments such as services, software and hardware. The Confidential Computing System Technology Confidential Computing Technology Segment Themes PDF is a compilation of the most recent design trends as a series of slides. It is suitable for any subject or industry presentation, containing attractive visuals and photo spots for businesses to clearly express their messages. This template contains a variety of slides for the user to input data, such as structures to contrast two elements, bullet points, and slides for written information. Slidegeeks is prepared to create an impression.
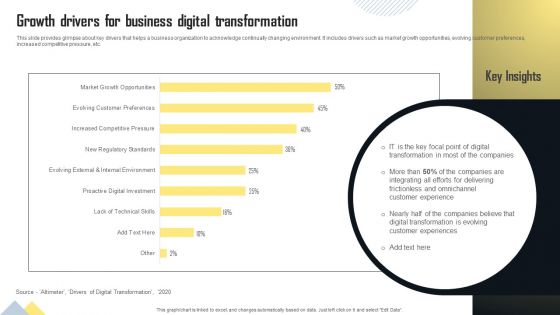
Growth Drivers For Business Digital Transformation Themes PDF
This slide provides glimpse about key drivers that helps a business organization to acknowledge continually changing environment. It includes drivers such as market growth opportunities, evolving customer preferences, increased competitive pressure, etc. This Growth Drivers For Business Digital Transformation Themes PDF from Slidegeeks makes it easy to present information on your topic with precision. It provides customization options, so you can make changes to the colors, design, graphics, or any other component to create a unique layout. It is also available for immediate download, so you can begin using it right away. Slidegeeks has done good research to ensure that you have everything you need to make your presentation stand out. Make a name out there for a brilliant performance.
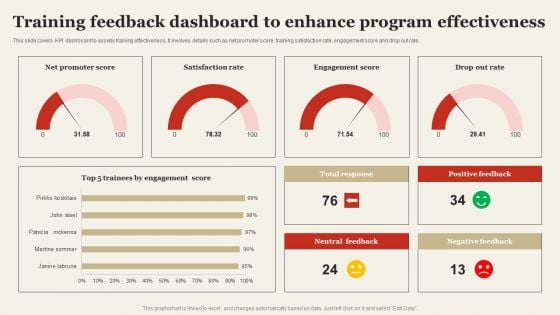
Training Feedback Dashboard To Enhance Program Effectiveness Themes PDF
This slide covers KPI dashboard to assess training effectiveness. It involves details such as net promoter score, training satisfaction rate, engagement score and drop out rate. Coming up with a presentation necessitates that the majority of the effort goes into the content and the message you intend to convey. The visuals of a PowerPoint presentation can only be effective if it supplements and supports the story that is being told. Keeping this in mind our experts created Training Feedback Dashboard To Enhance Program Effectiveness Themes PDF to reduce the time that goes into designing the presentation. This way, you can concentrate on the message while our designers take care of providing you with the right template for the situation.
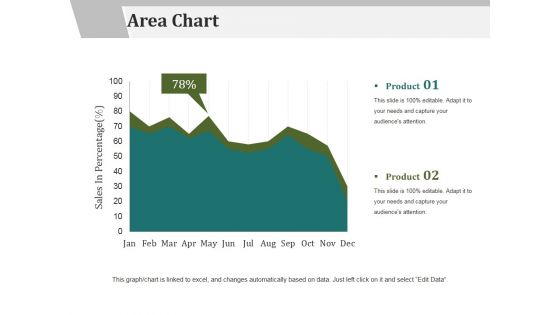
Area Chart Ppt PowerPoint Presentation Infographics Graphics Tutorials
This is a area chart ppt powerpoint presentation infographics graphics tutorials. This is a two stage process. The stages in this process are product, area chart, sales in percentage.
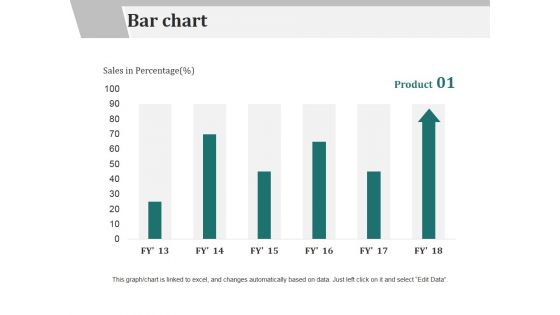
Bar Chart Ppt PowerPoint Presentation Slides Design Ideas
This is a bar chart ppt powerpoint presentation slides design ideas. This is a six stage process. The stages in this process are product, bar chart, sales in percentage.
Line Chart Ppt PowerPoint Presentation Gallery Master Slide
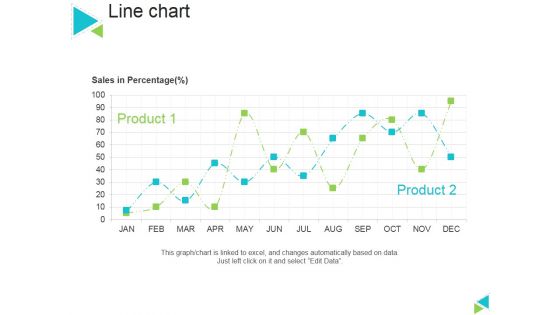
This is a line chart ppt powerpoint presentation gallery master slide. This is a two stage process. The stages in this process are sales in percentage, product, line chart.
Scatter Bubble Chart Ppt PowerPoint Presentation Ideas Design Templates
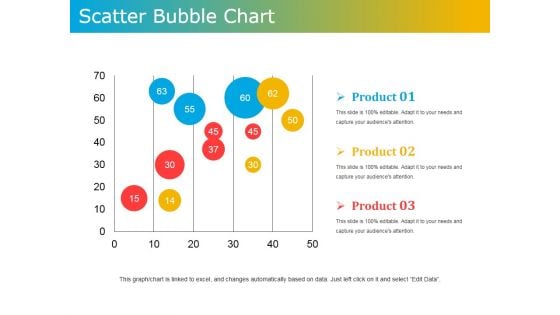
This is a scatter bubble chart ppt powerpoint presentation ideas design templates. This is a three stage process. The stages in this process are product, scatter, bubble chart, business, marketing.
Radar Chart Ppt PowerPoint Presentation Slides Designs Download
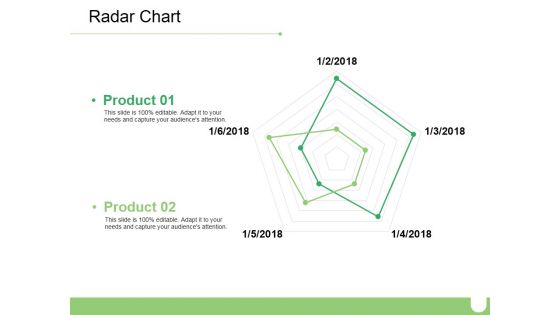
This is a radar chart ppt powerpoint presentation slides designs download. This is a two stage process. The stages in this process are business, radar chart, marketing, graph, strategy.
Scatter Bubble Chart Ppt PowerPoint Presentation Infographic Template Graphic Images
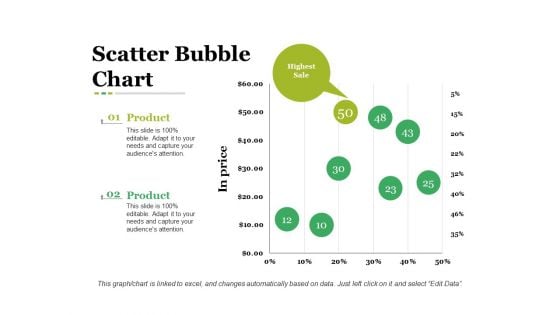
This is a scatter bubble chart ppt powerpoint presentation infographic template graphic images. This is a two stage process. The stages in this process are business, in price, bubble chart, marketing, strategy.
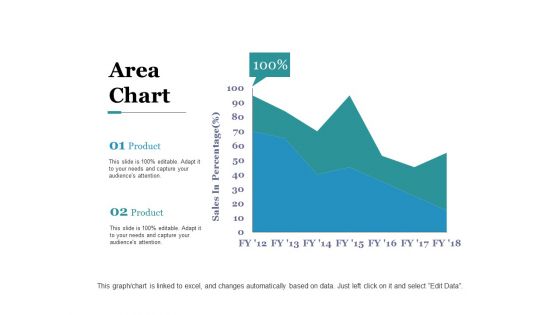
Area Chart Ppt PowerPoint Presentation Outline Graphic Tips
This is a area chart ppt powerpoint presentation outline graphic tips. This is a two stage process. The stages in this process are business, sales in percentage, area chart, percentage, marketing.
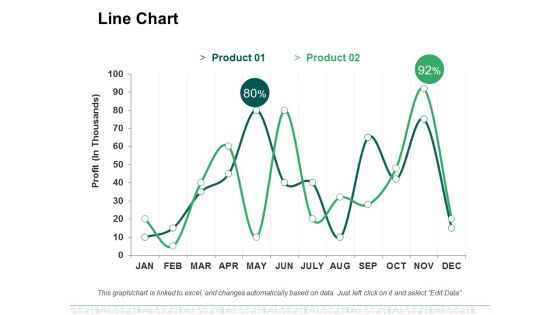
Line Chart Ppt PowerPoint Presentation File Designs Download
This is a line chart ppt powerpoint presentation file designs download. This is a two stage process. The stages in this process are business, marketing, profit, line chart, percentage.
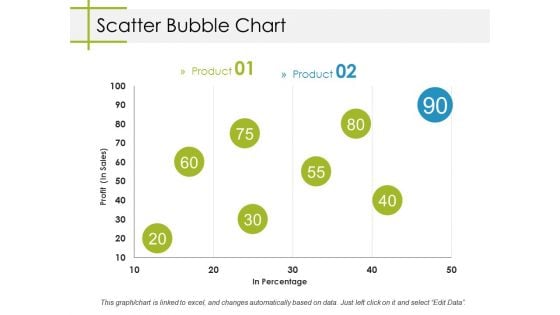
Scatter Bubble Chart Ppt PowerPoint Presentation Model Designs
This is a scatter bubble chart ppt powerpoint presentation model designs. This is a two stage process. The stages in this process are business, profit, in percentage, bubble chart, marketing.
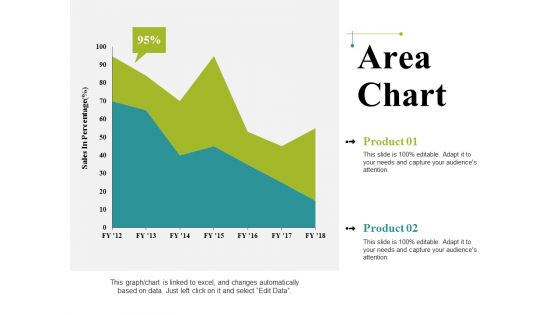
Area Chart Ppt PowerPoint Presentation Infographics Graphics Pictures
This is a area chart ppt powerpoint presentation infographics graphics pictures. This is a two stage process. The stages in this process are business, sales in percentage, area chart, marketing, graph.
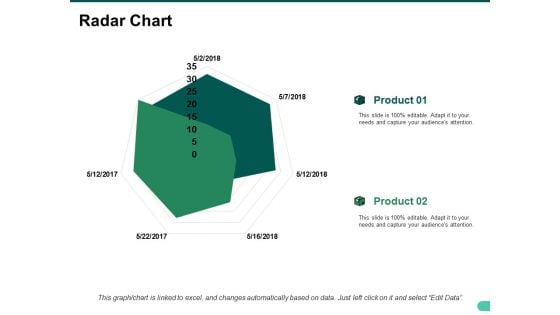
Radar Chart Ppt PowerPoint Presentation Show Graphic Images
This is a radar chart ppt powerpoint presentation show graphic images. This is a two stage process. The stages in this process are business, radar chart, marketing, graph, strategy.
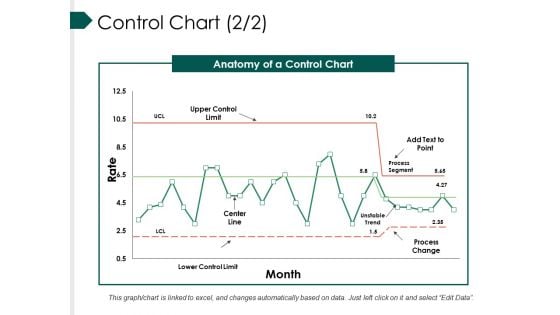
Control Chart Template Ppt PowerPoint Presentation Slides Smartart
This is a control chart template ppt powerpoint presentation slides smartart. This is a two stage process. The stages in this process are anatomy of a control chart, upper control limit, add text to point, process change, lower control limit.

Area Chart Ppt PowerPoint Presentation Styles Design Templates
This is a area chart ppt powerpoint presentation styles design templates. This is a two stage process. The stages in this process are area chart, analysis, business, marketing, strategy.
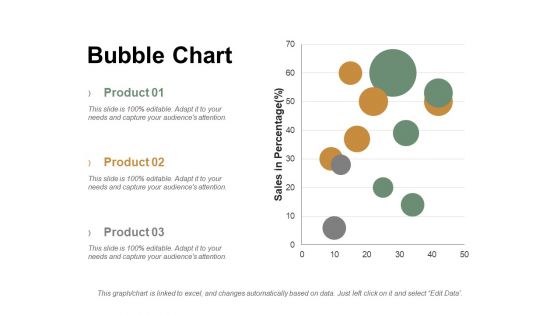
Bubble Chart Ppt PowerPoint Presentation Summary Graphics Tutorials
This is a bubble chart ppt powerpoint presentation summary graphics tutorials. This is a three stage process. The stages in this process are product, sales in percentage, bubble chart.
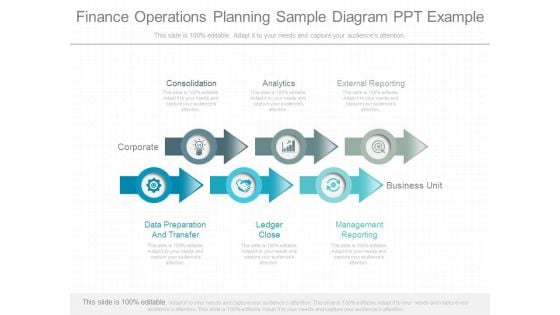
Finance Operations Planning Sample Diagram Ppt Example
This is a finance operations planning sample diagram ppt example. This is a six stage process. The stages in this process are consolidation, analytics, corporate, external reporting, business unit, data preparation and transfer, ledger close, management reporting.\n\n\n\n\n\n\n\n\n \n
Accounting Marketing Finances Diagram Powerpoint Topics
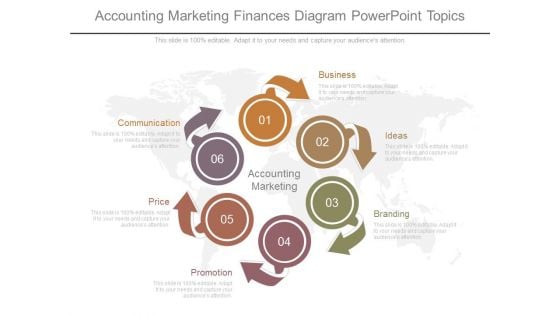
This is a accounting marketing finances diagram powerpoint topics. This is a six stage process. The stages in this process are accounting marketing, business, ideas, branding, promotion, price, communication.
Trade Finance Example Diagram Powerpoint Ideas
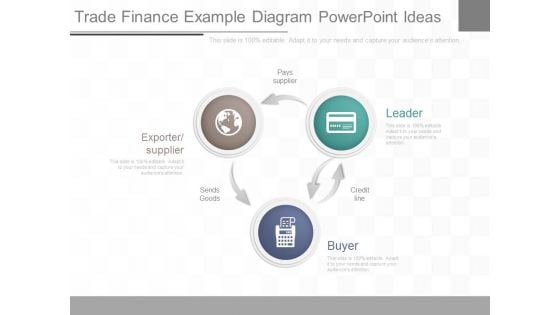
This is a trade finance example diagram powerpoint ideas. This is a three stage process. The stages in this process are leader, buyer, exporter supplier, pays supplier, sends goods, credit line.

Business Acquisition Finance Diagram Ppt Example
This is a business acquisition finance diagram ppt example. This is a one stage process. The stages in this process are cash, buyer, stock of target, shareholders, assets liabilities, target.
Finance Enterprise Strategy Diagram Powerpoint Templates Download
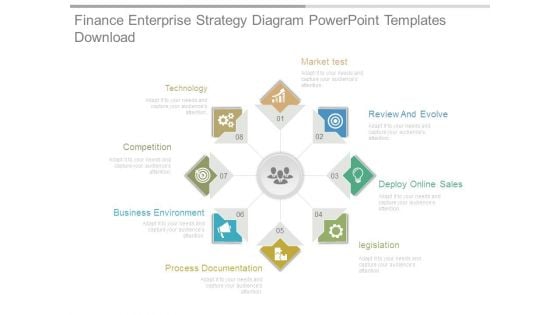
This is a finance enterprise strategy diagram powerpoint templates download. This is a eight stage process. The stages in this process are market test, review and evolve, deploy online sales, legislation, process documentation, business environment, competition, technology.
Financing Management Diagram Powerpoint Slide Background
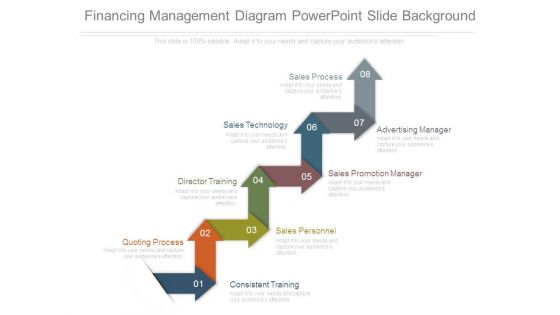
This is a financing management diagram powerpoint slide background. This is a eight stage process. The stages in this process are sales process, sales technology, advertising manager, sales promotion manager, director training, sales personnel, consistent training, quoting process.
Financing Management Diagram Ppt Example File
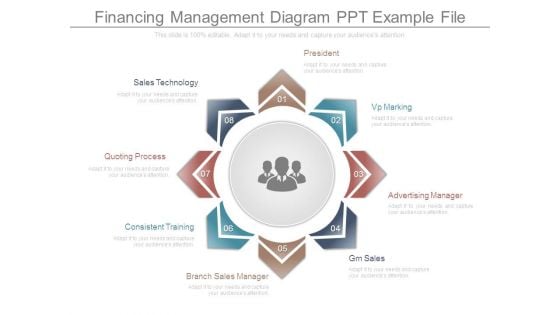
This is a financing management diagram ppt example file. This is a eight stage process. The stages in this process are sales technology, president, vp marking, advertising manager, gm sales, branch sales manager, consistent training, quoting process.
Mechanics Finance Progress Diagram Powerpoint Images
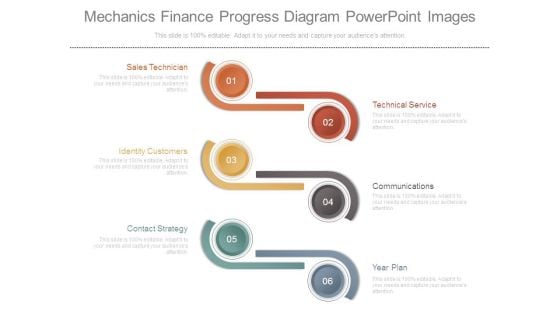
This is a mechanics finance progress diagram powerpoint images. This is a six stage process. The stages in this process are sales technician, identity customers, contact strategy, technical service, communications, year plan.
Finance Administration Strategy Diagram Powerpoint Slide Show
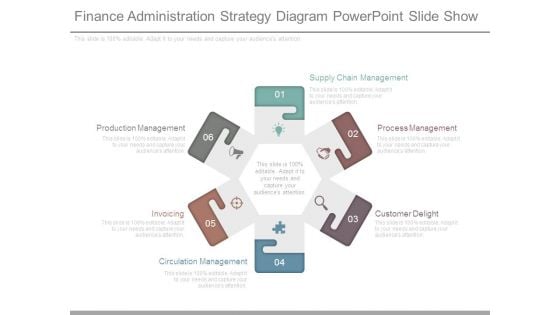
This is a finance administration strategy diagram powerpoint slide show. This is a six stage process. The stages in this process are supply chain management, process management, customer delight, circulation management, invoicing, production management.
Finance Administration Strategy Diagram Powerpoint Templates
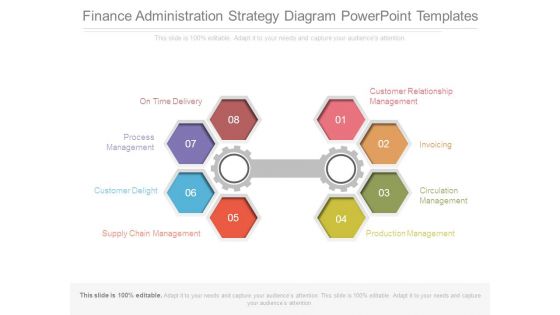
This is a finance administration strategy diagram powerpoint templates. This is a eight stage process. The stages in this process are on time delivery, process management, customer delight, supply chain management, production management, circulation management, invoicing, customer relationship management.

Finance Enterprise Strategy Diagram Powerpoint Guide
This is a finance enterprise strategy diagram powerpoint guide. This is a six stage process. The stages in this process are process documentation, industry trends, test functionality, competition, business environment, review and evolve.
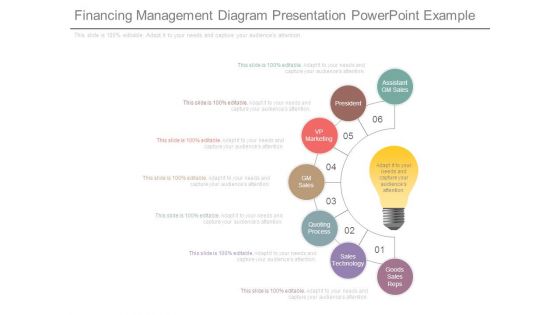
Financing Management Diagram Presentation Powerpoint Example
This is a financing management diagram presentation powerpoint example. This is a six stage process. The stages in this process are assistant gm sales, president, vp marketing, gm sales, quoting process, sales technology, goods sales reps.
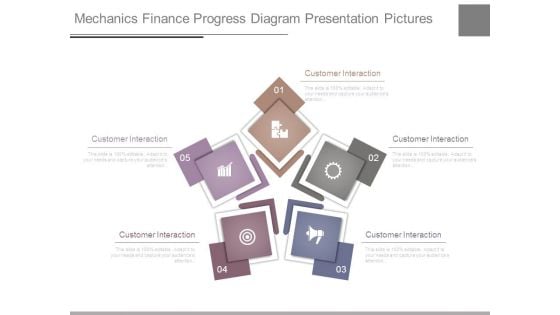
Mechanics Finance Progress Diagram Presentation Pictures
This is a mechanics finance progress diagram presentation pictures. This is a five stage process. The stages in this process are customer interaction, customer interaction, customer interaction, customer interaction, customer interaction.
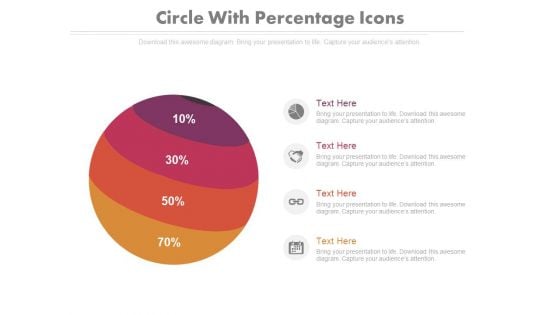
Four Parts Circle Chart With Percentage Ratio Powerpoint Slides
This PowerPoint template contains four parts circle chart with percentage ratio. You may download this PPT slide design to display your ideas in visual manner. You can easily customize this template to make it more unique as per your need.
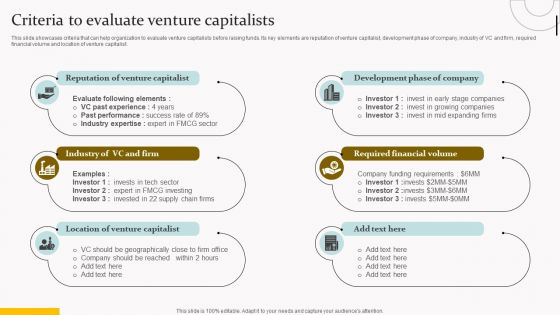
Capital Acquisition Strategy For Startup Business Criteria To Evaluate Venture Capitalists Template PDF
This slide showcases criteria that can help organization to evaluate venture capitalists before raising funds. Its key elements are reputation of venture capitalist, development phase of company, industry of VC and firm, required financial volume and location of venture capitalist. Do you have to make sure that everyone on your team knows about any specific topic I yes, then you should give Capital Acquisition Strategy For Startup Business Criteria To Evaluate Venture Capitalists Template PDF a try. Our experts have put a lot of knowledge and effort into creating this impeccable Capital Acquisition Strategy For Startup Business Criteria To Evaluate Venture Capitalists Template PDF. You can use this template for your upcoming presentations, as the slides are perfect to represent even the tiniest detail. You can download these templates from the Slidegeeks website and these are easy to edit. So grab these today.
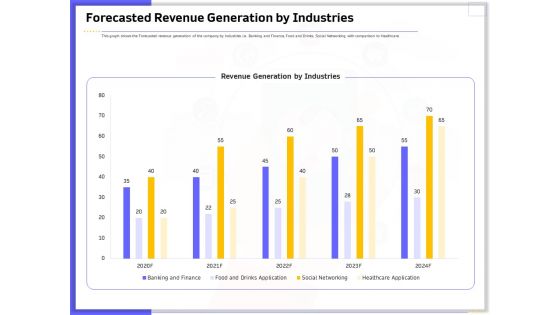
Developing Deploying Android Applications Forecasted Revenue Generation By Industries Demonstration PDF
Presenting this set of slides with name developing deploying android applications forecasted revenue generation by industries demonstration pdf. The topics discussed in these slides are banking and finance, food and drink application, social networking, healthcare application. This is a completely editable PowerPoint presentation and is available for immediate download. Download now and impress your audience.

Agile Best Practices For Effective Team Outcomes Of Implementing Agile Strategies Cost Pictures PDF
Deliver and pitch your topic in the best possible manner with this agile best practices for effective team outcomes of implementing agile strategies cost pictures pdf. Use them to share invaluable insights on investment, development cost, team productivity and impress your audience. This template can be altered and modified as per your expectations. So, grab it now.
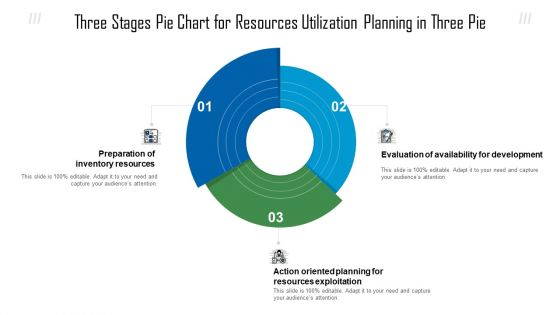
Three Stages Pie Chart For Resources Utilization Planning In Three Pie Ppt Styles Files PDF
Presenting three stages pie chart for resources utilization planning in three pie ppt styles files pdf to dispense important information. This template comprises three stages. It also presents valuable insights into the topics including resources exploitation, inventory resources, development. This is a completely customizable PowerPoint theme that can be put to use immediately. So, download it and address the topic impactfully.
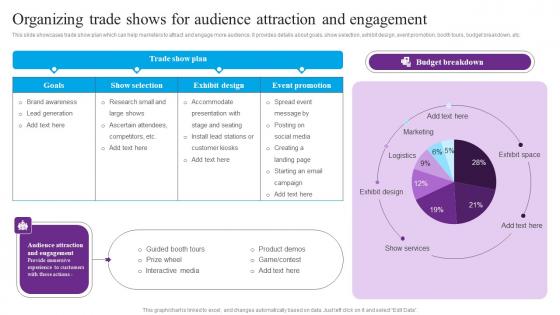
Organizing Trade Shows Audience Centric Marketing To Enhance Brand Connections Diagrams Pdf
This slide showcases trade show plan which can help marketers to attract and engage more audience. It provides details about goals, show selection, exhibit design, event promotion, booth tours, budget breakdown, etc. Are you in need of a template that can accommodate all of your creative concepts This one is crafted professionally and can be altered to fit any style. Use it with Google Slides or PowerPoint. Include striking photographs, symbols, depictions, and other visuals. Fill, move around, or remove text boxes as desired. Test out color palettes and font mixtures. Edit and save your work, or work with colleagues. Download Organizing Trade Shows Audience Centric Marketing To Enhance Brand Connections Diagrams Pdf and observe how to make your presentation outstanding. Give an impeccable presentation to your group and make your presentation unforgettable. This slide showcases trade show plan which can help marketers to attract and engage more audience. It provides details about goals, show selection, exhibit design, event promotion, booth tours, budget breakdown, etc.
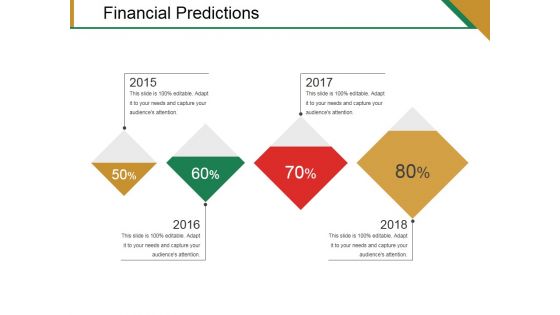
Financial Predictions Template 1 Ppt PowerPoint Presentation Infographic Template Themes
This is a financial predictions template 1 ppt powerpoint presentation infographic template themes. This is a four stage process. The stages in this process are business, finance, marketing, strategy, analysis, success.
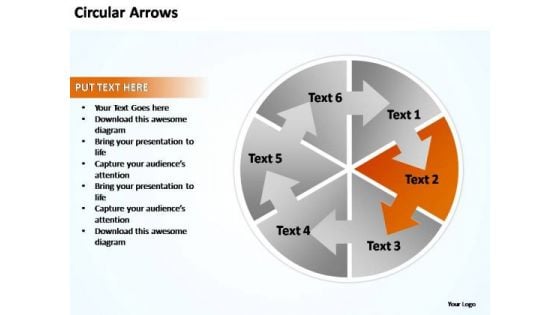
PowerPoint Templates Business Circular Arrows Pointer Ppt Slides
PowerPoint Templates Business Circular Arrows Pointer PPT Slides-Explore the various directions and layers existing in your in your plans and processes. Unravel the desired and essential elements of your overall strategy. Explain the relevance of the different layers and stages and directions in getting down to your core competence, ability and desired result. Analyse the effect of different factors. Our PowerPoint Templates Business Circular Arrows Pointer Ppt Slides will give them equal attention.


 Continue with Email

 Home
Home


