Number Circles
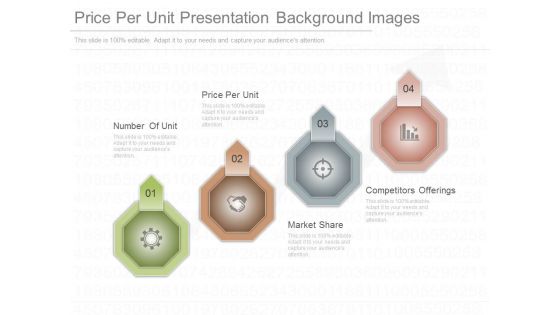
Price Per Unit Presentation Background Images
This is a price per unit presentation background images. This is a four stage process. The stages in this process are number of unit, price per unit, market share, competitors offerings.
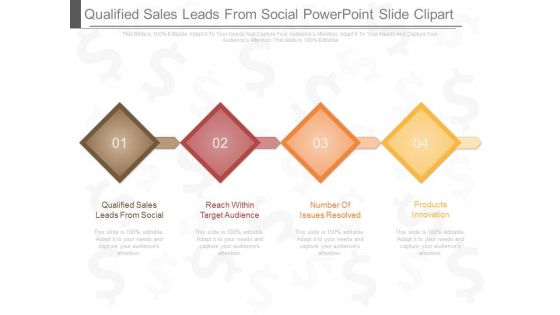
Qualified Sales Leads From Social Powerpoint Slide Clipart
This is a qualified sales leads from social powerpoint slide clipart. This is a four stage process. The stages in this process are qualified sales leads from social, reach within target audience, number of issues resolved, products innovation.
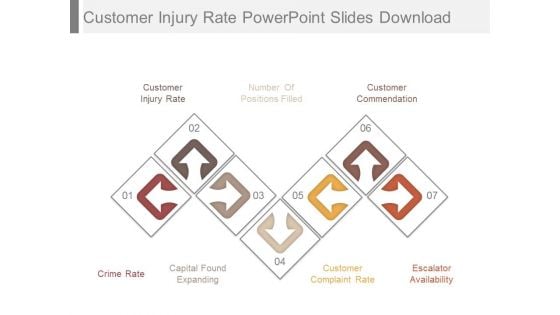
Customer Injury Rate Powerpoint Slides Download
This is a customer injury rate powerpoint slides download. This is a seven stage process. The stages in this process are customer injury rate, number of positions filled, customer commendation, crime rate, capital found expanding, customer complaint rate, escalator availability.
Sales Call Tracking Diagram Powerpoint Shapes
This is a sales call tracking diagram powerpoint shapes. This is a four stage process. The stages in this process are online search clicks on adds, unique phone number for customer call, call to customer care, tracking to ppc campaign.
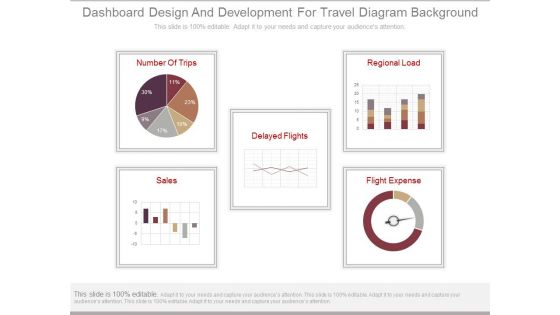
Dashboard Design And Development For Travel Diagram Background
This is a dashboard design and development for travel diagram background. This is a five stage process. The stages in this process are number of trips, sales, delayed flights, regional load, flight expense.
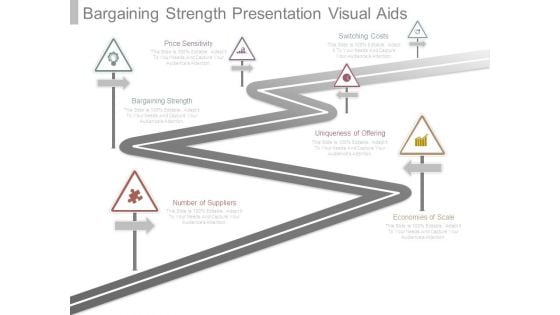
Bargaining Strength Presentation Visual Aids
This is a bargaining strength presentation visual aids. This is a six stage process. The stages in this process are number of suppliers, bargaining strength, price sensitivity, switching costs, uniqueness of offering, economies of scale.
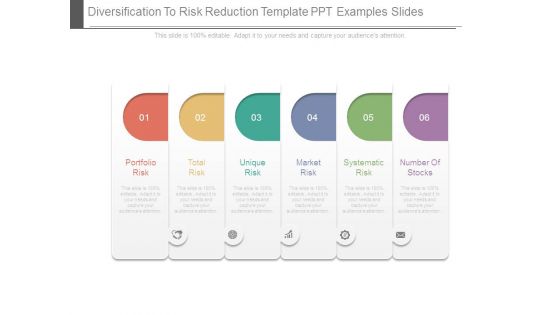
Diversification To Risk Reduction Template Ppt Examples Slides
This is a diversification to risk reduction template ppt examples slides. This is a six stage process. The stages in this process are portfolio risk, total risk, unique risk, market risk, systematic risk, number of stocks.
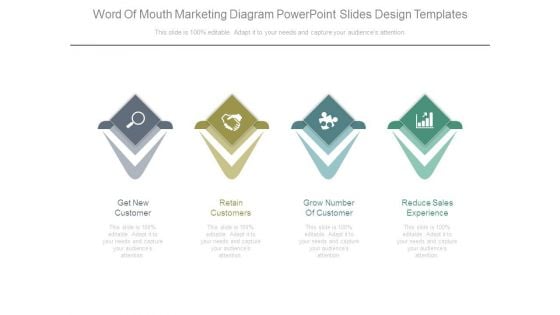
Word Of Mouth Marketing Diagram Powerpoint Slides Design Templates
This is a word of mouth marketing diagram powerpoint slides design templates. This is a four stage process. The stages in this process are get new customer, retain customers, grow number of customer, reduce sales experience.
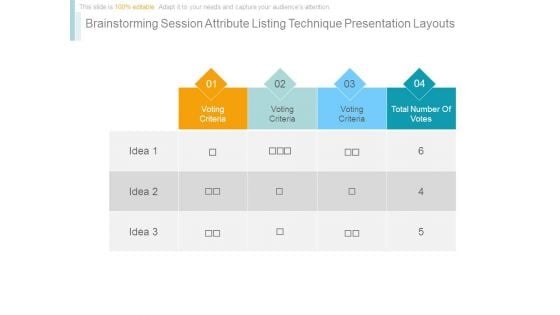
Brainstorming Session Attribute Listing Technique Presentation Layouts
This is a brainstorming session attribute listing technique presentation layouts. This is a four stage process. The stages in this process are voting criteria, total number of votes, idea.
Business Competition Comparison Table Ppt Icon
This is a business competition comparison table ppt icon. This is a seven stage process. The stages in this process are criteria, revenue, profit, market share, main activity, number of employee, product quality, insert your text, competitor.
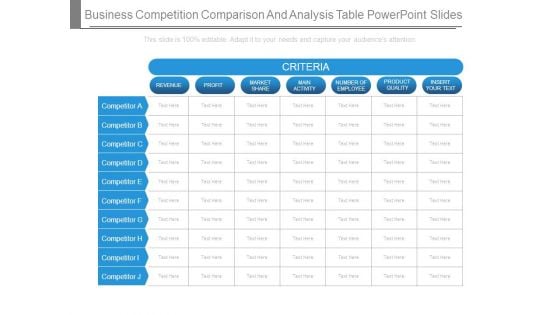
Business Competition Comparison And Analysis Table Powerpoint Slides
This is a business competition comparison and analysis table powerpoint slides. This is a six stage process. The stages in this process are criteria, revenue, profit, market share, main activity, number of employee, product quality, competitor.

Criteria Based Competition Comparison Table Powerpoint Slides
This is a criteria based competition comparison table powerpoint slides. This is a seven stage process. The stages in this process are revenue, profit, market share, main activity, number of employee, product quality.
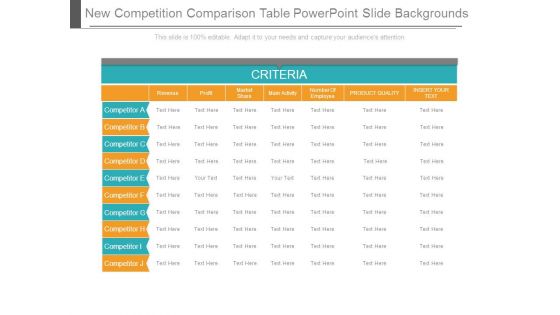
New Competition Comparison Table Powerpoint Slide Backgrounds
This is a new competition comparison table powerpoint slide backgrounds. This is a seven stage process. The stages in this process are revenue, profit, market share, main activity, number of employee, product quality, insert your text.
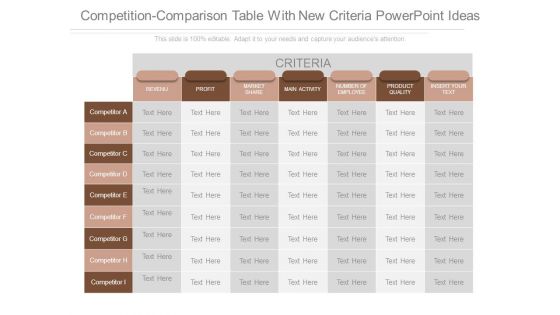
Competition Comparison Table With New Criteria Powerpoint Ideas
This is a competition comparison table with new criteria powerpoint ideas. This is a seven stage process. The stages in this process are revenu, profit, market share, main activity, number of employee, product quality, insert your text.
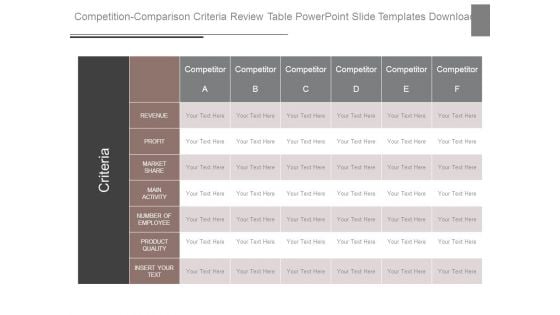
Competition Comparison Criteria Review Table Powerpoint Slide Templates Download
This is a competition comparison criteria review table powerpoint slide templates download. This is a six stage process. The stages in this process are criteria, competitor revenue, profit, market share, main activity, number of employee, product quality, insert your text.
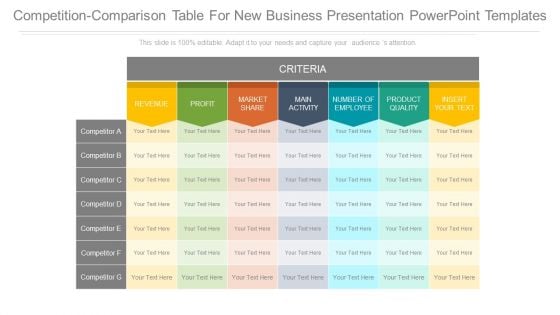
Competition Comparison Table For New Business Presentation Powerpoint Templates
This is a competition comparison table for new business presentation powerpoint templates. This is a seven stage process. The stages in this process are criteria, revenue, profit, market share, main activity, number of employee, product quality, insert your text.

Business Comparison Table Sample Ppt Presentation
This is a business comparison table sample ppt presentation. This is a seven stage process. The stages in this process are criteria, revenue, profit, market, share, main activity, number of employee, product quality, insert your text, competitor.
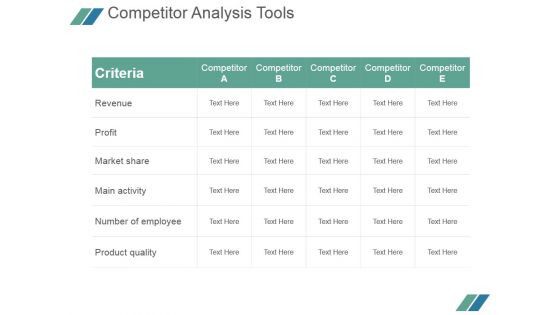
Competitor Analysis Tools Ppt PowerPoint Presentation Example File
This is a competitor analysis tools ppt powerpoint presentation example file. This is a five stage process. The stages in this process are criteria, revenue, profit, market share, main activity, number of employee, product quality.
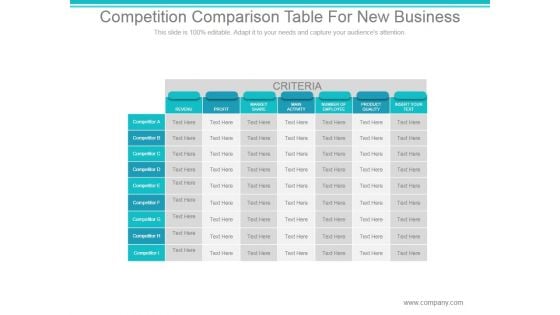
Competition Comparison Table For New Business Ppt PowerPoint Presentation Slides
This is a competition comparison table for new business ppt powerpoint presentation slides. This is a seven stage process. The stages in this process are criteria, revenue, profit, market share, main activity, number of employee, product quality, competitor.
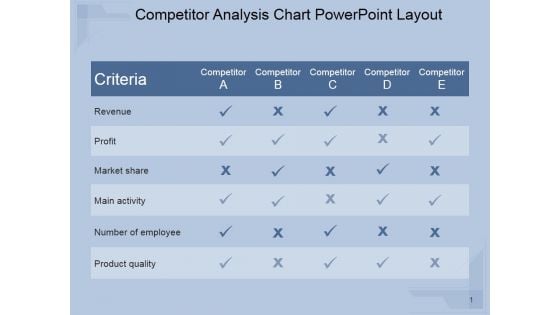
Competitor Analysis Chart Ppt PowerPoint Presentation Visuals
This is a competitor analysis chart ppt powerpoint presentation visuals. This is a five stage process. The stages in this process are revenue, profit, market share, main activity, number of employee, product quality.
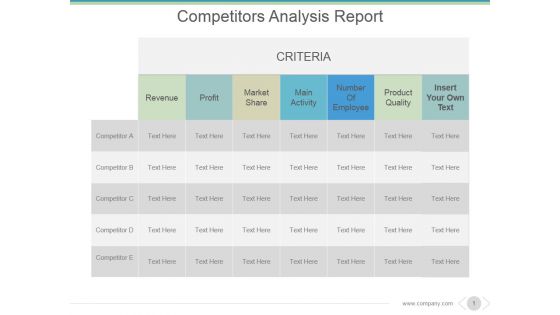
Competitors Analysis Report Ppt PowerPoint Presentation Introduction
This is a competitors analysis report ppt powerpoint presentation introduction. This is a seven stage process. The stages in this process are criteria, revenue, profit, market share, main activity, number of employee.

Measuring Content Marketing Performance Ppt PowerPoint Presentation Design Ideas
This is a measuring content marketing performance ppt powerpoint presentation design ideas. This is a eight stage process. The stages in this process are conversion rate, quality of leads, website traffic, number of leads, sales revenue, subscriber list growth.
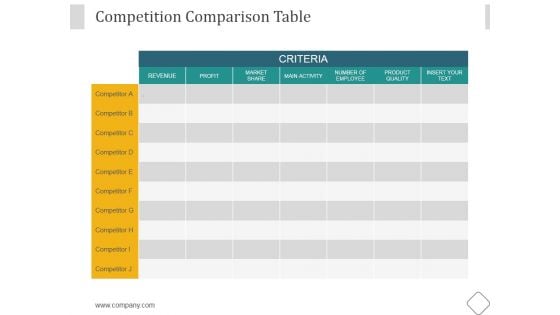
Competition Comparison Table Ppt PowerPoint Presentation Outline
This is a competition comparison table ppt powerpoint presentation outline. This is a seven stage process. The stages in this process are revenue, profit, market share, main activity, number of employee, product quality.
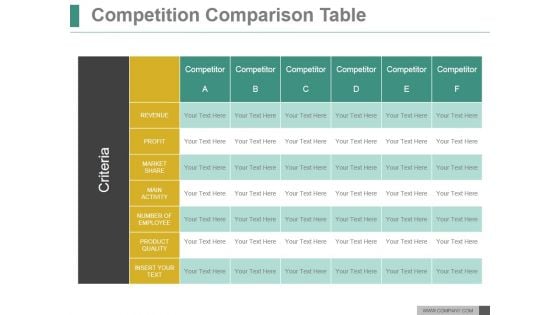
Competition Comparison Table Ppt PowerPoint Presentation Slide
This is a competition comparison table ppt powerpoint presentation slide. This is a six stage process. The stages in this process are revenue, profit, market share, main activity, number of employee, product quality.
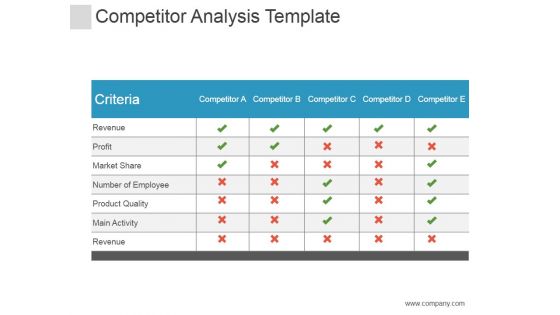
Competitor Analysis Template Ppt PowerPoint Presentation Guidelines
This is a competitor analysis template ppt powerpoint presentation guidelines. This is a five stage process. The stages in this process are revenue, profit, market share, competitor, number of employee.
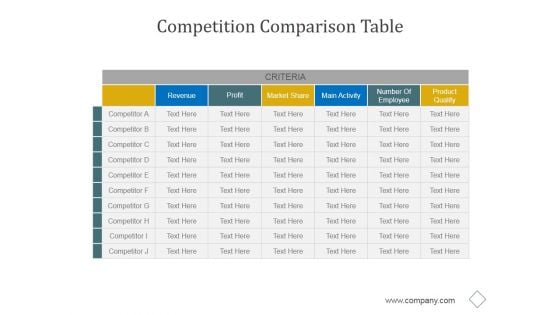
Competition Comparison Table Ppt PowerPoint Presentation Visual Aids
This is a competition comparison table ppt powerpoint presentation visual aids. This is a six stage process. The stages in this process are revenue, profit, market share, main activity, number of employee, product quality.
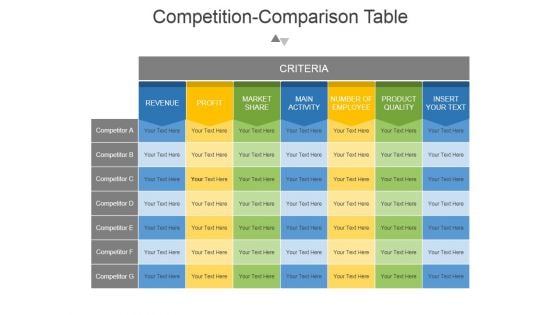
Competition Comparison Table Ppt PowerPoint Presentation Backgrounds
This is a competition comparison table ppt powerpoint presentation backgrounds. This is a seven stage process. The stages in this process are revenue, profit, market share , main activity, number of employee, product quality , insert your text.
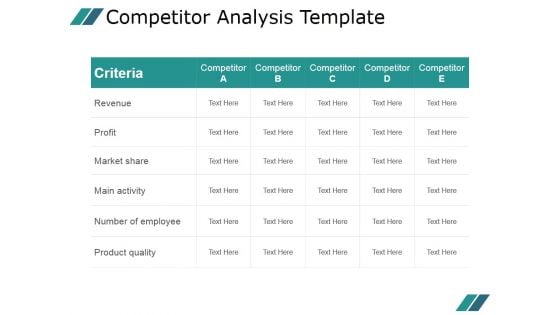
Competitor Analysis Template Ppt PowerPoint Presentation Model
This is a competitor analysis template ppt powerpoint presentation model. This is a five stage process. The stages in this process are revenue, profit, market share, main activity, number of employee, product quality.
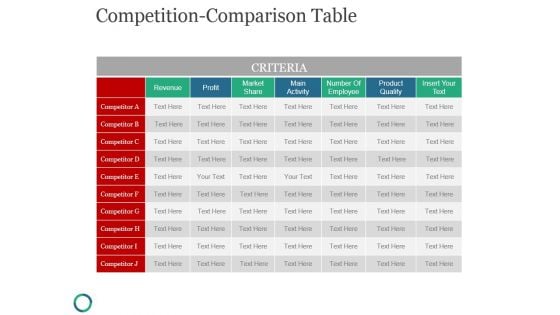
Competition Comparison Table Ppt PowerPoint Presentation Microsoft
This is a competition comparison table ppt powerpoint presentation microsoft. This is a seven stage process. The stages in this process are criteria, revenue, market share, number of employee, insert your text.
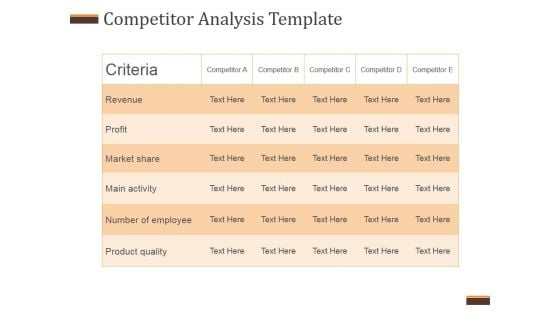
Competitor Analysis Template Ppt PowerPoint Presentation Example File
This is a competitor analysis template ppt powerpoint presentation example file. This is a five stage process. The stages in this process are revenue, profit, market share, main activity, number of employee, product quality.
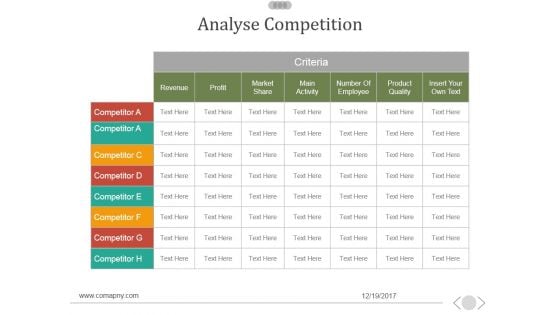
Analyse Competition Ppt PowerPoint Presentation Themes
This is a analyse competition ppt powerpoint presentation themes. This is a seven stage process. The stages in this process are profit, revenue, market share, main activity, number of employee.
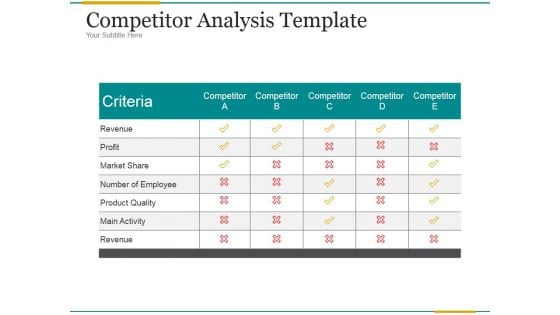
Competitor Analysis Template Ppt PowerPoint Presentation Ideas
This is a competitor analysis template ppt powerpoint presentation ideas. This is a five stage process. The stages in this process are revenue, profit, market share, number of employee, product quality, main activity, revenue.
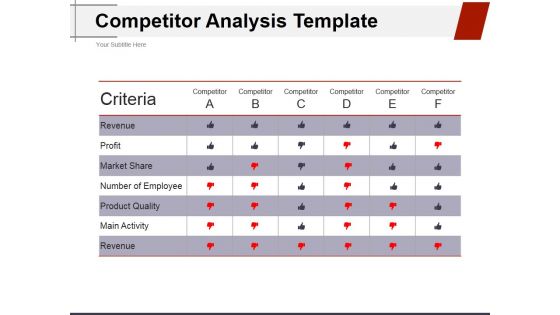
Competitor Analysis Template Ppt PowerPoint Presentation Outline Format Ideas
This is a competitor analysis template ppt powerpoint presentation outline format ideas. This is a four stage process. The stages in this process are revenue, profit, market share, number of employee, product quality, main activity, revenue.
Competitor Analysis Comparison Table Ppt PowerPoint Presentation Icon Designs Download
This is a competitor analysis comparison table ppt powerpoint presentation icon designs download. This is a seven stage process. The stages in this process are revenue, profit, market share, main activity, number of employee, product quality.
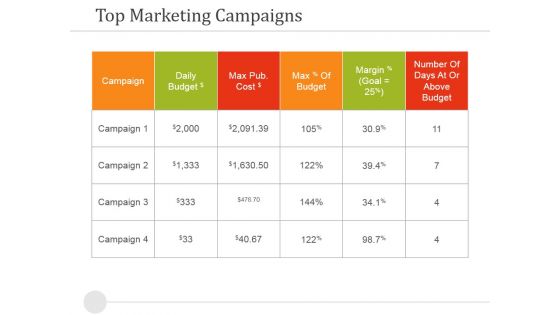
Top Marketing Campaigns Ppt PowerPoint Presentation Pictures Ideas
This is a top marketing campaigns ppt powerpoint presentation pictures ideas. This is a six stage process. The stages in this process are campaign, daily budget, max of budget, number of days at or above budget.
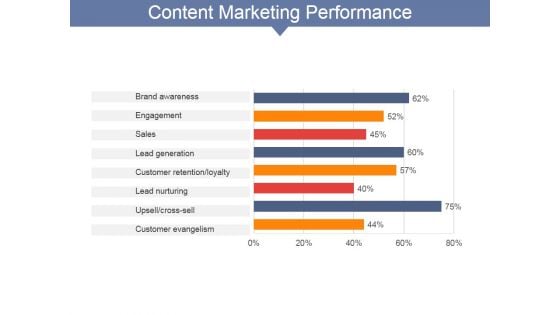
Content Marketing Performance Ppt PowerPoint Presentation Slides Model
This is a content marketing performance ppt powerpoint presentation slides model. This is a eight stage process. The stages in this process are conversion rate, quality of leads, number of leads, sales revenue, website traffic.
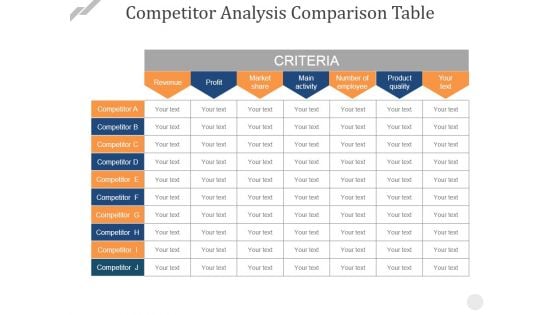
Competitor Analysis Comparison Table Ppt PowerPoint Presentation Show Grid
This is a competitor analysis comparison table ppt powerpoint presentation show grid. This is a seven stage process. The stages in this process are revenue, profit, market share, main activity, number of employee.
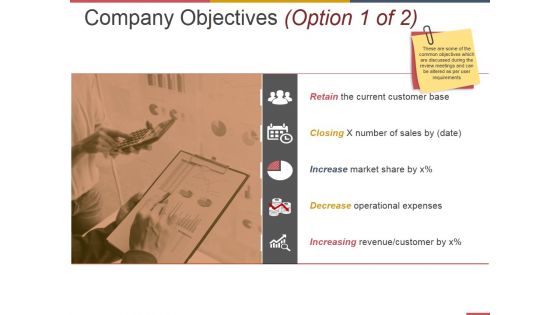
Company Objectives Template 1 Ppt PowerPoint Presentation Styles Infographics
This is a company objectives template 1 ppt powerpoint presentation styles infographics. This is a one stage process. The stages in this process are current customer base, number of sales by, market share, operational expenses.

Competition Comparison Table Ppt PowerPoint Presentation Pictures File Formats
This is a competition comparison table ppt powerpoint presentation pictures file formats. This is a seven stage process. The stages in this process are revenue, profit, market share, main activity, number of employee, product quality.

Top Marketing Campaigns Ppt PowerPoint Presentation Portfolio Themes
This is a top marketing campaigns ppt powerpoint presentation portfolio themes. This is a four stage process. The stages in this process are campaign, daily budget, max pub cost, max of budget, number of days at or above budget.
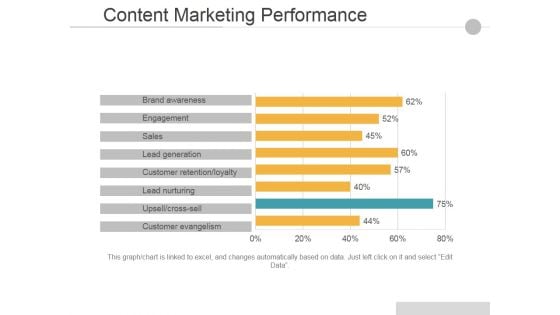
Content Marketing Performance Ppt PowerPoint Presentation Guidelines
This is a content marketing performance ppt powerpoint presentation guidelines. This is a eight stage process. The stages in this process are conversion rate, quality of leads, number of leads, sales revenue, website traffic.
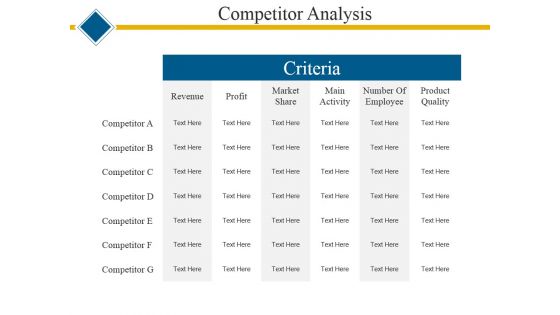
Competitor Analysis Ppt PowerPoint Presentation Professional Themes
This is a competitor analysis ppt powerpoint presentation professional themes. This is a six stage process. The stages in this process are revenue, profit, market share, main activity, number of employee, product quality.
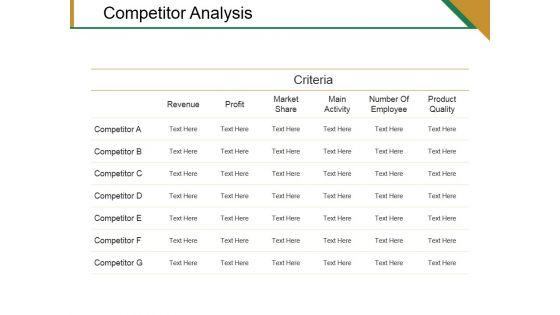
Competitor Analysis Ppt PowerPoint Presentation Pictures Designs Download
This is a competitor analysis ppt powerpoint presentation pictures designs download. This is a six stage process. The stages in this process are revenue, profit, market share, main activity, number of employee, product quality.
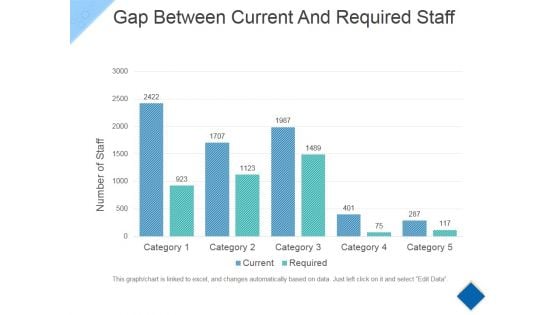
Gap Between Current And Required Staff Ppt PowerPoint Presentation Outline Rules
This is a gap between current and required staff ppt powerpoint presentation outline rules. This is a ten stage process. The stages in this process are current, required, number of staff, category.
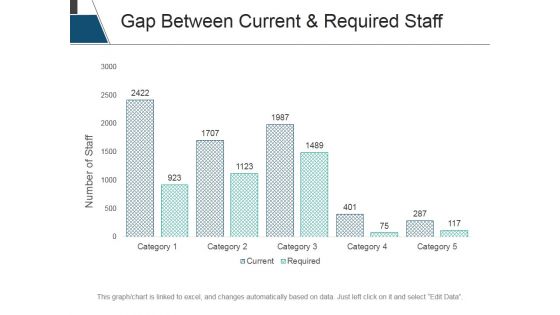
Gap Between Current And Required Staff Ppt PowerPoint Presentation File Tips
This is a gap between current and required staff ppt powerpoint presentation file tips. This is a five stage process. The stages in this process are number of staff, bar graph, business, marketing, success.
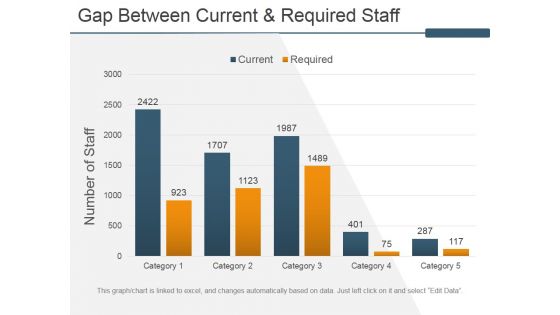
Gap Between Current And Required Staff Ppt PowerPoint Presentation Inspiration Slides
This is a gap between current and required staff ppt powerpoint presentation inspiration slides. This is a five stage process. The stages in this process are number of staff, bar graph, business, marketing, success.
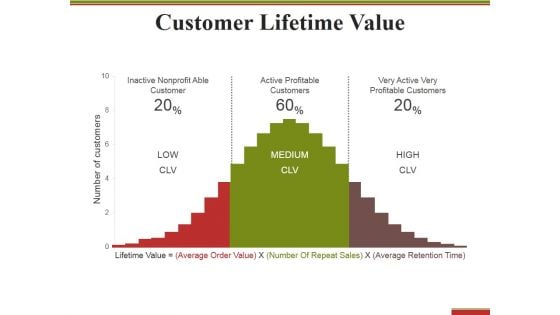
Customer Lifetime Value Ppt PowerPoint Presentation Styles Picture
This is a customer lifetime value ppt powerpoint presentation styles picture. This is a three stage process. The stages in this process are number of customers, low clv, medium clv, high clv.

Top Marketing Campaigns Ppt PowerPoint Presentation Infographics Ideas
This is a top marketing campaigns ppt powerpoint presentation infographics ideas. This is a four stage process. The stages in this process are campaign, daily budget, daily budget, max pub cost, number of days at or above budget.

Campaigns Done Ppt PowerPoint Presentation Outline Clipart
This is a campaigns done ppt powerpoint presentation outline clipart. This is a five stage process. The stages in this process are campaign, daily budget, number of days at or above budget.
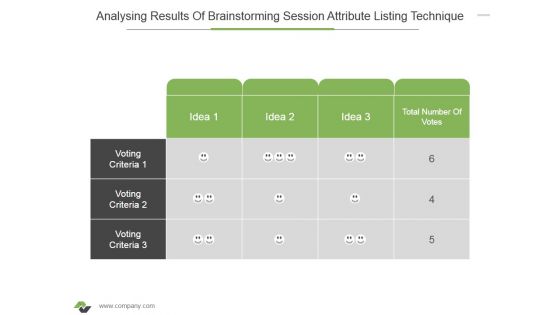
Analysing Results Of Brainstorming Session Attribute Listing Technique Ppt PowerPoint Presentation Gallery Format
This is a analysing results of brainstorming session attribute listing technique ppt powerpoint presentation gallery format. This is a three stage process. The stages in this process are idea, total number of votes, voting criteria, table, compare.
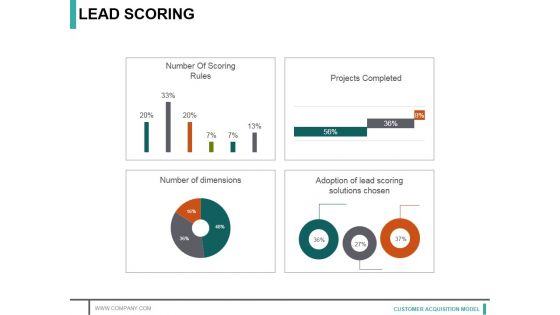
Lead Scoring Template 2 Ppt PowerPoint Presentation Infographic Template Graphics Template
This is a lead scoring template 2 ppt powerpoint presentation infographic template graphics template. This is a four stage process. The stages in this process are number of scoring rules, projects completed, adoption of lead scoring solutions chosen.
Content Marketing Performance Template 1 Ppt PowerPoint Presentation Icon Skills
This is a content marketing performance template 1 ppt powerpoint presentation icon skills. This is a eight stage process. The stages in this process are conversion rate, website traffic, number of leads, sales revenue, quality of leads.
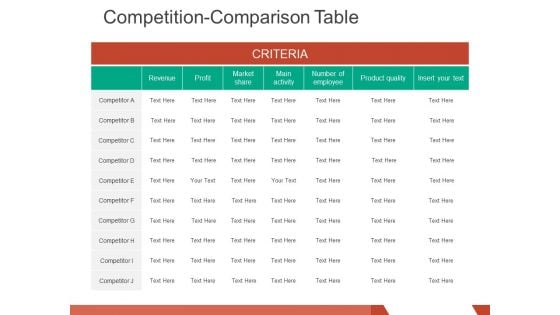
competition comparison table ppt powerpoint presentation infographics design inspiration
This is a competition comparison table ppt powerpoint presentation infographics design inspiration. This is a seven stage process. The stages in this process are revenue, profit, market share, main activity, number of employee.
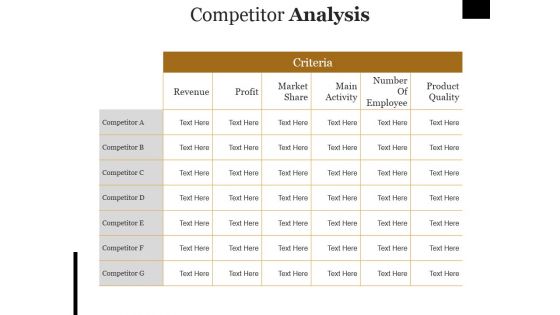
Competitor Analysis Ppt PowerPoint Presentation Outline Rules
This is a competitor analysis ppt powerpoint presentation outline rules. This is a seven stage process. The stages in this process are revenue, profit, market share, main activity, number of employee.
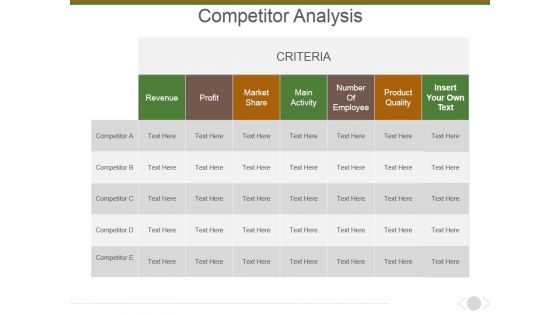
Competitor Analysis Ppt PowerPoint Presentation Layouts Background Image
This is a competitor analysis ppt powerpoint presentation layouts background image. This is a five stage process. The stages in this process are profit, revenue, market share, main activity, number of employee, product quality.
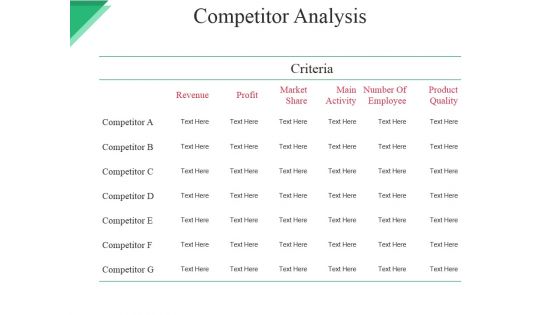
Competitor Analysis Ppt PowerPoint Presentation Show Infographics
This is a competitor analysis ppt powerpoint presentation show infographics. This is a seven stage process. The stages in this process are revenue, profit, market, share, main activity, number of employee.
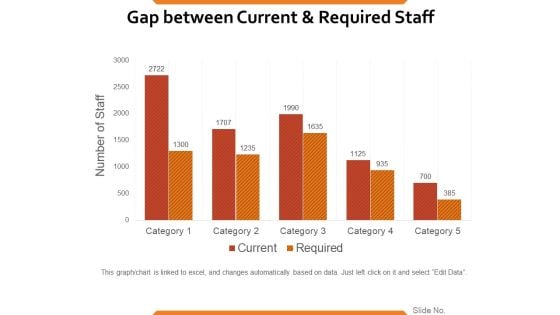
Gap Between Current And Required Staff Ppt PowerPoint Presentation Ideas Format Ideas
This is a gap between current and required staff ppt powerpoint presentation ideas format ideas. This is a five stage process. The stages in this process are number of staff, category, current, graph, finance.
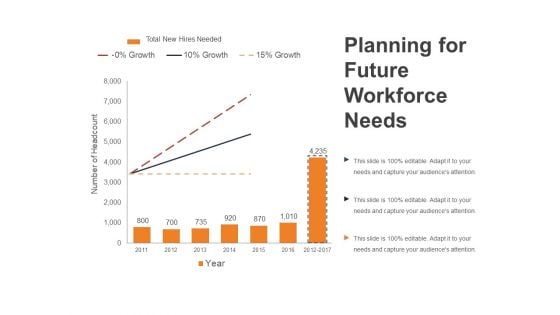
Planning For Future Workforce Needs Ppt PowerPoint Presentation Outline Smartart
This is a planning for future workforce needs ppt powerpoint presentation outline smartart. This is a three stage process. The stages in this process are growth, percentage, number of headcount, year, finance.
Competitor Analysis Ppt PowerPoint Presentation Ideas Icons
This is a competitor analysis ppt powerpoint presentation ideas icons. This is a seven stage process. The stages in this process are revenue, profit, market share, main activity, number of employee.
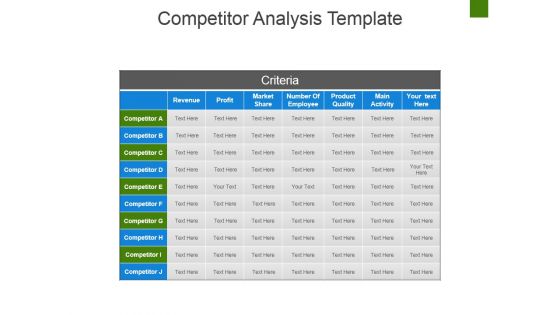
Competitor Analysis Template Ppt PowerPoint Presentation Pictures Diagrams
This is a competitor analysis template ppt powerpoint presentation pictures diagrams. This is a seven stage process. The stages in this process are revenue, profit, market share, number of employee, product quality, main activity.


 Continue with Email

 Home
Home


