Numbered List
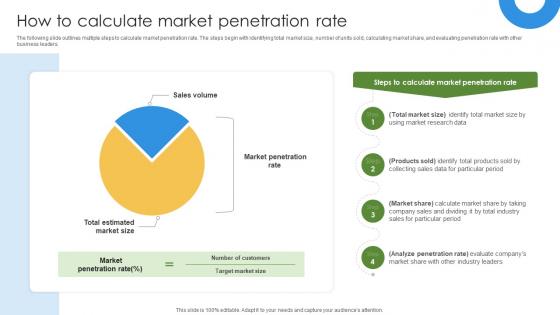
Marketing Growth Strategy How To Calculate Market Penetration Rate Strategy SS V
The following slide outlines multiple steps to calculate market penetration rate. The steps begin with identifying total market size, number of units sold, calculating market share, and evaluating penetration rate with other business leaders. If you are looking for a format to display your unique thoughts, then the professionally designed Marketing Growth Strategy How To Calculate Market Penetration Rate Strategy SS V is the one for you. You can use it as a Google Slides template or a PowerPoint template. Incorporate impressive visuals, symbols, images, and other charts. Modify or reorganize the text boxes as you desire. Experiment with shade schemes and font pairings. Alter, share or cooperate with other people on your work. Download Marketing Growth Strategy How To Calculate Market Penetration Rate Strategy SS V and find out how to give a successful presentation. Present a perfect display to your team and make your presentation unforgettable. The following slide outlines multiple steps to calculate market penetration rate. The steps begin with identifying total market size, number of units sold, calculating market share, and evaluating penetration rate with other business leaders.
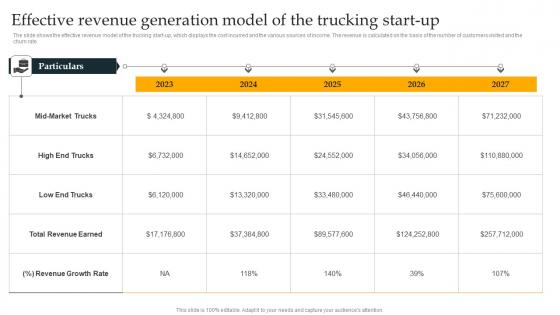
Effective Revenue Generation Model Of The Freight Trucking Business Plan Clipart Pdf
The slide shows the effective revenue model of the trucking start up, which displays the cost incurred and the various sources of income. The revenue is calculated on the basis of the number of customers visited and the churn rate.Whether you have daily or monthly meetings, a brilliant presentation is necessary. Effective Revenue Generation Model Of The Freight Trucking Business Plan Clipart Pdf can be your best option for delivering a presentation. Represent everything in detail using Effective Revenue Generation Model Of The Freight Trucking Business Plan Clipart Pdf and make yourself stand out in meetings. The template is versatile and follows a structure that will cater to your requirements. All the templates prepared by Slidegeeks are easy to download and edit. Our research experts have taken care of the corporate themes as well. So, give it a try and see the results. The slide shows the effective revenue model of the trucking start up, which displays the cost incurred and the various sources of income. The revenue is calculated on the basis of the number of customers visited and the churn rate.
Optimizing Marketing Analytics To Enhance Organizational Growth Tracking Spam Complaint Rate To Avoid Account Template PDF
This slide covers an overview of the spam rate to identify the number of recipients who mark messages as spam in their inboxes. It also includes strategies to reduce spam, such as sending emails only to those who have opted to receive them, segmenting your email list, etc. Are you searching for a Optimizing Marketing Analytics To Enhance Organizational Growth Tracking Spam Complaint Rate To Avoid Account Template PDF that is uncluttered, straightforward, and original Its easy to edit, and you can change the colors to suit your personal or business branding. For a presentation that expresses how much effort you have put in, this template is ideal With all of its features, including tables, diagrams, statistics, and lists, its perfect for a business plan presentation. Make your ideas more appealing with these professional slides. Download Optimizing Marketing Analytics To Enhance Organizational Growth Tracking Spam Complaint Rate To Avoid Account Template PDF from Slidegeeks today.
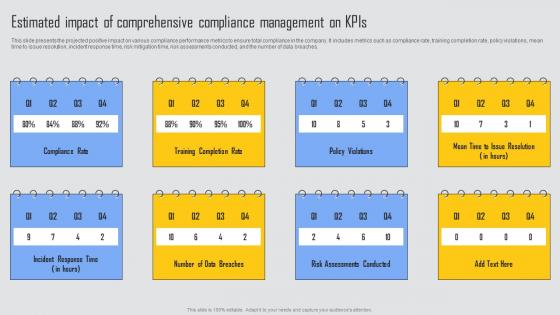
Estimated Impact Of Comprehensive Managing Risks And Establishing Trust Through Efficient Slides Pdf
This slide presents the projected positive impact on various compliance performance metrics to ensure total compliance in the company. It includes metrics such as compliance rate, training completion rate, policy violations, mean time to issue resolution, incident response time, risk mitigation time, risk assessments conducted, and the number of data breaches. From laying roadmaps to briefing everything in detail, our templates are perfect for you. You can set the stage with your presentation slides. All you have to do is download these easy to edit and customizable templates. Estimated Impact Of Comprehensive Managing Risks And Establishing Trust Through Efficient Slides Pdf will help you deliver an outstanding performance that everyone would remember and praise you for. Do download this presentation today. This slide presents the projected positive impact on various compliance performance metrics to ensure total compliance in the company. It includes metrics such as compliance rate, training completion rate, policy violations, mean time to issue resolution, incident response time, risk mitigation time, risk assessments conducted, and the number of data breaches.
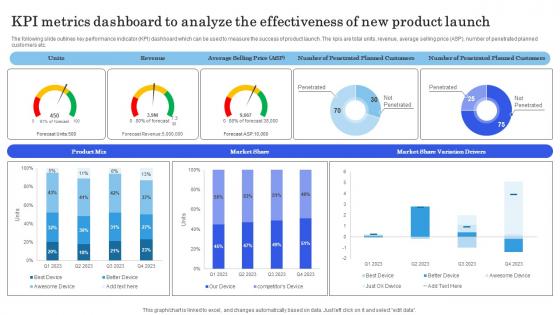
Launching New Commodity Kpi Metrics Dashboard To Analyze The Effectiveness Demonstration Pdf
The following slide outlines key performance indicator KPI dashboard which can be used to measure the success of product launch. The kpis are total units, revenue, average selling price ASP, number of penetrated planned customers etc. Explore a selection of the finest Launching New Commodity Kpi Metrics Dashboard To Analyze The Effectiveness Demonstration Pdf here. With a plethora of professionally designed and pre-made slide templates, you can quickly and easily find the right one for your upcoming presentation. You can use our Launching New Commodity Kpi Metrics Dashboard To Analyze The Effectiveness Demonstration Pdf to effectively convey your message to a wider audience. Slidegeeks has done a lot of research before preparing these presentation templates. The content can be personalized and the slides are highly editable. Grab templates today from Slidegeeks. The following slide outlines key performance indicator KPI dashboard which can be used to measure the success of product launch. The kpis are total units, revenue, average selling price ASP, number of penetrated planned customers etc.
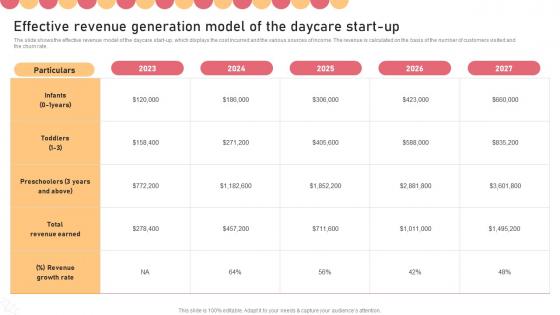
Effective Revenue Generation Model Of The Daycare Childcare Business Plan Rules Pdf
The slide shows the effective revenue model of the daycare start-up, which displays the cost incurred and the various sources of income. The revenue is calculated on the basis of the number of customers visited and the churn rate. If you are looking for a format to display your unique thoughts, then the professionally designed Effective Revenue Generation Model Of The Daycare Childcare Business Plan Rules Pdf is the one for you. You can use it as a Google Slides template or a PowerPoint template. Incorporate impressive visuals, symbols, images, and other charts. Modify or reorganize the text boxes as you desire. Experiment with shade schemes and font pairings. Alter, share or cooperate with other people on your work. Download Effective Revenue Generation Model Of The Daycare Childcare Business Plan Rules Pdf and find out how to give a successful presentation. Present a perfect display to your team and make your presentation unforgettable. The slide shows the effective revenue model of the daycare start-up, which displays the cost incurred and the various sources of income. The revenue is calculated on the basis of the number of customers visited and the churn rate.
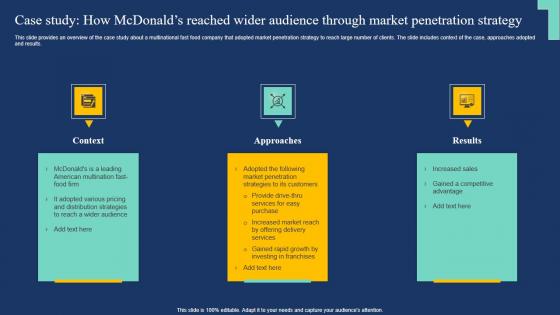
Case Study How Mcdonalds Reached Wider Market Expansion Tactic Themes Pdf
This slide provides an overview of the case study about a multinational fast food company that adopted market penetration strategy to reach large number of clients. The slide includes context of the case, approaches adopted and results. Slidegeeks is here to make your presentations a breeze with Case Study How Mcdonalds Reached Wider Market Expansion Tactic Themes Pdf With our easy-to-use and customizable templates, you can focus on delivering your ideas rather than worrying about formatting. With a variety of designs to choose from, you are sure to find one that suits your needs. And with animations and unique photos, illustrations, and fonts, you can make your presentation pop. So whether you are giving a sales pitch or presenting to the board, make sure to check out Slidegeeks first This slide provides an overview of the case study about a multinational fast food company that adopted market penetration strategy to reach large number of clients. The slide includes context of the case, approaches adopted and results.
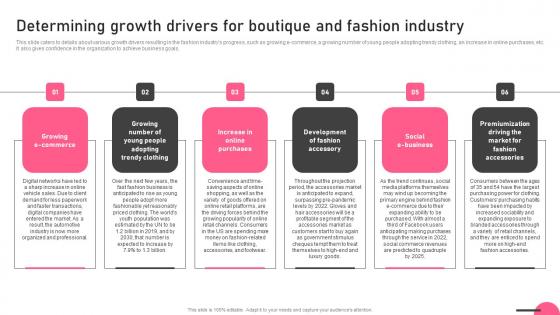
Determining Growth Drivers For Boutique And Fashion Industry Boutique Business Ideas Pdf
This slide caters to details about various growth drivers resulting in the fashion industrys progress, such as growing e-commerce, a growing number of young people adopting trendy clothing, an increase in online purchases, etc. It also gives confidence in the organization to achieve business goals. Present like a pro with Determining Growth Drivers For Boutique And Fashion Industry Boutique Business Ideas Pdf Create beautiful presentations together with your team, using our easy-to-use presentation slides. Share your ideas in real-time and make changes on the fly by downloading our templates. So whether you are in the office, on the go, or in a remote location, you can stay in sync with your team and present your ideas with confidence. With Slidegeeks presentation got a whole lot easier. Grab these presentations today. This slide caters to details about various growth drivers resulting in the fashion industrys progress, such as growing e-commerce, a growing number of young people adopting trendy clothing, an increase in online purchases, etc. It also gives confidence in the organization to achieve business goals.
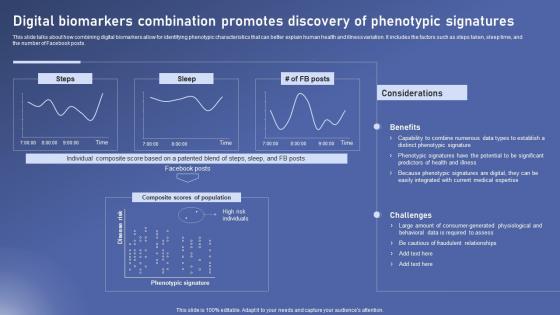
Digital Biomarkers Combination Biomedical Data Science And Health Informatics Summary Pdf
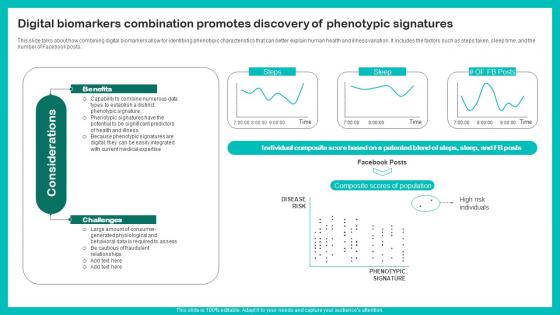
This slide talks about how combining digital biomarkers allow for identifying phenotypic characteristics that can better explain human health and illness variation. It includes the factors such as steps taken, sleep time, and the number of Facebook posts. This modern and well arranged Digital Biomarkers Combination Biomedical Data Science And Health Informatics Summary Pdf provides lots of creative possibilities. It is very simple to customize and edit with the Powerpoint Software. Just drag and drop your pictures into the shapes. All facets of this template can be edited with Powerpoint, no extra software is necessary. Add your own material, put your images in the places assigned for them, adjust the colors, and then you can show your slides to the world, with an animated slide included. This slide talks about how combining digital biomarkers allow for identifying phenotypic characteristics that can better explain human health and illness variation. It includes the factors such as steps taken, sleep time, and the number of Facebook posts.
Digital Biomarkers Combination Digital Biomarkers For Personalized Health Insights Microsoft Pdf
This slide talks about how combining digital biomarkers allow for identifying phenotypic characteristics that can better explain human health and illness variation. It includes the factors such as steps taken, sleep time, and the number of Facebook posts. Do you have to make sure that everyone on your team knows about any specific topic I yes, then you should give Digital Biomarkers Combination Digital Biomarkers For Personalized Health Insights Microsoft Pdf a try. Our experts have put a lot of knowledge and effort into creating this impeccable Digital Biomarkers Combination Digital Biomarkers For Personalized Health Insights Microsoft Pdf. You can use this template for your upcoming presentations, as the slides are perfect to represent even the tiniest detail. You can download these templates from the Slidegeeks website and these are easy to edit. So grab these today This slide talks about how combining digital biomarkers allow for identifying phenotypic characteristics that can better explain human health and illness variation. It includes the factors such as steps taken, sleep time, and the number of Facebook posts.
Social Media Customer Service Instant Messenger For Internal Business Operations Diagrams Pdf
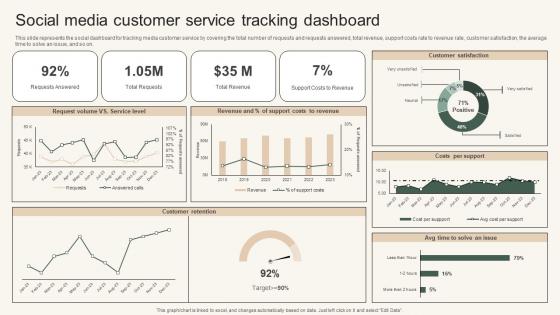
This slide represents the social dashboard for tracking media customer service by covering the total number of requests and requests answered, total revenue, support costs rate to revenue rate, customer satisfaction, the average time to solve an issue, and so on. Whether you have daily or monthly meetings, a brilliant presentation is necessary. Social Media Customer Service Instant Messenger For Internal Business Operations Diagrams Pdf can be your best option for delivering a presentation. Represent everything in detail using Social Media Customer Service Instant Messenger For Internal Business Operations Diagrams Pdf and make yourself stand out in meetings. The template is versatile and follows a structure that will cater to your requirements. All the templates prepared by Slidegeeks are easy to download and edit. Our research experts have taken care of the corporate themes as well. So, give it a try and see the results. This slide represents the social dashboard for tracking media customer service by covering the total number of requests and requests answered, total revenue, support costs rate to revenue rate, customer satisfaction, the average time to solve an issue, and so on.
Decentralized Cryptocurrency Exchanges Complete Roadmap To Blockchain BCT SS V
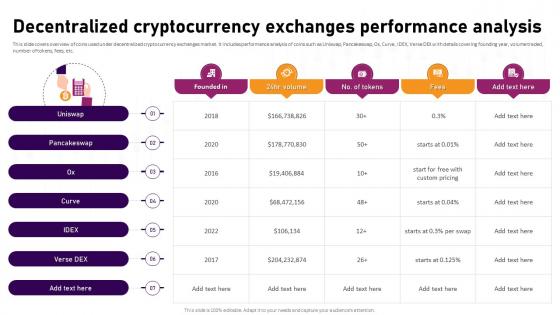
This slide covers overview of coins used under decentralized cryptocurrency exchanges market. It includes performance analysis of coins such as Uniswap, Pancakeswap, Ox, Curve, IDEX, Verse DEX with details covering founding year, volume traded, number of tokens, fees, etc. Coming up with a presentation necessitates that the majority of the effort goes into the content and the message you intend to convey. The visuals of a PowerPoint presentation can only be effective if it supplements and supports the story that is being told. Keeping this in mind our experts created Decentralized Cryptocurrency Exchanges Complete Roadmap To Blockchain BCT SS V to reduce the time that goes into designing the presentation. This way, you can concentrate on the message while our designers take care of providing you with the right template for the situation. This slide covers overview of coins used under decentralized cryptocurrency exchanges market. It includes performance analysis of coins such as Uniswap, Pancakeswap, Ox, Curve, IDEX, Verse DEX with details covering founding year, volume traded, number of tokens, fees, etc.
Candle Business Venture Effective Revenue Generation Model For Candle Start Up BP SS V
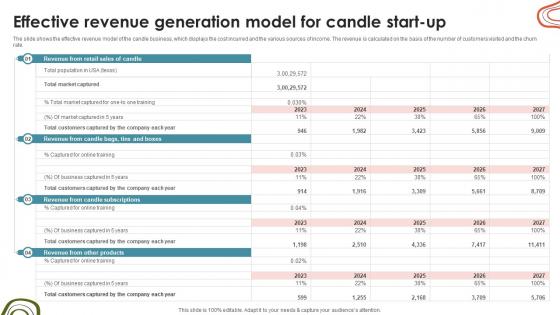
The slide shows the effective revenue model of the candle business, which displays the cost incurred and the various sources of income. The revenue is calculated on the basis of the number of customers visited and the churn rate. Find highly impressive Candle Business Venture Effective Revenue Generation Model For Candle Start Up BP SS V on Slidegeeks to deliver a meaningful presentation. You can save an ample amount of time using these presentation templates. No need to worry to prepare everything from scratch because Slidegeeks experts have already done a huge research and work for you. You need to download Candle Business Venture Effective Revenue Generation Model For Candle Start Up BP SS V for your upcoming presentation. All the presentation templates are 100 percent editable and you can change the color and personalize the content accordingly. Download now The slide shows the effective revenue model of the candle business, which displays the cost incurred and the various sources of income. The revenue is calculated on the basis of the number of customers visited and the churn rate.
Checklist For Data Collection Executing Competitors Strategies To Assess Organizational Performance Icons Pdf
The following slide showcases various information to be gathered for understanding rivalry business and perform competitor analysis. It showcases components such as employee count, founding year, investors, number of customers, merger and acquisitions, market share and business strength and weakness. Coming up with a presentation necessitates that the majority of the effort goes into the content and the message you intend to convey. The visuals of a PowerPoint presentation can only be effective if it supplements and supports the story that is being told. Keeping this in mind our experts created Checklist For Data Collection Executing Competitors Strategies To Assess Organizational Performance Icons Pdf to reduce the time that goes into designing the presentation. This way, you can concentrate on the message while our designers take care of providing you with the right template for the situation. The following slide showcases various information to be gathered for understanding rivalry business and perform competitor analysis. It showcases components such as employee count, founding year, investors, number of customers, merger and acquisitions, market share and business strength and weakness.
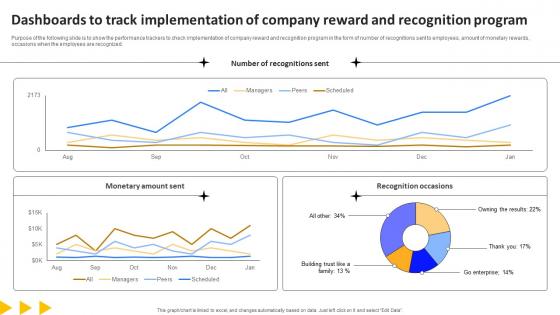
Workforce Productivity Improvement Dashboards To Track Implementation Of Company Elements Pdf
Purpose of the following slide is to show the performance trackers to check implementation of company reward and recognition program in the form of number of recognitions sent to employees, amount of monetary rewards, occasions when the employees are recognized. This Workforce Productivity Improvement Dashboards To Track Implementation Of Company Elements Pdf is perfect for any presentation, be it in front of clients or colleagues. It is a versatile and stylish solution for organizing your meetings. The Workforce Productivity Improvement Dashboards To Track Implementation Of Company Elements Pdf features a modern design for your presentation meetings. The adjustable and customizable slides provide unlimited possibilities for acing up your presentation. Slidegeeks has done all the homework before launching the product for you. So, do not wait, grab the presentation templates today Purpose of the following slide is to show the performance trackers to check implementation of company reward and recognition program in the form of number of recognitions sent to employees, amount of monetary rewards, occasions when the employees are recognized.
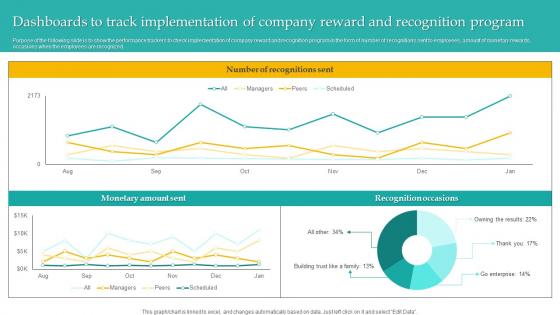
Dashboards Track Implementation Administering Diversity And Inclusion At Workplace Designs Pdf
Purpose of the following slide is to show the performance trackers to check implementation of company reward and recognition program in the form of number of recognitions sent to employees, amount of monetary rewards, occasions when the employees are recognized. Do you have an important presentation coming up Are you looking for something that will make your presentation stand out from the rest Look no further than Dashboards Track Implementation Administering Diversity And Inclusion At Workplace Designs Pdf. With our professional designs, you can trust that your presentation will pop and make delivering it a smooth process. And with Slidegeeks, you can trust that your presentation will be unique and memorable. So why wait Grab Dashboards Track Implementation Administering Diversity And Inclusion At Workplace Designs Pdf today and make your presentation stand out from the rest Purpose of the following slide is to show the performance trackers to check implementation of company reward and recognition program in the form of number of recognitions sent to employees, amount of monetary rewards, occasions when the employees are recognized.
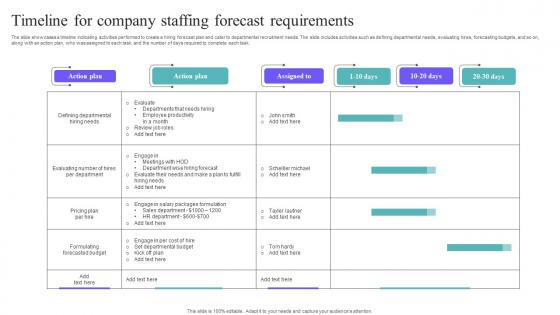
Timeline For Company Staffing Forecast Requirements Elements Pdf
The slide showcases a timeline indicating activities performed to create a hiring forecast plan and cater to departmental recruitment needs. The slide includes activities such as defining departmental needs, evaluating hires, forecasting budgets, and so on, along with an action plan, who was assigned to each task, and the number of days required to complete each task. Pitch your topic with ease and precision using this Timeline For Company Staffing Forecast Requirements Elements Pdf. This layout presents information on Departments Needs Hiring, Employee Productivity Month, Review Job Roles. It is also available for immediate download and adjustment. So, changes can be made in the color, design, graphics or any other component to create a unique layout. The slide showcases a timeline indicating activities performed to create a hiring forecast plan and cater to departmental recruitment needs. The slide includes activities such as defining departmental needs, evaluating hires, forecasting budgets, and so on, along with an action plan, who was assigned to each task, and the number of days required to complete each task.
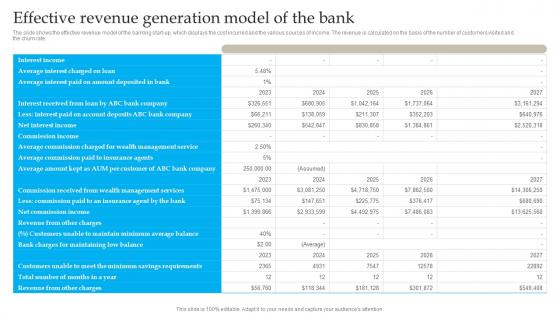
Effective Revenue Generation Model Banking Industry Business Plan Go To Market Strategy Clipart Pdf
The slide shows the effective revenue model of the banking start up, which displays the cost incurred and the various sources of income. The revenue is calculated on the basis of the number of customers visited and the churn rate. Are you in need of a template that can accommodate all of your creative concepts This one is crafted professionally and can be altered to fit any style. Use it with Google Slides or PowerPoint. Include striking photographs, symbols, depictions, and other visuals. Fill, move around, or remove text boxes as desired. Test out color palettes and font mixtures. Edit and save your work, or work with colleagues. Download Effective Revenue Generation Model Banking Industry Business Plan Go To Market Strategy Clipart Pdf and observe how to make your presentation outstanding. Give an impeccable presentation to your group and make your presentation unforgettable. The slide shows the effective revenue model of the banking start up, which displays the cost incurred and the various sources of income. The revenue is calculated on the basis of the number of customers visited and the churn rate.
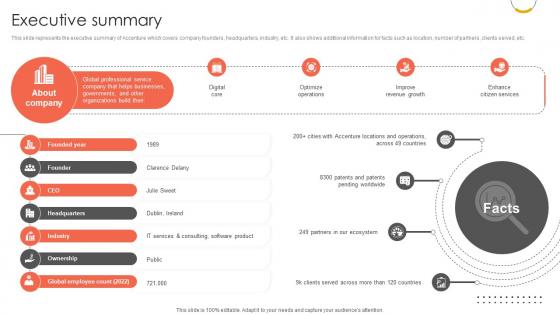
Executive Summary Professional Services And Technology Consulting Ppt Presentation CP SS V
This slide represents the executive summary of Accenture which covers company founders, headquarters, industry, etc. It also shows additional information for facts such as location, number of partners, clients served, etc. Here you can discover an assortment of the finest PowerPoint and Google Slides templates. With these templates, you can create presentations for a variety of purposes while simultaneously providing your audience with an eye-catching visual experience. Download Executive Summary Professional Services And Technology Consulting Ppt Presentation CP SS V to deliver an impeccable presentation. These templates will make your job of preparing presentations much quicker, yet still, maintain a high level of quality. Slidegeeks has experienced researchers who prepare these templates and write high-quality content for you. Later on, you can personalize the content by editing the Executive Summary Professional Services And Technology Consulting Ppt Presentation CP SS V. This slide represents the executive summary of Accenture which covers company founders, headquarters, industry, etc. It also shows additional information for facts such as location, number of partners, clients served, etc.
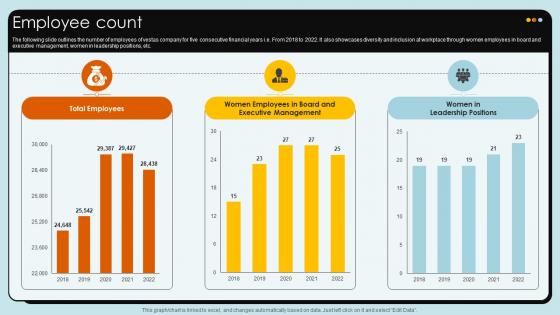
Employee Count Wind Turbines Manufacturer Company Profile CP SS V
The following slide outlines the number of employees of vestas company for five consecutive financial years i.e. From 2018 to 2022. It also showcases diversity and inclusion at workplace through women employees in board and executive management, women in leadership positions, etc.Present like a pro with Employee Count Wind Turbines Manufacturer Company Profile CP SS V. Create beautiful presentations together with your team, using our easy-to-use presentation slides. Share your ideas in real-time and make changes on the fly by downloading our templates. So whether you are in the office, on the go, or in a remote location, you can stay in sync with your team and present your ideas with confidence. With Slidegeeks presentation got a whole lot easier. Grab these presentations today. The following slide outlines the number of employees of vestas company for five consecutive financial years i.e. From 2018 to 2022. It also showcases diversity and inclusion at workplace through women employees in board and executive management, women in leadership positions, etc.
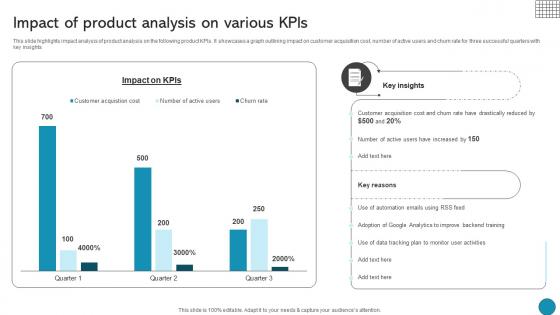
Impact Of Product Analysis On Various Kpis Driving Business Success Integrating Product
This slide highlights impact analysis of product analysis on the following product KPIs. It showcases a graph outlining impact on customer acquisition cost, number of active users and churn rate for three successful quarters with key insights Retrieve professionally designed Impact Of Product Analysis On Various Kpis Driving Business Success Integrating Product to effectively convey your message and captivate your listeners. Save time by selecting pre-made slideshows that are appropriate for various topics, from business to educational purposes. These themes come in many different styles, from creative to corporate, and all of them are easily adjustable and can be edited quickly. Access them as PowerPoint templates or as Google Slides themes. You do not have to go on a hunt for the perfect presentation because Slidegeeks got you covered from everywhere. This slide highlights impact analysis of product analysis on the following product KPIs. It showcases a graph outlining impact on customer acquisition cost, number of active users and churn rate for three successful quarters with key insights
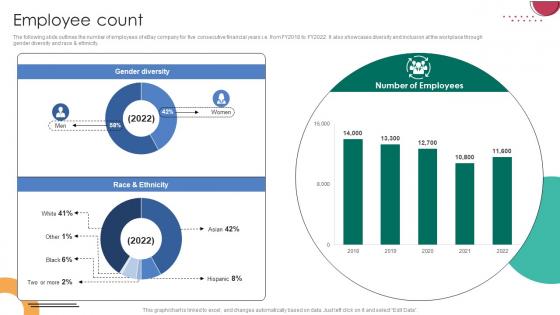
Employee Count C2C Ecommerce Platform Company Profile CP SS V
The following slide outlines the number of employees of eBay company for five consecutive financial years i.e. from FY2018 to FY2022. It also showcases diversity and inclusion at the workplace through gender diversity and race and ethnicity.Do you have an important presentation coming up Are you looking for something that will make your presentation stand out from the rest Look no further than Employee Count C2C Ecommerce Platform Company Profile CP SS V. With our professional designs, you can trust that your presentation will pop and make delivering it a smooth process. And with Slidegeeks, you can trust that your presentation will be unique and memorable. So why wait Grab Employee Count C2C Ecommerce Platform Company Profile CP SS V today and make your presentation stand out from the rest The following slide outlines the number of employees of eBay company for five consecutive financial years i.e. from FY2018 to FY2022. It also showcases diversity and inclusion at the workplace through gender diversity and race and ethnicity.
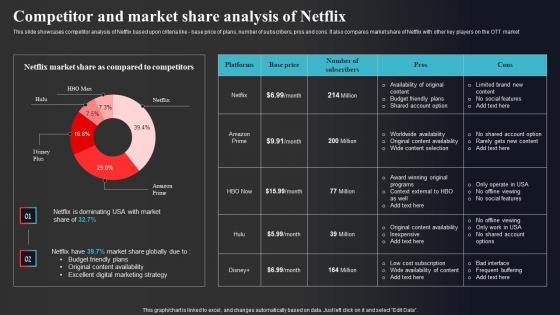
Competitor And Market Share Analysis Of Netflix Enhancing Online Visibility Template Pdf
This slide showcases competitor analysis of Netflix based upon criteria like - base price of plans, number of subscribers, pros and cons. It also compares market share of Netflix with other key players on the OTT market Explore a selection of the finest Competitor And Market Share Analysis Of Netflix Enhancing Online Visibility Template Pdf here. With a plethora of professionally designed and pre-made slide templates, you can quickly and easily find the right one for your upcoming presentation. You can use our Competitor And Market Share Analysis Of Netflix Enhancing Online Visibility Template Pdf to effectively convey your message to a wider audience. Slidegeeks has done a lot of research before preparing these presentation templates. The content can be personalized and the slides are highly editable. Grab templates today from Slidegeeks. This slide showcases competitor analysis of Netflix based upon criteria like - base price of plans, number of subscribers, pros and cons. It also compares market share of Netflix with other key players on the OTT market
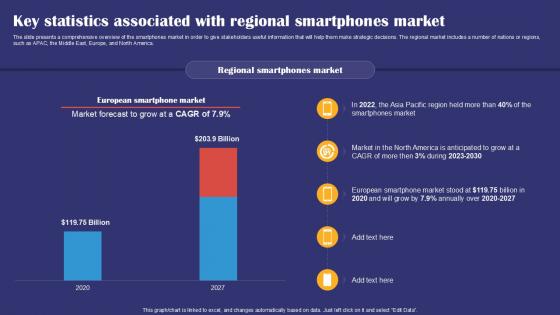
Key Statistics Associated With Regional Smartphones Market Smartphones Industry Report PPT Template IR SS V
The slide presents a comprehensive overview of the smartphones market in order to give stakeholders useful information that will help them make strategic decisions. The regional market includes a number of nations or regions, such as APAC, the Middle East, Europe, and North America. Welcome to our selection of the Key Statistics Associated With Regional Smartphones Market Smartphones Industry Report PPT Template IR SS V. These are designed to help you showcase your creativity and bring your sphere to life. Planning and Innovation are essential for any business that is just starting out. This collection contains the designs that you need for your everyday presentations. All of our PowerPoints are 100Percent editable, so you can customize them to suit your needs. This multi purpose template can be used in various situations. Grab these presentation templates today. The slide presents a comprehensive overview of the smartphones market in order to give stakeholders useful information that will help them make strategic decisions. The regional market includes a number of nations or regions, such as APAC, the Middle East, Europe, and North America.
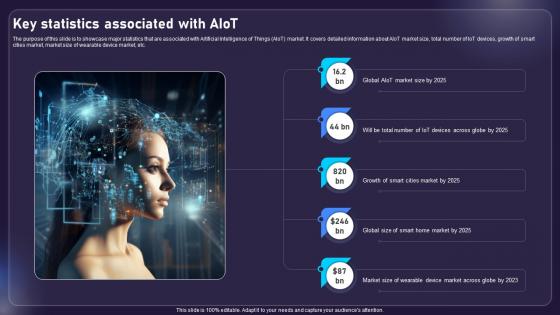
Key Statistics Associated With AIOT AIOT Applications For Various Industries IoT SS V
The purpose of this slide is to showcase major statistics that are associated with Artificial Intelligence of Things AIoT market. It covers detailed information about AIoT market size, total number of IoT devices, growth of smart cities market, market size of wearable device market, etc. Retrieve professionally designed Key Statistics Associated With AIOT AIOT Applications For Various Industries IoT SS V to effectively convey your message and captivate your listeners. Save time by selecting pre-made slideshows that are appropriate for various topics, from business to educational purposes. These themes come in many different styles, from creative to corporate, and all of them are easily adjustable and can be edited quickly. Access them as PowerPoint templates or as Google Slides themes. You do not have to go on a hunt for the perfect presentation because Slidegeeks got you covered from everywhere. The purpose of this slide is to showcase major statistics that are associated with Artificial Intelligence of Things AIoT market. It covers detailed information about AIoT market size, total number of IoT devices, growth of smart cities market, market size of wearable device market, etc.
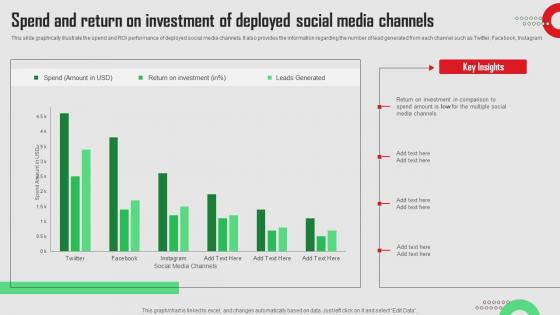
Spend And Return On Investment Of Deployed Social Media Platforms Performance Ideas Pdf
This slide graphically illustrate the spend and ROI performance of deployed social media channels. It also provides the information regarding the number of lead generated from each channel such as Twitter, Facebook, Instagram.If you are looking for a format to display your unique thoughts, then the professionally designed Spend And Return On Investment Of Deployed Social Media Platforms Performance Ideas Pdf is the one for you. You can use it as a Google Slides template or a PowerPoint template. Incorporate impressive visuals, symbols, images, and other charts. Modify or reorganize the text boxes as you desire. Experiment with shade schemes and font pairings. Alter, share or cooperate with other people on your work. Download Spend And Return On Investment Of Deployed Social Media Platforms Performance Ideas Pdf and find out how to give a successful presentation. Present a perfect display to your team and make your presentation unforgettable. This slide graphically illustrate the spend and ROI performance of deployed social media channels. It also provides the information regarding the number of lead generated from each channel such as Twitter, Facebook, Instagram.
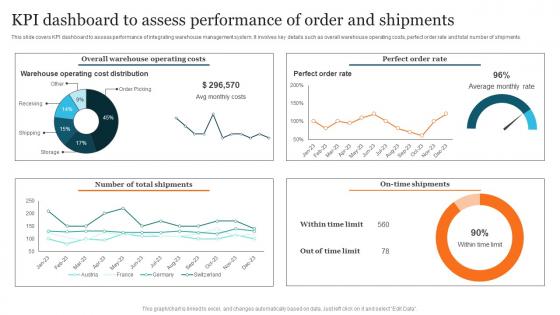
KPI Dashboard Assess Performance Advanced Supply Chain Improvement Strategies Brochure Pdf
This slide covers KPI dashboard to assess performance of integrating warehouse management system. It involves key details such as overall warehouse operating costs, perfect order rate and total number of shipments. If you are looking for a format to display your unique thoughts, then the professionally designed KPI Dashboard Assess Performance Advanced Supply Chain Improvement Strategies Brochure Pdf is the one for you. You can use it as a Google Slides template or a PowerPoint template. Incorporate impressive visuals, symbols, images, and other charts. Modify or reorganize the text boxes as you desire. Experiment with shade schemes and font pairings. Alter, share or cooperate with other people on your work. Download KPI Dashboard Assess Performance Advanced Supply Chain Improvement Strategies Brochure Pdf and find out how to give a successful presentation. Present a perfect display to your team and make your presentation unforgettable. This slide covers KPI dashboard to assess performance of integrating warehouse management system. It involves key details such as overall warehouse operating costs, perfect order rate and total number of shipments.
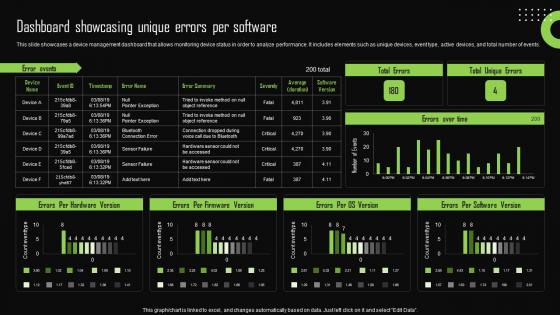
Dashboard Showcasing Unique Errors Per Software Iot Device Management Infographics Pdf
This slide showcases a device management dashboard that allows monitoring device status in order to analyze performance. It includes elements such as unique devices, event type, active devices, and total number of events. If you are looking for a format to display your unique thoughts, then the professionally designed Dashboard Showcasing Unique Errors Per Software Iot Device Management Infographics Pdf is the one for you. You can use it as a Google Slides template or a PowerPoint template. Incorporate impressive visuals, symbols, images, and other charts. Modify or reorganize the text boxes as you desire. Experiment with shade schemes and font pairings. Alter, share or cooperate with other people on your work. Download Dashboard Showcasing Unique Errors Per Software Iot Device Management Infographics Pdf and find out how to give a successful presentation. Present a perfect display to your team and make your presentation unforgettable. This slide showcases a device management dashboard that allows monitoring device status in order to analyze performance. It includes elements such as unique devices, event type, active devices, and total number of events.

IoT Satellite Global Market Size Overview IoT In Orbit Unleashing The Power IoT SS V
This slide showcases information about IoT-based satellite market size worldwide. It also includes growth drivers such as a rise in LEO-based services, increase in satellite networks, and growing number of connected and autonomous vehicles. If you are looking for a format to display your unique thoughts, then the professionally designed IoT Satellite Global Market Size Overview IoT In Orbit Unleashing The Power IoT SS V is the one for you. You can use it as a Google Slides template or a PowerPoint template. Incorporate impressive visuals, symbols, images, and other charts. Modify or reorganize the text boxes as you desire. Experiment with shade schemes and font pairings. Alter, share or cooperate with other people on your work. Download IoT Satellite Global Market Size Overview IoT In Orbit Unleashing The Power IoT SS V and find out how to give a successful presentation. Present a perfect display to your team and make your presentation unforgettable. This slide showcases information about IoT-based satellite market size worldwide. It also includes growth drivers such as a rise in LEO-based services, increase in satellite networks, and growing number of connected and autonomous vehicles.
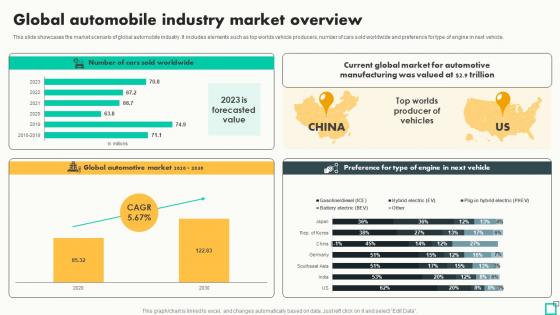
Global Automobile Industry Market Overview Innovative Tactics For Revving Up Strategy SS
This slide showcases the market scenario of global automobile industry. It includes elements such as top worlds vehicle producers, number of cars sold worldwide and preference for type of engine in next vehicle. If you are looking for a format to display your unique thoughts, then the professionally designed Global Automobile Industry Market Overview Innovative Tactics For Revving Up Strategy SS is the one for you. You can use it as a Google Slides template or a PowerPoint template. Incorporate impressive visuals, symbols, images, and other charts. Modify or reorganize the text boxes as you desire. Experiment with shade schemes and font pairings. Alter, share or cooperate with other people on your work. Download Global Automobile Industry Market Overview Innovative Tactics For Revving Up Strategy SS and find out how to give a successful presentation. Present a perfect display to your team and make your presentation unforgettable. This slide showcases the market scenario of global automobile industry. It includes elements such as top worlds vehicle producers, number of cars sold worldwide and preference for type of engine in next vehicle.
Monthly Sales Performance Tracking Sales Performance Enhancement Background Pdf
This slide showcases a dashboard presenting various metrics to measure and analyze sales performance for revenue growth. It includes key components such as number of sales, revenue, profit, cost, sales revenue, sales increment, cost analysis and cross sell. Coming up with a presentation necessitates that the majority of the effort goes into the content and the message you intend to convey. The visuals of a PowerPoint presentation can only be effective if it supplements and supports the story that is being told. Keeping this in mind our experts created Monthly Sales Performance Tracking Sales Performance Enhancement Background Pdf to reduce the time that goes into designing the presentation. This way, you can concentrate on the message while our designers take care of providing you with the right template for the situation. This slide showcases a dashboard presenting various metrics to measure and analyze sales performance for revenue growth. It includes key components such as number of sales, revenue, profit, cost, sales revenue, sales increment, cost analysis and cross sell.
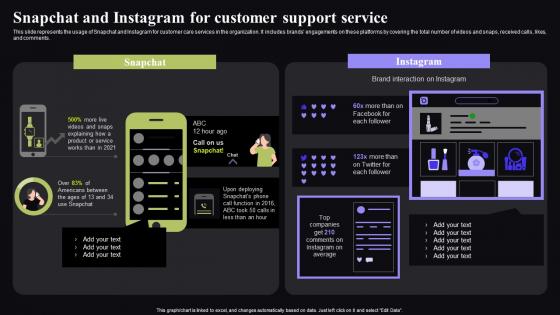
Snapchat And Instagram For Customer Support Video Conferencing In Corporate Graphics Pdf
This slide represents the usage of Snapchat and Instagram for customer care services in the organization. It includes brands engagements on these platforms by covering the total number of videos and snaps, received calls, likes, and comments. Retrieve professionally designed Snapchat And Instagram For Customer Support Video Conferencing In Corporate Graphics Pdf to effectively convey your message and captivate your listeners. Save time by selecting pre-made slideshows that are appropriate for various topics, from business to educational purposes. These themes come in many different styles, from creative to corporate, and all of them are easily adjustable and can be edited quickly. Access them as PowerPoint templates or as Google Slides themes. You do not have to go on a hunt for the perfect presentation because Slidegeeks got you covered from everywhere. This slide represents the usage of Snapchat and Instagram for customer care services in the organization. It includes brands engagements on these platforms by covering the total number of videos and snaps, received calls, likes, and comments.
Social Media Customer Service Tracking Dashboard Video Conferencing In Corporate Elements Pdf
This slide represents the social dashboard for tracking media customer service by covering the total number of requests and requests answered, total revenue, support costs rate to revenue rate, customer satisfaction, the average time to solve an issue, and so on. Presenting this PowerPoint presentation, titled Social Media Customer Service Tracking Dashboard Video Conferencing In Corporate Elements Pdf, with topics curated by our researchers after extensive research. This editable presentation is available for immediate download and provides attractive features when used. Download now and captivate your audience. Presenting this Social Media Customer Service Tracking Dashboard Video Conferencing In Corporate Elements Pdf. Our researchers have carefully researched and created these slides with all aspects taken into consideration. This is a completely customizable Social Media Customer Service Tracking Dashboard Video Conferencing In Corporate Elements Pdf that is available for immediate downloading. Download now and make an impact on your audience. Highlight the attractive features available with our PPTs. This slide represents the social dashboard for tracking media customer service by covering the total number of requests and requests answered, total revenue, support costs rate to revenue rate, customer satisfaction, the average time to solve an issue, and so on.
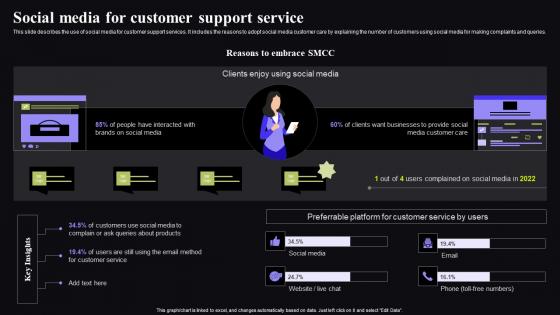
Social Media For Customer Support Service Video Conferencing In Corporate Sample Pdf
This slide describes the use of social media for customer support services. It includes the reasons to adopt social media customer care by explaining the number of customers using social media for making complaints and queries. Here you can discover an assortment of the finest PowerPoint and Google Slides templates. With these templates, you can create presentations for a variety of purposes while simultaneously providing your audience with an eye-catching visual experience. Download Social Media For Customer Support Service Video Conferencing In Corporate Sample Pdf to deliver an impeccable presentation. These templates will make your job of preparing presentations much quicker, yet still, maintain a high level of quality. Slidegeeks has experienced researchers who prepare these templates and write high-quality content for you. Later on, you can personalize the content by editing the Social Media For Customer Support Service Video Conferencing In Corporate Sample Pdf. This slide describes the use of social media for customer support services. It includes the reasons to adopt social media customer care by explaining the number of customers using social media for making complaints and queries.
Workforce Productivity Improvement High Stress Level And Productivity Loss Due To Illness Icons Pdf
Following slide shows that stress level and dissatisfaction is high among employees. Company lost productivity hours due to high number of illness days. Presenting this PowerPoint presentation, titled Workforce Productivity Improvement High Stress Level And Productivity Loss Due To Illness Icons Pdf, with topics curated by our researchers after extensive research. This editable presentation is available for immediate download and provides attractive features when used. Download now and captivate your audience. Presenting this Workforce Productivity Improvement High Stress Level And Productivity Loss Due To Illness Icons Pdf. Our researchers have carefully researched and created these slides with all aspects taken into consideration. This is a completely customizable Workforce Productivity Improvement High Stress Level And Productivity Loss Due To Illness Icons Pdf that is available for immediate downloading. Download now and make an impact on your audience. Highlight the attractive features available with our PPTs. Following slide shows that stress level and dissatisfaction is high among employees. Company lost productivity hours due to high number of illness days.
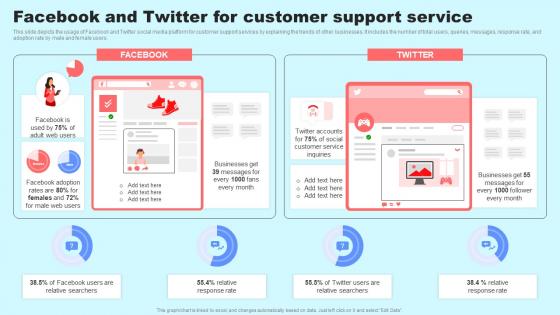
Social Media In Customer Support Facebook And Twitter For Customer Support Service Pictures Pdf
This slide depicts the usage of Facebook and Twitter social media platform for customer support services by explaining the trends of other businesses. It includes the number of total users, queries, messages, response rate, and adoption rate by male and female users. Do you have an important presentation coming up Are you looking for something that will make your presentation stand out from the rest Look no further than Social Media In Customer Support Facebook And Twitter For Customer Support Service Pictures Pdf. With our professional designs, you can trust that your presentation will pop and make delivering it a smooth process. And with Slidegeeks, you can trust that your presentation will be unique and memorable. So why wait Grab Social Media In Customer Support Facebook And Twitter For Customer Support Service Pictures Pdf today and make your presentation stand out from the rest This slide depicts the usage of Facebook and Twitter social media platform for customer support services by explaining the trends of other businesses. It includes the number of total users, queries, messages, response rate, and adoption rate by male and female users.
Social Media In Customer Support Social Media Customer Service Tracking Dashboard Structure Pdf
This slide represents the social dashboard for tracking media customer service by covering the total number of requests and requests answered, total revenue, support costs rate to revenue rate, customer satisfaction, the average time to solve an issue, and so on. This Social Media In Customer Support Social Media Customer Service Tracking Dashboard Structure Pdf from Slidegeeks makes it easy to present information on your topic with precision. It provides customization options, so you can make changes to the colors, design, graphics, or any other component to create a unique layout. It is also available for immediate download, so you can begin using it right away. Slidegeeks has done good research to ensure that you have everything you need to make your presentation stand out. Make a name out there for a brilliant performance. This slide represents the social dashboard for tracking media customer service by covering the total number of requests and requests answered, total revenue, support costs rate to revenue rate, customer satisfaction, the average time to solve an issue, and so on.
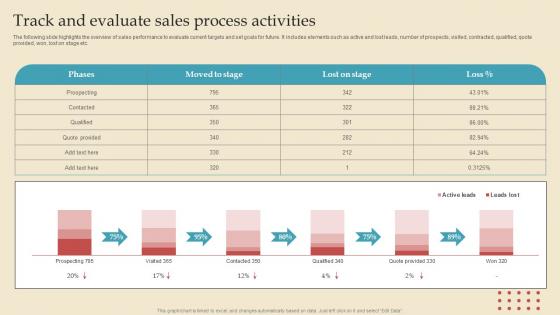
Track And Evaluate Sales Describing Business Performance Administration Goals Information Pdf
The following slide highlights the overview of sales performance to evaluate current targets and set goals for future. It includes elements such as active and lost leads, number of prospects, visited, contracted, qualified, quote provided, won, lost on stage etc. Coming up with a presentation necessitates that the majority of the effort goes into the content and the message you intend to convey. The visuals of a PowerPoint presentation can only be effective if it supplements and supports the story that is being told. Keeping this in mind our experts created Track And Evaluate Sales Describing Business Performance Administration Goals Information Pdf to reduce the time that goes into designing the presentation. This way, you can concentrate on the message while our designers take care of providing you with the right template for the situation. The following slide highlights the overview of sales performance to evaluate current targets and set goals for future. It includes elements such as active and lost leads, number of prospects, visited, contracted, qualified, quote provided, won, lost on stage etc.
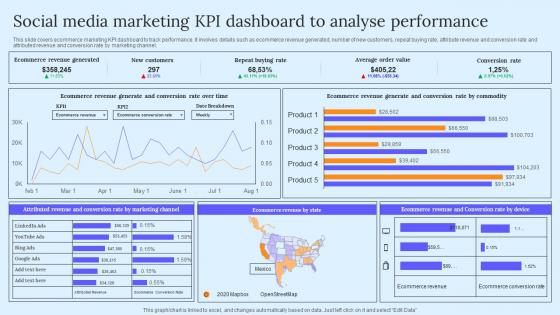
Social Media Marketing KPI Dashboard B2B Marketing Techniques To Attract Potential Pictures Pdf
This slide covers ecommerce marketing KPI dashboard to track performance. It involves details such as ecommerce revenue generated, number of new customers, repeat buying rate, attribute revenue and conversion rate and attributed revenue and conversion rate by marketing channel. Do you have an important presentation coming up Are you looking for something that will make your presentation stand out from the rest Look no further than Social Media Marketing KPI Dashboard B2B Marketing Techniques To Attract Potential Pictures Pdf. With our professional designs, you can trust that your presentation will pop and make delivering it a smooth process. And with Slidegeeks, you can trust that your presentation will be unique and memorable. So why wait Grab Social Media Marketing KPI Dashboard B2B Marketing Techniques To Attract Potential Pictures Pdf today and make your presentation stand out from the rest This slide covers ecommerce marketing KPI dashboard to track performance. It involves details such as ecommerce revenue generated, number of new customers, repeat buying rate, attribute revenue and conversion rate and attributed revenue and conversion rate by marketing channel.
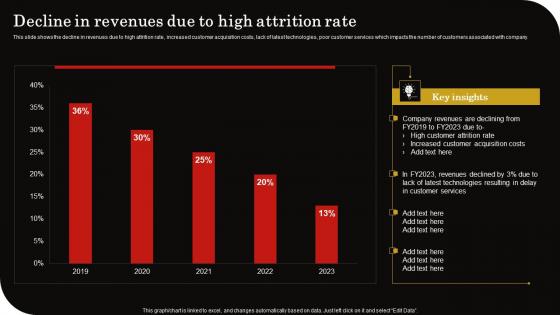
Decline In Revenues Due High Attrition Client Retention Strategy To Reduce Churn Rate Rules Pdf
This slide shows the decline in revenues due to high attrition rate, increased customer acquisition costs, lack of latest technologies, poor customer services which impacts the number of customers associated with company. Are you in need of a template that can accommodate all of your creative concepts This one is crafted professionally and can be altered to fit any style. Use it with Google Slides or PowerPoint. Include striking photographs, symbols, depictions, and other visuals. Fill, move around, or remove text boxes as desired. Test out color palettes and font mixtures. Edit and save your work, or work with colleagues. Download Decline In Revenues Due High Attrition Client Retention Strategy To Reduce Churn Rate Rules Pdf and observe how to make your presentation outstanding. Give an impeccable presentation to your group and make your presentation unforgettable. This slide shows the decline in revenues due to high attrition rate, increased customer acquisition costs, lack of latest technologies, poor customer services which impacts the number of customers associated with company.
Facebook And Twitter Customer Digital Signage In Internal Communication Channels Icons Pdf
This slide depicts the usage of Facebook and Twitter social media platform for customer support services by explaining the trends of other businesses. It includes the number of total users, queries, messages, response rate, and adoption rate by male and female users. Slidegeeks has constructed Facebook And Twitter Customer Digital Signage In Internal Communication Channels Icons Pdf after conducting extensive research and examination. These presentation templates are constantly being generated and modified based on user preferences and critiques from editors. Here, you will find the most attractive templates for a range of purposes while taking into account ratings and remarks from users regarding the content. This is an excellent jumping off point to explore our content and will give new users an insight into our top notch PowerPoint Templates. This slide depicts the usage of Facebook and Twitter social media platform for customer support services by explaining the trends of other businesses. It includes the number of total users, queries, messages, response rate, and adoption rate by male and female users.
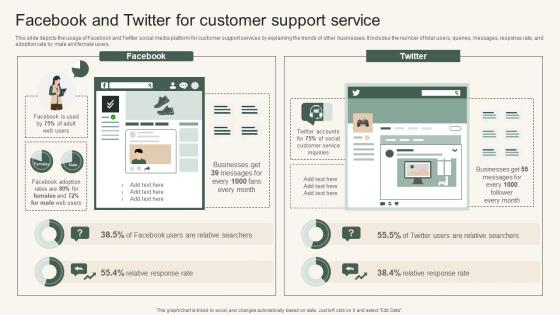
Facebook And Twitter For Customer Instant Messenger For Internal Business Operations Introduction Pdf
This slide depicts the usage of Facebook and Twitter social media platform for customer support services by explaining the trends of other businesses. It includes the number of total users, queries, messages, response rate, and adoption rate by male and female users. This Facebook And Twitter For Customer Instant Messenger For Internal Business Operations Introduction Pdf is perfect for any presentation, be it in front of clients or colleagues. It is a versatile and stylish solution for organizing your meetings. The Facebook And Twitter For Customer Instant Messenger For Internal Business Operations Introduction Pdf features a modern design for your presentation meetings. The adjustable and customizable slides provide unlimited possibilities for acing up your presentation. Slidegeeks has done all the homework before launching the product for you. So, do not wait, grab the presentation templates today This slide depicts the usage of Facebook and Twitter social media platform for customer support services by explaining the trends of other businesses. It includes the number of total users, queries, messages, response rate, and adoption rate by male and female users.
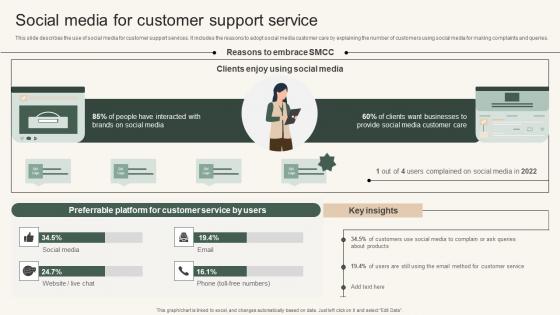
Social Media For Customer Instant Messenger For Internal Business Operations Elements Pdf
This slide describes the use of social media for customer support services. It includes the reasons to adopt social media customer care by explaining the number of customers using social media for making complaints and queries. Find highly impressive Social Media For Customer Instant Messenger For Internal Business Operations Elements Pdf on Slidegeeks to deliver a meaningful presentation. You can save an ample amount of time using these presentation templates. No need to worry to prepare everything from scratch because Slidegeeks experts have already done a huge research and work for you. You need to download Social Media For Customer Instant Messenger For Internal Business Operations Elements Pdf for your upcoming presentation. All the presentation templates are 100 percent editable and you can change the color and personalize the content accordingly. Download now This slide describes the use of social media for customer support services. It includes the reasons to adopt social media customer care by explaining the number of customers using social media for making complaints and queries.
Brand Podcast Performance Tracking Dashboards Comprehensive Guide Mockup Pdf
This slide showcases dashboard used to track the performance of podcast produced by brands as part of storytelling marketing campaign. It tracks listeners, number of plays, new followers, time-listened, top performing episode and top cities. Presenting this PowerPoint presentation, titled Brand Podcast Performance Tracking Dashboards Comprehensive Guide Mockup Pdf with topics curated by our researchers after extensive research. This editable presentation is available for immediate download and provides attractive features when used. Download now and captivate your audience. Presenting this Brand Podcast Performance Tracking Dashboards Comprehensive Guide Mockup Pdf Our researchers have carefully researched and created these slides with all aspects taken into consideration. This is a completely customizable Brand Podcast Performance Tracking Dashboards Comprehensive Guide Mockup Pdf that is available for immediate downloading. Download now and make an impact on your audience. Highlight the attractive features available with our PPTs. This slide showcases dashboard used to track the performance of podcast produced by brands as part of storytelling marketing campaign. It tracks listeners, number of plays, new followers, time-listened, top performing episode and top cities.
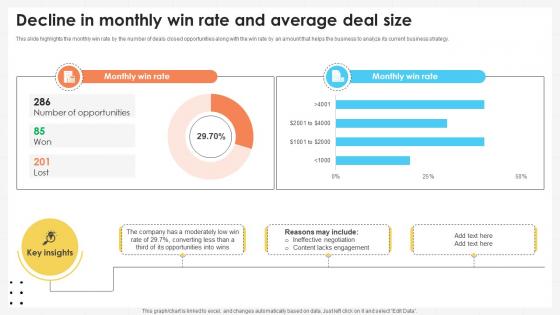
Business Development Team Decline In Monthly Win Rate And Average Deal Size SA SS V
This slide highlights the monthly win rate by the number of deals closed opportunities along with the win rate by an amount that helps the business to analyze its current business strategy. Are you in need of a template that can accommodate all of your creative concepts This one is crafted professionally and can be altered to fit any style. Use it with Google Slides or PowerPoint. Include striking photographs, symbols, depictions, and other visuals. Fill, move around, or remove text boxes as desired. Test out color palettes and font mixtures. Edit and save your work, or work with colleagues. Download Business Development Team Decline In Monthly Win Rate And Average Deal Size SA SS V and observe how to make your presentation outstanding. Give an impeccable presentation to your group and make your presentation unforgettable. This slide highlights the monthly win rate by the number of deals closed opportunities along with the win rate by an amount that helps the business to analyze its current business strategy.
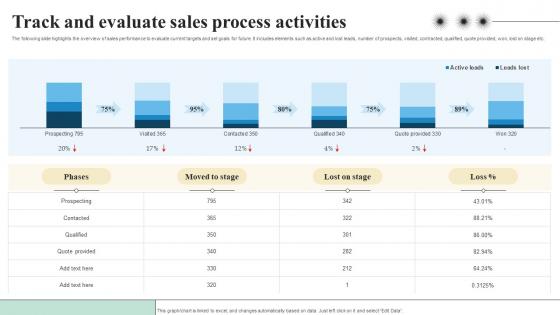
Track And Evaluate Sales Process Objectives And Key Result Methodology For Business
The following slide highlights the overview of sales performance to evaluate current targets and set goals for future. It includes elements such as active and lost leads, number of prospects, visited, contracted, qualified, quote provided, won, lost on stage etc. This Track And Evaluate Sales Process Objectives And Key Result Methodology For Business from Slidegeeks makes it easy to present information on your topic with precision. It provides customization options, so you can make changes to the colors, design, graphics, or any other component to create a unique layout. It is also available for immediate download, so you can begin using it right away. Slidegeeks has done good research to ensure that you have everything you need to make your presentation stand out. Make a name out there for a brilliant performance. The following slide highlights the overview of sales performance to evaluate current targets and set goals for future. It includes elements such as active and lost leads, number of prospects, visited, contracted, qualified, quote provided, won, lost on stage etc.
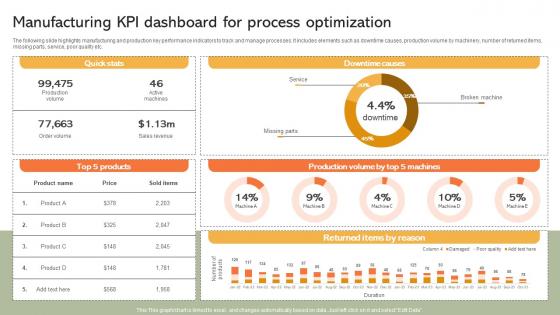
Manufacturing KPI Dashboard For Process Implementing Manufacturing Strategy SS V
The following slide highlights manufacturing and production key performance indicators to track and manage processes. It includes elements such as downtime causes, production volume by machinery, number of returned items, missing parts, service, poor quality etc. Formulating a presentation can take up a lot of effort and time, so the content and message should always be the primary focus. The visuals of the PowerPoint can enhance the presenters message, so our Manufacturing KPI Dashboard For Process Implementing Manufacturing Strategy SS V was created to help save time. Instead of worrying about the design, the presenter can concentrate on the message while our designers work on creating the ideal templates for whatever situation is needed. Slidegeeks has experts for everything from amazing designs to valuable content, we have put everything into Manufacturing KPI Dashboard For Process Implementing Manufacturing Strategy SS V The following slide highlights manufacturing and production key performance indicators to track and manage processes. It includes elements such as downtime causes, production volume by machinery, number of returned items, missing parts, service, poor quality etc.
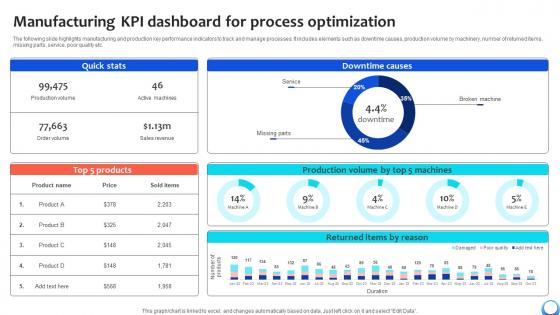
Manufacturing KPI Dashboard For Process Optimization Automating Production Process Strategy SS V
The following slide highlights manufacturing and production key performance indicators to track and manage processes. It includes elements such as downtime causes, production volume by machinery, number of returned items, missing parts, service, poor quality etc. Formulating a presentation can take up a lot of effort and time, so the content and message should always be the primary focus. The visuals of the PowerPoint can enhance the presenters message, so our Manufacturing KPI Dashboard For Process Optimization Automating Production Process Strategy SS V was created to help save time. Instead of worrying about the design, the presenter can concentrate on the message while our designers work on creating the ideal templates for whatever situation is needed. Slidegeeks has experts for everything from amazing designs to valuable content, we have put everything into Manufacturing KPI Dashboard For Process Optimization Automating Production Process Strategy SS V The following slide highlights manufacturing and production key performance indicators to track and manage processes. It includes elements such as downtime causes, production volume by machinery, number of returned items, missing parts, service, poor quality etc.
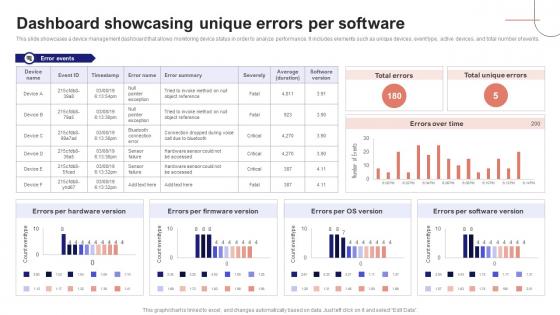
IoT Device Management Fundamentals Dashboard Showcasing Unique Errors Per Software IoT Ss V
This slide showcases a device management dashboard that allows monitoring device status in order to analyze performance. It includes elements such as unique devices, event type, active devices, and total number of events. Are you in need of a template that can accommodate all of your creative concepts This one is crafted professionally and can be altered to fit any style. Use it with Google Slides or PowerPoint. Include striking photographs, symbols, depictions, and other visuals. Fill, move around, or remove text boxes as desired. Test out color palettes and font mixtures. Edit and save your work, or work with colleagues. Download IoT Device Management Fundamentals Dashboard Showcasing Unique Errors Per Software IoT SS V and observe how to make your presentation outstanding. Give an impeccable presentation to your group and make your presentation unforgettable. This slide showcases a device management dashboard that allows monitoring device status in order to analyze performance. It includes elements such as unique devices, event type, active devices, and total number of events.
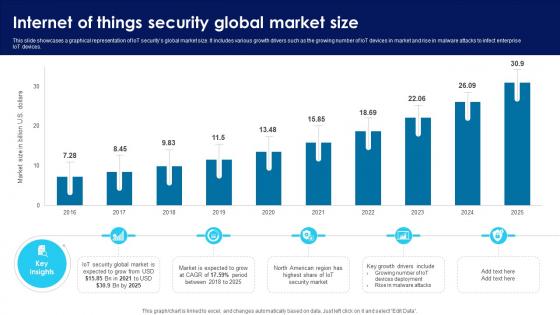
Building Trust With IoT Security Internet Of Things Security Global Market Size IoT SS V
This slide showcases a graphical representation of IoT securitys global market size. It includes various growth drivers such as the growing number of IoT devices in market and rise in malware attacks to infect enterprise IoT devices. This modern and well-arranged Building Trust With IoT Security Internet Of Things Security Global Market Size IoT SS V provides lots of creative possibilities. It is very simple to customize and edit with the Powerpoint Software. Just drag and drop your pictures into the shapes. All facets of this template can be edited with Powerpoint, no extra software is necessary. Add your own material, put your images in the places assigned for them, adjust the colors, and then you can show your slides to the world, with an animated slide included. This slide showcases a graphical representation of IoT securitys global market size. It includes various growth drivers such as the growing number of IoT devices in market and rise in malware attacks to infect enterprise IoT devices.
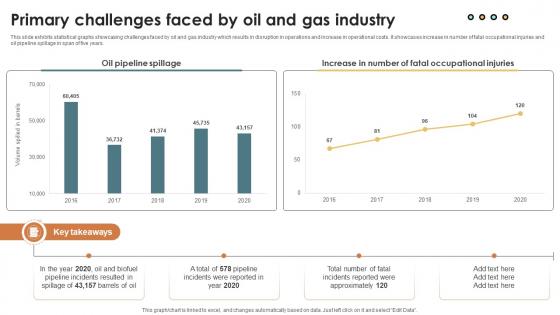
IoT Solutions For Oil Primary Challenges Faced By Oil And Gas Industry IoT SS V
This slide exhibits statistical graphs showcasing challenges faced by oil and gas industry which results in disruption in operations and increase in operational costs. It showcases increase in number of fatal occupational injuries and oil pipeline spillage in span of five years. Slidegeeks is one of the best resources for PowerPoint templates. You can download easily and regulate IoT Solutions For Oil Primary Challenges Faced By Oil And Gas Industry IoT SS V for your personal presentations from our wonderful collection. A few clicks is all it takes to discover and get the most relevant and appropriate templates. Use our Templates to add a unique zing and appeal to your presentation and meetings. All the slides are easy to edit and you can use them even for advertisement purposes. This slide exhibits statistical graphs showcasing challenges faced by oil and gas industry which results in disruption in operations and increase in operational costs. It showcases increase in number of fatal occupational injuries and oil pipeline spillage in span of five years.
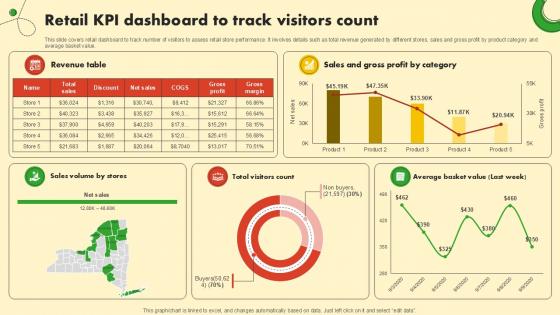
Retail KPI Dashboard To Track Food And Grocery Retail Ppt Slide
This slide covers retail dashboard to track number of visitors to assess retail store performance. It involves details such as total revenue generated by different stores, sales and gross profit by product category and average basket value. This Retail KPI Dashboard To Track Food And Grocery Retail Ppt Slide is perfect for any presentation, be it in front of clients or colleagues. It is a versatile and stylish solution for organizing your meetings. The Retail KPI Dashboard To Track Food And Grocery Retail Ppt Slide features a modern design for your presentation meetings. The adjustable and customizable slides provide unlimited possibilities for acing up your presentation. Slidegeeks has done all the homework before launching the product for you. So, do not wait, grab the presentation templates today This slide covers retail dashboard to track number of visitors to assess retail store performance. It involves details such as total revenue generated by different stores, sales and gross profit by product category and average basket value.
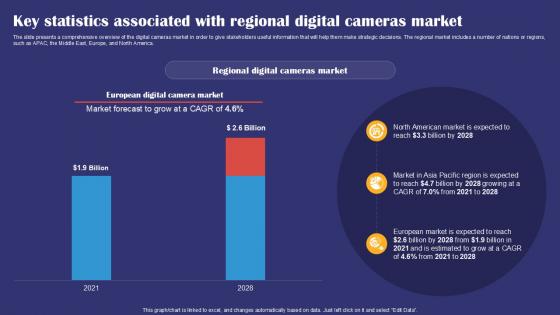
Key Statistics Associated With Regional Digital Cameras Smartphones Industry Report PPT Example IR SS V
The slide presents a comprehensive overview of the digital cameras market in order to give stakeholders useful information that will help them make strategic decisions. The regional market includes a number of nations or regions, such as APAC, the Middle East, Europe, and North America. Coming up with a presentation necessitates that the majority of the effort goes into the content and the message you intend to convey. The visuals of a PowerPoint presentation can only be effective if it supplements and supports the story that is being told. Keeping this in mind our experts created Key Statistics Associated With Regional Digital Cameras Smartphones Industry Report PPT Example IR SS V to reduce the time that goes into designing the presentation. This way, you can concentrate on the message while our designers take care of providing you with the right template for the situation. The slide presents a comprehensive overview of the digital cameras market in order to give stakeholders useful information that will help them make strategic decisions. The regional market includes a number of nations or regions, such as APAC, the Middle East, Europe, and North America.
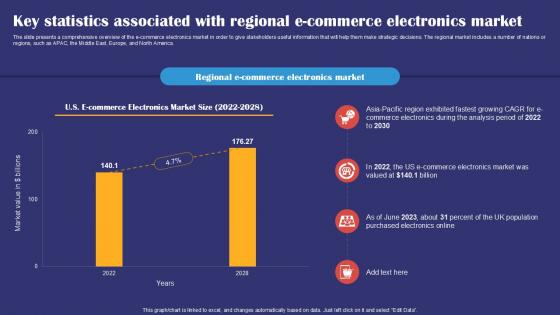
Key Statistics Associated With Regional E Commerce Market Smartphones Industry Report PPT Slides IR SS V
The slide presents a comprehensive overview of the e commerce electronics market in order to give stakeholders useful information that will help them make strategic decisions. The regional market includes a number of nations or regions, such as APAC, the Middle East, Europe, and North America. This modern and well arranged Key Statistics Associated With Regional E Commerce Market Smartphones Industry Report PPT Slides IR SS V provides lots of creative possibilities. It is very simple to customize and edit with the Powerpoint Software. Just drag and drop your pictures into the shapes. All facets of this template can be edited with Powerpoint, no extra software is necessary. Add your own material, put your images in the places assigned for them, adjust the colors, and then you can show your slides to the world, with an animated slide included. The slide presents a comprehensive overview of the e commerce electronics market in order to give stakeholders useful information that will help them make strategic decisions. The regional market includes a number of nations or regions, such as APAC, the Middle East, Europe, and North America.
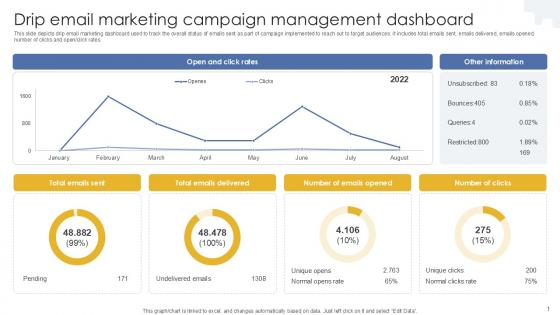
Drip Email Marketing Campaign Management Dashboard PPT Presentation MKT SS V
This slide depicts drip email marketing dashboard used to track the overall status of emails sent as part of campaign implemented to reach out to target audiences. It includes total emails sent, emails delivered, emails opened, number of clicks and open click rates. Present like a pro with Drip Email Marketing Campaign Management Dashboard PPT Presentation MKT SS V. Create beautiful presentations together with your team, using our easy-to-use presentation slides. Share your ideas in real-time and make changes on the fly by downloading our templates. So whether you are in the office, on the go, or in a remote location, you can stay in sync with your team and present your ideas with confidence. With Slidegeeks presentation got a whole lot easier. Grab these presentations today. This slide depicts drip email marketing dashboard used to track the overall status of emails sent as part of campaign implemented to reach out to target audiences. It includes total emails sent, emails delivered, emails opened, number of clicks and open click rates.
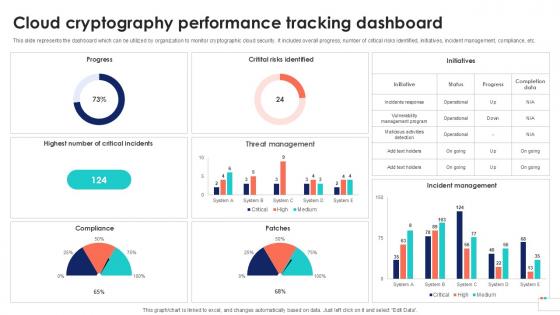
Cloud Cryptography Performance Data Security In Cloud Computing Ppt Presentation
This slide represents the dashboard which can be utilized by organization to monitor cryptographic cloud security. It includes overall progress, number of critical risks identified, initiatives, incident management, compliance, etc. If you are looking for a format to display your unique thoughts, then the professionally designed Cloud Cryptography Performance Data Security In Cloud Computing Ppt Presentation is the one for you. You can use it as a Google Slides template or a PowerPoint template. Incorporate impressive visuals, symbols, images, and other charts. Modify or reorganize the text boxes as you desire. Experiment with shade schemes and font pairings. Alter, share or cooperate with other people on your work. Download Cloud Cryptography Performance Data Security In Cloud Computing Ppt Presentation and find out how to give a successful presentation. Present a perfect display to your team and make your presentation unforgettable. This slide represents the dashboard which can be utilized by organization to monitor cryptographic cloud security. It includes overall progress, number of critical risks identified, initiatives, incident management, compliance, etc.

Global Insights On Cryptocurrency Usage Market Complete Roadmap To Blockchain BCT SS V
This slide covers current state of cryptocurrency usage and adoption on a global scale. It includes elements such as number of global crypto users, U.S crypto users, global market cap, crypto traded daily, most popular crypto and different types of crypto, etc. The Global Insights On Cryptocurrency Usage Market Complete Roadmap To Blockchain BCT SS V is a compilation of the most recent design trends as a series of slides. It is suitable for any subject or industry presentation, containing attractive visuals and photo spots for businesses to clearly express their messages. This template contains a variety of slides for the user to input data, such as structures to contrast two elements, bullet points, and slides for written information. Slidegeeks is prepared to create an impression. This slide covers current state of cryptocurrency usage and adoption on a global scale. It includes elements such as number of global crypto users, U.S crypto users, global market cap, crypto traded daily, most popular crypto and different types of crypto, etc.

Managing Technical And Non Key Statistics Associated With Company Operations
Mentioned slide provides insights into key statistics associated with company working. It includes key statistics such as website designed, mobile applications designed, employee base, global presence, customer base, and number of offices globally. Here you can discover an assortment of the finest PowerPoint and Google Slides templates. With these templates, you can create presentations for a variety of purposes while simultaneously providing your audience with an eye-catching visual experience. Download Managing Technical And Non Key Statistics Associated With Company Operations to deliver an impeccable presentation. These templates will make your job of preparing presentations much quicker, yet still, maintain a high level of quality. Slidegeeks has experienced researchers who prepare these templates and write high-quality content for you. Later on, you can personalize the content by editing the Managing Technical And Non Key Statistics Associated With Company Operations. Mentioned slide provides insights into key statistics associated with company working. It includes key statistics such as website designed, mobile applications designed, employee base, global presence, customer base, and number of offices globally.
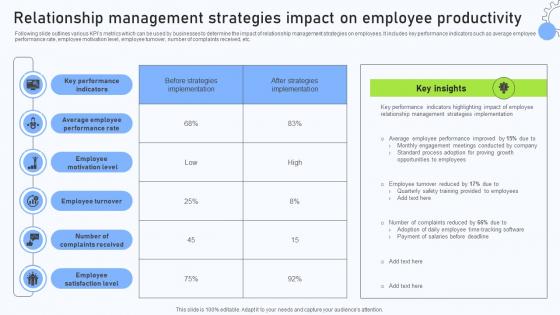
Relationship Management Strategies Impact On Employee Productivity
Following slide outlines various KPIs metrics which can be used by businesses to determine the impact of relationship management strategies on employees. It includes key performance indicators such as average employee performance rate, employee motivation level, employee turnover, number of complaints received, etc. If you are looking for a format to display your unique thoughts, then the professionally designed Relationship Management Strategies Impact On Employee Productivity is the one for you. You can use it as a Google Slides template or a PowerPoint template. Incorporate impressive visuals, symbols, images, and other charts. Modify or reorganize the text boxes as you desire. Experiment with shade schemes and font pairings. Alter, share or cooperate with other people on your work. Download Relationship Management Strategies Impact On Employee Productivity and find out how to give a successful presentation. Present a perfect display to your team and make your presentation unforgettable. Following slide outlines various KPIs metrics which can be used by businesses to determine the impact of relationship management strategies on employees. It includes key performance indicators such as average employee performance rate, employee motivation level, employee turnover, number of complaints received, etc.
Analyzing Website Landing Page Major Promotional Analytics Future Trends Icons Pdf
This slide covers an overview of the conversion rates of websites to identify the number of people who completed the call to action out of everyone who landed on the page. It also includes improvement strategies such as focusing on one call to action CTA, providing authentic proof of value, etc. Do you have an important presentation coming up Are you looking for something that will make your presentation stand out from the rest Look no further than Analyzing Website Landing Page Major Promotional Analytics Future Trends Icons Pdf. With our professional designs, you can trust that your presentation will pop and make delivering it a smooth process. And with Slidegeeks, you can trust that your presentation will be unique and memorable. So why wait Grab Analyzing Website Landing Page Major Promotional Analytics Future Trends Icons Pdf today and make your presentation stand out from the rest This slide covers an overview of the conversion rates of websites to identify the number of people who completed the call to action out of everyone who landed on the page. It also includes improvement strategies such as focusing on one call to action CTA, providing authentic proof of value, etc.


 Continue with Email

 Home
Home


