Org Chart
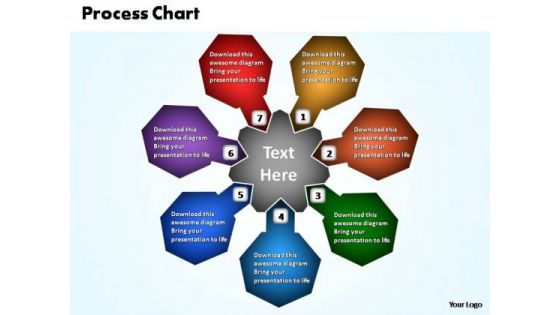
PowerPoint Theme Growth Business Process Chart Ppt Design
This easy to use diagrams can be used for information flow, business process automation, business process re-engineering. Resolve the feud with our PowerPoint Theme Growth Business Process Chart Ppt Design. Take all different approaches into consideration.
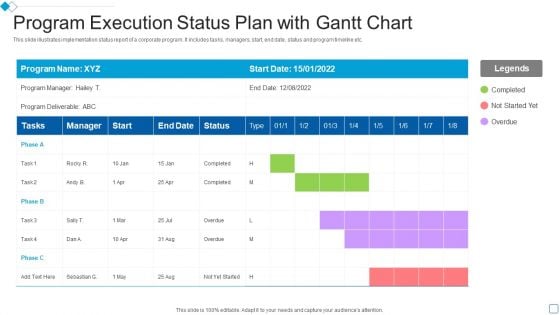
Program Execution Status Plan With Gantt Chart Designs PDF
Introducing our Program Execution Status Plan With Gantt Chart Designs PDF that is designed to showcase some of the vital components that will help you create timelines, roadmaps, and project plans. In addition, also communicate your project durations, milestones, tasks, subtasks, dependencies, and other attributes using this well structured Program Execution Status Plan With Gantt Chart Designs PDF template. You can also exhibit preeminence against time by deploying this easily adaptable slide to your business presentation. Our experts have designed this template in such a way that it is sure to impress your audience. Thus, download it and steer your project meetings, meetups, and conferences
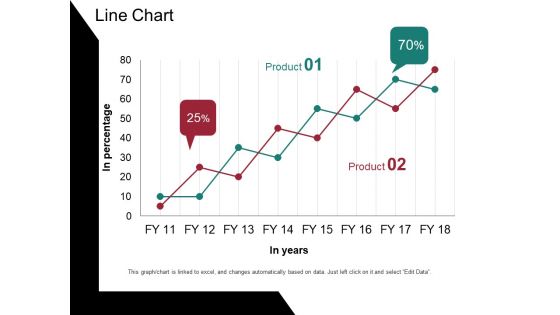
Line Chart Ppt PowerPoint Presentation Portfolio Design Templates
This is a line chart ppt powerpoint presentation portfolio design templates. This is a two stage process. The stages in this process are in percentage, in years, percentage, business, graph.
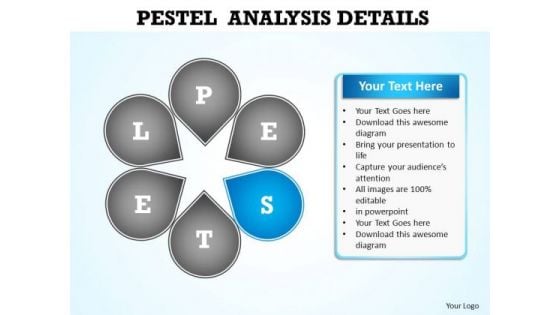
PowerPoint Slide Layout Chart Pestel Analysis Ppt Design
PowerPoint Slide layout Chart Pestel Analysis PPT Design-The Circle of Life - a concept embedded in our minds and hence easy to comprehend. Life and Business is made up of processes comprising stages that flow from one to another. An excellent graphic to attract the attention of and understanding by your audience to improve earnings. Be a conscious and capable citizen. Elaborate on your environmental concerns with our PowerPoint Slide Layout Chart Pestel Analysis Ppt Design.
Combo Chart Ppt PowerPoint Presentation Icon Design Templates
This is a combo chart ppt powerpoint presentation icon design templates. This is a three stage process. The stages in this process are market size, growth rate, product, business, success.
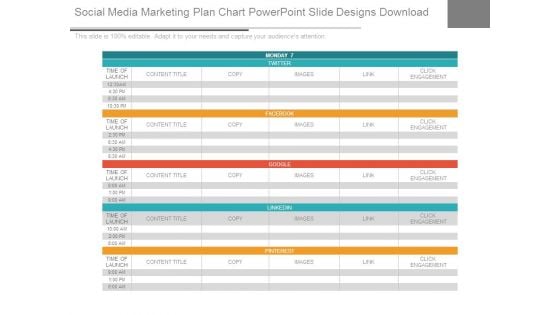
Social Media Marketing Plan Chart Powerpoint Slide Designs Download
This is a social media marketing plan chart powerpoint slide designs download. This is a five stage process. The stages in this process are content title, copy, images, link, click engagement.
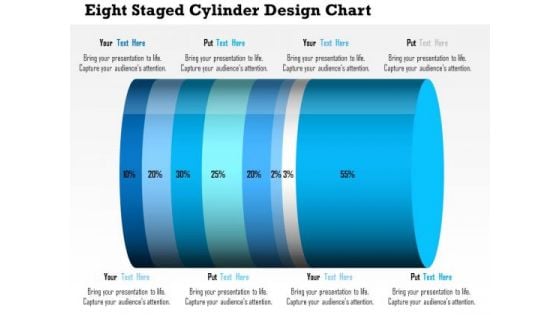
Business Daigram Eight Staged Cylinder Design Chart Presentation Templets
This business diagram contains eight staged cylinder design chart with percentage ratio. Download this diagram to display financial analysis. Use this diagram to make business and marketing related presentations.
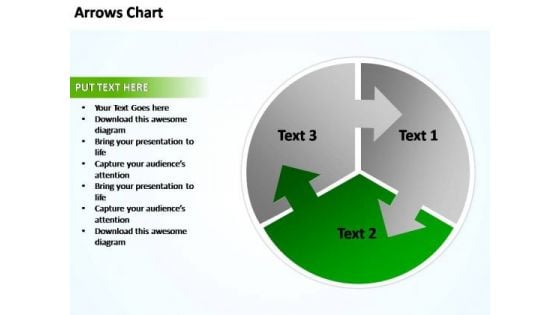
PowerPoint Templates Business Circular Plan With Arrows Chart Ppt Designs
PowerPoint Templates Business Circular Plan With Arrows Chart PPT Designs-Explore the various directions and layers existing in your in your plans and processes. Unravel the desired and essential elements of your overall strategy. Explain the relevance of the different layers and stages and directions in getting down to your core competence, ability and desired result. Exert influence with our PowerPoint Templates Business Circular Plan With Arrows Chart Ppt Designs. Get opinions going for you.
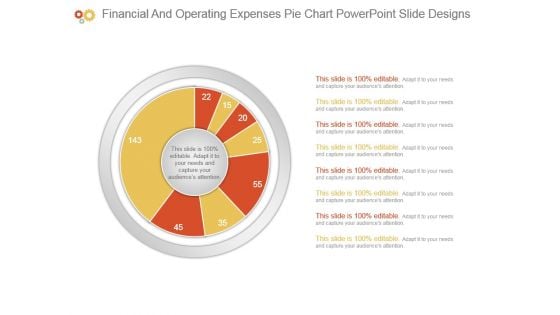
Financial And Operating Expenses Pie Chart Powerpoint Slide Designs
This is a financial and operating expenses pie chart powerpoint slide designs. This is a eight stage process. The stages in this process are business, diagram, marketing, management, presentation.
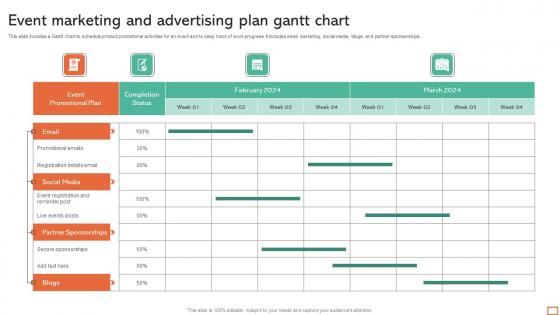
Event Marketing And Advertising Plan Gantt Chart Professional Pdf
This slide includes a Gantt chart to schedule product promotional activities for an event and to keep track of work progress. It includes email marketing, social media, blogs, and partner sponsorships. Pitch your topic with ease and precision using this Event Marketing And Advertising Plan Gantt Chart Professional Pdf. This layout presents information on Social Media, Partner Sponsorships. It is also available for immediate download and adjustment. So, changes can be made in the color, design, graphics or any other component to create a unique layout. This slide includes a Gantt chart to schedule product promotional activities for an event and to keep track of work progress. It includes email marketing, social media, blogs, and partner sponsorships.
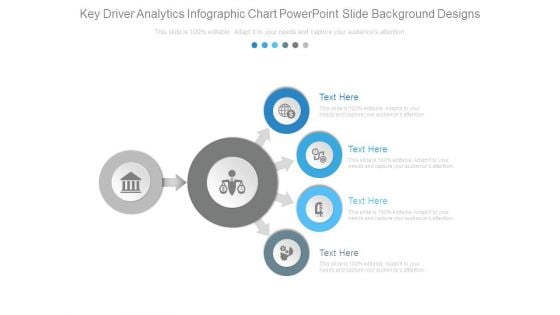
Key Driver Analytics Infographic Chart Powerpoint Slide Background Designs
This is a key driver analytics infographic chart powerpoint slide background designs. This is a four stage process. The stages in this process are business, marketing, arrows, icons, strategy.
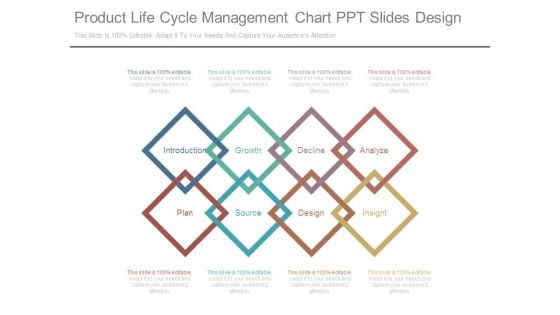
Product Life Cycle Management Chart Ppt Slides Design
This is a product life cycle management chart ppt slides design. This is a eight stage process. The stages in this process are introduction, growth, decline, analyze, plan, source, design, insight.
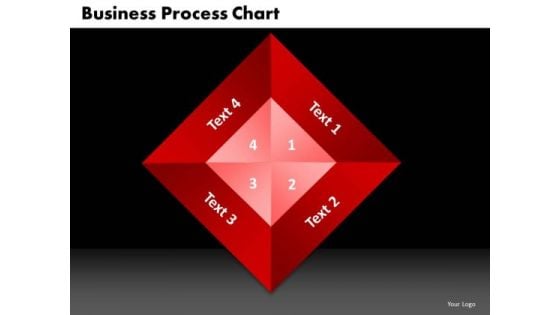
PowerPoint Template Business Process Chart Editable Ppt Design Slides
PowerPoint Template Business Process Chart Editable PPT Design Slides-The Circle of Life - a concept emmbedded in our minds and hence easy to comprehend. Life and Business is made up of processes comprising stages that flow from one to another. An excellent graphic to attract the attention of and understanding by your audience to improve earnings-PowerPoint Template Business Process Chart Editable PPT Design Slides-This ppt can be used for presentations relating to-Arrow, Bond, Business, Button, Buying, Career, Change, Chart, Children, Circle, College, Death, Diagram, Education, Financial, Future, Graphic, House, Illustration, Investing, Investment, Marriage, Menu, Personal, Plan, Process Entertain your audience with our PowerPoint Template Business Process Chart Editable Ppt Design Slides. You will come out on top.
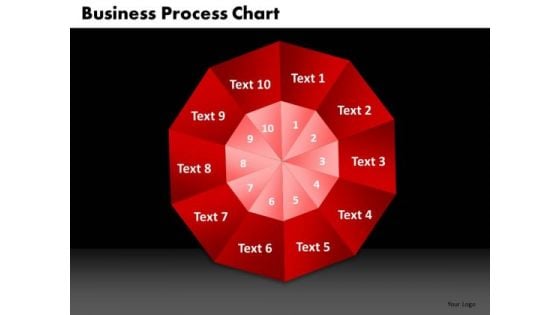
PowerPoint Templates Process Chart Business Ppt Design Slides
PowerPoint Templates Process Chart Business PPT Design Slides-The Circle of Life - a concept emmbedded in our minds and hence easy to comprehend. Life and Business is made up of processes comprising stages that flow from one to another. An excellent graphic to attract the attention of and understanding by your audience to improve earnings-PowerPoint Templates Process Chart Business PPT Design Slides-This ppt can be used for presentations relating to-Arrow, Bond, Business, Button, Buying, Career, Change, Chart, Children, Circle, College, Death, Diagram, Education, Financial, Future, Graphic, House, Illustration, Investing, Investment, Marriage, Menu, Personal, Plan, Process Do not let oppurtunity go abegging. Seize the moment with our PowerPoint Templates Process Chart Business Ppt Design Slides.
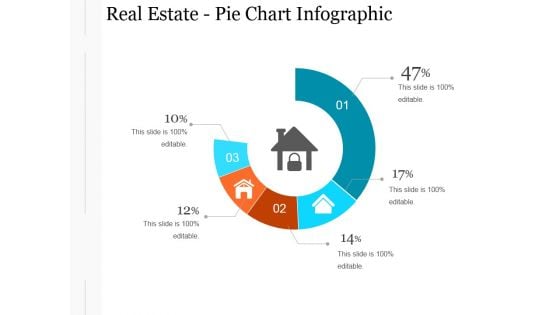
Real Estate Pie Chart Infographic Ppt PowerPoint Presentation Designs Download
This is a real estate pie chart infographic ppt powerpoint presentation designs download. This is a four stage process. The stages in this process are business, planning, management, marketing, strategy.
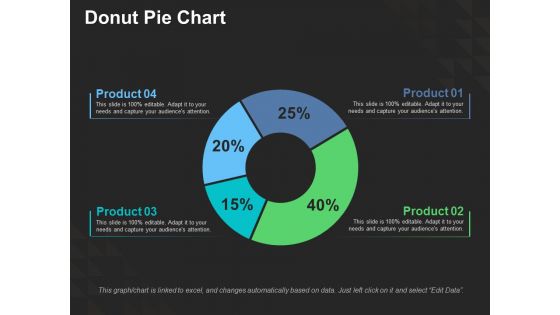
Donut Pie Chart Ppt PowerPoint Presentation Ideas Design Templates
This is a donut pie chart ppt powerpoint presentation ideas design templates. This is a four stage process. The stages in this process are analysis finance, investment, business, planning, marketing.
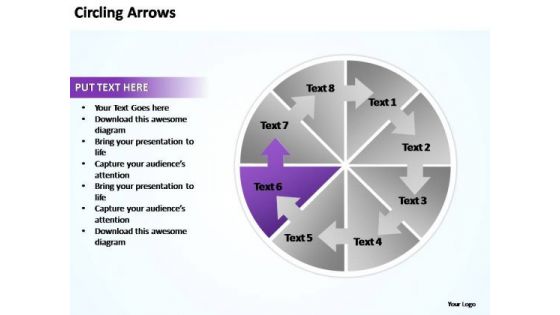
PowerPoint Templates Circling Arrows Flow Chart Ppt Design Slides
PowerPoint Templates Circling Arrows Flow Chart PPT Design Slides-Explore the various directions and layers existing in your in your plans and processes. Unravel the desired and essential elements of your overall strategy. Explain the relevance of the different layers and stages and directions in getting down to your core competence, ability and desired result. Our PowerPoint Templates Circling Arrows Flow Chart Ppt Design Slides give expression to your drive. They emit the essence of your determination.
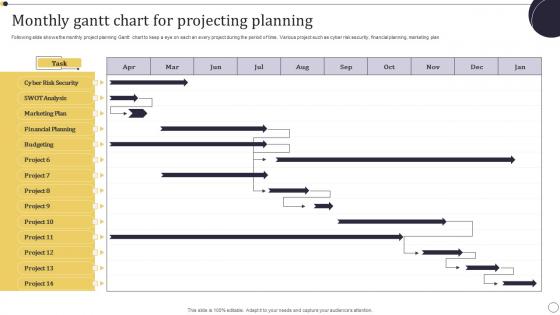
Monthly Gantt Chart For Projecting Planning Information Pdf
Following slide shows the monthly project planning Gantt chart to keep a eye on each an every project during the period of time. Various project such as cyber risk security, financial planning, marketing plan Showcasing this set of slides titled Monthly Gantt Chart For Projecting Planning Information Pdf. The topics addressed in these templates are Marketing Plan, Financial Planning, Cyber Risk Security . All the content presented in this PPT design is completely editable. Download it and make adjustments in color, background, font etc. as per your unique business setting. Following slide shows the monthly project planning Gantt chart to keep a eye on each an every project during the period of time. Various project such as cyber risk security, financial planning, marketing plan
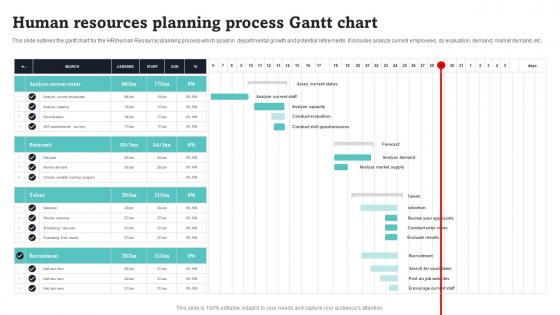
Human Resources Planning Process Gantt Chart Portrait Pdf
This slide outlines the gantt chart for the HRhuman Resource planning process which assist in departmental growth and potential retirements. It includes analyze current employees, do evaluation, demand, market demand, etc. Pitch your topic with ease and precision using this Human Resources Planning Process Gantt Chart Portrait Pdf. This layout presents information on Analyze Current Status, Forecast, Talent. It is also available for immediate download and adjustment. So, changes can be made in the color, design, graphics or any other component to create a unique layout. This slide outlines the gantt chart for the HRhuman Resource planning process which assist in departmental growth and potential retirements. It includes analyze current employees, do evaluation, demand, market demand, etc.
Triptans Comparison Chart In Powerpoint And Google Slides Cpb
Presenting our innovatively designed set of slides titled Triptans Comparison Chart In Powerpoint And Google Slides Cpb This completely editable PowerPoint graphic exhibits Triptans Comparison Chart that will help you convey the message impactfully. It can be accessed with Google Slides and is available in both standard screen and widescreen aspect ratios. Apart from this, you can download this well structured PowerPoint template design in different formats like PDF, JPG, and PNG. So, click the download button now to gain full access to this PPT design. Our Triptans Comparison Chart In Powerpoint And Google Slides Cpb are topically designed to provide an attractive backdrop to any subject. Use them to look like a presentation pro.
Sound Quality Chart In Powerpoint And Google Slides Cpb
Presenting our innovatively designed set of slides titled Sound Quality Chart In Powerpoint And Google Slides Cpb. This completely editable PowerPoint graphic exhibits Sound Quality Chart that will help you convey the message impactfully. It can be accessed with Google Slides and is available in both standard screen and widescreen aspect ratios. Apart from this, you can download this well structured PowerPoint template design in different formats like PDF, JPG, and PNG. So, click the download button now to gain full access to this PPT design. Our Sound Quality Chart In Powerpoint And Google Slides Cpb are topically designed to provide an attractive backdrop to any subject. Use them to look like a presentation pro.
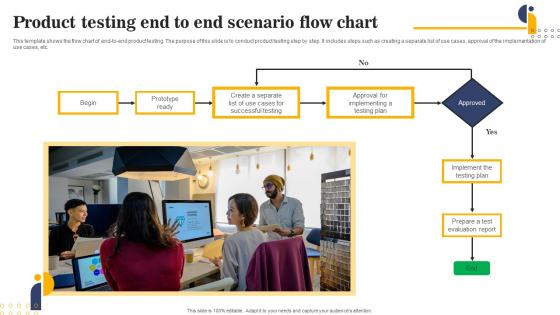
Product Testing End To End Scenario Flow Chart Download Pdf
This template shows the flow chart of end-to-end product testing. The purpose of this slide is to conduct product testing step by step. It includes steps such as creating a separate list of use cases, approval of the implementation of use cases, etc.Pitch your topic with ease and precision using this Product Testing End To End Scenario Flow Chart Download Pdf This layout presents information on Successful Testing, Prototype Ready, Approval Implementing It is also available for immediate download and adjustment. So, changes can be made in the color, design, graphics or any other component to create a unique layout. This template shows the flow chart of end to end product testing. The purpose of this slide is to conduct product testing step by step. It includes steps such as creating a separate list of use cases, approval of the implementation of use cases, etc.
Chart Extracellular In Powerpoint And Google Slides Cpb
Introducing our well designed Chart Extracellular In Powerpoint And Google Slides Cpb This PowerPoint design presents information on topics like Chart Extracellular As it is predesigned it helps boost your confidence level. It also makes you a better presenter because of its high quality content and graphics. This PPT layout can be downloaded and used in different formats like PDF, PNG, and JPG. Not only this, it is available in both Standard Screen and Widescreen aspect ratios for your convenience. Therefore, click on the download button now to persuade and impress your audience. Our Chart Extracellular In Powerpoint And Google Slides Cpb are topically designed to provide an attractive backdrop to any subject. Use them to look like a presentation pro.
Levels Chart Examples In Powerpoint And Google Slides Cpb
Introducing our well designed Levels Chart Examples In Powerpoint And Google Slides Cpb This PowerPoint design presents information on topics like Levels Chart Examples As it is predesigned it helps boost your confidence level. It also makes you a better presenter because of its high quality content and graphics. This PPT layout can be downloaded and used in different formats like PDF, PNG, and JPG. Not only this, it is available in both Standard Screen and Widescreen aspect ratios for your convenience. Therefore, click on the download button now to persuade and impress your audience. Our Levels Chart Examples In Powerpoint And Google Slides Cpb are topically designed to provide an attractive backdrop to any subject. Use them to look like a presentation pro.
Function Flow Chart In Powerpoint And Google Slides Cpb
Introducing our well designed Function Flow Chart In Powerpoint And Google Slides Cpb. This PowerPoint design presents information on topics like Function Flow Chart. As it is predesigned it helps boost your confidence level. It also makes you a better presenter because of its high quality content and graphics. This PPT layout can be downloaded and used in different formats like PDF, PNG, and JPG. Not only this, it is available in both Standard Screen and Widescreen aspect ratios for your convenience. Therefore, click on the download button now to persuade and impress your audience. Our Function Flow Chart In Powerpoint And Google Slides Cpb are topically designed to provide an attractive backdrop to any subject. Use them to look like a presentation pro.
Pregnancy Heart Rate Chart In Powerpoint And Google Slides Cpb
Introducing our well designed Pregnancy Heart Rate Chart In Powerpoint And Google Slides Cpb. This PowerPoint design presents information on topics like Pregnancy Heart Rate Chart. As it is predesigned it helps boost your confidence level. It also makes you a better presenter because of its high quality content and graphics. This PPT layout can be downloaded and used in different formats like PDF, PNG, and JPG. Not only this, it is available in both Standard Screen and Widescreen aspect ratios for your convenience. Therefore, click on the download button now to persuade and impress your audience. Our Pregnancy Heart Rate Chart In Powerpoint And Google Slides Cpb are topically designed to provide an attractive backdrop to any subject. Use them to look like a presentation pro.
Foods Chart In Powerpoint And Google Slides Cpb
Introducing our well designed Foods Chart In Powerpoint And Google Slides Cpb. This PowerPoint design presents information on topics like Foods Chart. As it is predesigned it helps boost your confidence level. It also makes you a better presenter because of its high-quality content and graphics. This PPT layout can be downloaded and used in different formats like PDF, PNG, and JPG. Not only this, it is available in both Standard Screen and Widescreen aspect ratios for your convenience. Therefore, click on the download button now to persuade and impress your audience. Our Foods Chart In Powerpoint And Google Slides Cpb are topically designed to provide an attractive backdrop to any subject. Use them to look like a presentation pro.
Gantt Chart Multiple Projects In Powerpoint And Google Slides Cpb
Introducing our well designed Gantt Chart Multiple Projects In Powerpoint And Google Slides Cpb. This PowerPoint design presents information on topics like Gantt Chart Multiple Projects. As it is predesigned it helps boost your confidence level. It also makes you a better presenter because of its high quality content and graphics. This PPT layout can be downloaded and used in different formats like PDF, PNG, and JPG. Not only this, it is available in both Standard Screen and Widescreen aspect ratios for your convenience. Therefore, click on the download button now to persuade and impress your audience. Our Gantt Chart Multiple Projects In Powerpoint And Google Slides Cpb are topically designed to provide an attractive backdrop to any subject. Use them to look like a presentation pro.
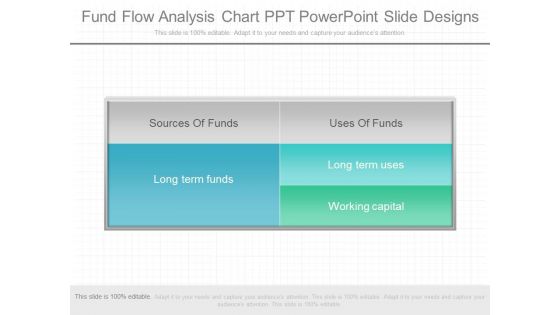
Fund Flow Analysis Chart Ppt Powerpoint Slide Designs
This is a fund flow analysis chart ppt powerpoint slide designs. This is a five stage process. The stages in this process are sources of funds, long term funds, uses of funds, long term uses, working capital.
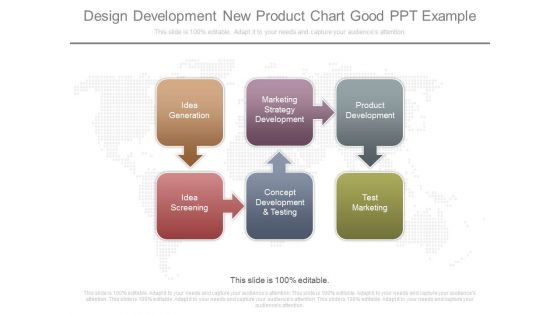
Design Development New Product Chart Good Ppt Example
This is a design development new product chart good ppt example. This is a six stage process. The stages in this process are idea generation, marketing strategy development, product development, idea screening, concept development and testing, test marketing.
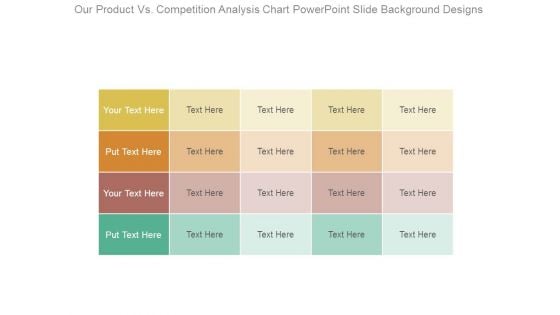
Our Product Vs Competition Analysis Chart Powerpoint Slide Background Designs
This is a our product vs competition analysis chart powerpoint slide background designs. This is a four stage process. The stages in this process are business, marketing, success, strategy, compare.

And R Chart For Six Sigma Powerpoint Slide Background Designs
This is a and r chart for six sigma powerpoint slide background designs. This is a two stage process. The stages in this process are subtitle, option, lcl, ucl.
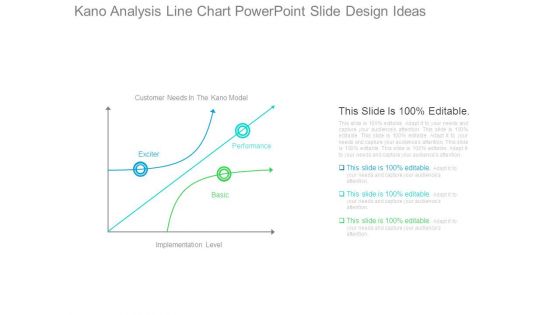
Kano Analysis Line Chart Powerpoint Slide Design Ideas
This is a kano analysis line chart powerpoint slide design ideas. This is a three stage process. The stages in this process are customer needs in the kano model, exciter, performance, basic, implementation level.
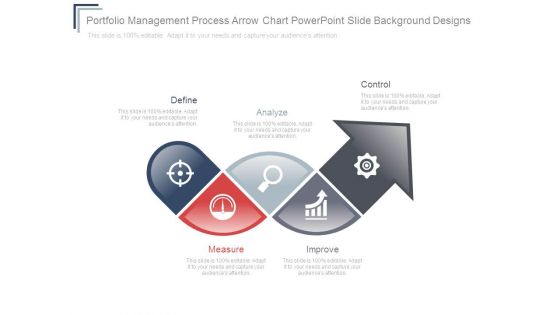
Portfolio Management Process Arrow Chart Powerpoint Slide Background Designs
This is a portfolio management process arrow chart powerpoint slide background designs. This is a five stage process. The stages in this process are define, analyze, measure, improve, control.
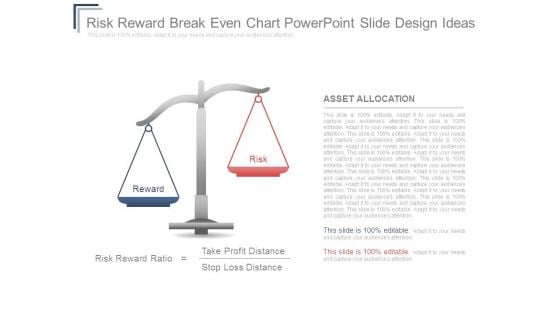
Risk Reward Breakeven Chart Powerpoint Slide Design Ideas
This is a risk reward breakeven chart powerpoint slide design ideas. This is a two stage process. The stages in this process are reward, risk, asset allocation, risk reward ratio, take profit distance, stop loss distance.
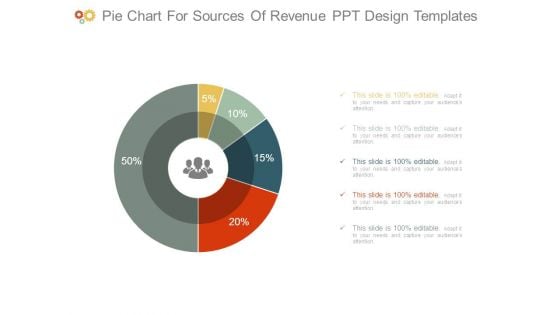
Pie Chart For Sources Of Revenue Ppt Design Templates
This is a pie chart for sources of revenue ppt design templates. This is a five stage process. The stages in this process are finance, success, business, marketing, percentage, donut.

Profit After Tax Pat Growth Chart Powerpoint Slide Designs Download
This is a profit after tax pat growth chart powerpoint slide designs download. This is a five stage process. The stages in this process are growth, success, business, strategy, marketing.
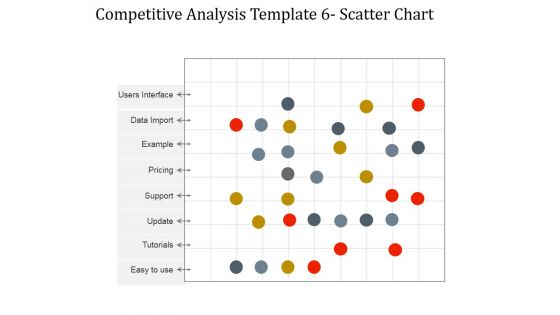
Competitive Analysis Scatter Chart Ppt PowerPoint Presentation Background Designs
This is a competitive analysis scatter chart ppt powerpoint presentation background designs. This is a three stage process. The stages in this process are competitive analysis, business, management, marketing, strategy.
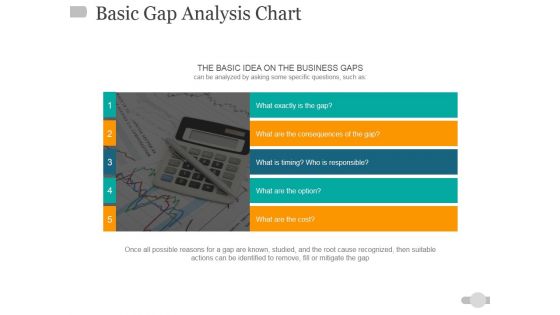
Basic Gap Analysis Chart Ppt PowerPoint Presentation Pictures Design Ideas
This is a basic gap analysis chart ppt powerpoint presentation pictures design ideas. This is a five stage process. The stages in this process are business, finance, marketing, analysis, investment.
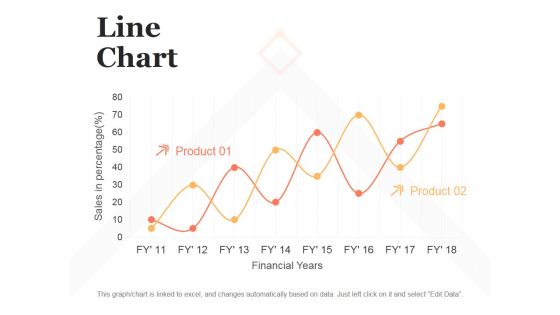
Line Chart Ppt PowerPoint Presentation Model Design Templates
This is a line chart ppt powerpoint presentation model design templates. This is a two stage process. The stages in this process are sales in percentage, financial years, product.
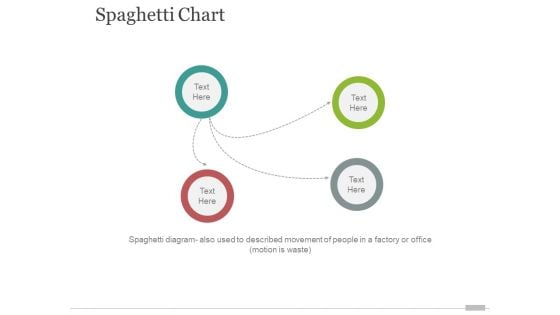
spaghetti chart template 1 ppt powerpoint presentation styles design inspiration
This is a spaghetti chart template 1 ppt powerpoint presentation styles design inspiration. This is a three stage process. The stages in this process are business, marketing, circle, management.
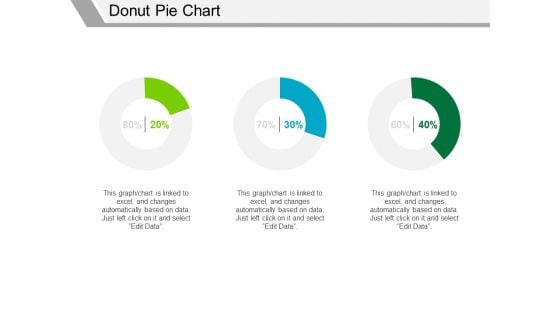
Donut Pie Chart Ppt PowerPoint Presentation Infographics Background Designs
This is a donut pie chart ppt powerpoint presentation infographics background designs. This is a three stage process. The stages in this process are finance, business, marketing, strategy, percentage.
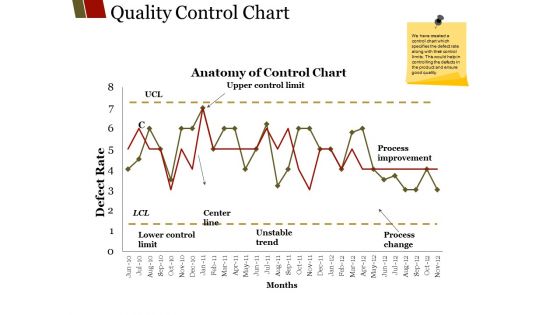
Quality Control Chart Ppt PowerPoint Presentation File Graphics Design
This is a quality control chart ppt powerpoint presentation file graphics design. This is a two stage process. The stages in this process are unstable trend, months center line, lower control limit, process improvement.
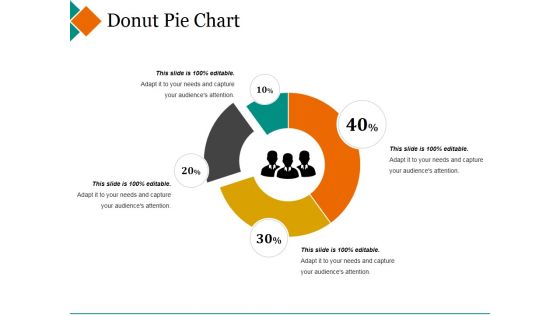
Donut Pie Chart Ppt PowerPoint Presentation Pictures Design Inspiration
This is a donut pie chart ppt powerpoint presentation pictures design inspiration. This is a four stage process. The stages in this process are maximum, donut, minimum, percentage, finance.
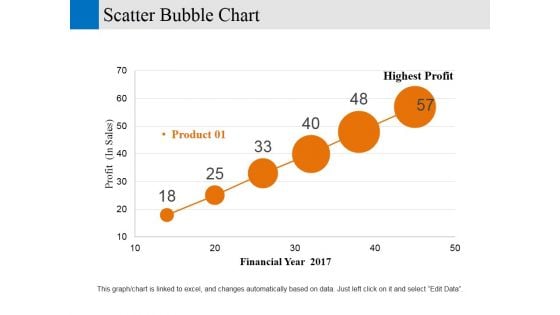
Scatter Bubble Chart Ppt PowerPoint Presentation Gallery Designs Download
This is a scatter bubble chart ppt powerpoint presentation gallery designs download. This is a six stage process. The stages in this process are financial year, profit, business, marketing, strategy.
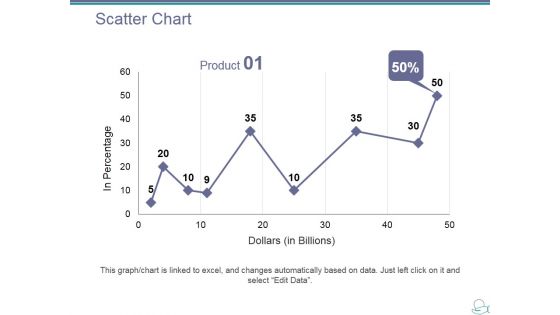
Scatter Chart Ppt PowerPoint Presentation Ideas Designs Download
This is a scatter chart ppt powerpoint presentation ideas designs download. This is a one stage process. The stages in this process are product, dollar, in percentage, growth, success.
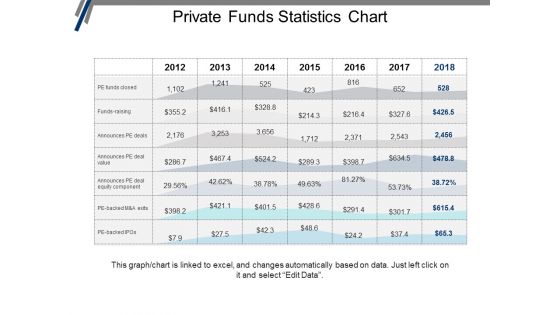
Private Funds Statistics Chart Ppt PowerPoint Presentation Portfolio Graphics Design
This is a private funds statistics chart ppt powerpoint presentation portfolio graphics design. This is a seven stage process. The stages in this process are investment, funding, private equity, venture capital.
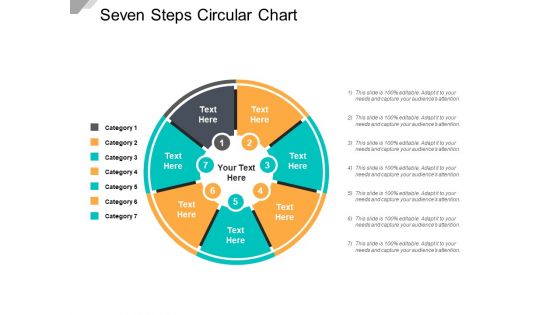
Seven Steps Circular Chart Ppt PowerPoint Presentation Infographics Designs
This is a seven steps circular chart ppt powerpoint presentation infographics designs. This is a seven stage process. The stages in this process are sectioned circle, segmented circle, partitioned circle.
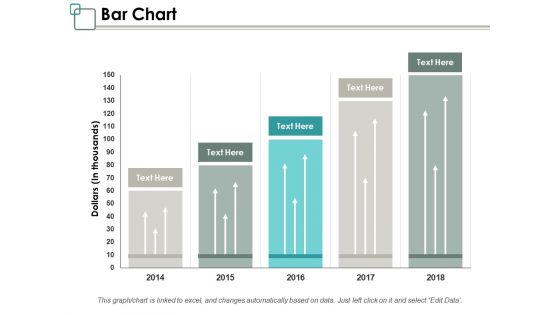
Bar Chart Ppt PowerPoint Presentation Infographic Template Graphics Design
This is a bar chart ppt powerpoint presentation infographic template graphics design. This is a five stage process. The stages in this process are management, marketing, business, percentage, product.
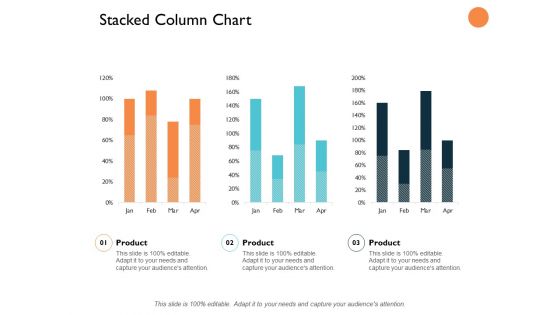
Stacked Column Chart Analysis Ppt PowerPoint Presentation Slides Graphics Design
This is a stacked column chart analysis ppt powerpoint presentation slides graphics design. This is a three stage process. The stages in this process are finance, marketing, management, investment, analysis.

Pie Chart Finance Ppt Powerpoint Presentation Layouts Design Ideas
This is a pie chart finance ppt powerpoint presentation layouts design ideas. This is a four stage process. The stages in this process are finance, marketing, management, investment, analysis.
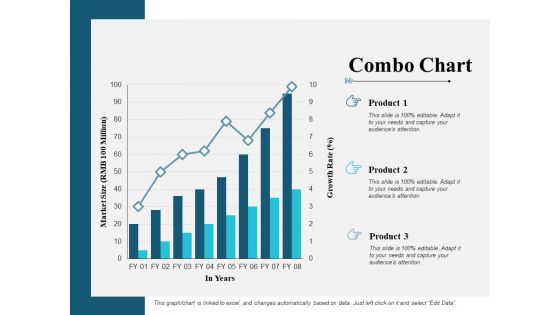
Combo Chart Finance Ppt PowerPoint Presentation Summary Design Ideas
This is a combo chart finance ppt powerpoint presentation summary design ideas. This is a three stage process. The stages in this process are finance, marketing, management, investment, analysis.
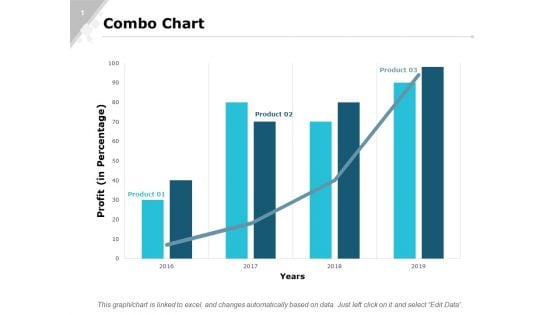
Combo Chart Graph Ppt PowerPoint Presentation Gallery Designs Download
This is a combo chart graph ppt powerpoint presentation gallery designs download. This is a three stage process. The stages in this process are finance, marketing, analysis, investment, million.
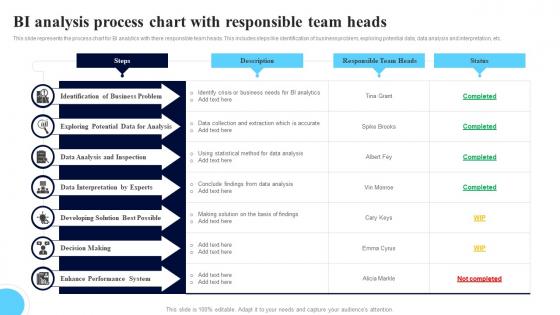
BI Analysis Process Chart With Responsible Team Heads Mockup Pdf
This slide represents the process chart for BI analytics with there responsible team heads. This includes steps like identification of business problem, exploring potential data, data analysis and interpretation, etc. Showcasing this set of slides titled BI Analysis Process Chart With Responsible Team Heads Mockup Pdf. The topics addressed in these templates are Identification Of Business, Data Analysis, Data Interpretation. All the content presented in this PPT design is completely editable. Download it and make adjustments in color, background, font etc. as per your unique business setting. This slide represents the process chart for BI analytics with there responsible team heads. This includes steps like identification of business problem, exploring potential data, data analysis and interpretation, etc.

SAP Implementation Process Gantt Chart Ppt Slides Sample Pdf
This slide represents the timeline or Gantt chart of the SAP implementation process. It further includes various stages of process such as build team and identify business goal, evaluate business process, implement business blueprint, etc. Pitch your topic with ease and precision using this SAP Implementation Process Gantt Chart Ppt Slides Sample Pdf. This layout presents information on Business Goal, Evaluate Business Process, Implement Business Blueprint. It is also available for immediate download and adjustment. So, changes can be made in the color, design, graphics or any other component to create a unique layout. This slide represents the timeline or Gantt chart of the SAP implementation process. It further includes various stages of process such as build team and identify business goal, evaluate business process, implement business blueprint, etc.
Revenue Projection Icon With Bar Chart Ppt Ideas Designs PDF
Persuade your audience using this revenue projection icon with bar chart ppt ideas designs pdf. This PPT design covers three stages, thus making it a great tool to use. It also caters to a variety of topics including revenue projection icon with bar chart. Download this PPT design now to present a convincing pitch that not only emphasizes the topic but also showcases your presentation skills.
Icon Of Businessman Presenting Growth Trend Chart Designs PDF
Persuade your audience using this Icon Of Businessman Presenting Growth Trend Chart Designs PDF This PPT design covers Four stages, thus making it a great tool to use. It also caters to a variety of topics including Icon Businessman, Presenting Growth, Trend Chart Download this PPT design now to present a convincing pitch that not only emphasizes the topic but also showcases your presentation skills.
User Software Requirements Chart Icon Ppt Inspiration Graphics Design PDF
Persuade your audience using this User Software Requirements Chart Icon Ppt Inspiration Graphics Design PDF. This PPT design covers three stages, thus making it a great tool to use. It also caters to a variety of topics including User Software, Requirements Chart, Icon. Download this PPT design now to present a convincing pitch that not only emphasizes the topic but also showcases your presentation skills.
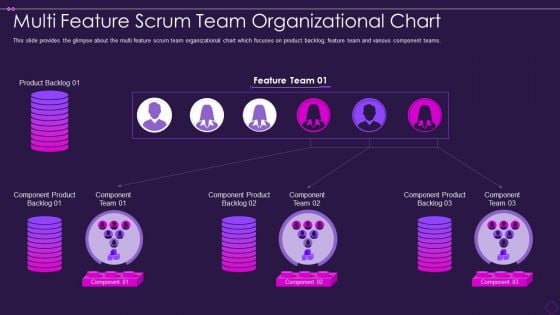
Multi Feature Scrum Team Organizational Chart Designs PDF
This slide provides the glimpse about the multi feature scrum team organizational chart which focuses on product backlog, feature team and various component teams. Deliver an awe inspiring pitch with this creative multi feature scrum team organizational chart designs pdf bundle. Topics like team, product can be discussed with this completely editable template. It is available for immediate download depending on the needs and requirements of the user.
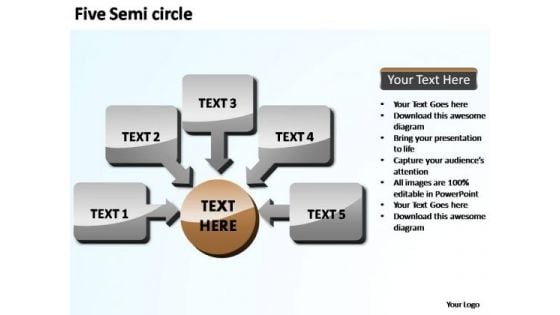
PowerPoint Design Chart Five New Concepts Ppt Slide
PowerPoint Design Chart Five New Concepts PPT Slide-Explore the various directions and layers existing in your in your plans and processes. Unravel the desired and essential elements of your overall strategy. Explain the relevance of the different layers and stages and directions in getting down to your core competence, ability and desired result. Collect all the evidence on our PowerPoint Design Chart Five New Concepts Ppt Slide. Connect the clues and come to conclusions with ease.


 Continue with Email

 Home
Home


