Org Chart
Bar Graph And Line Chart For Comparative Analysis Icon Ppt PowerPoint Presentation Gallery Infographics PDF
Showcasing this set of slides titled bar graph and line chart for comparative analysis icon ppt powerpoint presentation gallery infographics pdf. The topics addressed in these templates are bar graph and line chart for comparative analysis icon. All the content presented in this PPT design is completely editable. Download it and make adjustments in color, background, font etc. as per your unique business setting.
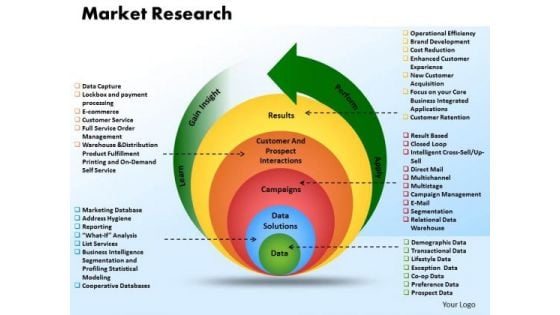
Business Circle Chart PowerPoint Templates Business Market Research Data Ppt Slides
Business Circle Chart PowerPoint Templates Business market research data PPT Slides-\nThis PowerPoint diagram slide shows a circular process withan arrow. Useful to represent process slides-Business Circle Chart PowerPoint Templates Business market research data PPT Slides-This template can be used for presentations relating to 3d, Abstract, Around, Arrow, Background, Bright, Business, Card, Chart, Circle, Circular, Circulation, Collection, Colorful, Communication, Concept, Cycle, Cyclic, Design, Direction, Element, Flow, Glass, Glossy, Graphic, Icon, Illustration, Modern, Motion, Network Crown yourself with our Business Circle Chart PowerPoint Templates Business Market Research Data Ppt Slides. You will acquire the feel of a champion.
PowerPoint Template Business Success 3d Pie Chart List Ppt Slide Designs
PowerPoint Template Business Success 3d Pie Chart list PPT Slide Designs-These high quality powerpoint pre-designed slides and powerpoint templates have been carefully created by our professional team to help you impress your audience. All slides have been created and are 100% editable in powerpoint. Each and every property of any graphic - color, size, orientation, shading, outline etc. can be modified to help you build an effective powerpoint presentation. Any text can be entered at any point in the powerpoint template or slide. Simply DOWNLOAD, TYPE and PRESENT! Exhibit your faith on our PowerPoint Template Business Success 3d Pie Chart List Ppt Slide Designs. Your audience will believe in you.
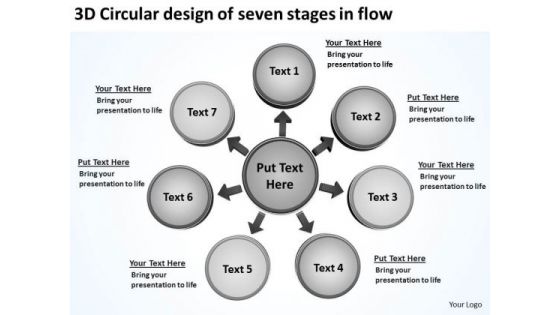
3d Circular Design Of Seven Stages In Flow Pie Chart PowerPoint Templates
We present our 3d circular design of seven stages in flow Pie Chart PowerPoint templates.Use our Business PowerPoint Templates because it will demonstrate the strength of character under severe stress. Shine the torch ahead and bring the light to shine on all. Download and present our Circle charts PowerPoint Templates because clarity of thought has been the key to your growth. Present our Arrows PowerPoint Templates because you should take your team soaring to the pinnacle they crave. Download and present our Shapes PowerPoint Templates because you require care and diligence to function well. Download our Flow charts PowerPoint Templates because this an appropriate template to get your ideas across to your target audience.Use these PowerPoint slides for presentations relating to Abstract, arrow, arrow, circle, business, concept, career, center, stage, chart, circle circle, connection, contrast, cycle, diagram, direction, flow flowchart, future, graph, icon, illustration, isolate, isolated, job, life, loop, money, motion network, recycle, refresh, ring, rotation, sick, sign, symbol, simply, target, wealth. The prominent colors used in the PowerPoint template are Pink, Gray, White. People tell us our 3d circular design of seven stages in flow Pie Chart PowerPoint templates are Spiffy. PowerPoint presentation experts tell us our stage PowerPoint templates and PPT Slides are Appealing. Presenters tell us our 3d circular design of seven stages in flow Pie Chart PowerPoint templates are Wistful. PowerPoint presentation experts tell us our career PowerPoint templates and PPT Slides are Bold. People tell us our 3d circular design of seven stages in flow Pie Chart PowerPoint templates will help them to explain complicated concepts. People tell us our concept PowerPoint templates and PPT Slides are Magnificent. No matter how fastidious you like to be. Our 3d Circular Design Of Seven Stages In Flow Pie Chart PowerPoint Templates will satisfy your every condition.
Business Circle Chart PowerPoint Templates Success Lego Blocks Flowchart Ppt Slides
Business Circle Chart PowerPoint Templates Success Lego Blocks Flowchart PPT Slides-This PowerPoint diagram shows a circular process with 2 arrows. Useful to represent process slides-Business Circle Chart PowerPoint Templates Success Lego Blocks Flowchart PPT Slides-This template can be used for presentations relating to Activity, Background, Block, Box, Brick, Build, Buildings, Child, Childhood, Colourful, Concept, Connect, Connection, Construction, Cube, Design, Development, Education, Element, Fun, Game, Geometric Detail goals with our Business Circle Chart PowerPoint Templates Success Lego Blocks Flowchart Ppt Slides. Download without worries with our money back guaranteee.
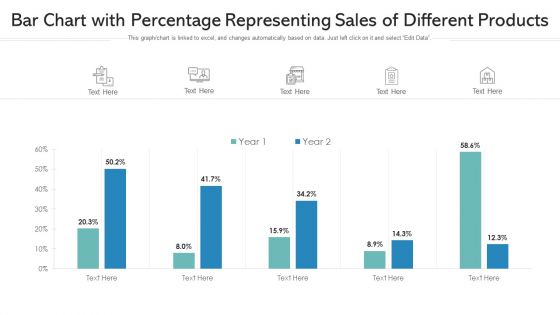
Bar Chart With Percentage Representing Sales Of Different Products Ppt PowerPoint Presentation Gallery Diagrams PDF
Showcasing this set of slides titled bar chart with percentage representing sales of different products ppt powerpoint presentation gallery diagrams pdf. The topics addressed in these templates are bar chart with percentage representing sales of different products. All the content presented in this PPT design is completely editable. Download it and make adjustments in color, background, font etc. as per your unique business setting.
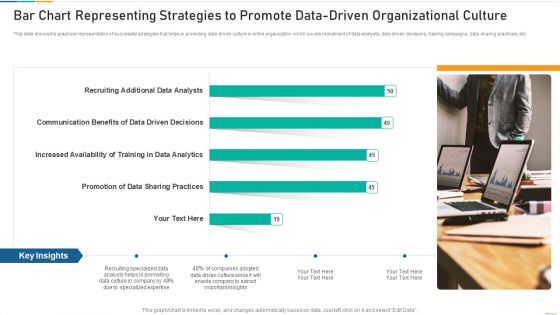
Bar Chart Representing Strategies To Promote Data Driven Organizational Culture Diagrams PDF
Showcasing this set of slides titled bar chart representing strategies to promote data driven organizational culture diagrams pdf. The topics addressed in these templates are bar chart representing strategies to promote data driven organizational culture. All the content presented in this PPT design is completely editable. Download it and make adjustments in color, background, font etc. as per your unique business setting.
Five Scale Bar Chart For Monthly Consumer Review Report Ppt Icon Ideas PDF
Showcasing this set of slides titled five scale bar chart for monthly consumer review report ppt icon ideas pdf. The topics addressed in these templates are five scale bar chart for monthly consumer review report. All the content presented in this PPT design is completely editable. Download it and make adjustments in color, background, font etc. as per your unique business setting.
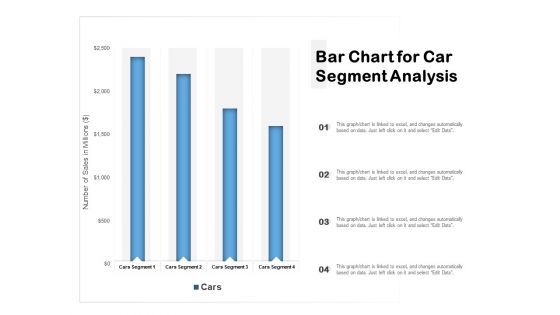
Bar Chart For Car Segment Analysis Ppt PowerPoint Presentation Show Templates PDF
Pitch your topic with ease and precision using this bar chart for car segment analysis ppt powerpoint presentation show templates pdf. This layout presents information on bar chart for car segment analysis. It is also available for immediate download and adjustment. So, changes can be made in the color, design, graphics or any other component to create a unique layout.
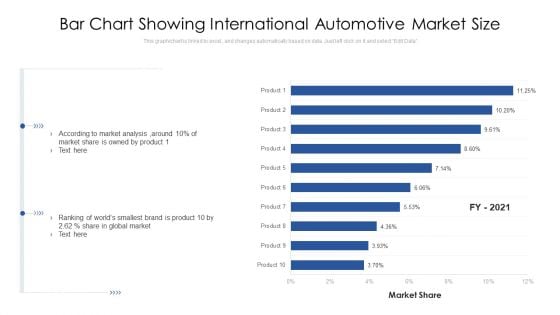
Bar Chart Showing International Automotive Market Size Ppt PowerPoint Presentation Gallery Templates PDF
Showcasing this set of slides titled bar chart showing international automotive market size ppt powerpoint presentation gallery templates pdf The topics addressed in these templates are bar chart showing international automotive market size. All the content presented in this PPT design is completely editable. Download it and make adjustments in color, background, font etc. as per your unique business setting.

Stacked Bar Chart For Beverages Consumption Ppt PowerPoint Presentation File Mockup PDF
Showcasing this set of slides titled stacked bar chart for beverages consumption ppt powerpoint presentation file mockup pdf. The topics addressed in these templates are stacked bar chart for beverages consumption. All the content presented in this PPT design is completely editable. Download it and make adjustments in color, background, font etc. as per your unique business setting.
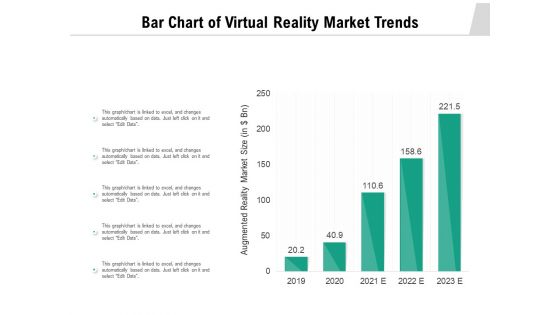
Bar Chart Of Virtual Reality Market Trends Ppt PowerPoint Presentation Styles Graphics PDF
Showcasing this set of slides titled bar chart of virtual reality market trends ppt powerpoint presentation styles graphics pdf. The topics addressed in these templates are bar chart of virtual reality market trends. All the content presented in this PPT design is completely editable. Download it and make adjustments in colour, background, font etc. as per your unique business setting.
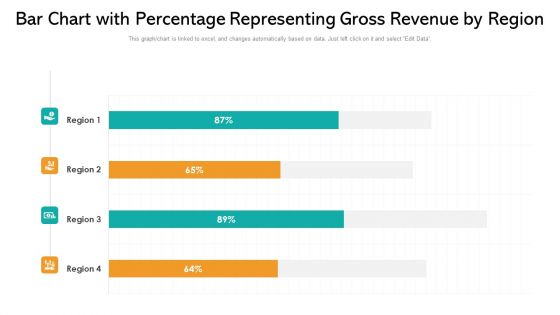
Bar Chart With Percentage Representing Gross Revenue By Region Ppt PowerPoint Presentation File Topics PDF
Showcasing this set of slides titled bar chart with percentage representing gross revenue by region ppt powerpoint presentation file topics pdf. The topics addressed in these templates are bar chart with percentage representing gross revenue by region. All the content presented in this PPT design is completely editable. Download it and make adjustments in color, background, font etc. as per your unique business setting.
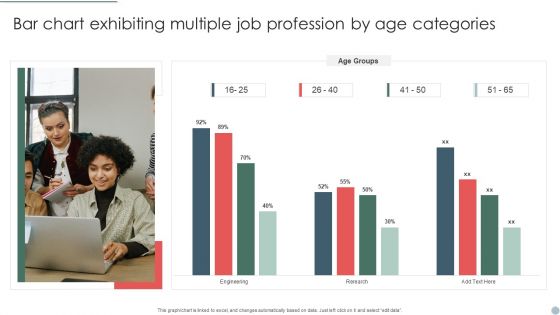
Bar Chart Exhibiting Multiple Job Profession By Age Categories Structure PDF
Showcasing this set of slides titled Bar Chart Exhibiting Multiple Job Profession By Age Categories Structure PDF. The topics addressed in these templates are Bar Chart Exhibiting, Multiple Job Profession, Age Categories. All the content presented in this PPT design is completely editable. Download it and make adjustments in color, background, font etc. as per your unique business setting.
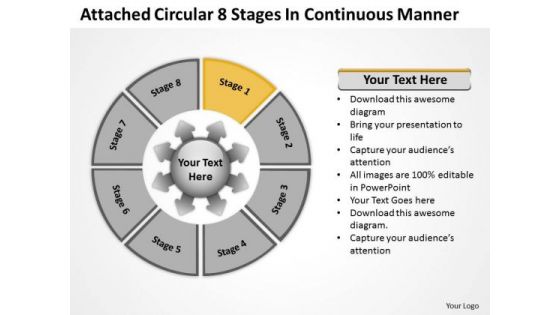
Circular 8 Stages In Continuous Manner Ppt Relative Cycle Arrow Chart PowerPoint Templates
We present our circular 8 stages in continuous manner ppt Relative Cycle Arrow Chart PowerPoint templates.Present our Ring charts PowerPoint Templates because this diagram helps to reaffirm to your team your faith in maintaining the highest ethical standards. Use our Process and flows PowerPoint Templates because brilliant ideas are your forte. Present our Business PowerPoint Templates because this template helps you to grab the attention of your listeners. Download and present our Marketing PowerPoint Templates because they represent the proress in our lives. Present our Flow charts PowerPoint Templates because you can asked to strive to give true form to your great dream.Use these PowerPoint slides for presentations relating to Arrow, art, blank, business, chart, circular, clip, clipart, clockwise, colorful, corporate, curving, cycle, diagram, directional, financial, flow, graph, graphic, illustration, info graphic, modern, pie, process, round, segments, seven, shape, slices, stages, steps. The prominent colors used in the PowerPoint template are Gray, Black, White. People tell us our circular 8 stages in continuous manner ppt Relative Cycle Arrow Chart PowerPoint templates are Romantic. We assure you our circular PowerPoint templates and PPT Slides help you meet deadlines which are an element of today's workplace. Just browse and pick the slides that appeal to your intuitive senses. PowerPoint presentation experts tell us our circular 8 stages in continuous manner ppt Relative Cycle Arrow Chart PowerPoint templates are Adorable. You can be sure our business PowerPoint templates and PPT Slides are Exuberant. Professionals tell us our circular 8 stages in continuous manner ppt Relative Cycle Arrow Chart PowerPoint templates are aesthetically designed to attract attention. We guarantee that they will grab all the eyeballs you need. Use our circular PowerPoint templates and PPT Slides are Versatile. Erect a solid structure for your thoughts to build on. Put every layer in place with our Circular 8 Stages In Continuous Manner Ppt Relative Cycle Arrow Chart PowerPoint Templates.

Horizontal Bar Chart Representing Consumer Review On Three Scale Ppt Gallery Diagrams PDF
Pitch your topic with ease and precision using this horizontal bar chart representing consumer review on three scale ppt gallery diagrams pdf. This layout presents information on horizontal bar chart representing consumer review on three scale. It is also available for immediate download and adjustment. So, changes can be made in the color, design, graphics or any other component to create a unique layout.
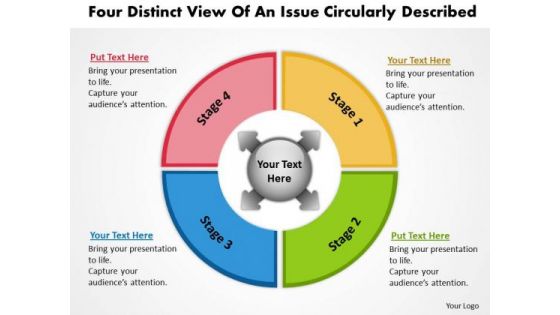
Distinct View Of An Issue Circularly Described Flow Chart PowerPoint Templates
We present our distinct view of an issue circularly described Flow Chart PowerPoint templates.Present our Circle Charts PowerPoint Templates because firing the arrows to emblazon the desired path will let you achieve anticipated results. Present our Arrows PowerPoint Templates because you have to coordinate and motivate your team. Download our Ring Charts PowerPoint Templates because this template helps you to illustrate your method, piece by piece, and interlock the whole process in the minds of your audience. Present our Business PowerPoint Templates because you are ready to flap your wings and launch off. All poised are you to touch the sky with glory. Present our Flow Charts PowerPoint Templates because Our PowerPoint Templates and Slides are topically designed to provide an attractive backdrop to any subject.Use these PowerPoint slides for presentations relating to 3d, arrow, blue, chart, circle, circular, circulation, collection, concept, connection, continuity, cursor, cycle, cyclic, diagram, direction, dynamic, flow, flowchart, graph, graphic, green, group, icon, loop, motion, movement, process, progress, recycle, recycling, red, refresh, reload, renew, repetition, return, reuse, rgb, ring, rotation, round, set, sign, spin, symbol, three, turn, update, vector. The prominent colors used in the PowerPoint template are Red, Yellow, Green. Presenters tell us our distinct view of an issue circularly described Flow Chart PowerPoint templates are Attractive. You can be sure our concept PowerPoint templates and PPT Slides are incredible easy to use. Professionals tell us our distinct view of an issue circularly described Flow Chart PowerPoint templates effectively help you save your valuable time. People tell us our circulation PowerPoint templates and PPT Slides will make the presenter look like a pro even if they are not computer savvy. People tell us our distinct view of an issue circularly described Flow Chart PowerPoint templates are Fancy. Professionals tell us our concept PowerPoint templates and PPT Slides are the best it can get when it comes to presenting. Recieve a deluge of benefits from our Distinct View Of An Issue Circularly Described Flow Chart PowerPoint Templates. Your thoughts will experience abundance.
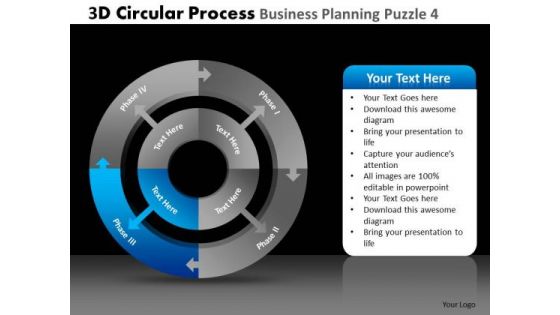
PowerPoint Design Slides Company Success 3d Circular Chart Process Business Ppt Slide
PowerPoint Design Slides Company Success 3d circular Chart process business PPT Slide-These high quality powerpoint pre-designed slides and powerpoint templates have been carefully created by our professional team to help you impress your audience. All slides have been created and are 100% editable in powerpoint. Each and every property of any graphic - color, size, orientation, shading, outline etc. can be modified to help you build an effective powerpoint presentation. Any text can be entered at any point in the powerpoint template or slide. Simply DOWNLOAD, TYPE and PRESENT! Our PowerPoint Design Slides Company Success 3d Circular Chart Process Business Ppt Slide ensure approval. Your ideas will fit the bill.
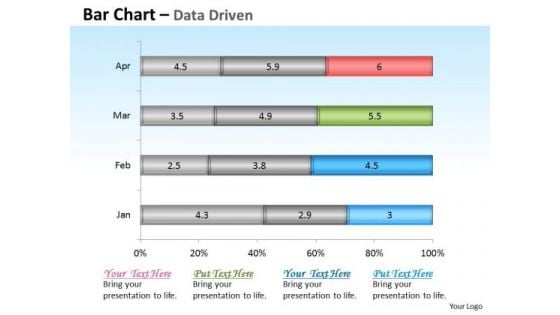
Financial Data Analysis Driven Base Bar Chart Design PowerPoint Slides Templates
Get The Domestics Right With Our financial data analysis driven base bar chart design powerpoint slides Templates . Create The Base For Thoughts To Grow.
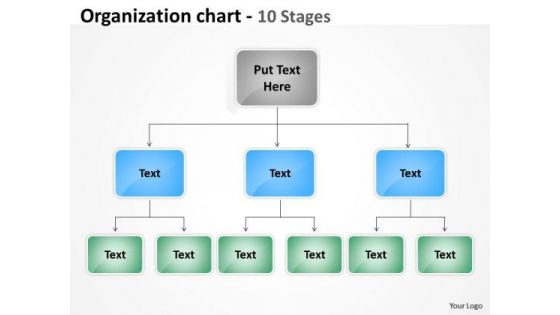
Business Cycle Diagram Organization Chart 10 Factors Business Finance Strategy Development
Doll Up Your Thoughts With Our Business Cycle Diagram Organization Chart 10 Factors Business Finance Strategy Development Powerpoint Templates. They Will Make A Pretty Picture. They Say A Dog Is Man's Best Friend. Our Business Cycle Diagram Organization Chart 10 Factors Business Finance Strategy Development Powerpoint Templates Come A Close Second.
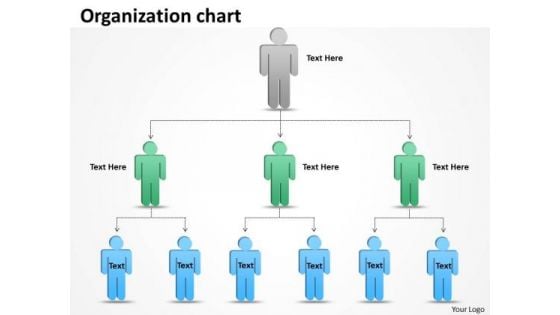
Business Cycle Diagram Organization Chart 9 Steps Business Finance Strategy Development
Get The Domestics Right With Our Business Cycle Diagram Organization Chart 9 Steps Business Finance Strategy Development Powerpoint Templates. Create The Base For Thoughts To Grow. Do Away With Dogmatic Approaches. Establish The Value Of Reason With OurBusiness Cycle Diagram Organization Chart 9 Steps Business Finance Strategy Development Powerpoint Templates.
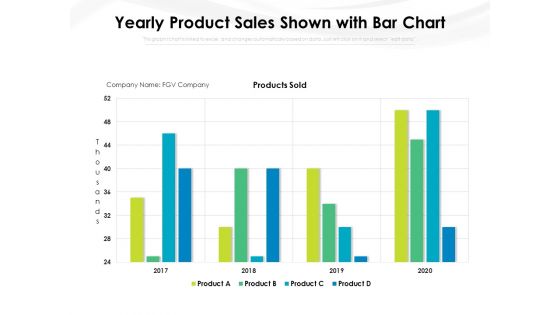
Yearly Product Sales Shown With Bar Chart Ppt PowerPoint Presentation File Gridlines PDF
Pitch your topic with ease and precision using this yearly product sales shown with bar chart ppt powerpoint presentation file gridlines pdf. This layout presents information on yearly product sales shown with bar chart. It is also available for immediate download and adjustment. So, changes can be made in the color, design, graphics or any other component to create a unique layout.
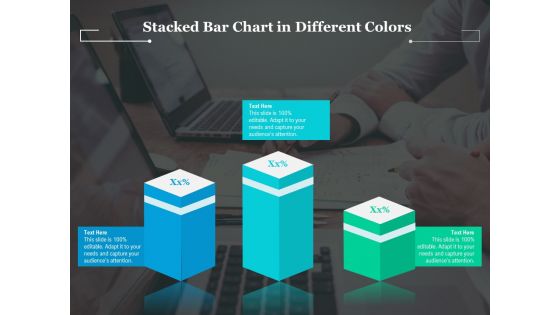
Stacked Bar Chart In Different Colors Ppt PowerPoint Presentation Gallery Maker PDF
Pitch your topic with ease and precision using this stacked bar chart in different colors ppt powerpoint presentation gallery maker pdf. This layout presents information on stacked bar chart in different colors. It is also available for immediate download and adjustment. So, changes can be made in the color, design, graphics or any other component to create a unique layout.
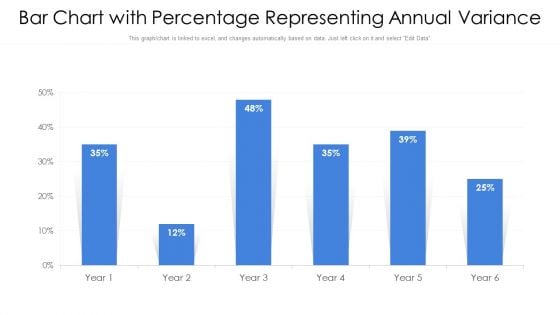
Bar Chart With Percentage Representing Annual Variance Ppt PowerPoint Presentation Gallery Portfolio PDF
Pitch your topic with ease and precision using this bar chart with percentage representing annual variance ppt powerpoint presentation gallery portfolio pdf. This layout presents information on bar chart with percentage representing annual variance. It is also available for immediate download and adjustment. So, changes can be made in the color, design, graphics or any other component to create a unique layout.

Bar Chart With Percentage Representing Inventory Ppt PowerPoint Presentation File Outfit PDF
Pitch your topic with ease and precision using this bar chart with percentage representing inventory ppt powerpoint presentation file outfit pdf. This layout presents information on bar chart with percentage representing inventory. It is also available for immediate download and adjustment. So, changes can be made in the color, design, graphics or any other component to create a unique layout.
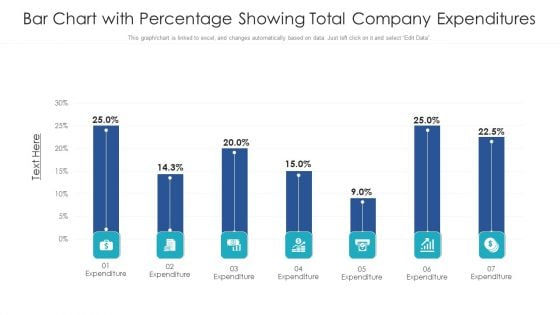
Bar Chart With Percentage Showing Total Company Expenditures Ppt PowerPoint Presentation File Background PDF
Pitch your topic with ease and precision using this bar chart with percentage showing total company expenditures ppt powerpoint presentation file background pdf. This layout presents information on bar chart with percentage showing total company expenditures. It is also available for immediate download and adjustment. So, changes can be made in the color, design, graphics or any other component to create a unique layout.
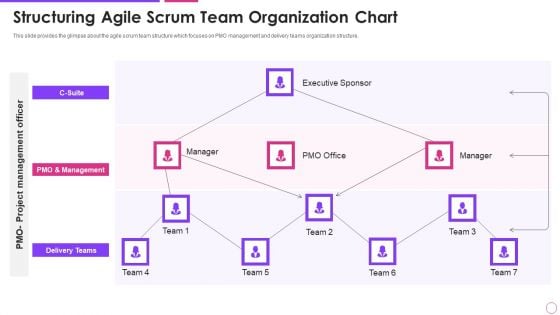
Structuring Agile Scrum Team Organization Chart Agile Project Management Framework Background PDF
Deliver an awe inspiring pitch with this creative structuring agile scrum team organization chart agile project management framework background pdf bundle. Topics like executive sponsor, delivery teams, management can be discussed with this completely editable template. It is available for immediate download depending on the needs and requirements of the user.
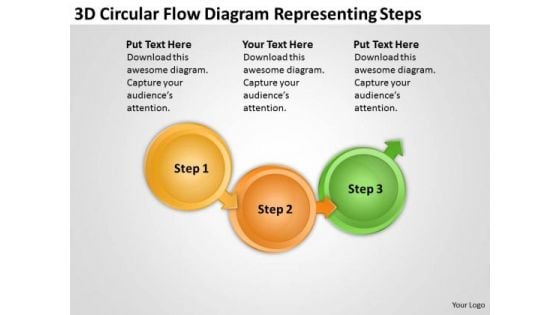
3d Circular Flow Diagram Representing Steps Process Chart Manufacturing PowerPoint Slides
We present our 3d circular flow diagram representing steps process chart manufacturing PowerPoint Slides.Use our Arrows PowerPoint Templates because the colour coding of our templates are specifically designed to highlight you points. Download and present our Spheres PowerPoint Templates because there is a vision, a need you can meet. Present our Process and Flows PowerPoint Templates because it helps to churn the mixture to the right degree and pound home your views and expectations in a spectacularly grand and virtuoso fluid performance. Use our Marketing PowerPoint Templates because you can Educate your listeners on the means to keep it ticking over. Download our Circle Charts PowerPoint Templates because this slide is Designed to help bullet-point your views and thoughts.Use these PowerPoint slides for presentations relating to Arrow, Business, Chain, Chart, Circle, Circle Frame, Color, Concept, Connect, Connection, Connectivity, Corporate, Data, Design, Diagram, Financial, Flow, Flowchart, Graph, Graphical, Group, Important, Organization, Organize, Plan, Process, Rectangle, Relation, Set, Steps, Structure, Teamwork. The prominent colors used in the PowerPoint template are Orange, Green, Yellow. Customers tell us our 3d circular flow diagram representing steps process chart manufacturing PowerPoint Slides are Ritzy. The feedback we get is that our Frame PowerPoint templates and PPT Slides are Gorgeous. Professionals tell us our 3d circular flow diagram representing steps process chart manufacturing PowerPoint Slides are Fancy. People tell us our Color PowerPoint templates and PPT Slides are Dynamic. Customers tell us our 3d circular flow diagram representing steps process chart manufacturing PowerPoint Slides will make the presenter look like a pro even if they are not computer savvy. Professionals tell us our Frame PowerPoint templates and PPT Slides are Colorful. Our 3d Circular Flow Diagram Representing Steps Process Chart Manufacturing PowerPoint Slides make a delicious offering. The audience will be drooling for more.
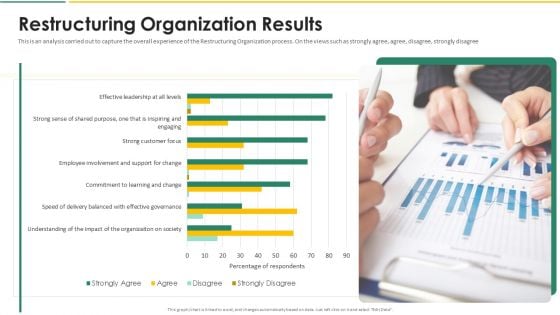
Organization Chart And Corporate Model Transformation Restructuring Organization Results Elements PDF
This is an analysis carried out to capture the overall experience of the Restructuring Organization process. On the views such as strongly agree, agree, disagree, strongly disagree. Deliver an awe inspiring pitch with this creative organization chart and corporate model transformation restructuring organization results elements pdf bundle. Topics like effective, involvement, organizations can be discussed with this completely editable template. It is available for immediate download depending on the needs and requirements of the user.
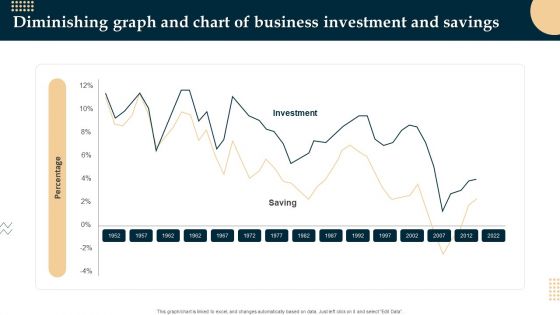
Diminishing Graph And Chart Of Business Investment And Savings Demonstration PDF
Showcasing this set of slides titled Diminishing Graph And Chart Of Business Investment And Savings Demonstration PDF. The topics addressed in these templates are Diminishing Graph, Chart Of Business Investment. All the content presented in this PPT design is completely editable. Download it and make adjustments in color, background, font etc. as per your unique business setting.
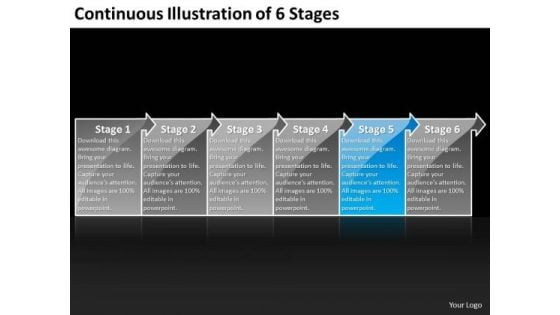
Continuous Illustration Of 6 Stages Business Create Flow Chart PowerPoint Slides
We present our continuous illustration of 6 stages business create flow chart PowerPoint Slides.Download and present our Advertising PowerPoint Templates because a lot of hard work has gone in and you are almost there. Use our Arrows PowerPoint Templates because the concept and strategy is your strength. Present our Business PowerPoint Templates because you can see clearly through to the bigger bowl ahead. Time your jump to perfection and hit the nail on the head. Download and present our Shapes PowerPoint Templates because you will be able to Highlight the various ways in which we can maintain its efficiency. Present our Flow charts PowerPoint Templates because you have the moves to sway the market.Use these PowerPoint slides for presentations relating to Arrow Background Blue Business Button Chart Diagram Goal Graphic Gray Illustration Important Management Organization Priority Process Setting Task Transparency Urgent White. The prominent colors used in the PowerPoint template are Blue light, Gray, Black. Use our continuous illustration of 6 stages business create flow chart PowerPoint Slides are Splendid. Presenters tell us our Diagram PowerPoint templates and PPT Slides are specially created by a professional team with vast experience. They diligently strive to come up with the right vehicle for your brilliant Ideas. Presenters tell us our continuous illustration of 6 stages business create flow chart PowerPoint Slides will make the presenter look like a pro even if they are not computer savvy. You can be sure our Button PowerPoint templates and PPT Slides are Pleasant. PowerPoint presentation experts tell us our continuous illustration of 6 stages business create flow chart PowerPoint Slides are Luxuriant. Professionals tell us our Chart PowerPoint templates and PPT Slides are Multicolored. Our Continuous Illustration Of 6 Stages Business Create Flow Chart PowerPoint Slides ensure approval. Your ideas will fit the bill.
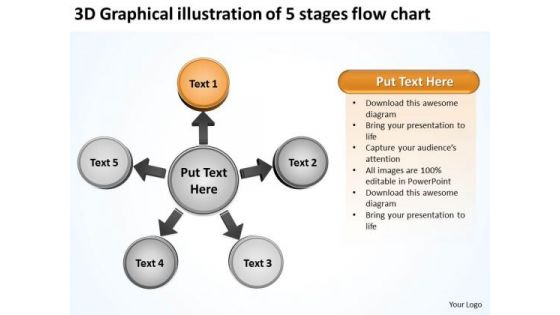
3d Graphical Illustration Of 5 Stages Flow Chart Business Cycle Motion Process PowerPoint Templates
We present our 3d graphical illustration of 5 stages flow chart business Cycle Motion Process PowerPoint templates.Download our Business PowerPoint Templates because The foundation of the structure of your business is resilient and dependable. Convey this confidence to your colleagues and assure them of a great and enduring future. Present our Circle charts PowerPoint Templates because our ready backdrops leave a lasting impression. Present our Arrows PowerPoint Templates because displaying your ideas and highlighting your ability will accelerate the growth of your company and yours. Download our Shapes PowerPoint Templates because our PowerPoint templates give this step by step process to acheive the aim. Download our Flow charts PowerPoint Templates because using this Ideas will roll along in your mind like billiard balls.Use these PowerPoint slides for presentations relating to Abstract, arrow, arrow, circle, business, concept, career, center, stage, chart, circle circle, connection, contrast, cycle, diagram, direction, flow flowchart, future, graph, icon, illustration, isolate, isolated, job, life, loop, money, motion network, recycle, refresh, ring, rotation, sick, sign, symbol, simply, target, wealth. The prominent colors used in the PowerPoint template are Tan, Gray, White. People tell us our 3d graphical illustration of 5 stages flow chart business Cycle Motion Process PowerPoint templates are Fun. PowerPoint presentation experts tell us our center PowerPoint templates and PPT Slides are Pretty. Presenters tell us our 3d graphical illustration of 5 stages flow chart business Cycle Motion Process PowerPoint templates are Exuberant. PowerPoint presentation experts tell us our center PowerPoint templates and PPT Slides are Magnificent. People tell us our 3d graphical illustration of 5 stages flow chart business Cycle Motion Process PowerPoint templates have awesome images to get your point across. People tell us our stage PowerPoint templates and PPT Slides are Chic. Clear the dust with our 3d Graphical Illustration Of 5 Stages Flow Chart Business Cycle Motion Process PowerPoint Templates. Deliver your ideas in a clear environment.
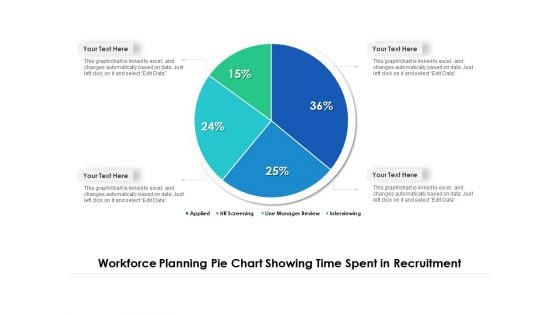
Workforce Planning Pie Chart Showing Time Spent In Recruitment Ppt PowerPoint Presentation Inspiration Information PDF
Showcasing this set of slides titled workforce planning pie chart showing time spent in recruitment ppt powerpoint presentation inspiration information pdf. The topics addressed in these templates are workforce planning pie chart showing time spent in recruitment. All the content presented in this PPT design is completely editable. Download it and make adjustments in color, background, font etc. as per your unique business setting.
ABC Analysis Chart Of Product Costs Ppt PowerPoint Presentation Icon Information PDF
Showcasing this set of slides titled abc analysis chart of product costs ppt powerpoint presentation icon information pdf. The topics addressed in these templates are abc analysis chart of product costs. All the content presented in this PPT design is completely editable. Download it and make adjustments in color, background, font etc. as per your unique business setting.
Business Quarterly Sales Pie Chart Ppt PowerPoint Presentation Icon Slides PDF
Showcasing this set of slides titled business quarterly sales pie chart ppt powerpoint presentation icon slides pdf. The topics addressed in these templates are business quarterly sales pie chart. All the content presented in this PPT design is completely editable. Download it and make adjustments in color, background, font etc. as per your unique business setting.
Employee Training Grid Chart With Status Ppt PowerPoint Presentation Icon Files PDF
Showcasing this set of slides titled employee training grid chart with status ppt powerpoint presentation icon files pdf. The topics addressed in these templates are employee training grid chart with status. All the content presented in this PPT design is completely editable. Download it and make adjustments in color, background, font etc. as per your unique business setting.
Chart Showing Financial Projection With Various Segments Ppt Professional Icon PDF
Showcasing this set of slides titled chart showing financial projection with various segments ppt professional icon pdf. The topics addressed in these templates are chart showing financial projection with various segments. All the content presented in this PPT design is completely editable. Download it and make adjustments in color, background, font etc. as per your unique business setting.
Chart Showing Performance Improvement On Voc Process Implementation Ppt PowerPoint Presentation Icon Layouts PDF
Showcasing this set of slides titled chart showing performance improvement on voc process implementation ppt powerpoint presentation icon layouts pdf. The topics addressed in these templates are chart showing performance improvement on voc process implementation. All the content presented in this PPT design is completely editable. Download it and make adjustments in color, background, font etc. as per your unique business setting.
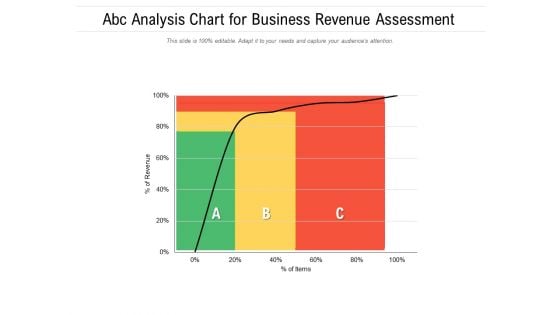
ABC Analysis Chart For Business Revenue Assessment Ppt PowerPoint Presentation Model Template PDF
Pitch your topic with ease and precision using this abc analysis chart for business revenue assessment ppt powerpoint presentation model template pdf. This layout presents information on abc analysis chart for business revenue assessment. It is also available for immediate download and adjustment. So, changes can be made in the color, design, graphics or any other component to create a unique layout.
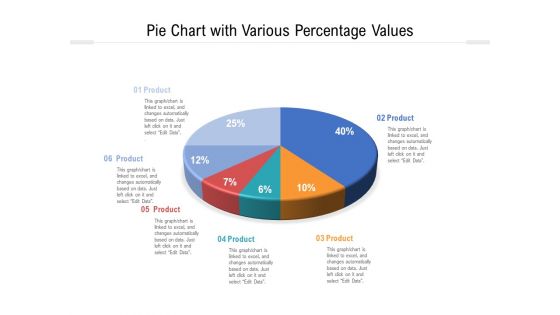
Pie Chart With Various Percentage Values Ppt PowerPoint Presentation Gallery Graphics Template PDF
Showcasing this set of slides titled pie chart with various percentage values ppt powerpoint presentation gallery graphics template pdf. The topics addressed in these templates are pie chart with various percentage values. All the content presented in this PPT design is completely editable. Download it and make adjustments in color, background, font etc. as per your unique business setting.

Business Profit Increase And Decrease Chart Due To Covid Ppt Templates PDF
Showcasing this set of slides titled business profit increase and decrease chart due to covid ppt templates pdf. The topics addressed in these templates are business profit increase and decrease chart due to covid. All the content presented in this PPT design is completely editable. Download it and make adjustments in color, background, font etc. as per your unique business setting.
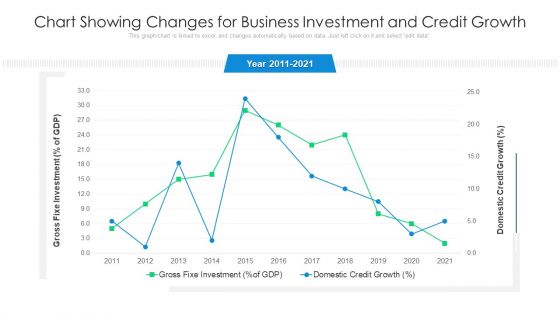
Chart Showing Changes For Business Investment And Credit Growth Ppt Infographic Template Slides PDF
Showcasing this set of slides titled chart showing changes for business investment and credit growth ppt infographic template slides pdf. The topics addressed in these templates are chart showing changes for business investment and credit growth. All the content presented in this PPT design is completely editable. Download it and make adjustments in color, background, font etc. as per your unique business setting.
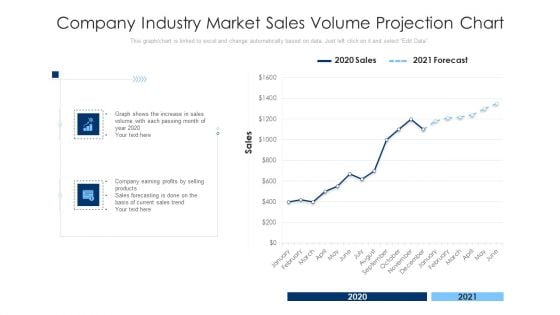
Company Industry Market Sales Volume Projection Chart Ppt PowerPoint Presentation Infographic Template Clipart PDF
Pitch your topic with ease and precision using this company industry market sales volume projection chart ppt powerpoint presentation infographic template clipart pdf. This layout presents information on company industry market sales volume projection chart. It is also available for immediate download and adjustment. So, changes can be made in the color, design, graphics or any other component to create a unique layout.
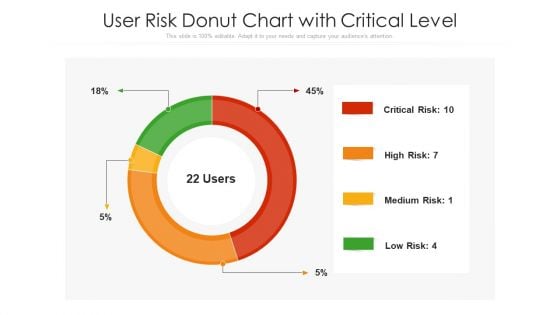
User Risk Donut Chart With Critical Level Ppt Portfolio Template PDF
Showcasing this set of slides titled user risk donut chart with critical level ppt portfolio template pdf. The topics addressed in these templates are user risk donut chart with critical level. All the content presented in this PPT design is completely editable. Download it and make adjustments in color, background, font etc. as per your unique business setting.
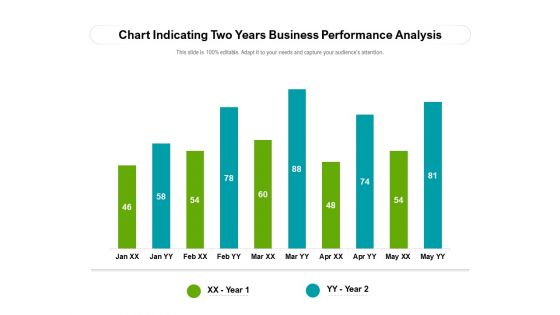
Chart Indicating Two Years Business Performance Analysis Ppt PowerPoint Presentation File Grid PDF
Showcasing this set of slides titled chart indicating two years business performance analysis ppt powerpoint presentation file grid pdf. The topics addressed in these templates are chart indicating two years business performance analysis. All the content presented in this PPT design is completely editable. Download it and make ajustments in color, background, font etc. as per your unique business setting.
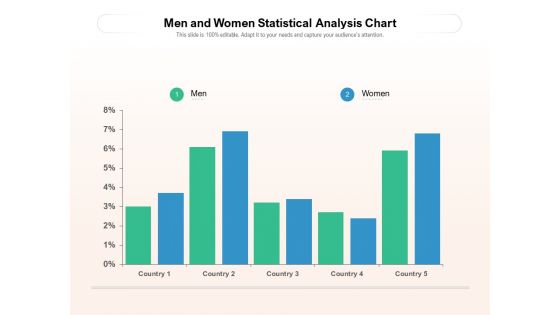
Men And Women Statistical Analysis Chart Ppt PowerPoint Presentation File Slides PDF
Showcasing this set of slides titled men and women statistical analysis chart ppt powerpoint presentation file slides pdf. The topics addressed in these templates are men and women statistical analysis chart. All the content presented in this PPT design is completely editable. Download it and make ajustments in color, background, font etc. as per your unique business setting.
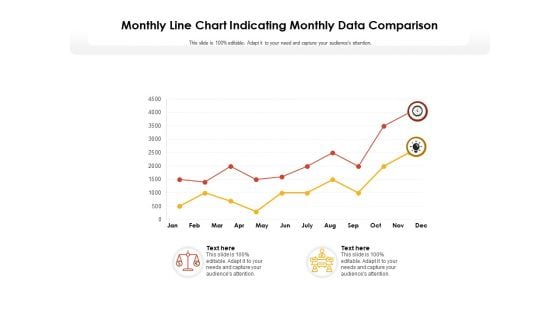
Monthly Line Chart Indicating Monthly Data Comparison Ppt PowerPoint Presentation Model Slide Portrait
Showcasing this set of slides titled monthly line chart indicating monthly data comparison ppt powerpoint presentation model slide portrait. The topics addressed in these templates are monthly line chart indicating monthly data comparison. All the content presented in this PPT design is completely editable. Download it and make adjustments in color, background, font etc. as per your unique business setting.
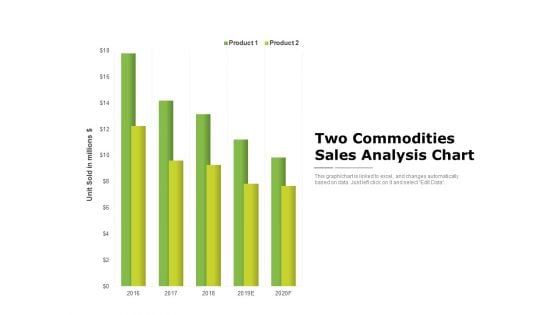
Two Commodities Sales Analysis Chart Ppt PowerPoint Presentation Ideas Inspiration PDF
Showcasing this set of slides titled two commodities sales analysis chart ppt powerpoint presentation ideas inspiration pdf. The topics addressed in these templates are two commodities sales analysis chart. All the content presented in this PPT design is completely editable. Download it and make adjustments in color, background, font etc. as per your unique business setting.
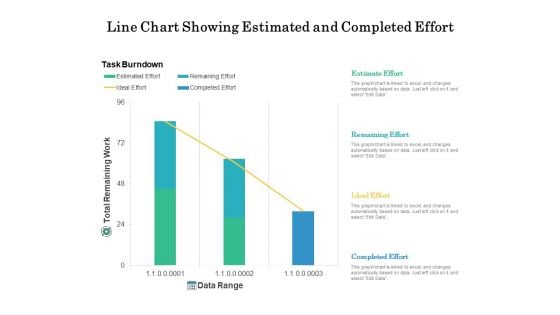
Line Chart Showing Estimated And Completed Effort Ppt PowerPoint Presentation File Show PDF
Showcasing this set of slides titled line chart showing estimated and completed effort ppt powerpoint presentation file show pdf. The topics addressed in these templates are line chart showing estimated and completed effort. All the content presented in this PPT design is completely editable. Download it and make adjustments in color, background, font etc. as per your unique business setting.
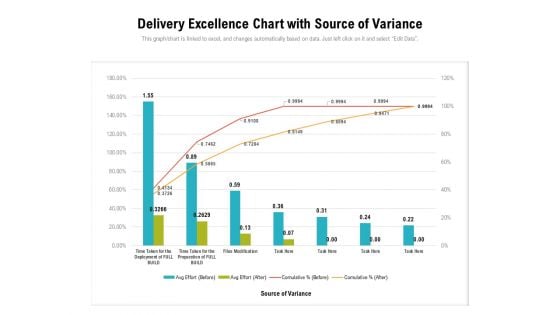
Delivery Excellence Chart With Source Of Variance Ppt PowerPoint Presentation Outline Backgrounds PDF
Showcasing this set of slides titled delivery excellence chart with source of variance ppt powerpoint presentation outline backgrounds pdf. The topics addressed in these templates are delivery excellence chart with source of variance. All the content presented in this PPT design is completely editable. Download it and make adjustments in color, background, font etc. as per your unique business setting.
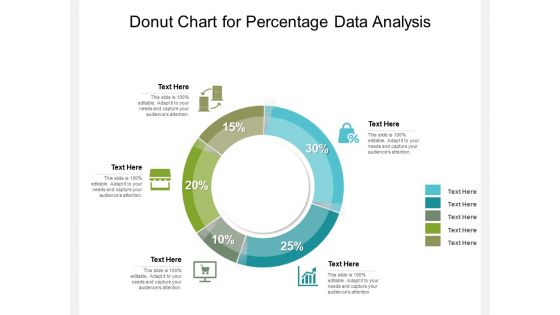
Donut Chart For Percentage Data Analysis Ppt PowerPoint Presentation Gallery Slides PDF
Showcasing this set of slides titled donut chart for percentage data analysis ppt powerpoint presentation gallery slides pdf. The topics addressed in these templates are donut chart for percentage data analysis. All the content presented in this PPT design is completely editable. Download it and make adjustments in color, background, font etc. as per your unique business setting.
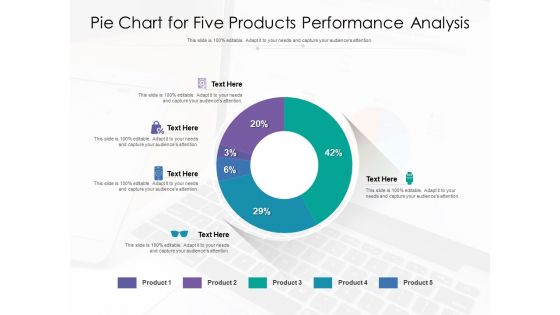
Pie Chart For Five Products Performance Analysis Ppt PowerPoint Presentation Gallery Deck PDF
Showcasing this set of slides titled pie chart for five products performance analysis ppt powerpoint presentation gallery deck pdf. The topics addressed in these templates are pie chart for five products performance analysis. All the content presented in this PPT design is completely editable. Download it and make adjustments in color, background, font etc. as per your unique business setting.

Pie Chart For Region Wise Performance Analysis Ppt PowerPoint Presentation Gallery Example PDF
Showcasing this set of slides titled pie chart for region wise performance analysis ppt powerpoint presentation gallery example pdf. The topics addressed in these templates are pie chart for region wise performance analysis. All the content presented in this PPT design is completely editable. Download it and make adjustments in color, background, font etc. as per your unique business setting.
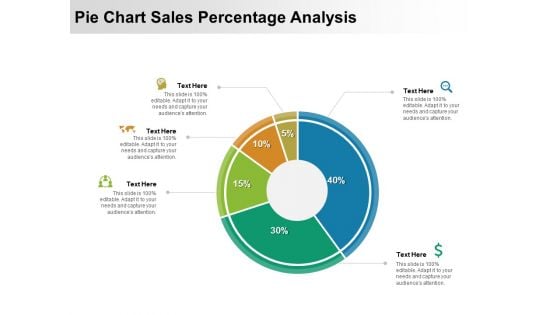
Pie Chart Sales Percentage Analysis Ppt PowerPoint Presentation Gallery Slides PDF
Showcasing this set of slides titled pie chart sales percentage analysis ppt powerpoint presentation gallery slides pdf. The topics addressed in these templates are pie chart sales percentage analysis. All the content presented in this PPT design is completely editable. Download it and make adjustments in color, background, font etc. as per your unique business setting.
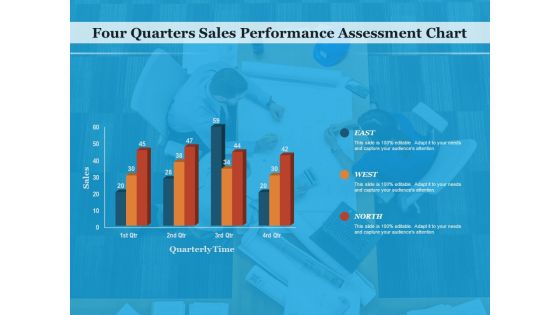
Four Quarters Sales Performance Assessment Chart Ppt PowerPoint Presentation Gallery Maker PDF
Showcasing this set of slides titled four quarters sales performance assessment chart ppt powerpoint presentation gallery maker pdf. The topics addressed in these templates are four quarters sales performance assessment chart. All the content presented in this PPT design is completely editable. Download it and make adjustments in color, background, font etc. as per your unique business setting.
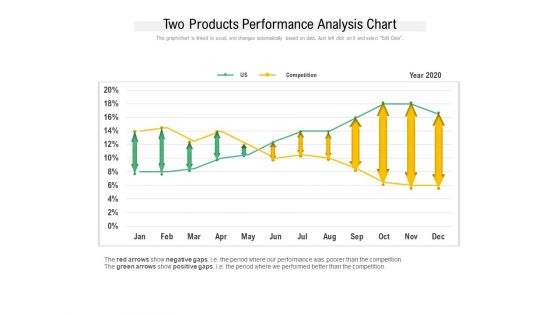
Two Products Performance Analysis Chart Ppt PowerPoint Presentation Layouts Aids PDF
Showcasing this set of slides titled two products performance analysis chart ppt powerpoint presentation layouts aids pdf. The topics addressed in these templates are competition, year 2020, two products performance, analysis chart. All the content presented in this PPT design is completely editable. Download it and make adjustments in color, background, font etc. as per your unique business setting.
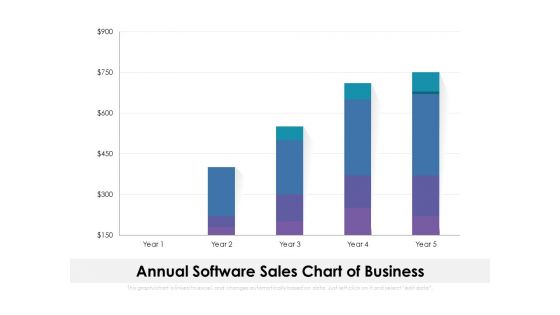
Annual Software Sales Chart Of Business Ppt PowerPoint Presentation File Example Topics PDF
Showcasing this set of slides titled annual software sales chart of business ppt powerpoint presentation file example topics pdf. The topics addressed in these templates are annual software sales chart of business. All the content presented in this PPT design is completely editable. Download it and make adjustments in color, background, font etc. as per your unique business setting.
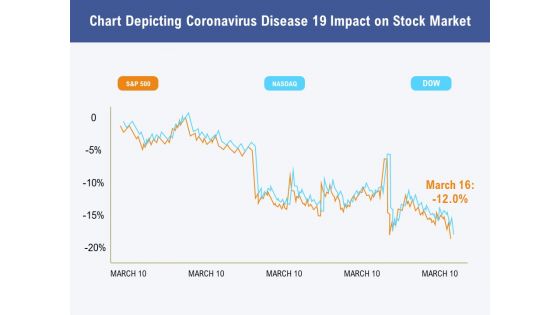
Chart Depicting Coronavirus Disease 19 Impact On Stock Market Ppt PowerPoint Presentation Inspiration Influencers PDF
Showcasing this set of slides titled chart depicting coronavirus disease 19 impact on stock market ppt powerpoint presentation inspiration influencers pdf. The topics addressed in these templates are chart depicting coronavirus disease 19 impact on stock market. All the content presented in this PPT design is completely editable. Download it and make adjustments in color, background, font etc. as per your unique business setting.
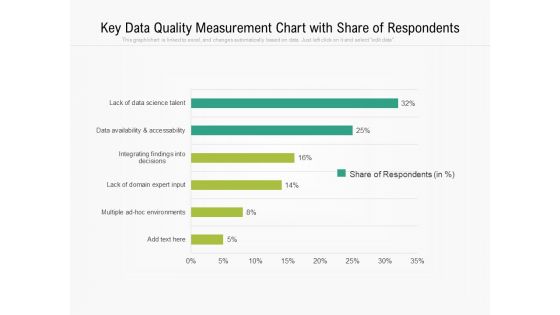
Key Data Quality Measurement Chart With Share Of Respondents Ppt PowerPoint Presentation Model Good PDF
Showcasing this set of slides titled key data quality measurement chart with share of respondents ppt powerpoint presentation model good pdf. The topics addressed in these templates are key data quality measurement chart with share of respondents. All the content presented in this PPT design is completely editable. Download it and make adjustments in color, background, font etc. as per your unique business setting.
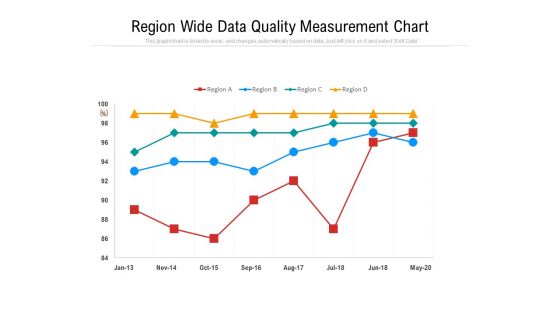
Region Wide Data Quality Measurement Chart Ppt PowerPoint Presentation Layouts Background Image PDF
Showcasing this set of slides titled region wide data quality measurement chart ppt powerpoint presentation layouts background image pdf. The topics addressed in these templates are region wide data quality measurement chart. All the content presented in this PPT design is completely editable. Download it and make adjustments in color, background, font etc. as per your unique business setting.


 Continue with Email

 Home
Home


