Org Chart
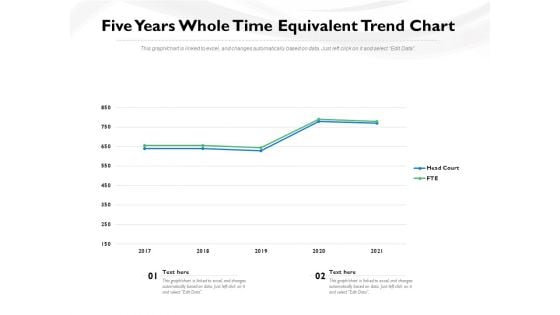
Five Years Whole Time Equivalent Trend Chart Ppt PowerPoint Presentation File Visuals PDF
Showcasing this set of slides titled five years whole time equivalent trend chart ppt powerpoint presentation file visuals pdf. The topics addressed in these templates are five years whole time equivalent trend chart. All the content presented in this PPT design is completely editable. Download it and make adjustments in color, background, font etc. as per your unique business setting.
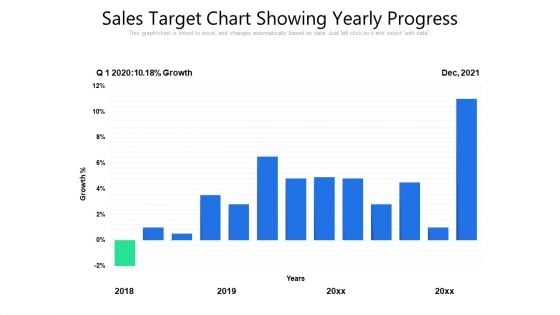
Sales Target Chart Showing Yearly Progress Ppt PowerPoint Presentation Gallery Vector PDF
Showcasing this set of slides titled sales target chart showing yearly progress ppt powerpoint presentation gallery vector pdf. The topics addressed in these templates are sales target chart showing yearly progress. All the content presented in this PPT design is completely editable. Download it and make adjustments in color, background, font etc. as per your unique business setting.
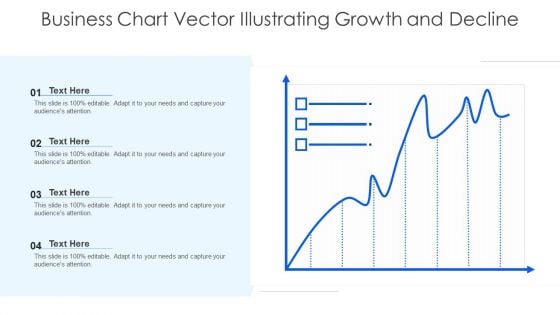
Business Chart Vector Illustrating Growth And Decline Ppt Pictures Deck PDF
Showcasing this set of slides titled business chart vector illustrating growth and decline ppt pictures deck pdf. The topics addressed in these templates are business chart vector illustrating growth and decline . All the content presented in this PPT design is completely editable. Download it and make adjustments in color, background, font etc. as per your unique business setting.
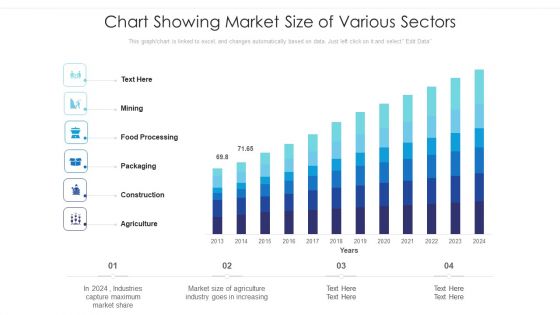
Chart Showing Market Size Of Various Sectors Ppt PowerPoint Presentation Pictures Background Image PDF
Showcasing this set of slides titled chart showing market size of various sectors ppt powerpoint presentation pictures background image pdf. The topics addressed in these templates are chart showing market size of various sectors. All the content presented in this PPT design is completely editable. Download it and make adjustments in color, background, font etc. as per your unique business setting.
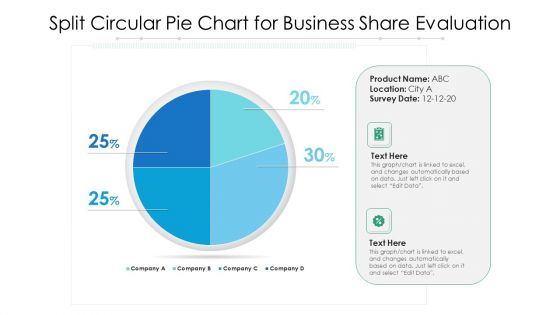
Split Circular Pie Chart For Business Share Evaluation Ppt PowerPoint Presentation Show Inspiration PDF
Showcasing this set of slides titled split circular pie chart for business share evaluation ppt powerpoint presentation show inspiration pdf. The topics addressed in these templates are split circular pie chart for business share evaluation. All the content presented in this PPT design is completely editable. Download it and make adjustments in color, background, font etc. as per your unique business setting.
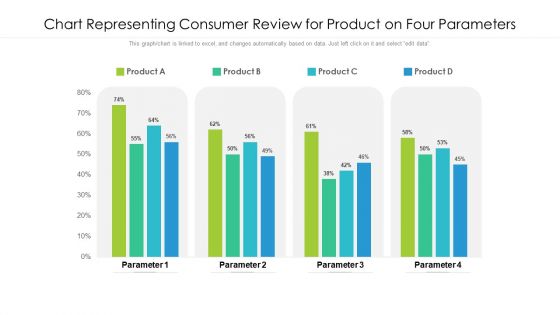
Chart Representing Consumer Review For Product On Four Parameters Ppt Layouts Pictures PDF
Showcasing this set of slides titled chart representing consumer review for product on four parameters ppt layouts pictures pdf. The topics addressed in these templates are chart representing consumer review for product on four parameters. All the content presented in this PPT design is completely editable. Download it and make adjustments in color, background, font etc. as per your unique business setting.
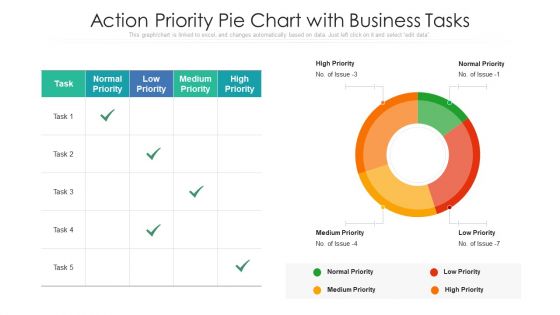
Action Priority Pie Chart With Business Tasks Ppt Professional Layouts PDF
Showcasing this set of slides titled action priority pie chart with business tasks ppt professional layouts pdf. The topics addressed in these templates are action priority pie chart with business tasks. All the content presented in this PPT design is completely editable. Download it and make adjustments in color, background, font etc. as per your unique business setting.
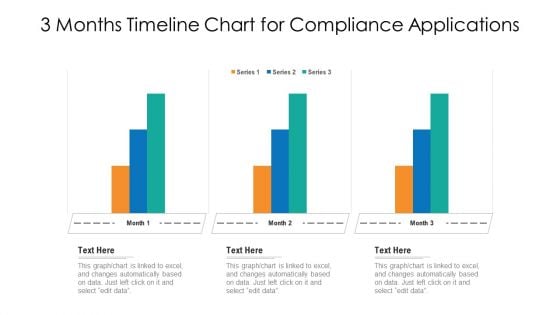
3 Months Timeline Chart For Compliance Applications Ppt PowerPoint Presentation File Professional PDF
Showcasing this set of slides titled 3 months timeline chart for compliance applications ppt powerpoint presentation file professional pdf. The topics addressed in these templates are 3 months timeline chart for compliance applications. All the content presented in this PPT design is completely editable. Download it and make adjustments in color, background, font etc. as per your unique business setting.
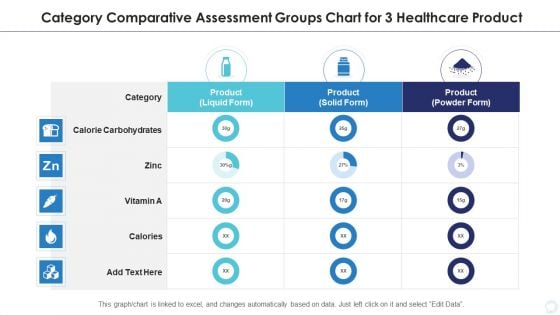
Category Comparative Assessment Groups Chart For 3 Healthcare Product Infographics PDF
Showcasing this set of slides titled category comparative assessment groups chart for 3 healthcare product infographics pdf. The topics addressed in these templates are category comparative assessment groups chart for 3 healthcare product. All the content presented in this PPT design is completely editable. Download it and make adjustments in color, background, font etc. as per your unique business setting.
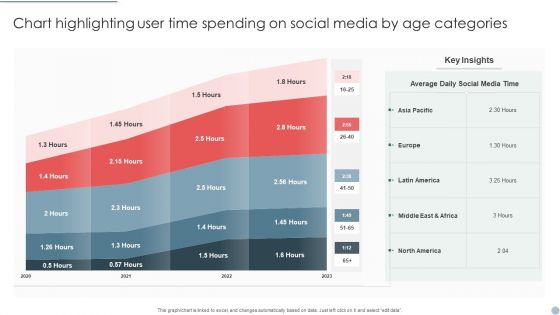
Chart Highlighting User Time Spending On Social Media By Age Categories Elements PDF
Showcasing this set of slides titled Chart Highlighting User Time Spending On Social Media By Age Categories Elements PDF. The topics addressed in these templates are Chart Highlighting User, Time Spending Social Media, Age Categories. All the content presented in this PPT design is completely editable. Download it and make adjustments in color, background, font etc. as per your unique business setting.

Stacked Column Chart Of Revenue Split Of Cosmetic Products Mockup PDF
Showcasing this set of slides titled Stacked Column Chart Of Revenue Split Of Cosmetic Products Mockup PDF. The topics addressed in these templates are Stacked Column, Chart Revenue, Split Cosmetic Products. All the content presented in this PPT design is completely editable. Download it and make adjustments in color, background, font etc. as per your unique business setting.
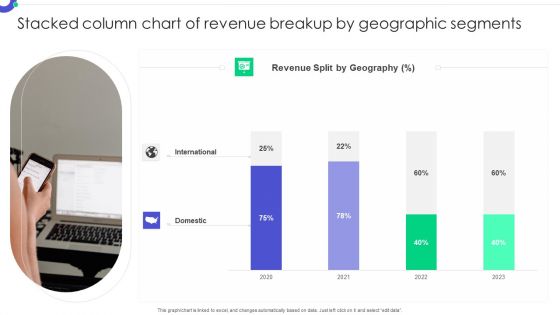
Stacked Column Chart Of Revenue Breakup By Geographic Segments Microsoft PDF
Showcasing this set of slides titled Stacked Column Chart Of Revenue Breakup By Geographic Segments Microsoft PDF. The topics addressed in these templates are Stacked Column, Chart Revenue, Breakup Geographic. All the content presented in this PPT design is completely editable. Download it and make adjustments in color, background, font etc. as per your unique business setting.
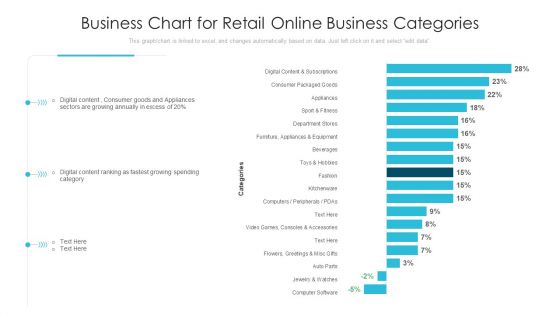
Business Chart For Retail Online Business Categories Ppt PowerPoint Presentation Infographics Diagrams PDF
Pitch your topic with ease and precision using this business chart for retail online business categories ppt powerpoint presentation infographics diagrams pdf. This layout presents information on business chart for retail online business categories. It is also available for immediate download and adjustment. So, changes can be made in the color, design, graphics or any other component to create a unique layout.
Business Statistic Chart With Expansion And Reduction Icon Ppt Visual Aids Ideas PDF
Pitch your topic with ease and precision using this business statistic chart with expansion and reduction icon ppt visual aids ideas pdf. This layout presents information on business statistic chart with expansion and reduction icon. It is also available for immediate download and adjustment. So, changes can be made in the color, design, graphics or any other component to create a unique layout.
Line Chart Showing Four Products Performance Ppt PowerPoint Presentation Icon Slideshow PDF
Pitch your topic with ease and precision using this line chart showing four products performance ppt powerpoint presentation icon slideshow pdf. This layout presents information on line chart showing four products performance. It is also available for immediate download and adjustment. So, changes can be made in the color, design, graphics or any other component to create a unique layout.
Pie Chart Showing Online Business Sales Analysis Ppt PowerPoint Presentation File Icons PDF
Pitch your topic with ease and precision using this pie chart showing online business sales analysis ppt powerpoint presentation file icons pdf. This layout presents information on pie chart showing online business sales analysis. It is also available for immediate download and adjustment. So, changes can be made in the color, design, graphics or any other component to create a unique layout.
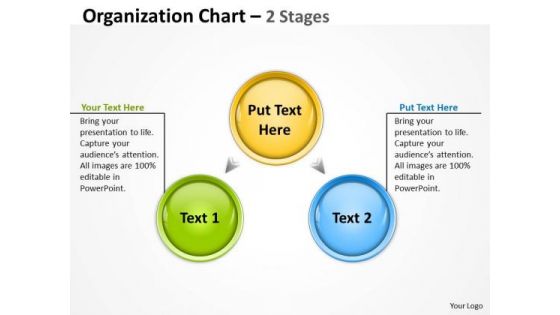
Business Finance Strategy Development Organization Plan Chart Mba Models And Frameworks
Delight Them With Our Business Finance Strategy Development Organization Plan Chart MBA models and frameworks Powerpoint Templates. Your Audience Will Be Ecstatic. Our Business Finance Strategy Development Organization Plan Chart MBA models and frameworks Powerpoint Templates Are Created Cost Effective. They Understand The Need For Economy.
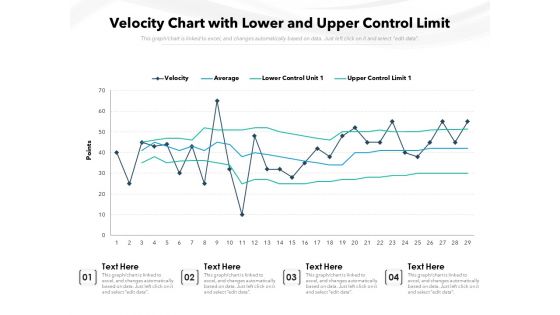
Velocity Chart With Lower And Upper Control Limit Ppt PowerPoint Presentation Gallery Infographics PDF
Pitch your topic with ease and precision using this velocity chart with lower and upper control limit ppt powerpoint presentation gallery infographics pdf. This layout presents information on velocity chart with lower and upper control limit. It is also available for immediate download and adjustment. So, changes can be made in the color, design, graphics or any other component to create a unique layout.
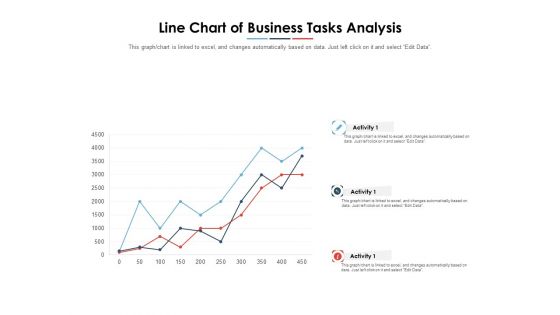
Line Chart Of Business Tasks Analysis Ppt PowerPoint Presentation Layouts Skills PDF
Pitch your topic with ease and precision using this line chart of business tasks analysis ppt powerpoint presentation layouts skills pdf. This layout presents information on line chart of business tasks analysis. It is also available for immediate download and adjustment. So, changes can be made in the color, design, graphics or any other component to create a unique layout.
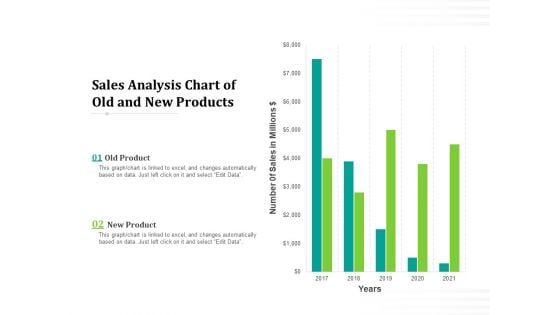
Sales Analysis Chart Of Old And New Products Ppt PowerPoint Presentation Professional Influencers PDF
Pitch your topic with ease and precision using this sales analysis chart of old and new products ppt powerpoint presentation professional influencers pdf. This layout presents information on sales analysis chart of old and new products. It is also available for immediate download and adjustment. So, changes can be made in the color, design, graphics or any other component to create a unique layout.
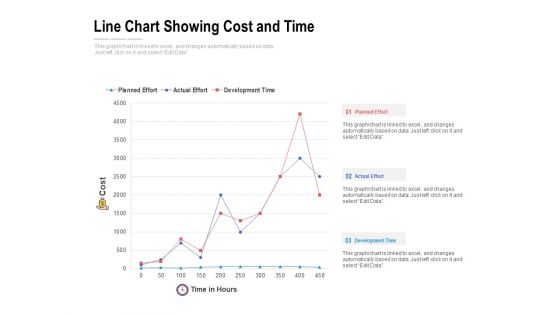
Line Chart Showing Cost And Time Ppt PowerPoint Presentation File Example Topics PDF
Pitch your topic with ease and precision using this line chart showing cost and time ppt powerpoint presentation file example topics pdf. This layout presents information on line chart showing cost and time. It is also available for immediate download and adjustment. So, changes can be made in the color, design, graphics or any other component to create a unique layout.
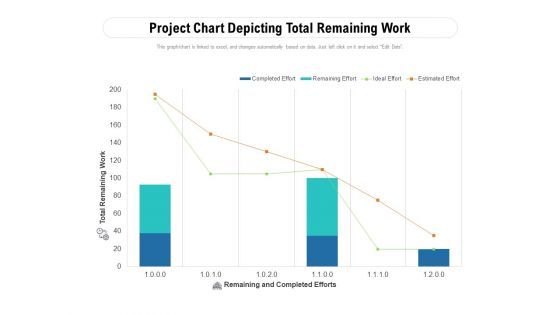
Project Chart Depicting Total Remaining Work Ppt PowerPoint Presentation File Slides PDF
Pitch your topic with ease and precision using this project chart depicting total remaining work ppt powerpoint presentation file slides pdf. This layout presents information on project chart depicting total remaining work. It is also available for immediate download and adjustment. So, changes can be made in the color, design, graphics or any other component to create a unique layout.
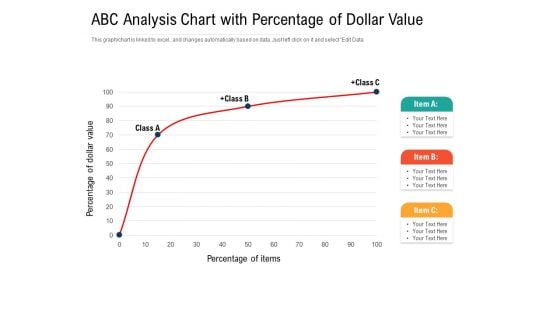
ABC Analysis Chart With Percentage Of Dollar Value Ppt PowerPoint Presentation Gallery Portfolio PDF
Pitch your topic with ease and precision using this abc analysis chart with percentage of dollar value ppt powerpoint presentation gallery portfolio pdf. This layout presents information on abc analysis chart with percentage of dollar value. It is also available for immediate download and adjustment. So, changes can be made in the color, design, graphics or any other component to create a unique layout.

Sales Monthly Trends Analysis Chart Ppt Powerpoint Presentation Gallery Objects Pdf
Pitch your topic with ease and precision using this sales monthly trends analysis chart ppt powerpoint presentation gallery objects pdf. This layout presents information on sales monthly trends analysis chart. It is also available for immediate download and adjustment. So, changes can be made in the color, design, graphics or any other component to create a unique layout.
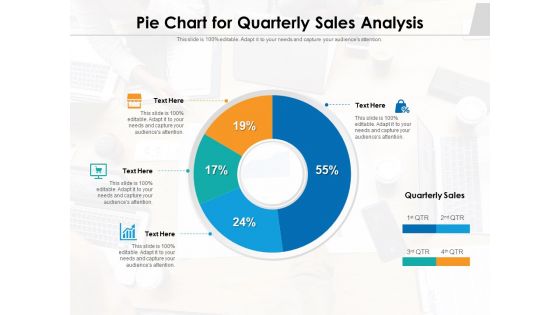
Pie Chart For Quarterly Sales Analysis Ppt PowerPoint Presentation File Outfit PDF
Pitch your topic with ease and precision using this pie chart for quarterly sales analysis ppt powerpoint presentation file outfit pdf. This layout presents information on pie chart for quarterly sales analysis. It is also available for immediate download and adjustment. So, changes can be made in the color, design, graphics or any other component to create a unique layout.

Pie Chart For Regional Analysis Ppt PowerPoint Presentation Gallery Example PDF
Pitch your topic with ease and precision using this pie chart for regional analysis ppt powerpoint presentation gallery example pdf. This layout presents information on pie chart for regional analysis. It is also available for immediate download and adjustment. So, changes can be made in the color, design, graphics or any other component to create a unique layout.
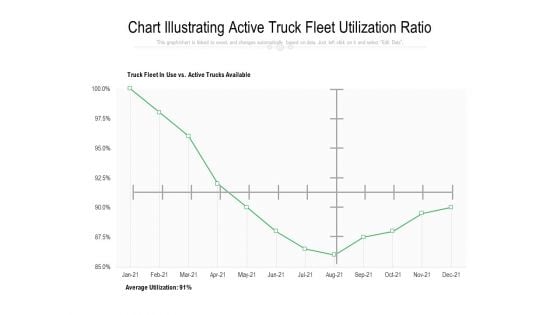
Chart Illustrating Active Truck Fleet Utilization Ratio Ppt PowerPoint Presentation Styles Graphics Pictures PDF
Pitch your topic with ease and precision using this chart illustrating active truck fleet utilization ratio ppt powerpoint presentation styles graphics pictures pdf. This layout presents information on chart illustrating active truck fleet utilization ratio. It is also available for immediate download and adjustment. So, changes can be made in the color, design, graphics or any other component to create a unique layout.

Two Products Comparison Stacked Chart Ppt PowerPoint Presentation Gallery Structure PDF
Pitch your topic with ease and precision using this two products comparison stacked chart ppt powerpoint presentation gallery structure pdf. This layout presents information on two products comparison stacked chart. It is also available for immediate download and adjustment. So, changes can be made in the color, design, graphics or any other component to create a unique layout.
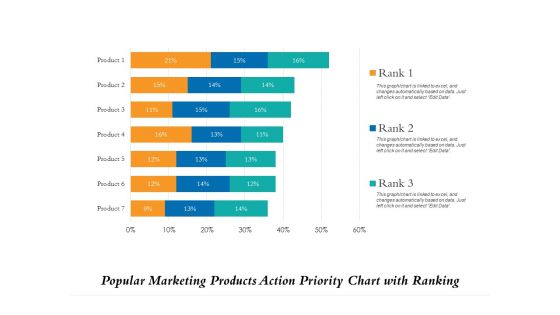
Popular Marketing Products Action Priority Chart With Ranking Ppt PowerPoint Presentation File Demonstration PDF
Pitch your topic with ease and precision using this popular marketing products action priority chart with ranking ppt powerpoint presentation file demonstration pdf. This layout presents information on popular marketing products action priority chart with ranking. It is also available for immediate download and adjustment. So, changes can be made in the color, design, graphics or any other component to create a unique layout.
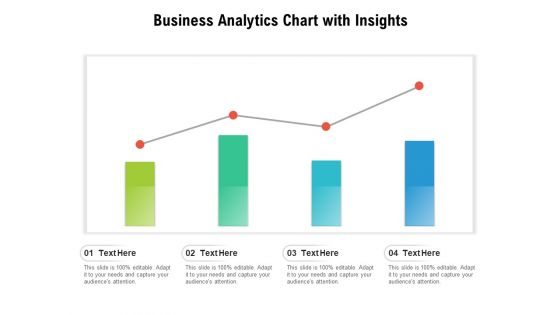
Business Analytics Chart With Insights Ppt PowerPoint Presentation Slides Guidelines PDF
Pitch your topic with ease and precision using this business analytics chart with insights ppt powerpoint presentation slides guidelines pdf. This layout presents information on business analytics chart with insights. It is also available for immediate download and adjustment. So, changes can be made in the color, design, graphics or any other component to create a unique layout.
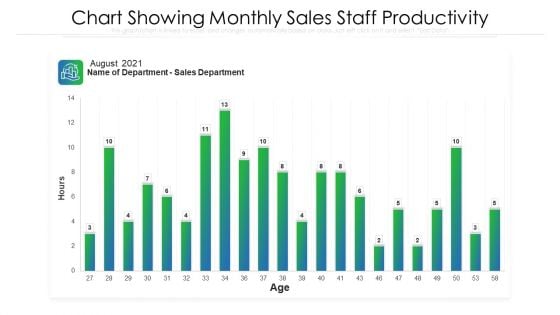
Chart Showing Monthly Sales Staff Productivity Ppt PowerPoint Presentation File Images PDF
Pitch your topic with ease and precision using this chart showing monthly sales staff productivity ppt powerpoint presentation file images pdf. This layout presents information on chart showing monthly sales staff productivity. It is also available for immediate download and adjustment. So, changes can be made in the color, design, graphics or any other component to create a unique layout.
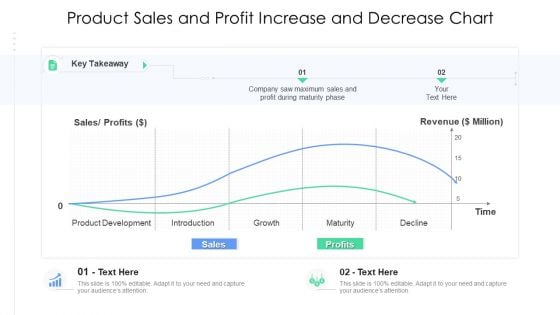
Product Sales And Profit Increase And Decrease Chart Ppt Show PDF
Pitch your topic with ease and precision using this product sales and profit increase and decrease chart ppt show pdf. This layout presents information on product sales and profit increase and decrease chart. It is also available for immediate download and adjustment. So, changes can be made in the color, design, graphics or any other component to create a unique layout.
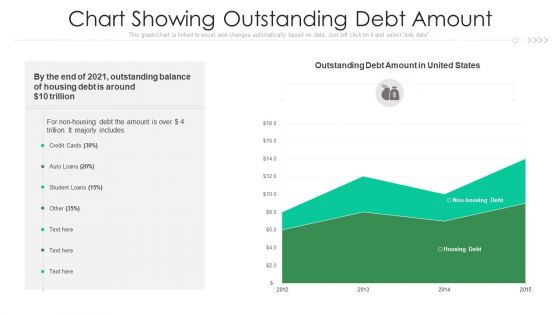
Chart Showing Outstanding Debt Amount Ppt PowerPoint Presentation Outline Background PDF
Pitch your topic with ease and precision using this chart showing outstanding debt amount ppt powerpoint presentation outline background pdf. This layout presents information on chart showing outstanding debt amount. It is also available for immediate download and adjustment. So, changes can be made in the color, design, graphics or any other component to create a unique layout.
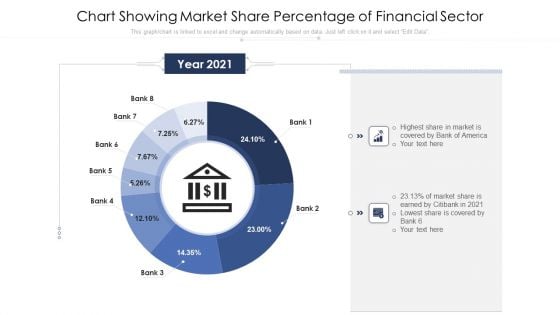
Chart Showing Market Share Percentage Of Financial Sector Ppt PowerPoint Presentation Show Guide PDF
Pitch your topic with ease and precision using this chart showing market share percentage of financial sector ppt powerpoint presentation show guide pdf. This layout presents information on chart showing market share percentage of financial sector. It is also available for immediate download and adjustment. So, changes can be made in the color, design, graphics or any other component to create a unique layout.
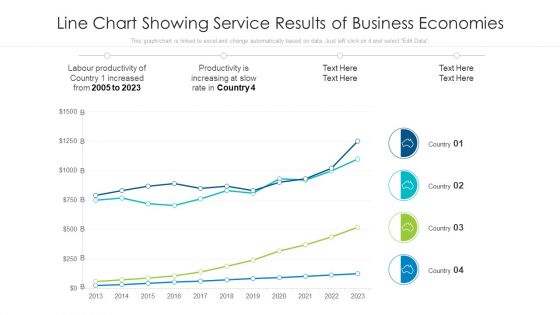
Line Chart Showing Service Results Of Business Economies Ppt PowerPoint Presentation Model Tips PDF
Pitch your topic with ease and precision using this line chart showing service results of business economies ppt powerpoint presentation model tips pdf. This layout presents information on line chart showing service results of business economies. It is also available for immediate download and adjustment. So, changes can be made in the color, design, graphics or any other component to create a unique layout.
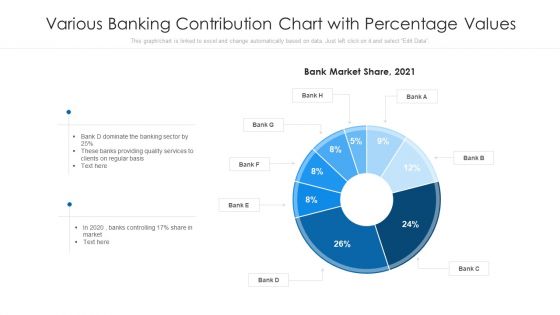
Various Banking Contribution Chart With Percentage Values Ppt PowerPoint Presentation Visual Aids Deck PDF
Pitch your topic with ease and precision using this various banking contribution chart with percentage values ppt powerpoint presentation visual aids deck pdf This layout presents information on various banking contribution chart with percentage values. It is also available for immediate download and adjustment. So, changes can be made in the color, design, graphics or any other component to create a unique layout.
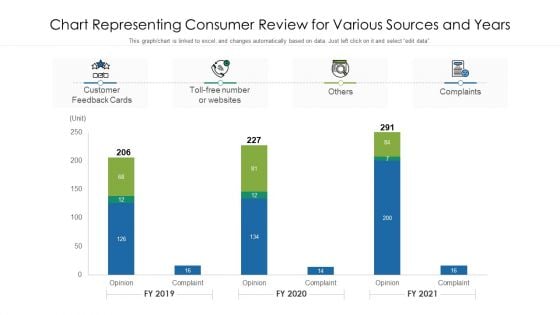
Chart Representing Consumer Review For Various Sources And Years Ppt Summary Background PDF
Pitch your topic with ease and precision using this chart representing consumer review for various sources and years ppt summary background pdf. This layout presents information on chart representing consumer review for various sources and years. It is also available for immediate download and adjustment. So, changes can be made in the color, design, graphics or any other component to create a unique layout.
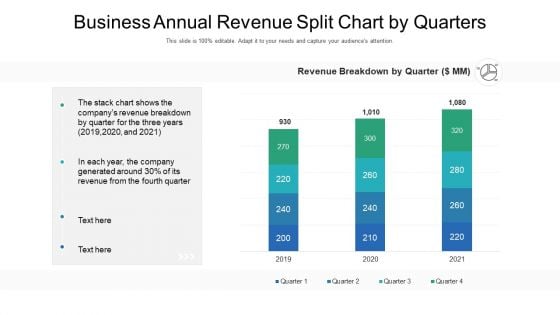
Business Annual Revenue Split Chart By Quarters Ppt PowerPoint Presentation Background Image PDF
Pitch your topic with ease and precision using this business annual revenue split chart by quarters ppt powerpoint presentation background image pdf. This layout presents information on business annual revenue split chart by quarters. It is also available for immediate download and adjustment. So, changes can be made in the color, design, graphics or any other component to create a unique layout.
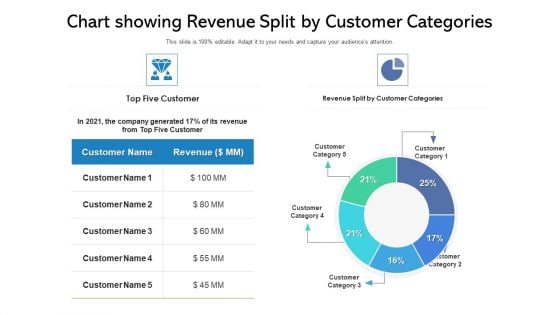
Chart Showing Revenue Split By Customer Categories Ppt PowerPoint Presentation Show Smartart PDF
Pitch your topic with ease and precision using this chart showing revenue split by customer categories ppt powerpoint presentation show smartart pdf. This layout presents information on chart showing revenue split by customer categories. It is also available for immediate download and adjustment. So, changes can be made in the color, design, graphics or any other component to create a unique layout.
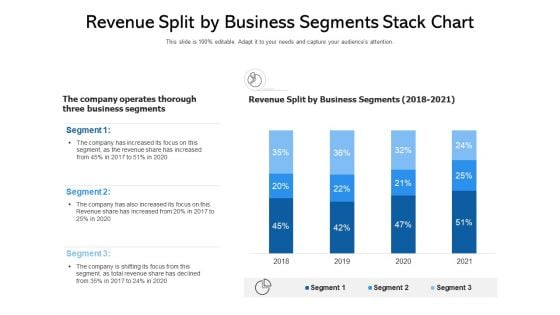
Revenue Split By Business Segments Stack Chart Ppt PowerPoint Presentation Ideas Sample PDF
Pitch your topic with ease and precision using this revenue split by business segments stack chart ppt powerpoint presentation ideas sample pdf. This layout presents information on revenue split by business segments stack chart. It is also available for immediate download and adjustment. So, changes can be made in the color, design, graphics or any other component to create a unique layout.
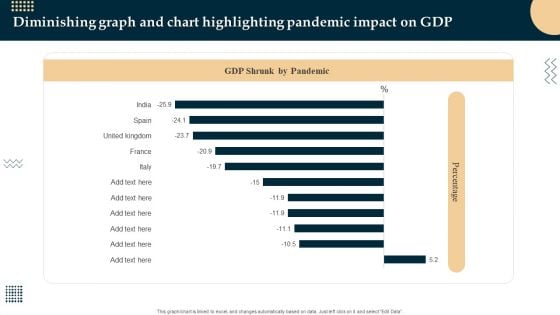
Diminishing Graph And Chart Highlighting Pandemic Impact On GDP Sample PDF
Pitch your topic with ease and precision using this Diminishing Graph And Chart Highlighting Pandemic Impact On GDP Sample PDF. This layout presents information on Diminishing Graph, Chart Highlighting Pandemic. It is also available for immediate download and adjustment. So, changes can be made in the color, design, graphics or any other component to create a unique layout.
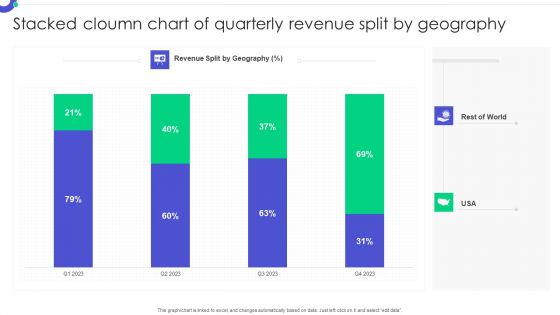
Stacked Cloumn Chart Of Quarterly Revenue Split By Geography Pictures PDF
Pitch your topic with ease and precision using this Stacked Cloumn Chart Of Quarterly Revenue Split By Geography Pictures PDF. This layout presents information on Stacked Column, Chart Quarterly, Revenue Split. It is also available for immediate download and adjustment. So, changes can be made in the color, design, graphics or any other component to create a unique layout.
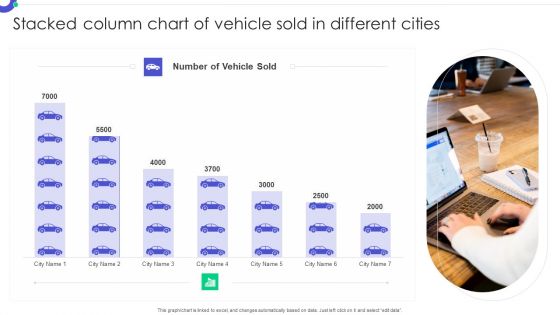
Stacked Column Chart Of Vehicle Sold In Different Cities Formats PDF
Pitch your topic with ease and precision using this Stacked Column Chart Of Vehicle Sold In Different Cities Formats PDF. This layout presents information on Stacked Column, Chart Vehicle, Sold Different Cities. It is also available for immediate download and adjustment. So, changes can be made in the color, design, graphics or any other component to create a unique layout.
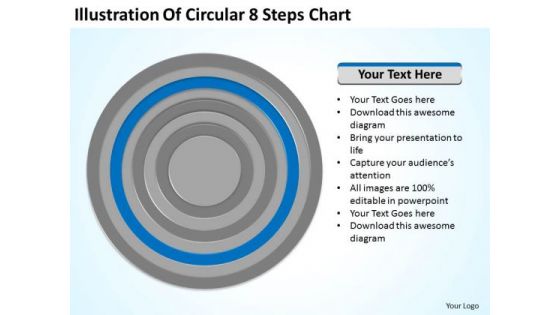
Circular 8 Steps Chart Ppt Executive Business Plan Template PowerPoint Slides
We present our circular 8 steps chart ppt executive business plan template PowerPoint Slides.Download and present our Circle Charts PowerPoint Templates because It can be used to Set your controls for the heart of the sun. Our PowerPoint Templates and Slides will be the propellant to get you there. Download and present our Flow Charts PowerPoint Templates because Our PowerPoint Templates and Slides have the Brilliant backdrops. Guaranteed to illuminate the minds of your audience. Use our Business PowerPoint Templates because They will Put the wind in your sails. Skim smoothly over the choppy waters of the market. Present our Process and Flows PowerPoint Templates because Our PowerPoint Templates and Slides will provide you the cutting edge. Slice through the doubts in the minds of your listeners. Present our Shapes PowerPoint Templates because Our PowerPoint Templates and Slides will let you Leave a lasting impression to your audiences. They possess an inherent longstanding recall factor.Use these PowerPoint slides for presentations relating to Shape, vector, process, arrow, chart, form, special, corporate, order, business, concept, bright, symbol,, circle, match, usable, graphic, element, different, abstract, cycle, creative, illustration, piece, connection, frame, web, solution, design, group, color, blue, text, empty, banner, access, part, background, conceptual, . The prominent colors used in the PowerPoint template are Blue, Gray, Black. Make sensational presentations with our Circular 8 Steps Chart Ppt Executive Business Plan Template PowerPoint Slides. You'll always stay ahead of the game.
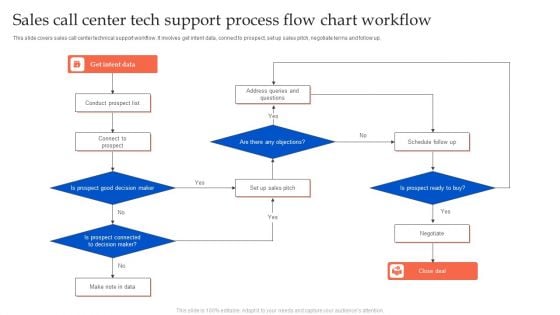
Sales Call Center Tech Support Process Flow Chart Workflow Microsoft PDF
This slide covers sales call center technical support workflow. It involves get intent data, connect to prospect, set up sales pitch, negotiate terms and follow up. Persuade your audience using this Sales Call Center Tech Support Process Flow Chart Workflow Microsoft PDF. This PPT design covers three stages, thus making it a great tool to use. It also caters to a variety of topics including Conduct Prospect List, Connect To Prospect, Schedule Follow Up. Download this PPT design now to present a convincing pitch that not only emphasizes the topic but also showcases your presentation skills.

Ppt Edit Data PowerPoint Chart Processing Cycle Diagram 4 State Templates
PPT edit data powerpoint chart processing cycle diagram 4 state Templates-The above template has the theme of circular process Diagram. This image refers the concept of Act Cycle. Adjust the above image in your PPT presentations to visually support your content in your business meetings. This PPT images is so perfectly designed that it make your clients understand the business idea quickly and visually.-PPT edit data powerpoint chart processing cycle diagram 4 state Templates-Arrow, Chart, Circular, Color, Colorful, Connect, Connection, Design, Diagram, Finance, Graphic, Group, Growth, Icon, Illustration, Marketing, Pieces, Process, Recycle, Recycling, Round, Set, Strategy, Symbol, Wheel Audience approval is always sought after. Our Ppt Edit Data PowerPoint Chart Processing Cycle Diagram 4 State Templates will fetch it for you.
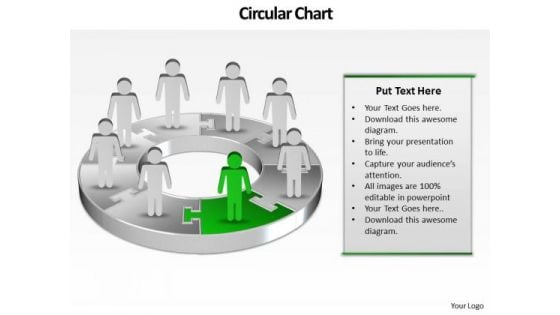
Ppt Pie Family Tree Chart PowerPoint 2003 Person Standing Green Piece Templates
PPT pie family tree chart PowerPoint 2003 person standing green piece Templates-The above Diagram displays a picture of eight circular text boxes placed in sequential manner. This image has been professionally designed to emphasize the concept of Operations performed in Circular process. Adjust the above image in your PPT presentations to visually support your content in your Business PPT slideshows.-PPT pie family tree chart PowerPoint 2003 person standing green piece Templates-arrow, bar, business, businessman, candidate, cartoon, character, chart, circle, circular, client, communication, company, concept, diagram, finance, financial, flow, growth, human, illustration, increase, information, iteration, man, market, marketing, process, processing, profit, sales, statistics, stats, success, target Embrace your dreams with our Ppt Pie Family Tree Chart PowerPoint 2003 Person Standing Green Piece Templates. They will come within your grasp.
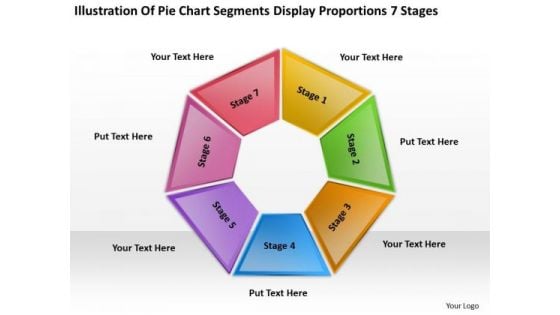
Pie Chart Segments Display Proportions 7 Stages Build Business Plan PowerPoint Slides
We present our pie chart segments display proportions 7 stages build business plan PowerPoint Slides.Download our Flow Charts PowerPoint Templates because Our PowerPoint Templates and Slides will Activate the energies of your audience. Get their creative juices flowing with your words. Download our Circle Charts PowerPoint Templates because You are working at that stage with an air of royalty. Let our PowerPoint Templates and Slides be the jewels in your crown. Present our Marketing PowerPoint Templates because It will let you Set new benchmarks with our PowerPoint Templates and Slides. They will keep your prospects well above par. Download our Process and Flows PowerPoint Templates because Our PowerPoint Templates and Slides are truly out of this world. Even the MIB duo has been keeping tabs on our team. Use our Business PowerPoint Templates because It will let you Set new benchmarks with our PowerPoint Templates and Slides. They will keep your prospects well above par.Use these PowerPoint slides for presentations relating to Design, color, background, layout, concept, vector, abstract, rectangle, advertise, business, blank, spectrum, presentation, bright, template, brochure, element, multicolor, marketing, shape, creative, illustration, object, decorative, composition, organization, banner, art, gradient. The prominent colors used in the PowerPoint template are Red, Yellow, Pink. Head in the right direction with our Pie Chart Segments Display Proportions 7 Stages Build Business Plan PowerPoint Slides. Try us out and see what a difference our templates make.
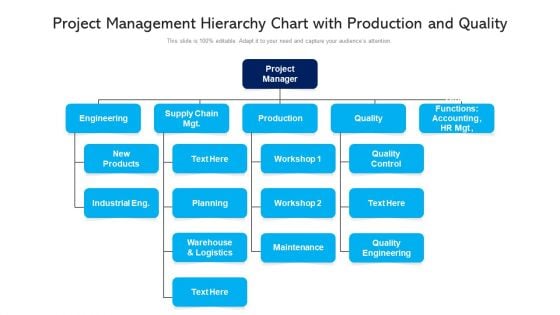
Project Management Hierarchy Chart With Production And Quality Ppt PowerPoint Presentation Outline Templates PDF
Presenting project management hierarchy chart with production and quality ppt powerpoint presentation outline templates pdf to dispense important information. This template comprises five stages. It also presents valuable insights into the topics including project management hierarchy chart with production and quality. This is a completely customizable PowerPoint theme that can be put to use immediately. So, download it and address the topic impactfully.
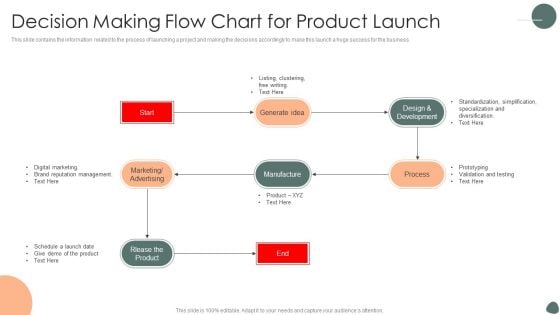
Decision Making Flow Chart For Product Launch Ppt Infographic Template Picture PDF
This slide contains the information related to the process of launching a project and making the decisions accordingly to make this launch a huge success for the business. Presenting Decision Making Flow Chart For Product Launch Ppt Infographic Template Picture PDF to dispense important information. This template comprises one stages. It also presents valuable insights into the topics including Generate Idea, Manufacture, Marketing, Advertising. This is a completely customizable PowerPoint theme that can be put to use immediately. So, download it and address the topic impactfully.
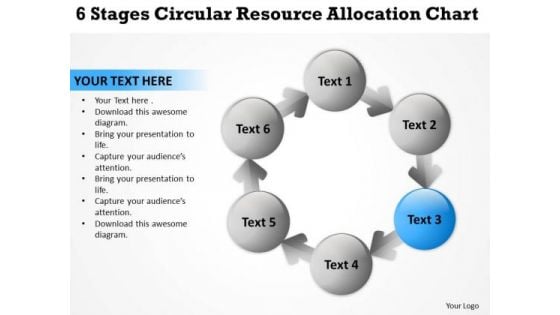
6 Stages Circular Resource Allocation Chart Business Plan Download PowerPoint Slides
We present our 6 stages circular resource allocation chart business plan download PowerPoint Slides.Use our Circle Charts PowerPoint Templates because Our PowerPoint Templates and Slides are conceived by a dedicated team. Use them and give form to your wondrous ideas. Download our Arrows PowerPoint Templates because Our PowerPoint Templates and Slides will bullet point your ideas. See them fall into place one by one. Download and present our Flows Charts PowerPoint Templates because They will Put your wonderful verbal artistry on display. Our PowerPoint Templates and Slides will provide you the necessary glam and glitter. Use our Business PowerPoint Templates because You should Bet on your luck with our PowerPoint Templates and Slides. Be assured that you will hit the jackpot. Download and present our Process and Flows PowerPoint Templates because Our PowerPoint Templates and Slides are innately eco-friendly. Their high recall value negate the need for paper handouts.Use these PowerPoint slides for presentations relating to Abstract, arrow, art, background, ball, blue, business, button, chart, circle, circular, clip, company, concept, cycle, diagram, edit, editable, element, green, guide,icon, leader, management, marketing, model, numbers, organization, plans, point, presentation, purple, red, report, representation, seven, sphere, stakeholder,team, text, tool, vector, white. The prominent colors used in the PowerPoint template are Blue, Gray, White. Get the dynamics correct with our PT&s. Your thoughts will initiate the right moves.
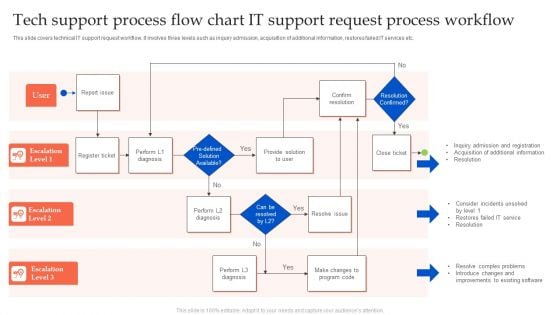
Tech Support Process Flow Chart It Support Request Process Workflow Download PDF
This slide covers technical IT support request workflow. It involves three levels such as inquiry admission, acquisition of additional information, restores failed IT services etc. Presenting Tech Support Process Flow Chart It Support Request Process Workflow Download PDF to dispense important information. This template comprises three stages. It also presents valuable insights into the topics including Register Ticket, Provide Solution, Confirm Resolution. This is a completely customizable PowerPoint theme that can be put to use immediately. So, download it and address the topic impactfully.
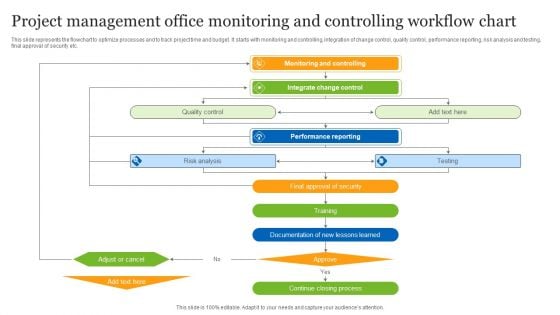
Project Management Office Monitoring And Controlling Workflow Chart Ppt Slides Mockup PDF
This slide represents the flowchart to optimize processes and to track project time and budget. It starts with monitoring and controlling, integration of change control, quality control, performance reporting, risk analysis and testing, final approval of security etc. Presenting Project Management Office Monitoring And Controlling Workflow Chart Ppt Slides Mockup PDF to dispense important information. This template comprises five stages. It also presents valuable insights into the topics including Monitoring And Controlling, Integrate Change Control, Performance Reporting. This is a completely customizable PowerPoint theme that can be put to use immediately. So, download it and address the topic impactfully.
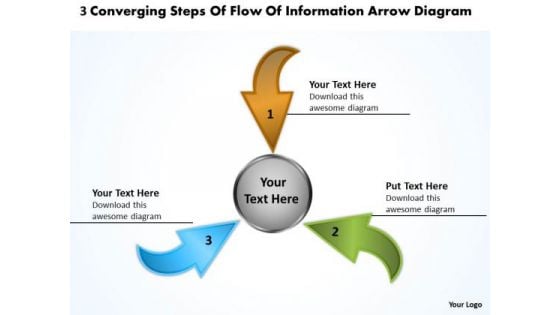
3 Converging Steps Of Flow Information Arrow Diagram Cycle Chart PowerPoint Templates
We present our 3 converging steps of flow information arrow diagram Cycle Chart PowerPoint templates.Present our Arrows PowerPoint Templates because the NASA Space programme took mankind to the moon and so much more. Like them you too can look far beyond normal boundaries. Show them that in your mind the sky is certainly not the limit. Present our Circle Charts PowerPoint Templates because this template project the knowledge gained to your colleagues to guide them along the way in days to come. Use our Shapes PowerPoint Templates because you have the ideas and plans on how to achieve success. Download and present our Business PowerPoint Templates because your ideas too are pinpointedly focused on you goals. Present our Flow Charts PowerPoint Templates because you can Transmit your passion via our creative templates.Use these PowerPoint slides for presentations relating to abstract, arrow, business, chart, circle, circular, collection, color, continuity, cycle, decoration, design, diagram, dimensional, direction, element, flow, glossy, graph, icon, illustration, isolated, modern, motion, movement, pattern, pie, recycling, repetition, report, ring, round, scheme, section, set, shape, shiny, sign, slice, spinning, symbol, turn, vector, web. The prominent colors used in the PowerPoint template are Brown, Green, Blue. Presenters tell us our 3 converging steps of flow information arrow diagram Cycle Chart PowerPoint templates are Stunning. You can be sure our color PowerPoint templates and PPT Slides are Bright. Professionals tell us our 3 converging steps of flow information arrow diagram Cycle Chart PowerPoint templates are Nice. People tell us our circular PowerPoint templates and PPT Slides are Dazzling. People tell us our 3 converging steps of flow information arrow diagram Cycle Chart PowerPoint templates are Dynamic. Professionals tell us our color PowerPoint templates and PPT Slides are Tasteful. Our graphice have been selected by professionals. Use them in your presentations with our 3 Converging Steps Of Flow Information Arrow Diagram Cycle Chart PowerPoint Templates. You'll always stay ahead of the game.
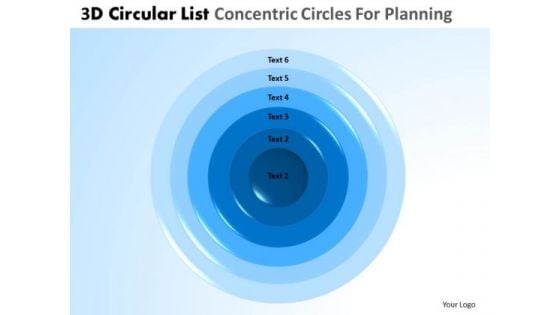
PowerPoint Process Company Strategy 3d Circular Chart List Core Diagrams Ppt Presentation
PowerPoint Process Company Strategy 3d circular Chart list Core Diagrams PPT Presentation-These high quality powerpoint pre-designed slides and powerpoint templates have been carefully created by our professional team to help you impress your audience. All slides have been created and are 100% editable in powerpoint. Each and every property of any graphic - color, size, orientation, shading, outline etc. can be modified to help you build an effective powerpoint presentation. Any text can be entered at any point in the powerpoint template or slide. Simply DOWNLOAD, TYPE and PRESENT! Lick the cream with our PowerPoint Process Company Strategy 3d Circular Chart List Core Diagrams Ppt Presentation.They will be the icing on the cake.
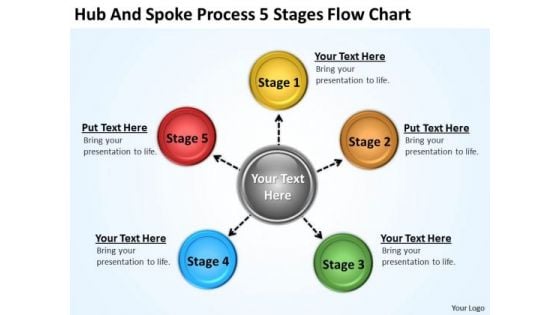
Business Life Cycle Diagram 5 Stages Flow Chart PowerPoint Templates Ppt Backgrounds For Slides
We present our business life cycle diagram 5 stages flow chart PowerPoint templates PPT backgrounds for slides.Download our Advertising PowerPoint Templates because It will Give impetus to the hopes of your colleagues. Our PowerPoint Templates and Slides will aid you in winning their trust. Download our Circle Charts PowerPoint Templates because Our PowerPoint Templates and Slides will let your team Walk through your plans. See their energy levels rise as you show them the way. Download our Business PowerPoint Templates because Our PowerPoint Templates and Slides are conceived by a dedicated team. Use them and give form to your wondrous ideas. Download our Shapes PowerPoint Templates because It will Give impetus to the hopes of your colleagues. Our PowerPoint Templates and Slides will aid you in winning their trust. Present our Arrows PowerPoint Templates because Our PowerPoint Templates and Slides are created by a hardworking bunch of busybees. Always flitting around with solutions gauranteed to please.Use these PowerPoint slides for presentations relating to Abstract, Achievement, Administration, Analyze, Blue, Box, Business, Chart, Company, Connected, Connection, Data, Database, Development, Diagram, Document, Economic, Finance, Flowchart, Glossy, Green, Hierarchy, Illustration, Levels, Management, Map, Marketing, Orange, Plan, Positions, Presentation, Progress, Rectangle, Red, Result, Site, Statistics, Structure, Technical, Trade, Vector, Yellow. The prominent colors used in the PowerPoint template are Orange, Yellow, Red. Get noticed immediately with our Business Life Cycle Diagram 5 Stages Flow Chart PowerPoint Templates Ppt Backgrounds For Slides. Dont waste time struggling with PowerPoint. Let us do it for you.
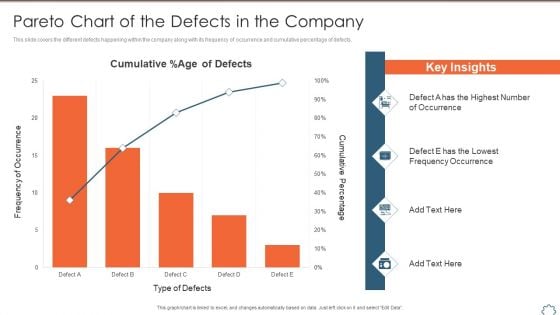
Total Productive Management At Workplace Pareto Chart Of The Defects In The Company Structure PDF
This slide covers the different defects happening within the company along with its frequency of occurrence and cumulative percentage of defects. Deliver an awe inspiring pitch with this creative total productive management at workplace pareto chart of the defects in the company structure pdf bundle. Topics like pareto chart of the defects in the company can be discussed with this completely editable template. It is available for immediate download depending on the needs and requirements of the user.
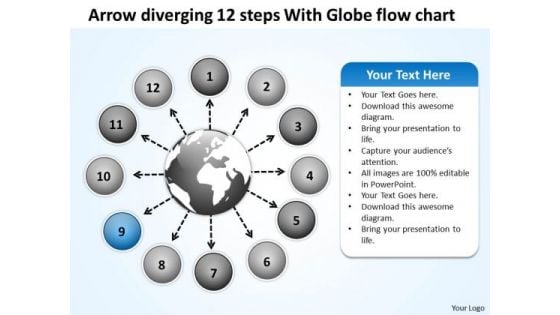
Arrow Diverging 12 Steps With Globe Flow Chart Cycle Spoke Diagram PowerPoint Slides
We present our arrow diverging 12 steps with globe flow chart Cycle Spoke Diagram PowerPoint Slides.Present our Circle Charts PowerPoint Templates because the graphic is a symbol of growth and success. Present our Arrows PowerPoint Templates because our Templates will enthuse your colleagues. Download our Globe PowerPoint Templates because this is Aesthetically designed to make a great first impression this template highlights . Download our Business PowerPoint Templates because you can Flutter your wings and enchant the world. Impress them with the innate attractiveness of your thoughts and words. Use our Flow Charts PowerPoint Templates because Our PowerPoint Templates and Slides are designed to help you succeed. They have all the ingredients you need.Use these PowerPoint slides for presentations relating to 3d, abstract, aim, arrow, background, business, career, chart, circle, color, concept, creative, curve, design, development, direction, financial, flowing, gain, graph, green, group, growth, higher, illustration, increase, isolated, motion, moving, moving up, path, prediction, progress, red, series, shape, sign, success, symbol, target, turn, twisted, up, upload, upward, way, white, win. The prominent colors used in the PowerPoint template are Blue, Gray, White. PowerPoint presentation experts tell us our arrow diverging 12 steps with globe flow chart Cycle Spoke Diagram PowerPoint Slides are Excellent. PowerPoint presentation experts tell us our business PowerPoint templates and PPT Slides are readymade to fit into any presentation structure. Presenters tell us our arrow diverging 12 steps with globe flow chart Cycle Spoke Diagram PowerPoint Slides will help you be quick off the draw. Just enter your specific text and see your points hit home. Presenters tell us our aim PowerPoint templates and PPT Slides are Functional. You can be sure our arrow diverging 12 steps with globe flow chart Cycle Spoke Diagram PowerPoint Slides are One-of-a-kind. We assure you our circle PowerPoint templates and PPT Slides are Spectacular. Exert influence with our Arrow Diverging 12 Steps With Globe Flow Chart Cycle Spoke Diagram PowerPoint Slides. Get opinions going for you.
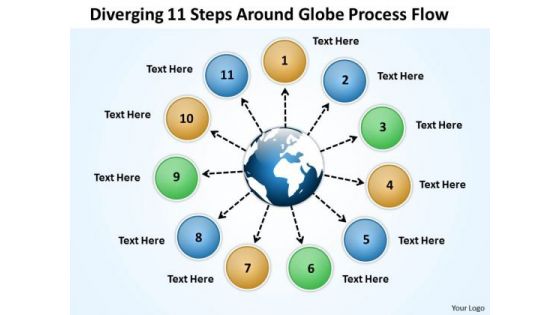
Diverging 11 Steps Around Globe Process Flow Ppt Circular Motion Chart PowerPoint Templates
We present our diverging 11 steps around globe process flow ppt Circular Motion Chart PowerPoint templates.Present our Circle Charts PowerPoint Templates because you can Be the cynosure of all eyes with our template depicting . Download our Arrows PowerPoint Templates because they will Amplify your thoughts via our appropriate templates. Download our Globe PowerPoint Templates because the ideas and plans are on your finger tips. Download our Business PowerPoint Templates because you have selected your team man for man. Download and present our Flow Charts PowerPoint Templates because it helps you to take your team up to a higher level with your thoughts.Use these PowerPoint slides for presentations relating to arrows, business, chart, circle, company, concept, continuity, continuous, cycle, dependency, diagram, direction, dynamic, endless, feeds, graph, iteration, iterative, method, path, phase, presentation, process, production, progress, progression, report, rotation, sequence, succession, vector. The prominent colors used in the PowerPoint template are Blue, Green, White. Presenters tell us our diverging 11 steps around globe process flow ppt Circular Motion Chart PowerPoint templates help you meet deadlines which are an element of today's workplace. Just browse and pick the slides that appeal to your intuitive senses. You can be sure our continuity PowerPoint templates and PPT Slides are designed by professionals Professionals tell us our diverging 11 steps around globe process flow ppt Circular Motion Chart PowerPoint templates are Energetic. People tell us our concept PowerPoint templates and PPT Slides are Wistful. People tell us our diverging 11 steps around globe process flow ppt Circular Motion Chart PowerPoint templates are Bright. Professionals tell us our continuous PowerPoint templates and PPT Slides are Nifty. Our Diverging 11 Steps Around Globe Process Flow Ppt Circular Motion Chart PowerPoint Templates create presentations that blow your audience away. With our money back guarantee you have nothing to lose.
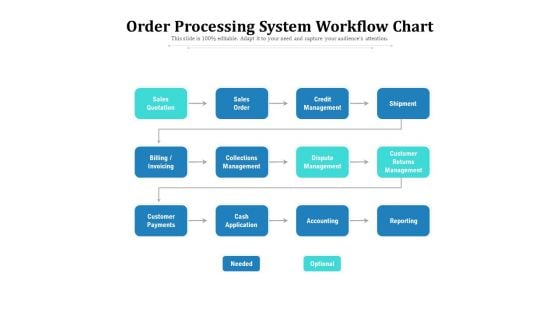
Order Processing System Workflow Chart Ppt PowerPoint Presentation Styles Microsoft PDF
Persuade your audience using this order processing system workflow chart ppt powerpoint presentation styles microsoft pdf. This PPT design covers one stages, thus making it a great tool to use. It also caters to a variety of topics including sales quotation, sales order, credit management, shipment, billing, invoicing, collections management, dispute management, customer returns management, customer payments, cash application, accounting, reporting, optional, needed. Download this PPT design now to present a convincing pitch that not only emphasizes the topic but also showcases your presentation skills.


 Continue with Email

 Home
Home


