Outcomes Icon
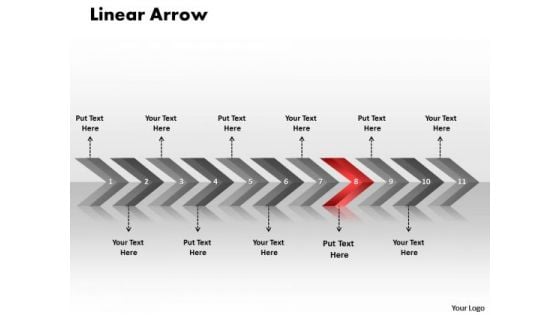
Flow Ppt Linear Arrows 11 States Diagram Project Management PowerPoint 9 Graphic
flow PPT linear arrows 11 states diagram project management powerpoint 9 Graphic-This Linear arrow template helps expound on the logic of your detailed thought process to take your company forward. Break it all down to Key Result Areas. Motivate your team to cross all barriers-flow PPT linear arrows 11 states diagram project management powerpoint 9 Graphic-Aim, Angle, Arrow, Arrowheads, Badge, Banner, Connection, Curve, Design, Direction, Download, Element, Fuchsia, Icon, Illustration, Indicator, Internet, Label, Link, Magenta, Mark, Marker, Next, Object, Orange, Orientation, Pointer, Shadow, Shape, Signs Symbol Motivate your team to excellent performances. Nurture their abilities through our Flow Ppt Linear Arrows 11 States Diagram Project Management PowerPoint 9 Graphic.
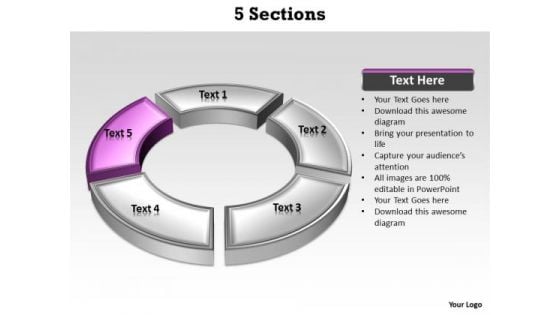
Ppt Purple Section Highlighted In PowerPoint Presentation Circular Manner Templates
PPT purple section highlighted in powerpoint presentation circular manner Templates-This PowerPoint Diagram shows you the five factors in circular manner responsible for financial growth in Business. It can be used for creating Business presentations where five different approaches combined to result in one factor. This is illustrated by purple part of the Diagram.-Can be used for presentations on abstract, blank, business, chart, circular, circulation, cycle, design, diagram, empty, executive, icon, illustration, management, model, numbers, organization, procedure, process, resource-PPT purple section highlighted in powerpoint presentation circular manner Templates Our Ppt Purple Section Highlighted In PowerPoint Presentation Circular Manner Templates can be bewitching. Put your audience under your spell.
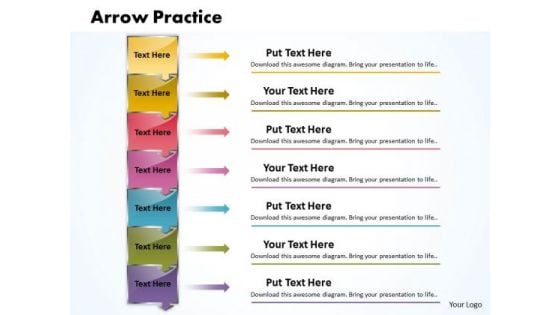
Ppt Plumb Arrow Practice The PowerPoint Macro Steps 7 Stages Templates
PPT plumb arrow practice the powerpoint macro steps 7 stages Templates-This PowerPoint Diagram shows you the seven factors responsible for economic growth in Business .It can be used for creating Business presentations where seven factors combined to result in one factor. You can apply other 3D Styles and shapes to the slide to enhance your presentations.-PPT plumb arrow practice the powerpoint macro steps 7 stages Templates-Arrow, Background, Process, Business, Chart, Diagram, Financial, Graphic, Gray, Icon, Illustration, Management, Orange, Perspective, Planning Process, Stages, Steps, Text Be a self-starter with our Ppt Plumb Arrow Practice The PowerPoint Macro Steps 7 Stages Templates. They will make you look good.
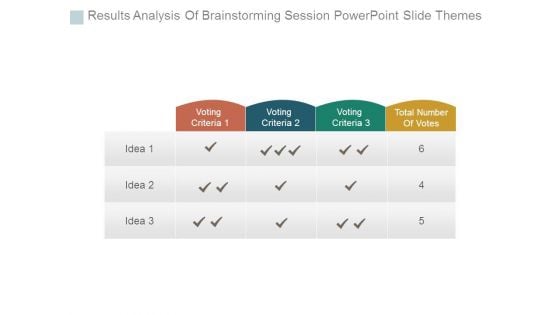
Results Analysis Of Brainstorming Session Powerpoint Slide Themes
This is a results analysis of brainstorming session powerpoint slide themes. This is a four stage process. The stages in this process are management, business, presentation, strategy, table.
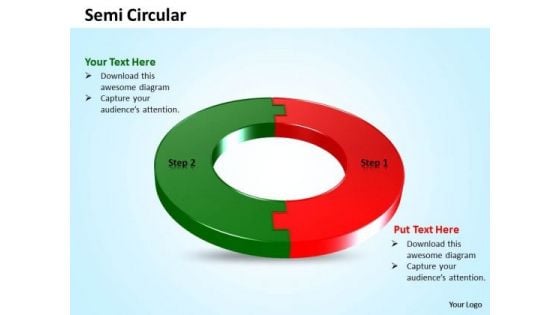
Ppt Two Phase Diagram Of Allocation An Activity PowerPoint Templates
PPT two phase diagram of allocation an activity PowerPoint Templates-This PowerPoint Diagram shows the Group of people standing around the Yellow bulb. It signifies the concept of analyze, conceive, conceptualize, conjure up, create, deliberate, dream up, invent, plan, ponder, put heads together, rack brains, share ideas and think.-PPT two phase diagram of allocation an activity PowerPoint Templates-Abstract, Business, Button, Chart, Chrome, Clip, Collection, Design, Diagram, Division, Five, Four, Glossy, Illustration, Modern, Partition, Pie, Piece, Portion, Presentation, Progress, Result, Section, Segmented, Segments, Set, Seven With our Ppt Two Phase Diagram Of Allocation An Activity PowerPoint Templates you won't play second fiddle. They help you dominate the action.
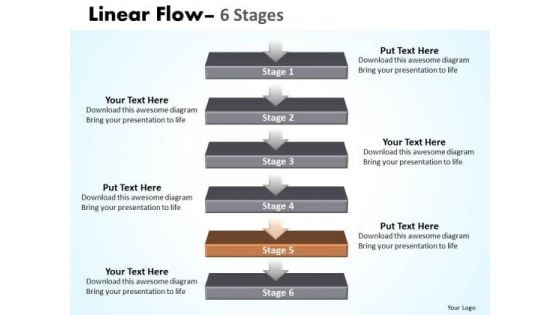
Usa Ppt Non-linear PowerPoint Flow 6 Stages1 Operations Management Design
USA PPT non-linear powerpoint flow 6 stages1 operations management design-Some opportunities are bound to be highly profitable for you to follow up. Use this slide to highlight the results of you thought process and convince your team of the reasons for selecting a particular path to follow.-USA PPT non-linear powerpoint flow 6 stages1 operations management design-Arrow, Background, Business, Chart, Diagram, Financial, Flow, Graphic, Gray, Icon, Illustration, Linear, Management, Orange, Perspective, Process, Reflection, Shapes, Stage, Text Experience exponential.growth with our Usa Ppt Non-linear PowerPoint Flow 6 Stages1 Operations Management Design. Your earnings will acquire a big boost.
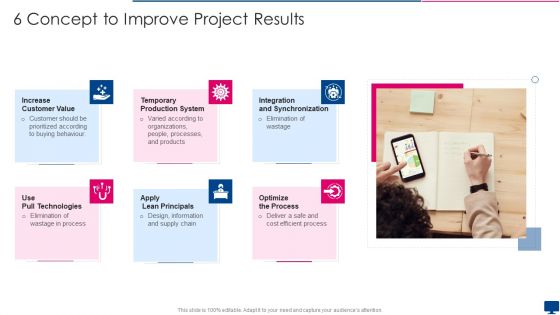
6 Concept To Improve Project Results Diagrams PDF
Presenting 6 concept to improve project results diagrams pdf to dispense important information. This template comprises six stages. It also presents valuable insights into the topics including increase customer value, temporary production system, integration and synchronization, use pull technologies, apply lean principals. This is a completely customizable PowerPoint theme that can be put to use immediately. So, download it and address the topic impactfully.
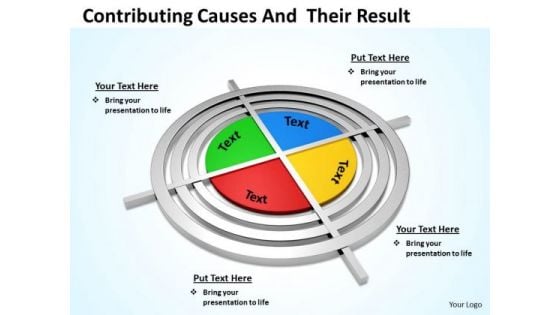
Sales Diagram Contributing Causes And Their Result Business Cycle Diagram
Be The Doer With Our Sales_Diagram_Contributing_Causes_And_Their_Result_Business_Cycle_Diagram Powerpoint Templates. Put Your Thoughts Into Practice.

Results Of Success Money PowerPoint Themes And PowerPoint Slides 0411
Microsoft PowerPoint Theme and Slide with inspiration showing success someone standing out from the crowd. Our Results Of Success Money PowerPoint Themes And PowerPoint Slides 0411 are exceptionally adaptive. They will blend in with any scenario.
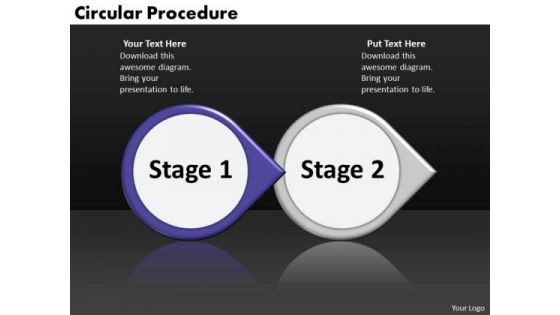
Ppt Circular Arrow Perception Of 2 Steps Involved Procedure PowerPoint Templates
PPT circular arrow perception of 2 steps involved procedure PowerPoint Templates-This PowerPoint Diagram consists of two circular text Boxes specifying two different Processes combined to result in one Mission. This Diagram will fit for Business processes like Marketing, Management etc.-PPT circular arrow perception of 2 steps involved procedure PowerPoint Templates-3d, Abstract, Advertisement, Aim, Arrow, Business, Circular, Cursor, Direction, Down, Environment, Form, Glossy, Graphic, Icon, Illustration, Information, Mark, Motion, Perspective, Point, Sale, Shadow, Shape, Shiny, Sign Examine the facts in all their combinations. Run the comb through with our Ppt Circular Arrow Perception Of 2 Steps Involved Procedure PowerPoint Templates.
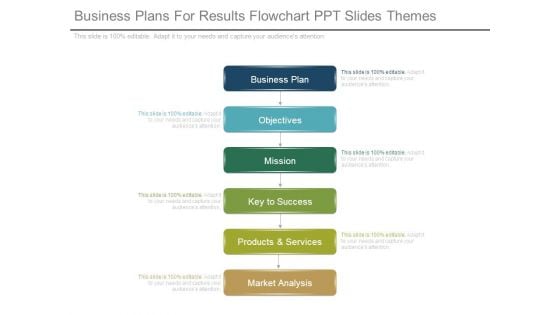
Business Plans For Results Flowchart Ppt Slides Themes
This is a business plans for results flowchart ppt slides themes. This is a six stage process. The stages in this process are business plan, objectives, mission, key to success, products and services, market analysis.
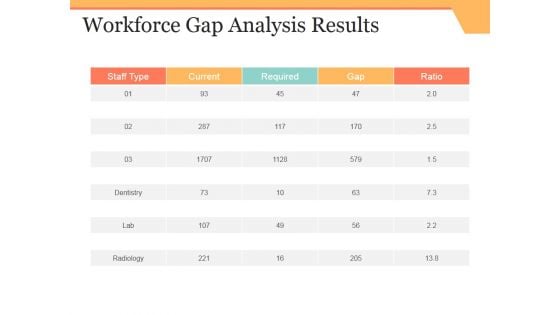
Workforce Gap Analysis Results Ppt PowerPoint Presentation Pictures Themes
This is a workforce gap analysis results ppt powerpoint presentation pictures themes. This is a four stage process. The stages in this process are staff type, current, required, gap, ratio.
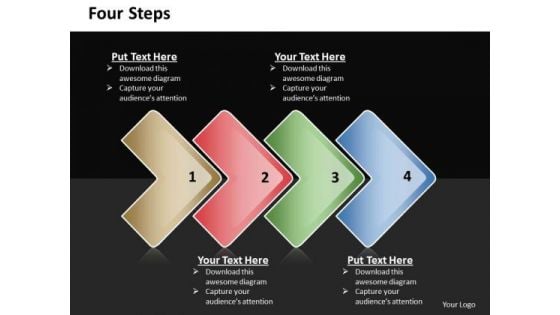
Ppt Direct Description Of 4 Steps Included Procedure PowerPoint Templates
PPT direct description of 4 steps included procedure PowerPoint Templates-Develop competitive advantage with our above template which contains a diagram of pointed arrows. It helps expound on the logic of your detailed thought process to take your company forward. Break it all down to Key Result Areas. Motivate your team to cross all barriers-PPT direct description of 4 steps included procedure PowerPoint Templates-Aim, Arrow, Arrowheads, Badge, Border, Click, Connection, Curve, Design, Direction, Download, Element, Fuchsia, Icon, Illustration, Indicator, Internet, Magenta, Mark, Object, Orientation, Pointer, Shadow, Shape, Sign Our Ppt Direct Description Of 4 Steps Included Procedure PowerPoint Templates are arguably exceptional. Your ideas will be hard to argue against.
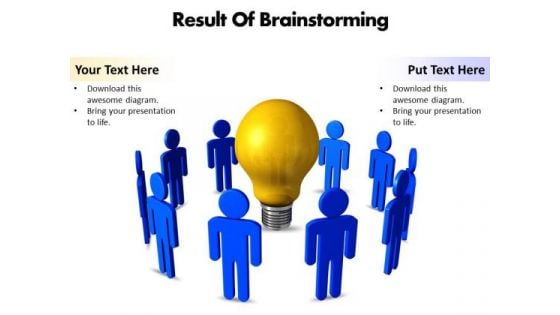
Result Of Brainstorming Editable PowerPoint Templates
result of brainstorming editable powerpoint templates-This PowerPoint Diagram shows the Group of people standing around the Yellow bulb. It signifies the concept of analyze, conceive, conceptualize, conjure up, create, deliberate, dream up, invent, plan, ponder, put heads together, rack brains, share ideas and think.-result of brainstorming editable powerpoint templates-3d, Achievement, Analysis, Aspirations, Assistance, Brainstorming, Business, Communication, Concept, Creative, Direction, Figure, Idea, Imagination, Information, Innovation, Inspiration, Intelligence, Invention, Isolated, Logic, Man, Motivation, Person, Problems, Result, Science, Search, Small, Solution, Study, Success Disentangle the web with our Result Of Brainstorming Editable PowerPoint Templates. Seperate the various strands of thought.
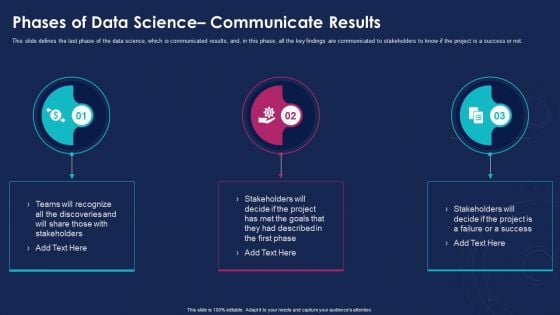
Data Analytics IT Phases Of Data Science Communicate Results Ppt Gallery Slideshow PDF
This slide defines the last phase of the data science, which is communicated results, and, in this phase, all the key findings are communicated to stakeholders to know if the project is a success or not. Presenting data analytics it phases of data science communicate results ppt gallery slideshow pdf to provide visual cues and insights. Share and navigate important information on three stages that need your due attention. This template can be used to pitch topics like phases of data science communicate results. In addtion, this PPT design contains high resolution images, graphics, etc, that are easily editable and available for immediate download.
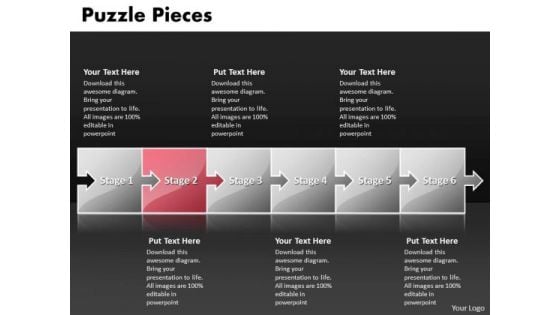
Ppt Puzzle Pieces Steps Of A Forging Process PowerPoint Slides Templates
PPT puzzle pieces steps of a forging process powerpoint slides Templates-Puzzle Pieces are truly some of the wonders of our life. Break it all down to Key Result Areas. Motivate your team to cross all barriers.-PPT puzzle pieces steps of a forging process powerpoint slides Templates-Abstract, Arrow, Backgrounds, Business, Computer, Concepts, Connection, Cooperation, Creativity, Crowd, Design, Digital, Digitally, Electric, Equalizer, Generated, Graph, Graphic, Group, Icon, Ideas, Illustration, Image, Individuality, Isolated, Leader, Leadership, Link, Motivation, Music, Objects, Order, Part, Pattern, Piece, Playing, Puzzle Equalize the equation with our Ppt Puzzle Pieces Steps Of A Forging Process PowerPoint Slides Templates. Get the audience on board with you.
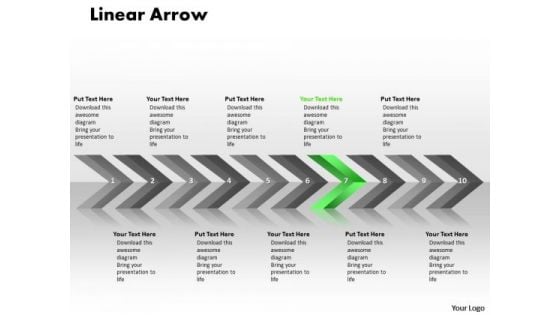
Marketing Ppt Linear Arrows 10 Stages Business Communication PowerPoint 8 Image
marketing PPT linear arrows 10 stages business communication powerpoint 8 Image-This Linear Arrow design provides a graphic tool that allows users to easily draft the strategy map and monitor performance through the same. Use this impressive template to unravel your recipe for a mouth watering result.-marketing PPT linear arrows 10 stages business communication powerpoint 8 Image-Aim, Angle, Arrow, Arrowheads, Badge, Banner, Connection, Curve, Design, Direction, Download, Element, Fuchsia, Icon, Illustration, Indicator, Internet, Label, Link, Magenta, Mark, Marker, Next, Object, Orange, Orientation, Pointer, Shadow, Shape, Signs Symbol Spice up the discourse with our Marketing Ppt Linear Arrows 10 Stages Business Communication PowerPoint 8 Image. Strengthen the flavour of your thoughts.
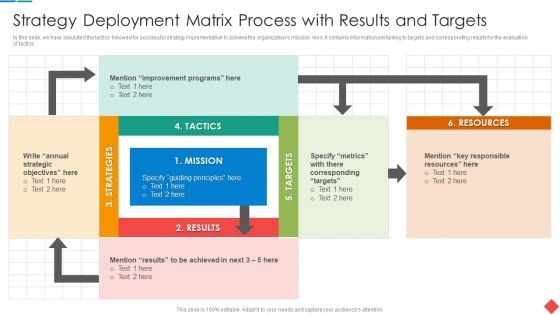
Strategy Deployment Matrix Process With Results And Targets Themes PDF
In this slide, we have tabulated the tactics followed for successful strategy implementation to achieve the organizations mission. Also, it contains information pertaining to targets and corresponding results for the evaluation of tactics.Deliver and pitch your topic in the best possible manner with this Strategy Deployment Matrix Process With Results And Targets Themes PDF Use them to share invaluable insights on Improvement Programs, Strategic Objectives, Corresponding Targets and impress your audience. This template can be altered and modified as per your expectations. So, grab it now.
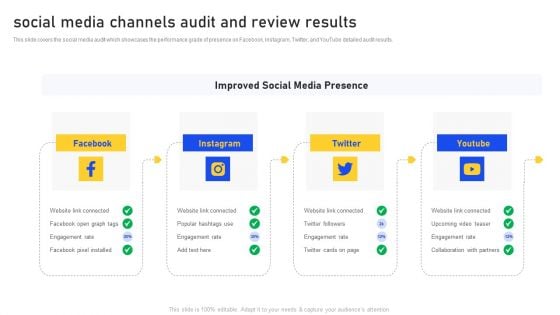
Social Media Channels Audit And Review Results Themes PDF
This slide covers the social media audit which showcases the performance grade of presence on Facebook, Instagram, Twitter, and YouTube detailed audit results. This is a Social Media Channels Audit And Review Results Themes PDF template with various stages. Focus and dispense information on four stages using this creative set, that comes with editable features. It contains large content boxes to add your information on topics like Facebook, Instagram, Twitter. You can also showcase facts, figures, and other relevant content using this PPT layout. Grab it now.
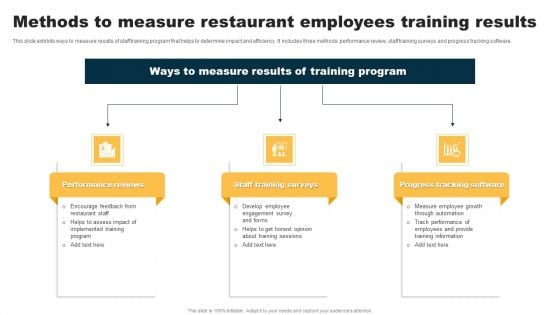
Methods To Measure Restaurant Employees Training Results Themes PDF
This slide exhibits ways to measure results of staff training program that helps to determine impact and efficiency. It includes three methods performance review, staff training surveys and progress tracking software. Persuade your audience using this Methods To Measure Restaurant Employees Training Results Themes PDF. This PPT design covers Three stages, thus making it a great tool to use. It also caters to a variety of topics including Performance Reviews, Staff Training Surveys, Progress Tracking Software. Download this PPT design now to present a convincing pitch that not only emphasizes the topic but also showcases your presentation skills.
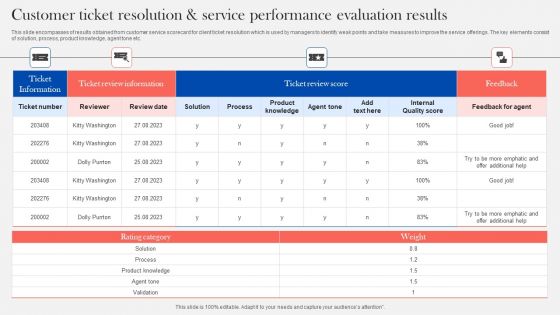
Customer Ticket Resolution And Service Performance Evaluation Results Themes PDF
This slide encompasses of results obtained from customer service scorecard for client ticket resolution which is used by managers to identify weak points and take measures to improve the service offerings. The key elements consist of solution, process, product knowledge, agent tone etc. Showcasing this set of slides titled Customer Ticket Resolution And Service Performance Evaluation Results Themes PDF. The topics addressed in these templates are Ticket Review Information, Solution, Product Knowledge. All the content presented in this PPT design is completely editable. Download it and make adjustments in color, background, font etc. as per your unique business setting.
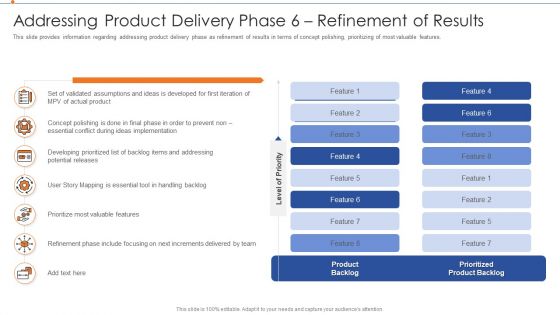
Strategies For Improving Product Discovery Addressing Product Delivery Phase 6 Refinement Of Results Clipart PDF
This slide provides information regarding addressing product delivery phase as refinement of results in terms of concept polishing, prioritizing of most valuable features. Deliver and pitch your topic in the best possible manner with this strategies for improving product discovery addressing product delivery phase 6 refinement of results clipart pdf. Use them to share invaluable insights on developing, potential, valuable, implementation and impress your audience. This template can be altered and modified as per your expectations. So, grab it now.

Eggs Represents Boulder Of The Tomb Of Jesus PowerPoint Templates Ppt Backgrounds For Slides 0313
We present our Eggs Represents Boulder Of The Tomb Of Jesus PowerPoint Templates PPT Backgrounds For Slides 0313.Use our Nature PowerPoint Templates because Our PowerPoint Templates and Slides will let you Leave a lasting impression to your audiences. They possess an inherent longstanding recall factor. Use our Festival PowerPoint Templates because Our PowerPoint Templates and Slides will let your team Walk through your plans. See their energy levels rise as you show them the way. Use our Holidays PowerPoint Templates because Our PowerPoint Templates and Slides will Activate the energies of your audience. Get their creative juices flowing with your words. Download our Religion PowerPoint Templates because Our PowerPoint Templates and Slides provide you with a vast range of viable options. Select the appropriate ones and just fill in your text. Download our Stars PowerPoint Templates because Our PowerPoint Templates and Slides will bullet point your ideas. See them fall into place one by one.Use these PowerPoint slides for presentations relating to Representative of easter eggs, nature, festival, religion, stars, holidays. The prominent colors used in the PowerPoint template are Red, Yellow, Gray. Examine every argument with our Eggs Represents Boulder Of The Tomb Of Jesus PowerPoint Templates Ppt Backgrounds For Slides 0313. Arrive at conclusions that befit your business.
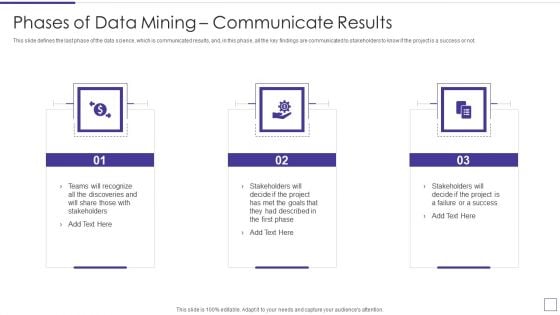
Data Mining Implementation Phases Of Data Mining Communicate Results Sample PDF
This slide defines the last phase of the data science, which is communicated results, and, in this phase, all the key findings are communicated to stakeholders to know if the project is a success or not.This is a data mining implementation phases of data mining communicate results sample pdf template with various stages. Focus and dispense information on three stages using this creative set, that comes with editable features. It contains large content boxes to add your information on topics like teams will recognize, stakeholders will decide, failure or a success You can also showcase facts, figures, and other relevant content using this PPT layout. Grab it now.
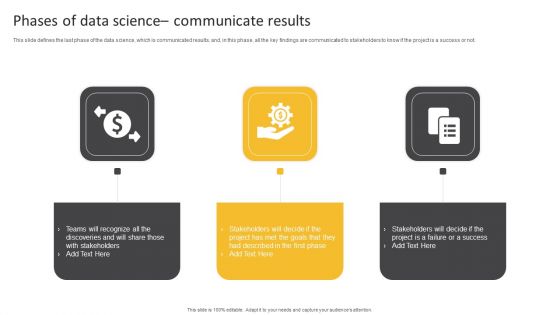
Information Science Phases Of Data Science Communicate Results Ppt PowerPoint Presentation Styles File Formats PDF
This slide defines the last phase of the data science, which is communicated results, and, in this phase, all the key findings are communicated to stakeholders to know if the project is a success or not.This is a Information Science Phases Of Data Science Communicate Results Ppt PowerPoint Presentation Styles File Formats PDF template with various stages. Focus and dispense information on theree stages using this creative set, that comes with editable features. It contains large content boxes to add your information on topics like Teams Recognize, Stakeholders Decide, Failure Success. You can also showcase facts, figures, and other relevant content using this PPT layout. Grab it now.
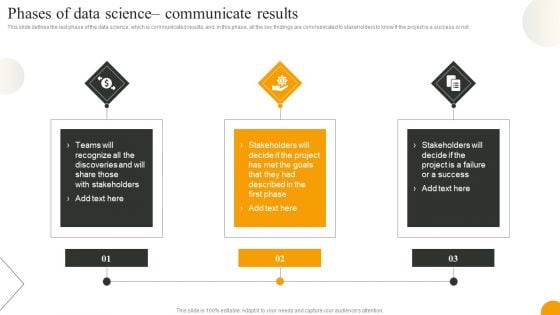
Using Data Science Technologies For Business Transformation Phases Of Data Science Communicate Results Clipart PDF
This slide defines the last phase of the data science, which is communicated results, and, in this phase, all the key findings are communicated to stakeholders to know if the project is a success or not. If your project calls for a presentation, then Slidegeeks is your go to partner because we have professionally designed, easy to edit templates that are perfect for any presentation. After downloading, you can easily edit Using Data Science Technologies For Business Transformation Phases Of Data Science Communicate Results Clipart PDF and make the changes accordingly. You can rearrange slides or fill them with different images. Check out all the handy templates.
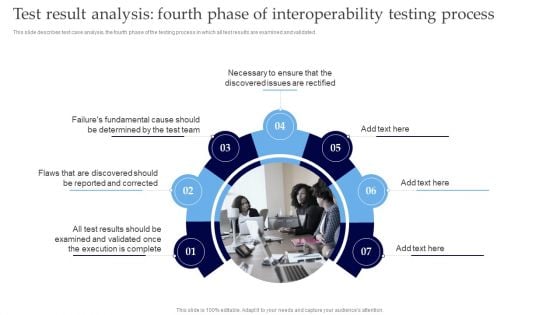
Interoperability Software Testing Test Result Analysis Fourth Phase Of Interoperability Testing Process Inspiration PDF
This slide describes test case analysis, the fourth phase of the testing process in which all test results are examined and validated. Here you can discover an assortment of the finest PowerPoint and Google Slides templates. With these templates, you can create presentations for a variety of purposes while simultaneously providing your audience with an eye catching visual experience. Download Interoperability Software Testing Test Result Analysis Fourth Phase Of Interoperability Testing Process Inspiration PDF to deliver an impeccable presentation. These templates will make your job of preparing presentations much quicker, yet still, maintain a high level of quality. Slidegeeks has experienced researchers who prepare these templates and write high quality content for you. Later on, you can personalize the content by editing the Interoperability Software Testing Test Result Analysis Fourth Phase Of Interoperability Testing Process Inspiration PDF.
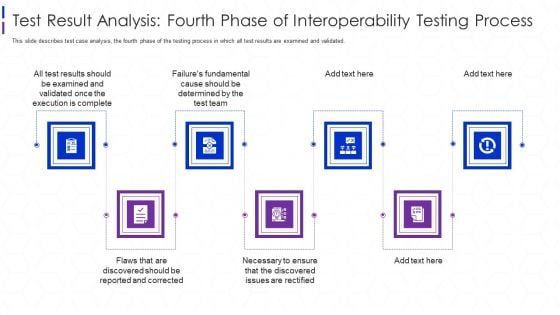
Software Interoperability Examination IT Test Result Analysis Fourth Phase Ppt Portfolio Graphic Images PDF
This slide describes test case analysis, the fourth phase of the testing process in which all test results are examined and validated. This is a software interoperability examination it test result analysis fourth phase ppt portfolio graphic images pdf template with various stages. Focus and dispense information on seven stages using this creative set, that comes with editable features. It contains large content boxes to add your information on topics like determined, team. You can also showcase facts, figures, and other relevant content using this PPT layout. Grab it now.
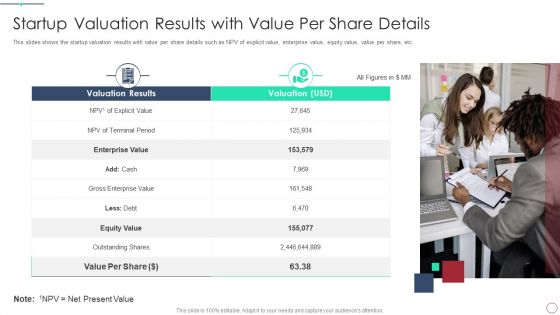
Initial Phase Investor Value For New Business Startup Valuation Results Elements PDF
This slides shows the startup valuation results with value per share details such as NPV of explicit value, enterprise value, equity value, value per share, etc. This is a initial phase investor value for new business startup valuation results elements pdf template with various stages. Focus and dispense information on two stages using this creative set, that comes with editable features. It contains large content boxes to add your information on topics like startup valuation results with value per share details. You can also showcase facts, figures, and other relevant content using this PPT layout. Grab it now.
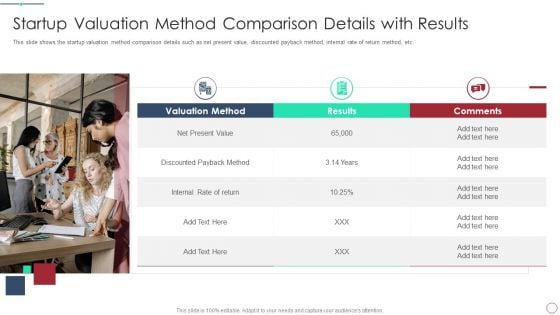
Initial Phase Investor Value For New Business Startup Valuation Method Comparison Details With Results Template PDF
This slide shows the startup failure rate with funding sequence, failure to raise next round, failure to exit, etc. Presenting initial phase investor value for new business startup valuation method comparison details with results template pdf to provide visual cues and insights. Share and navigate important information on three stages that need your due attention. This template can be used to pitch topics like startup valuation method comparison details with results. In addtion, this PPT design contains high resolution images, graphics, etc, that are easily editable and available for immediate download.

I Love You Dad Family PowerPoint Templates And PowerPoint Themes 1112
We present our I love You Dad Family PowerPoint Templates And PowerPoint Themes 1112.Use our Festival PowerPoint Templates because, The lessons have been analyzed, studied and conclusions drawn. Use our Shapes PowerPoint Templates because, Ring them out loud with your brilliant ideas. Use our Festival PowerPoint Templates because, You have analysed the illness and know the need. Use our Holidays PowerPoint Templates because, You have made significant headway in this field. Use our Family PowerPoint Templates because, Anoint it with your really bright ideas.Use these PowerPoint slides for presentations relating to I love dad icon, family, holidays, events, festival, shapes. The prominent colors used in the PowerPoint template are Red, Brown, Yellow Amend archaic ideas with our I Love You Dad Family PowerPoint Templates And PowerPoint Themes 1112. Ring in desirable changes with your thoughts.
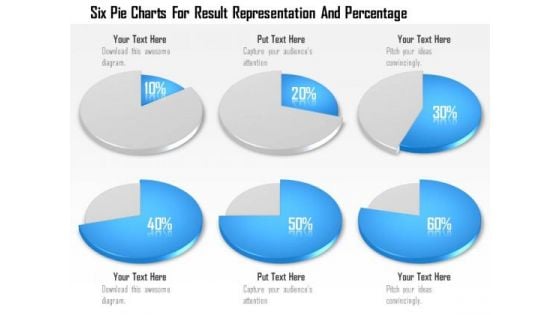
Business Diagram Six Pie Charts For Result Representation And Percentage Presentation Template
Display the concept of result analysis in your business presentation. This PPT slide contains the graphic of six pie charts. Use this PPT slide for your business and marketing data related presentations.
Ppt Curved PowerPoint Graphics Arrows Stage 2 Forming Triangle Templates
PPT curved powerpoint graphics arrows stage 2 forming triangle Templates-This PowerPoint Diagram shows the highlighted red arrow signifying the process is going on. It portrays the concept of bolt, cursor, dart, indicator, missile, pointer, projectile, shaft, achievement, attainment, close, conclusion, consummation, culmination, curtains, dispatch etc.-Can be used for presentations on around, arrow, business, button, chart, circle, collection, color, computer, curve, cycle, direction, down, ecology, element, environment, flowing, green, group, guidance, icon, isolated, leadership, leading, moving, pollution, processing, push, rotate, set, shape, shiny, sign, stick, symbol, triangle, turning, up, variation, waste-PPT curved powerpoint graphics arrows stage 2 forming triangle Templates Back up your boast with our Ppt Curved PowerPoint Graphics Arrows Stage 2 Forming Triangle Templates. Demonstrate to your audience that you can.
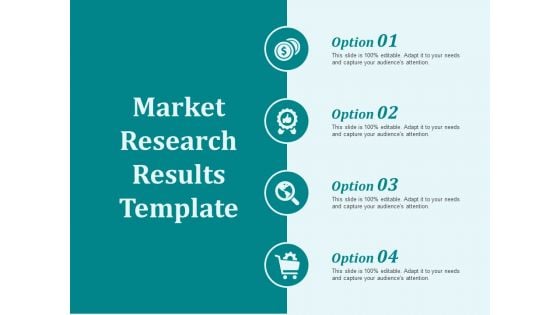
Market Research Results Template Ppt PowerPoint Presentation Slides Diagrams
This is a market research results template ppt powerpoint presentation slides diagrams. This is a four stage process. The stages in this process are business, management, marketing.
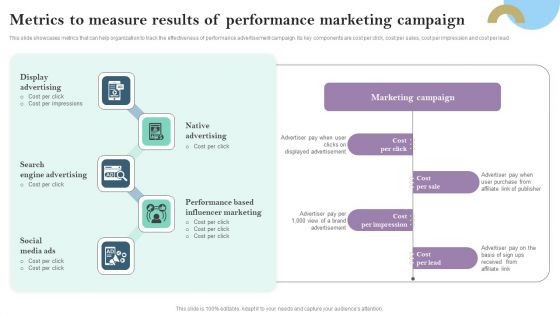
Metrics To Measure Results Of Performance Marketing Campaign Ppt PowerPoint Presentation Diagram Graph Charts PDF
This slide showcases metrics that can help organization to track the effectiveness of performance advertisement campaign. Its key components are cost per click, cost per sales, cost per impression and cost per lead Presenting this PowerPoint presentation, titled Metrics To Measure Results Of Performance Marketing Campaign Ppt PowerPoint Presentation Diagram Graph Charts PDF, with topics curated by our researchers after extensive research. This editable presentation is available for immediate download and provides attractive features when used. Download now and captivate your audience. Presenting this Metrics To Measure Results Of Performance Marketing Campaign Ppt PowerPoint Presentation Diagram Graph Charts PDF. Our researchers have carefully researched and created these slides with all aspects taken into consideration. This is a completely customizable Metrics To Measure Results Of Performance Marketing Campaign Ppt PowerPoint Presentation Diagram Graph Charts PDF that is available for immediate downloading. Download now and make an impact on your audience. Highlight the attractive features available with our PPTs.
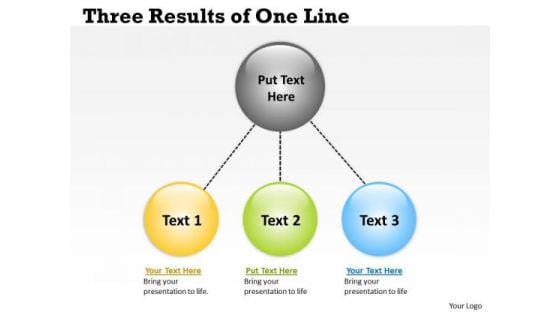
Business Cycle Diagram Three Results Of One Line Strategic Management
Your Listeners Will Never Doodle. Our Business Cycle Diagram Three Results of One Line Strategic Management Powerpoint Templates Will Hold Their Concentration. Do The One Thing With Your Thoughts. Uphold Custom With OurBusiness Cycle Diagram Three Results of One Line Strategic Management Powerpoint Templates.
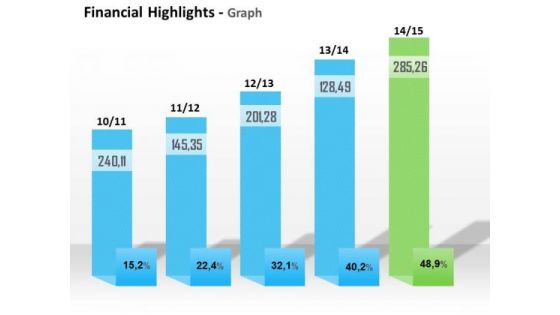
Business Cycle Diagram Annual Growth Of Financial Result Strategic Management
Analyze Ailments On Our Business Cycle Diagram Annual Growth Of Financial Result Strategic Management Powerpoint Templates. Bring Out The Thinking Doctor In You. Dock Your Thoughts With Our Business Cycle Diagram Annual Growth Of Financial Result Strategic Management Powerpoint Templates. They Will Launch Them Into Orbit.
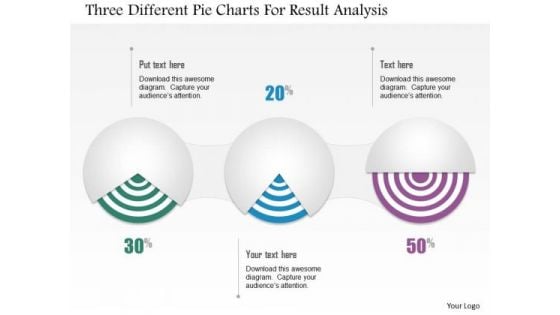
Business Diagram Three Different Pie Charts For Result Analysis Presentation Template
Three different pie charts are used to designed this power point template slide. This PPT slide contains the concept of result analysis. Use this PPT slide for your data and process related presentations.

Business Diagram Four Pie Chart For Data Driven Result Analysis Of Business PowerPoint Slide
This business diagram displays graphic of pie charts in shape of flasks. This business slide is suitable to present and compare business data. Use this diagram to build professional presentations for your viewers.
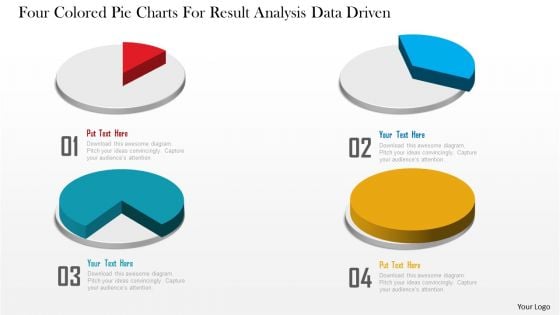
Business Diagram Four Colored Pie Charts For Result Analysis Data Driven PowerPoint Slide
This business diagram displays graphic of pie charts. This business slide is suitable to present and compare business data. Use this diagram to build professional presentations for your viewers.
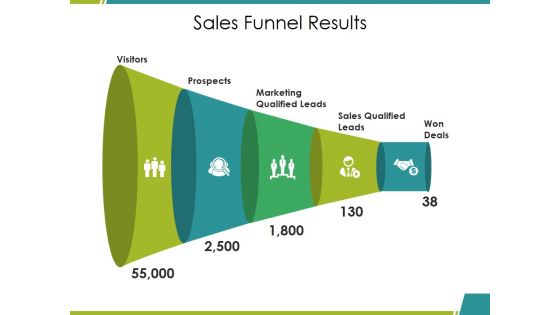
Sales Funnel Results Ppt PowerPoint Presentation Gallery Diagrams
This is a sales funnel results ppt powerpoint presentation gallery diagrams. This is a five stage process. The stages in this process are visitors, prospects, sales qualified leads, won, deals, marketing qualified leads.
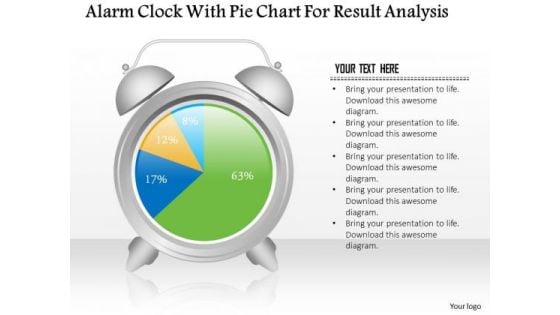
Business Diagram Alarm Clock With Pie Chart For Result Analysis PowerPoint Slide
This business slide displays alarm clock with pie chart. This diagram is a data visualization tool that gives you a simple way to present statistical information. This slide helps your audience examine and interpret the data you present.
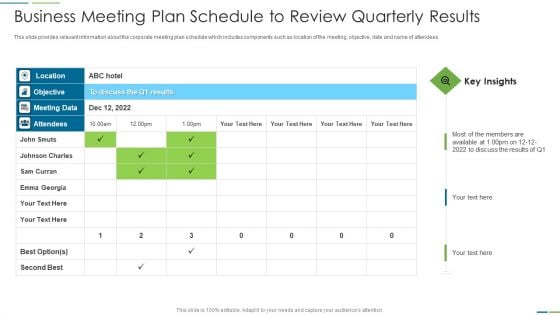
Business Meeting Plan Schedule To Review Quarterly Results Diagrams PDF
This slide provides relevant information about the corporate meeting plan schedule which includes components such as location of the meeting, objective, date and name of attendees.Showcasing this set of slides titled business meeting plan schedule to review quarterly results diagrams pdf The topics addressed in these templates are business meeting plan schedule to review quarterly results All the content presented in this PPT design is completely editable. Download it and make adjustments in color, background, font etc. as per your unique business setting.
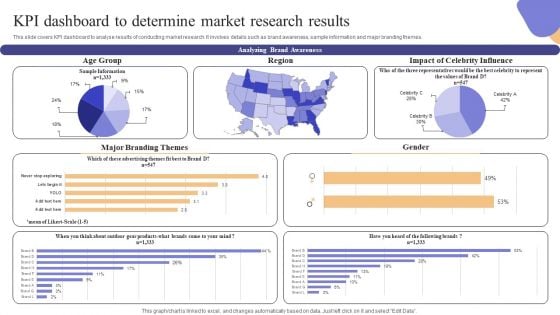
KPI Dashboard To Determine Market Research Results Information PDF
This slide covers KPI dashboard to analyse results of conducting market research. It involves details such as brand awareness, sample information and major branding themes. Crafting an eye-catching presentation has never been more straightforward. Let your presentation shine with this tasteful yet straightforward KPI Dashboard To Determine Market Research Results Information PDF template. It offers a minimalistic and classy look that is great for making a statement. The colors have been employed intelligently to add a bit of playfulness while still remaining professional. Construct the ideal KPI Dashboard To Determine Market Research Results Information PDF that effortlessly grabs the attention of your audience Begin now and be certain to wow your customers

Thanks For Watching Sample Brand Expansion Positioning Strategy Topics PDF
Find highly impressive Thanks For Watching Sample Brand Expansion Positioning Strategy Topics PDF on Slidegeeks to deliver a meaningful presentation. You can save an ample amount of time using these presentation templates. No need to worry to prepare everything from scratch because Slidegeeks experts have already done a huge research and work for you. You need to download Thanks For Watching Sample Brand Expansion Positioning Strategy Topics PDF for your upcoming presentation. All the presentation templates are 100precent editable and you can change the color and personalize the content accordingly. Download now.
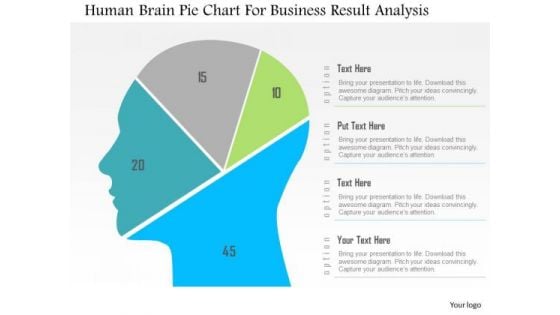
Business Diagram Human Brain Pie Chart For Business Result Analysis PowerPoint Slide
This diagram displays human face graphic divided into sections. This section can be used for data display. Use this diagram to build professional presentations for your viewers.
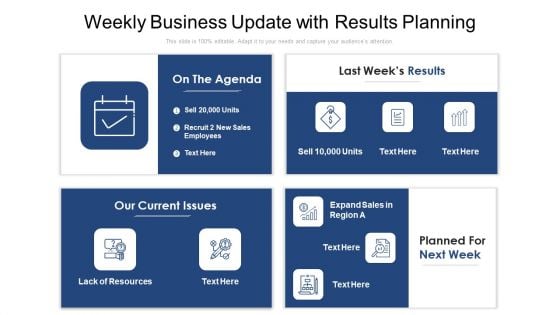
Weekly Business Update With Results Planning Ppt Outline Diagrams PDF
Pitch your topic with ease and precision using this weekly business update with results planning ppt outline diagrams pdf. This layout presents information on agenda, our current issues, resources. It is also available for immediate download and adjustment. So, changes can be made in the color, design, graphics or any other component to create a unique layout.
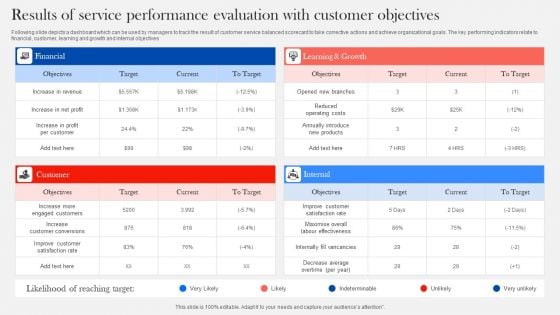
Results Of Service Performance Evaluation With Customer Objectives Diagrams PDF
Following slide depicts a dashboard which can be used by managers to track the result of customer service balanced scorecard to take corrective actions and achieve organizational goals. The key performing indicators relate to financial, customer, learning and growth and internal objectives. Showcasing this set of slides titled Results Of Service Performance Evaluation With Customer Objectives Diagrams PDF. The topics addressed in these templates are Financial, Customer, Internal. All the content presented in this PPT design is completely editable. Download it and make adjustments in color, background, font etc. as per your unique business setting.
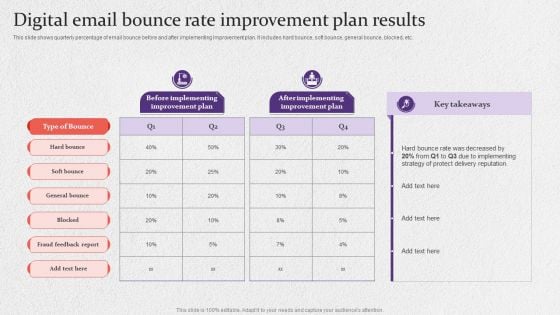
Digital Email Bounce Rate Improvement Plan Results Diagrams PDF
This slide shows quarterly percentage of email bounce before and after implementing improvement plan. It includes hard bounce, soft bounce, general bounce, blocked, etc. Showcasing this set of slides titled Digital Email Bounce Rate Improvement Plan Results Diagrams PDF. The topics addressed in these templates are Implementing, Protect Delivery Reputation, Strategy. All the content presented in this PPT design is completely editable. Download it and make adjustments in color, background, font etc. as per your unique business setting.
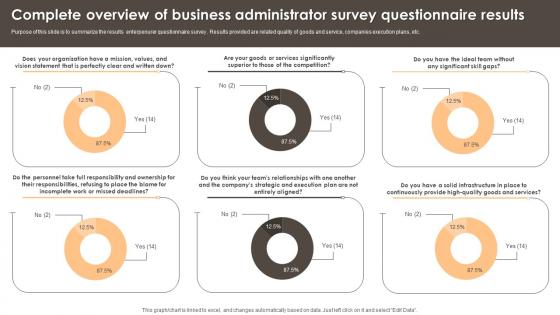
Complete Overview Of Business Administrator Survey Questionnaire Results Survey Ss
Purpose of this slide is to summarize the results enterpenurer questionnaire survey. Results provided are related quality of goods and service, companies execution plans, etc. Showcasing this set of slides titled Complete Overview Of Business Administrator Survey Questionnaire Results Survey Ss The topics addressed in these templates are Organization, Competition, Significant Skill All the content presented in this PPT design is completely editable. Download it and make adjustments in color, background, font etc. as per your unique business setting. Purpose of this slide is to summarize the results enterpenurer questionnaire survey. Results provided are related quality of goods and service, companies execution plans, etc.
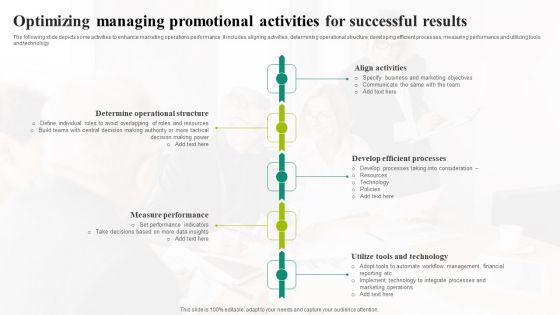
Optimizing Managing Promotional Activities For Successful Results Diagrams PDF
The following slide depicts some activities to enhance marketing operations performance. It includes aligning activities, determining operational structure, developing efficient processes, measuring performance and utilizing tools and technology. Persuade your audience using this Optimizing Managing Promotional Activities For Successful Results Diagrams PDF. This PPT design covers five stages, thus making it a great tool to use. It also caters to a variety of topics including Align Activities, Develop Efficient Processes, Measure Performance, Determine Operational Structure. Download this PPT design now to present a convincing pitch that not only emphasizes the topic but also showcases your presentation skills.
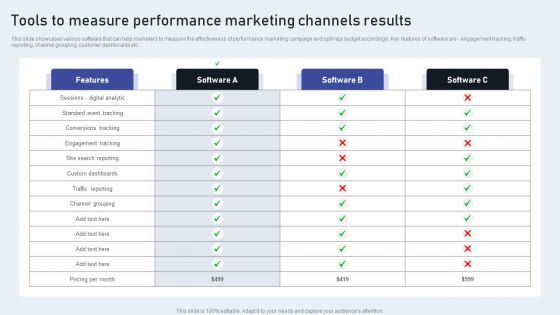
Tools To Measure Performance Marketing Channels Results Diagrams PDF
This slide showcases various software that can help marketers to measure the effectiveness of performance marketing campaign and optimize budget accordingly. Key features of software are - engagement tracking, traffic reporting, channel grouping, customer dashboards etc. The Tools To Measure Performance Marketing Channels Results Diagrams PDF is a compilation of the most recent design trends as a series of slides. It is suitable for any subject or industry presentation, containing attractive visuals and photo spots for businesses to clearly express their messages. This template contains a variety of slides for the user to input data, such as structures to contrast two elements, bullet points, and slides for written information. Slidegeeks is prepared to create an impression.
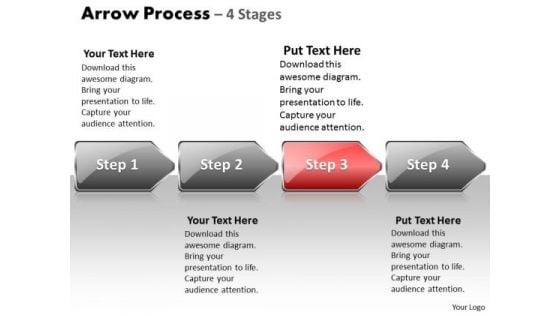
Flow Ppt Arrow Process 4 State Diagram Style 1 Communication Skills PowerPoint Image
We present our flow PPT arrow Process 4 state diagram style 1 communication skills PowerPoint Image. Use our Arrows PowerPoint Templates because; emphasize the benefits of healthy food habits and lifestyles in respect of vital organs of the human anatomy. Use our Business PowerPoint Templates because, explain the relevance of the different layers and stages in getting down to your core competence, ability and desired result. Use our Shapes PowerPoint Templates because, the lessons have been analyzed, studied and conclusions drawn. Use our Background PowerPoint Templates because, creating a winner is your passion and dream. Use our Finance PowerPoint Templates because, There are different paths to gain the necessary knowledge to achieve it. Use these PowerPoint slides for presentations relating to 3d, arrow, background, bullet, business, chart, checkmark, chevron, diagram, eps10, financial, five, glass, graphic, icon, illustration, isometric, management, perspective, placeholder, point, process, project, reflection, set, shadow, silver, stage, text, transparency, vector, white. The prominent colors used in the PowerPoint template are Red, Gray, and Black Collect the facts together on our Flow Ppt Arrow Process 4 State Diagram Style 1 Communication Skills PowerPoint Image. Draw your conclusions with comparative ease.
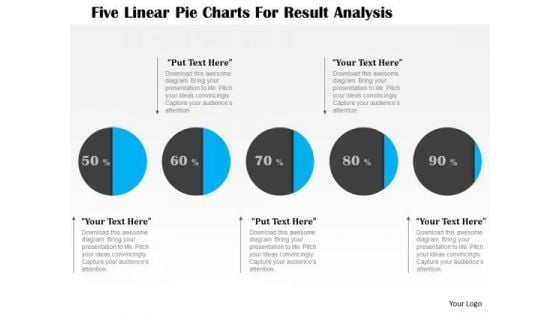
Business Diagram Five Linear Pie Charts For Result Analysis Presentation Template
This business diagram displays graphic of five staged process flow diagram. This PPT slide contains the concept of business data representation. Use this diagram to build professional presentation for your viewers.
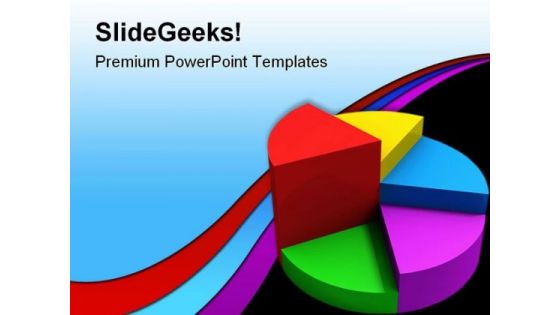
Pie Chart Business PowerPoint Template 0910
color pie diagram 3D graphic shape up improvement marketing steps Crunch the data with our Pie Chart Business PowerPoint Template 0910. Derive accurate conclusions with your ideas.
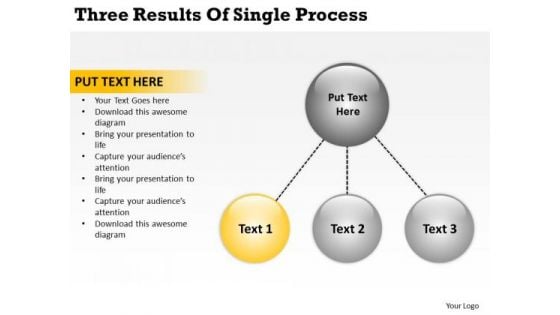
Three Results Of Single Process Business Plan Basics PowerPoint Slides
We present our three results of single process business plan basics PowerPoint Slides.Download and present our Business PowerPoint Templates because Our PowerPoint Templates and Slides are endowed to endure. Ideas conveyed through them will pass the test of time. Download and present our Process and Flows PowerPoint Templates because you can Set pulses racing with our PowerPoint Templates and Slides. They will raise the expectations of your team. Use our Circle Charts PowerPoint Templates because You can Hit a home run with our PowerPoint Templates and Slides. See your ideas sail into the minds of your audience. Download our Shapes PowerPoint Templates because They will Put your wonderful verbal artistry on display. Our PowerPoint Templates and Slides will provide you the necessary glam and glitter. Download our Flow Charts PowerPoint Templates because You should Throw the gauntlet with our PowerPoint Templates and Slides. They are created to take up any challenge.Use these PowerPoint slides for presentations relating to Business, avector, process, design, special, chart, banner, website, speech, form, corporate, order, concept, bright, symbol, template, circle, match, usable, graphic, element, different, idea, shape, abstract, cycle, creative, illustration, piece, connection, strategy, place, frame, web, solution, group, color, colorful, blue, text, empty, access, part, background, conceptual, message, system . The prominent colors used in the PowerPoint template are Orange, Gray, Black. Achievestrong & sustainable performance gains with our Three Results Of Single Process Business Plan Basics PowerPoint Slides. They will make you look good.
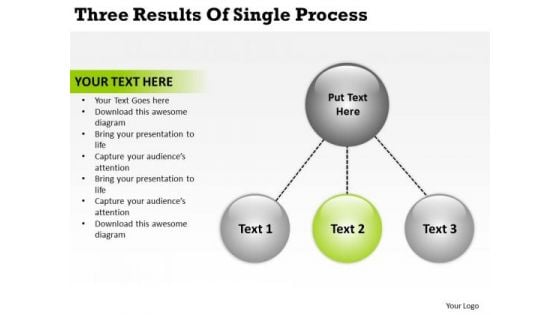
Three Results Of Single Process Online Business Plans PowerPoint Slides
We present our three results of single process online business plans PowerPoint Slides.Use our Business PowerPoint Templates because It will Strengthen your hand with your thoughts. They have all the aces you need to win the day. Download and present our Process and Flows PowerPoint Templates because Our PowerPoint Templates and Slides will fulfill your every need. Use them and effectively satisfy the desires of your audience. Present our Circle Charts PowerPoint Templates because They will Put your wonderful verbal artistry on display. Our PowerPoint Templates and Slides will provide you the necessary glam and glitter. Download and present our Shapes PowerPoint Templates because Our PowerPoint Templates and Slides will let your words and thoughts hit bullseye everytime. Download and present our Flow Charts PowerPoint Templates because It will mark the footprints of your journey. Illustrate how they will lead you to your desired destination.Use these PowerPoint slides for presentations relating to Business, avector, process, design, special, chart, banner, website, speech, form, corporate, order, concept, bright, symbol, template, circle, match, usable, graphic, element, different, idea, shape, abstract, cycle, creative, illustration, piece, connection, strategy, place, frame, web, solution, group, color, colorful, blue, text, empty, access, part, background, conceptual, message, system . The prominent colors used in the PowerPoint template are Green, Gray, Black. Make use of the facilities our Three Results Of Single Process Online Business Plans PowerPoint Slides offer. You will be delighted with the choices available.
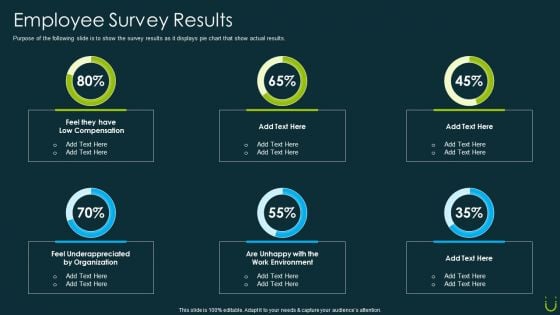
Staff Retention Plan Employee Survey Results Ppt Model Summary PDF
Purpose of the following slide is to show the survey results as it displays pie chart that show actual results. Deliver an awe inspiring pitch with this creative staff retention plan employee survey results ppt model summary pdf bundle. Topics like employee survey results can be discussed with this completely editable template. It is available for immediate download depending on the needs and requirements of the user.
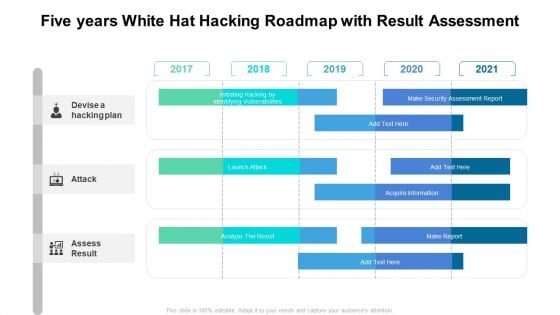
Five Years White Hat Hacking Roadmap With Result Assessment Guidelines
Presenting the five years white hat hacking roadmap with result assessment guidelines. The template includes a roadmap that can be used to initiate a strategic plan. Not only this, the PowerPoint slideshow is completely editable and you can effortlessly modify the font size, font type, and shapes according to your needs. This PPT slide can be easily reached in standard screen and widescreen aspect ratios. The set is also available in various formats like PDF, PNG, and JPG. So download and use it multiple times as per your knowledge.
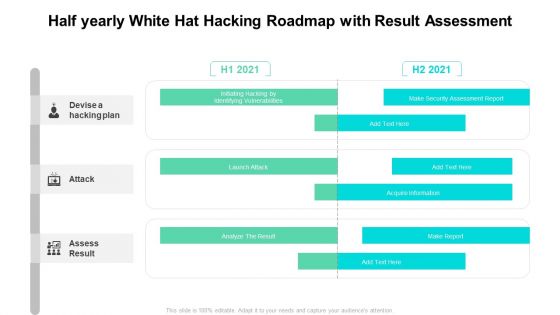
Half Yearly White Hat Hacking Roadmap With Result Assessment Graphics
Presenting the half yearly white hat hacking roadmap with result assessment graphics. The template includes a roadmap that can be used to initiate a strategic plan. Not only this, the PowerPoint slideshow is completely editable and you can effortlessly modify the font size, font type, and shapes according to your needs. This PPT slide can be easily reached in standard screen and widescreen aspect ratios. The set is also available in various formats like PDF, PNG, and JPG. So download and use it multiple times as per your knowledge.

 Home
Home