Percentage Bar
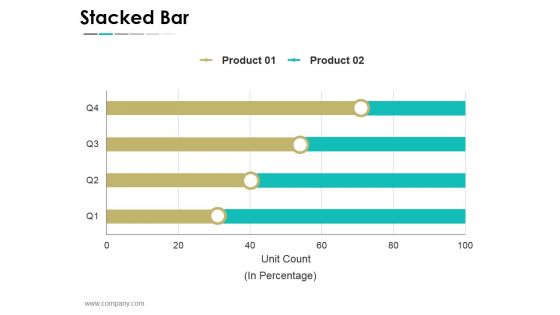
Stacked Bar Ppt PowerPoint Presentation Infographics Graphics
This is a stacked bar ppt powerpoint presentation infographics graphics. This is a four stage process. The stages in this process are business, strategy, marketing, success, unit count, in percentage.
Bar Chart Ppt PowerPoint Presentation Portfolio Icons
This is a bar chart ppt powerpoint presentation portfolio icons. This is a seven stage process. The stages in this process are in years, in percentage, finance, business marketing.
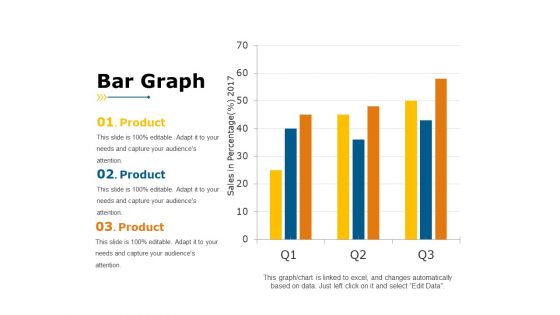
Bar Graph Ppt PowerPoint Presentation Portfolio Example
This is a bar graph ppt powerpoint presentation portfolio example. This is a three stage process. The stages in this process are sales in percentage, year, business, product, business, graph.
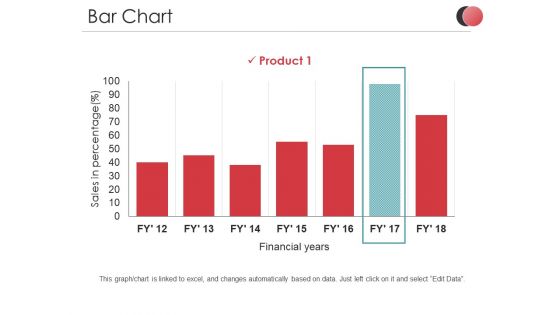
Bar Chart Ppt PowerPoint Presentation Outline Introduction
This is a bar chart ppt powerpoint presentation outline introduction. This is a one stage process. The stages in this process are sales in percentage, product, business, financial years, graph.
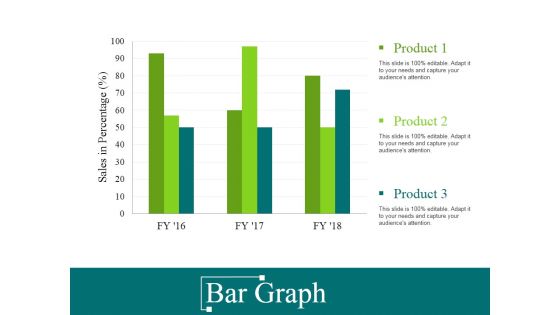
Bar Graph Ppt PowerPoint Presentation Gallery Grid
This is a bar graph ppt powerpoint presentation gallery grid. This is a three stage process. The stages in this process are sales in percentage, product, finance, business, marketing.
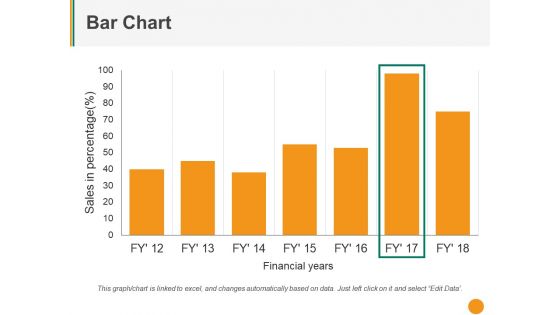
Bar Chart Ppt PowerPoint Presentation Styles Outfit
This is a bar chart ppt powerpoint presentation styles outfit. This is a Seven stage process. The stages in this process are sales in percentage, financial years, graph, business.
Bar Chart Ppt PowerPoint Presentation Icon Demonstration
This is a bar chart ppt powerpoint presentation icon demonstration. This is a seven stage process. The stages in this process are product, sales in percentage, financial year, graph.

Bar Chart Ppt PowerPoint Presentation Portfolio Diagrams
This is a bar chart ppt powerpoint presentation portfolio diagrams. This is a three stage process. The stages in this process are sales in percentage, business, marketing, graph, finance.
Bar Chart Ppt PowerPoint Presentation Icon Introduction
This is a bar chart ppt powerpoint presentation icon introduction. This is a seven stage process. The stages in this process are in years, in percentage, business, marketing, graph.
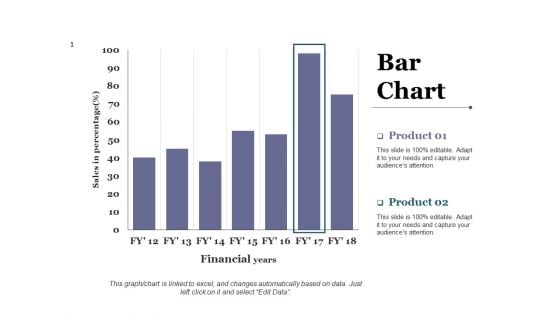
Bar Chart Ppt PowerPoint Presentation Diagram Lists
This is a bar chart ppt powerpoint presentation diagram lists. This is a two stage process. The stages in this process are business, marketing, financial years, sales in percentage, graph.
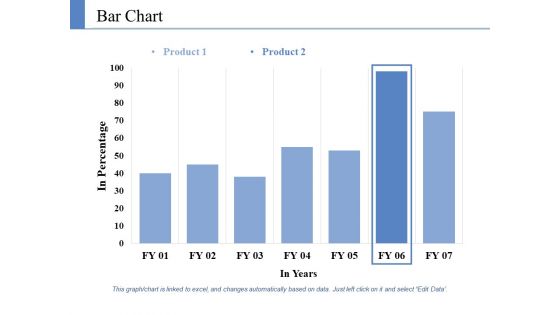
Bar Chart Ppt PowerPoint Presentation Ideas Deck
This is a bar chart ppt powerpoint presentation ideas deck. This is a two stage process. The stages in this process are product, in percentage, in years, financial, business.
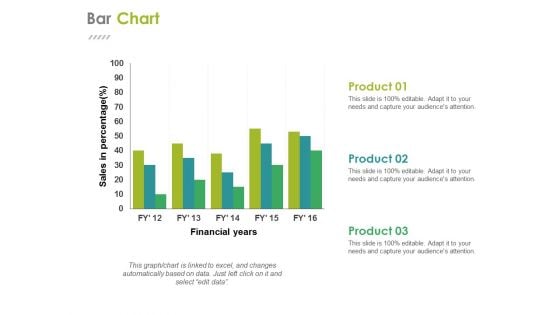
Bar Chart Ppt PowerPoint Presentation Summary Themes
This is a bar chart ppt powerpoint presentation summary themes. This is a three stage process. The stages in this process are financial years, sales in percentage, business, marketing, graph.
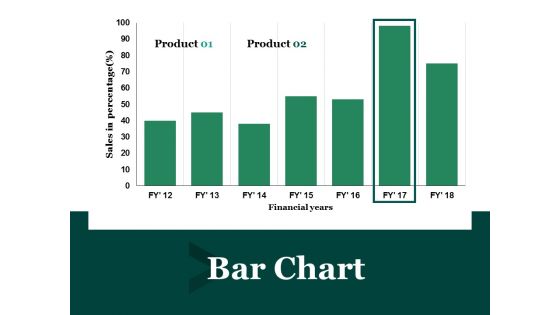
Bar Chart Ppt PowerPoint Presentation Layouts Template
This is a bar chart ppt powerpoint presentation layouts template. This is a two stage process. The stages in this process are financial year, sales in percentage, business, marketing, finance.
Bar Graph Ppt PowerPoint Presentation Infographics Icon
This is a bar graph ppt powerpoint presentation infographics icon. This is a two stage process. The stages in this process are business, marketing, financial year, in percentage, graph.
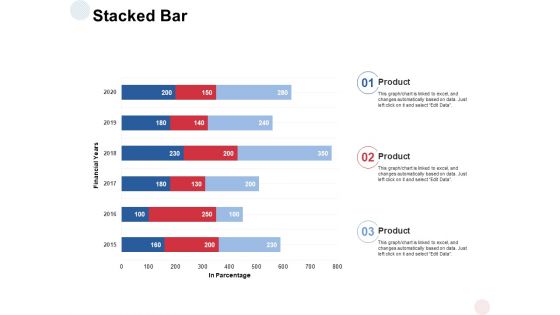
Stacked Bar Analysis Ppt PowerPoint Presentation Styles Graphics Template
Presenting this set of slides with name stacked bar analysis ppt powerpoint presentation styles graphics template. The topics discussed in these slides are stacked bar, financial years, percentage. This is a completely editable PowerPoint presentation and is available for immediate download. Download now and impress your audience.
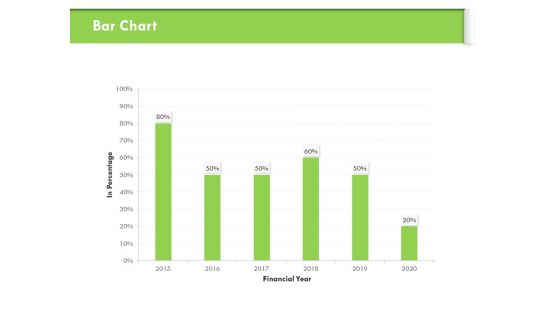
Understanding Organizational Structures Bar Chart Ppt Professional Visuals PDF
Presenting this set of slides with name understanding organizational structures bar chart ppt professional visuals pdf. The topics discussed in these slides are bar chart, financial year, percentage. This is a completely editable PowerPoint presentation and is available for immediate download. Download now and impress your audience.
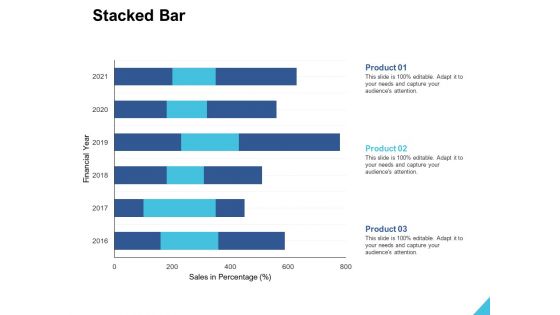
Stacked Bar Analysis Ppt PowerPoint Presentation Gallery Outline
Presenting this set of slides with name stacked bar analysis ppt powerpoint presentation gallery outline. The topics discussed in these slides are stacked bar, financial year, sales in percentage. This is a completely editable PowerPoint presentation and is available for immediate download. Download now and impress your audience.

Bar Graph Business PowerPoint Templates And PowerPoint Themes 1012
Bar Graph Business PowerPoint Templates And PowerPoint Themes 1012-This PowerPoint Template shows the Bar Graph with increasing percentage which signifies the Financial Growth. The Template signifies the concept of business growth. The structure of our templates allows you to effectively highlight the key issues concerning the growth of your business. Our PPT images are so ideally designed that it reveals the very basis of our PPT template are an effective tool to make your clients understand.-Bar Graph Business PowerPoint Templates And PowerPoint Themes 1012-This PowerPoint template can be used for presentations relating to-Financial bar graph chart, technology, money, business, finance, marketing Handle a delicate situation with our Bar Graph Business PowerPoint Templates And PowerPoint Themes 1012. Just download, type and present.

Stakeholders Fund And Market Analysis Bar Graph Powerpoint Slide Information
This is a stakeholders fund and market analysis bar graph powerpoint slide information. This is a five stage process. The stages in this process are shareholders funds, market capitalization, market capitalization as a percentage of cse market capitalization.

Business Diagram Business Bar Graph For Data Analysis Presentation Template
This business slide displays pie charts with percentage ratios. This diagram is a data visualization tool that gives you a simple way to present statistical information. This slide helps your audience examines and interprets the data you present.
Bar Graph To Compare Business Data PowerPoint Slides
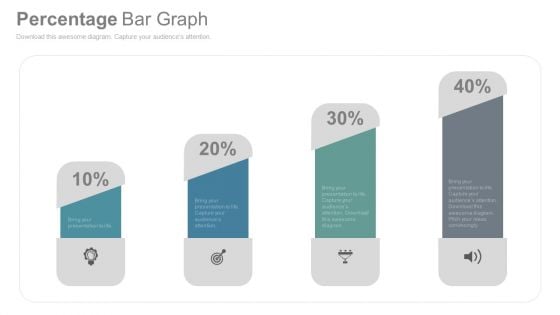
This is the slide which can solve many purposes of yours. Be it growth in your company, need to show your company?s status in the market as compared to others, or how your business has improved so far. An ideal PowerPoint template to display all of these. You can easily use this graph to show the growth of your company using the percentage icons. You can use this visual to show the status of your company in the market in comparison with others. You can edit the icons and replace them with the logo of your company and the others. You can also show it to your colleagues how your company has built its image in the market or how it has improved over the time. A perfect bar graph image which needs to be included in your business PPT presentations.
Overall Revenue Analysis Bar Chart Powerpoint Slide Information
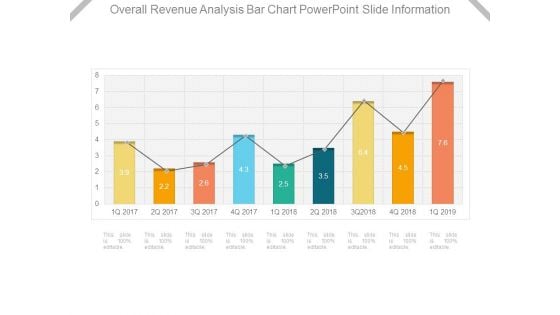
This is a overall revenue analysis bar chart powerpoint slide information. This is a nine stage process. The stages in this process are finance, success, business, marketing, percentage.
Stacked Bar Ppt PowerPoint Presentation Styles Designs Download
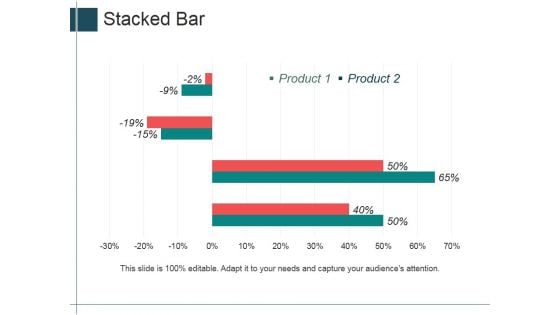
This is a stacked bar ppt powerpoint presentation styles designs download. This is a four stage process. The stages in this process are product, finance, percentage, business.
Bar Chart Ppt PowerPoint Presentation Infographic Template Example
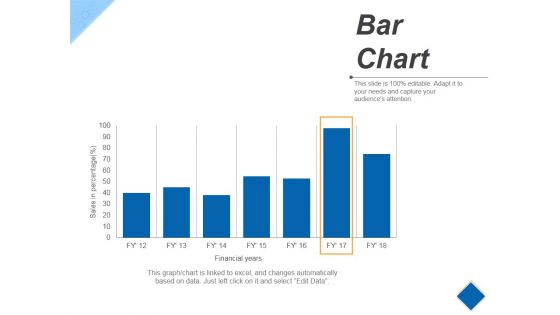
This is a bar chart ppt powerpoint presentation infographic template example. This is a seven stage process. The stages in this process are business, finance, marketing, percentage.
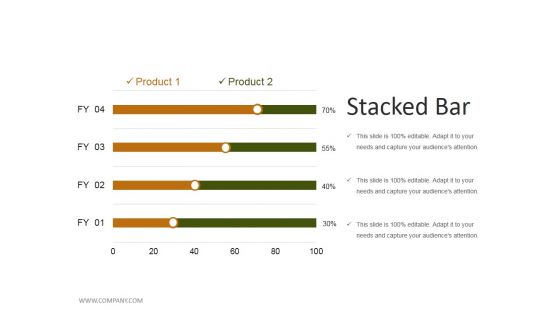
Stacked Bar Ppt PowerPoint Presentation Gallery File Formats
This is a stacked bar ppt powerpoint presentation gallery file formats. This is a four stage process. The stages in this process are finance, product, percentage, business, marketing.

Bar Graph Ppt PowerPoint Presentation Styles File Formats
This is a bar graph ppt powerpoint presentation styles file formats. This is a four stage process. The stages in this process are percentage, business, marketing, finance, strategy.
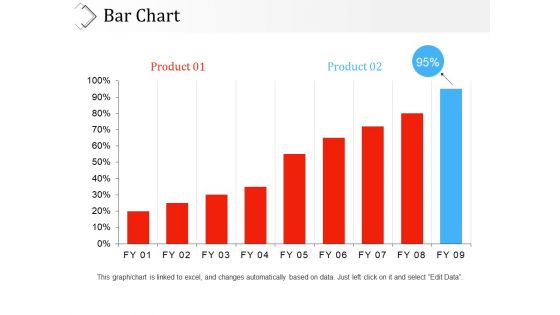
Bar Chart Ppt PowerPoint Presentation Show Example File
This is a bar chart ppt powerpoint presentation show example file. This is a two stage process. The stages in this process are product, business, marketing, graph, percentage.
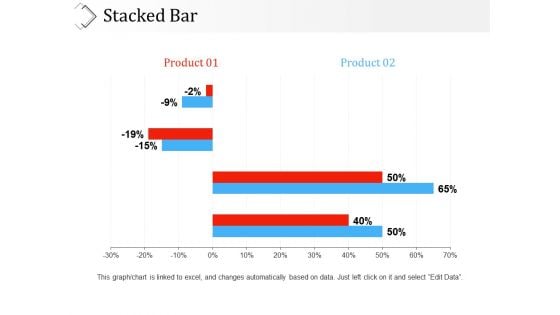
Stacked Bar Ppt PowerPoint Presentation Infographic Template Clipart
This is a stacked bar ppt powerpoint presentation infographic template clipart. This is a two stage process. The stages in this process are product, percentage, business, marketing, graph.
Stacked Bar Ppt PowerPoint Presentation Icon Background Image
This is a stacked bar ppt powerpoint presentation icon background image. This is a four stage process. The stages in this process are product, percentage, finance, business, marketing.
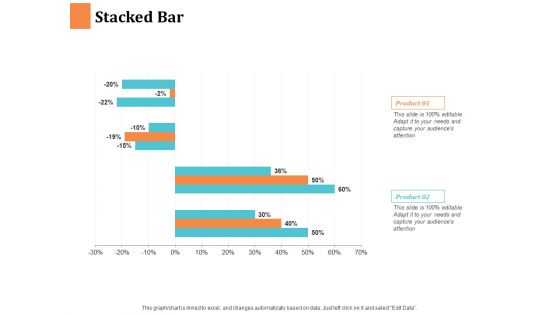
Stacked Bar Ppt PowerPoint Presentation Visual Aids Pictures
This is a stacked bar ppt powerpoint presentation visual aids pictures. This is a two stage process. The stages in this process are product, percentage, finance, business, marketing.
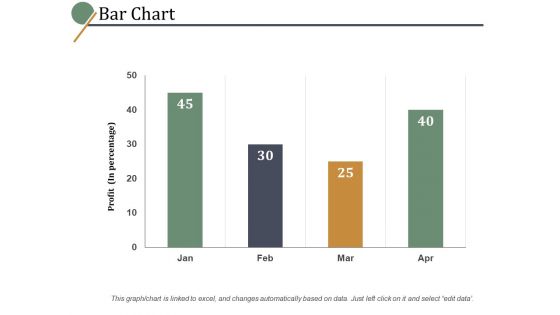
Bar Chart Slide Ppt PowerPoint Presentation Summary Example File
This is a bar chart slide ppt powerpoint presentation summary example file. This is a three stage process. The stages in this process are percentage, marketing, management, product.
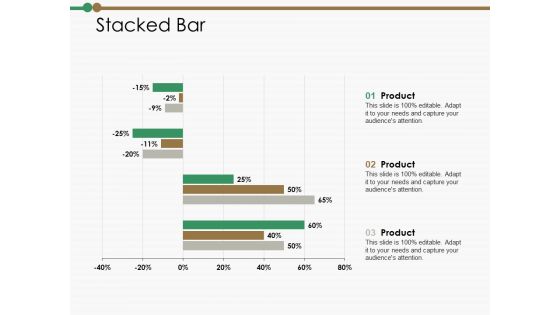
Stacked Bar Ppt PowerPoint Presentation Summary Clipart Images
This is a stacked bar ppt powerpoint presentation summary clipart images. This is a three stage process. The stages in this process are financial, percentage, product, management, marketing.
Clustered Bar Ppt PowerPoint Presentation Icon Background Image
This is a clustered bar ppt powerpoint presentation icon background image. This is a three stage process. The stages in this process are percentage, product, business, marketing.
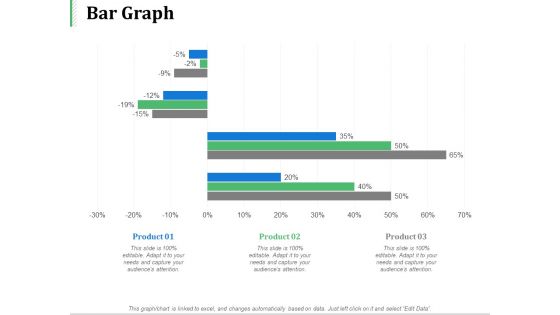
Bar Graph Product Ppt PowerPoint Presentation Layouts Ideas
This is a bar graph product ppt powerpoint presentation layouts ideas. This is a three stage process. The stages in this process are business, management, marketing, product, percentage.
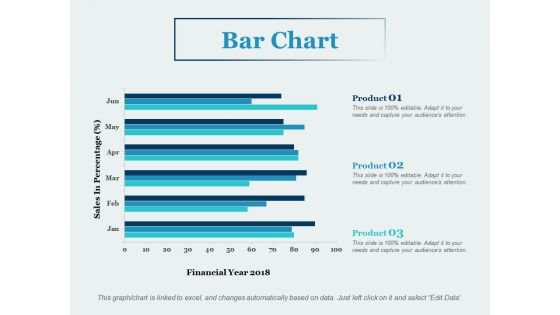
Bar Chart Product Ppt PowerPoint Presentation Summary Diagrams
This is a bar chart product ppt powerpoint presentation summary diagrams. This is a three stage process. The stages in this process are business, management, marketing, percentage, product.
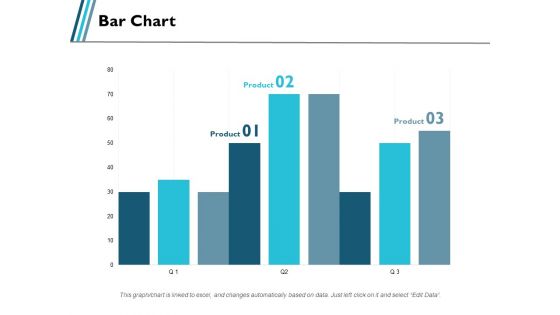
Bar Chart Product Ppt PowerPoint Presentation Portfolio Visuals
This is a bar chart product ppt powerpoint presentation portfolio visuals. This is a three stage process. The stages in this process are business, management, marketing, percentage, product.
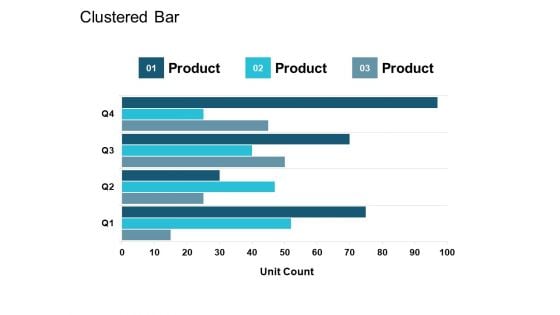
Clustered Bar Product Ppt PowerPoint Presentation Inspiration Elements
This is a clustered bar product ppt powerpoint presentation inspiration elements. This is a three stage process. The stages in this process are percentage, product, business, management, marketing.
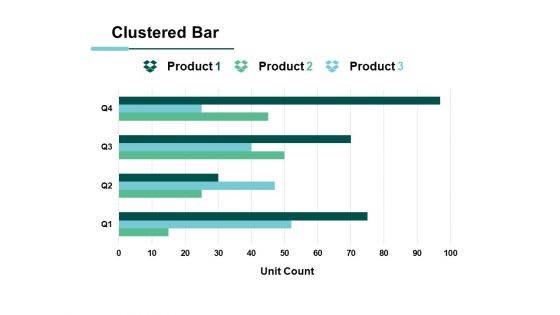
Clustered Bar Financial Ppt PowerPoint Presentation Model Format
This is a clustered bar financial ppt powerpoint presentation model format. This is a three stage process. The stages in this process are business, management, marketing, percentage, product.
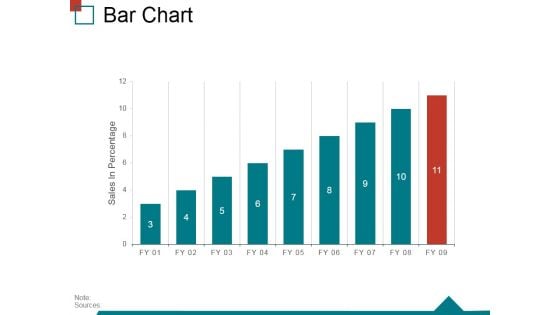
Bar Chart Ppt PowerPoint Presentation Infographic Template Skills
This is a bar chart ppt powerpoint presentation infographic template skills. This is a nine stage process. The stages in this process are sales in percentage, finance, business, marketing, strategy, success.

Improving Business Revenue Bar Graph Ppt PowerPoint Presentation Infographic Template
This is a improving business revenue bar graph ppt powerpoint presentation infographic template. This is a six stage process. The stages in this process are graph, arrow, finance, percentage, success.
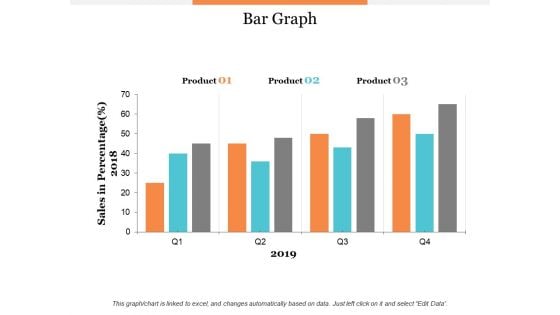
Bar Graph Product Ppt PowerPoint Presentation Model Graphic Tips
This is a bar graph product ppt powerpoint presentation model graphic tips. This is a three stage process. The stages in this process are product, percentage, business, management, marketing.
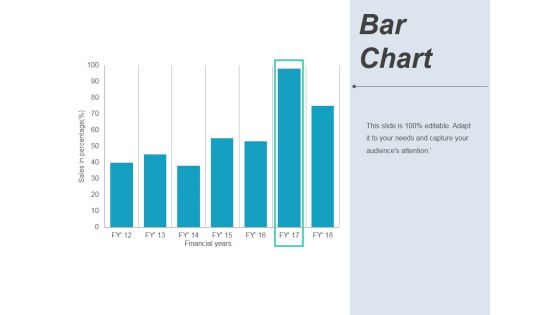
Bar Chart Ppt PowerPoint Presentation Pictures Background Image
This is a bar chart ppt powerpoint presentation pictures background image. This is a seven stage process. The stages in this process are financial years, sales in percentage, graph, business.
Stacked Bar Template 2 Ppt PowerPoint Presentation Icon Pictures
This is a stacked bar template 2 ppt powerpoint presentation icon pictures. This is a four stage process. The stages in this process are product, percentage, finance, business, marketing.
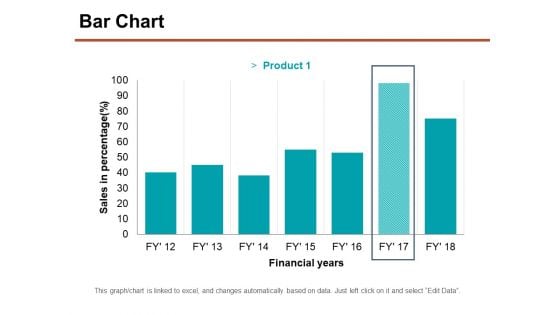
Bar Chart Ppt PowerPoint Presentation Professional Graphics Download
This is a bar chart ppt powerpoint presentation professional graphics download. This is a seven stage process. The stages in this process are sales in percentage, financial years, chart, business.
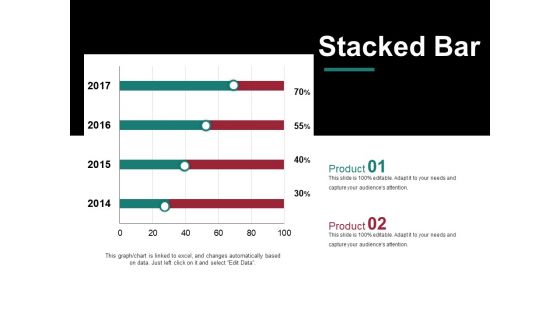
Stacked Bar Template 2 Ppt PowerPoint Presentation Model Graphic Images
This is a stacked bar template 2 ppt powerpoint presentation model graphic images. This is a two stage process. The stages in this process are business, years, marketing, percentage, finance.
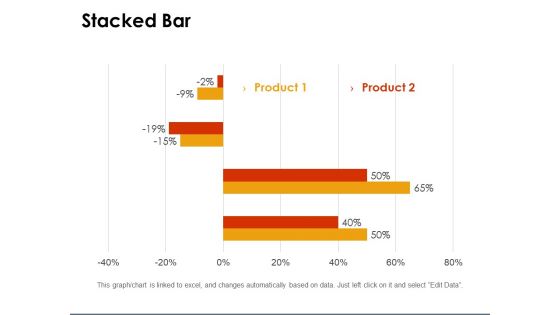
Stacked Bar Template 1 Ppt PowerPoint Presentation Gallery Clipart
This is a stacked bar template 1 ppt powerpoint presentation gallery clipart. This is a two stage process. The stages in this process are percentage, graph, business, marketing, finance.
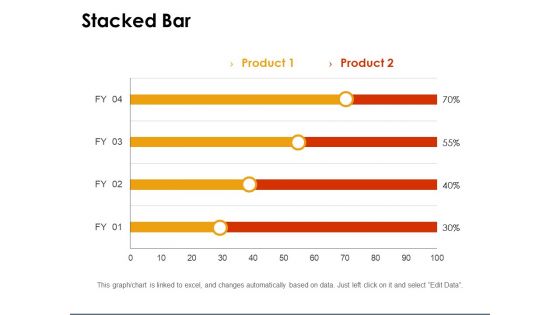
Stacked Bar Template 2 Ppt PowerPoint Presentation Infographics Graphics Design
This is a stacked bar template 2 ppt powerpoint presentation infographics graphics design. This is a two stage process. The stages in this process are percentage, business, marketing, finance.
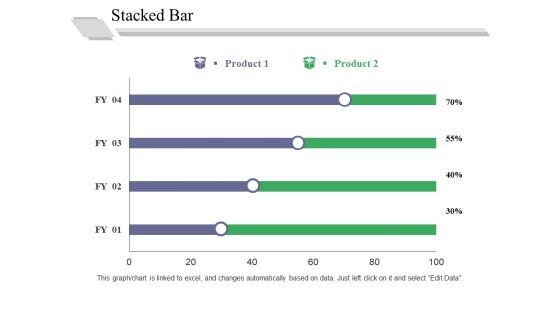
Stacked Bar Template 1 Ppt PowerPoint Presentation Outline Good
This is a stacked bar template 1 ppt powerpoint presentation outline good. This is a two stage process. The stages in this process are in percentage, business, marketing, graph, strategy.
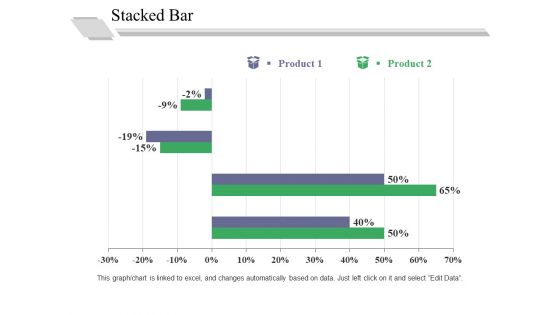
Stacked Bar Template 2 Ppt PowerPoint Presentation Professional Graphics Pictures
This is a stacked bar template 2 ppt powerpoint presentation professional graphics pictures. This is a two stage process. The stages in this process are in percentage, business, marketing, graph, strategy.
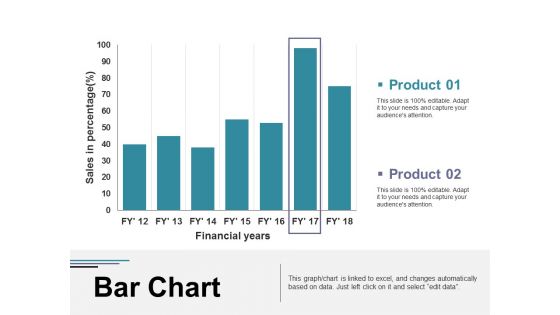
Bar Chart Ppt PowerPoint Presentation Visual Aids Diagrams
This is a bar chart ppt powerpoint presentation visual aids diagrams. This is a two stage process. The stages in this process are business, marketing, financial years, sales in percentage, graph.
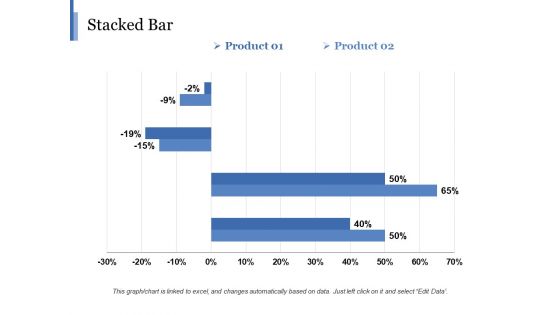
Stacked Bar Template 2 Ppt PowerPoint Presentation Gallery Background
This is a stacked bar template 2 ppt powerpoint presentation gallery background. This is a two stage process. The stages in this process are business, marketing, finance, graph, strategy, percentage.
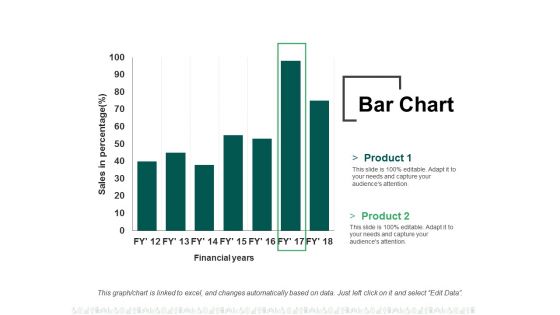
Bar Chart Ppt PowerPoint Presentation Summary File Formats
This is a bar chart ppt powerpoint presentation summary file formats. This is a two stage process. The stages in this process are business, finance, financial years, sales in percentage, graph.
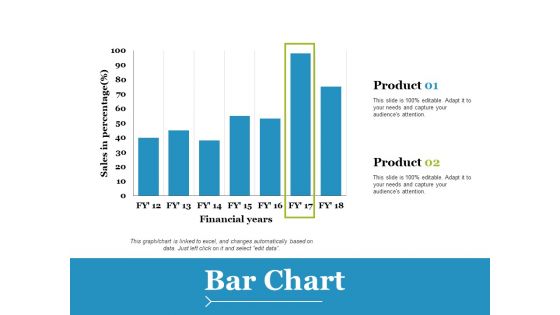
Bar Chart Ppt PowerPoint Presentation Slides Example File
This is a bar chart ppt powerpoint presentation slides example file. This is a two stage process. The stages in this process are product, financial years, sales in percentage.
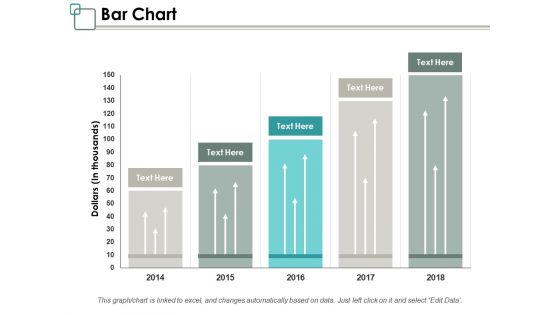
Bar Chart Ppt PowerPoint Presentation Infographic Template Graphics Design
This is a bar chart ppt powerpoint presentation infographic template graphics design. This is a five stage process. The stages in this process are management, marketing, business, percentage, product.
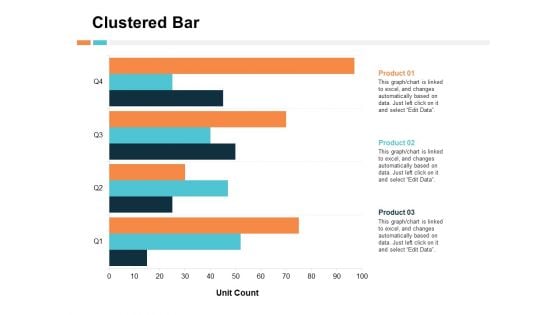
Clustered Bar Financial Ppt PowerPoint Presentation Gallery Designs Download
This is a clustered bar financial ppt powerpoint presentation gallery designs download. This is a three stage process. The stages in this process are percentage, product, business, management, marketing.
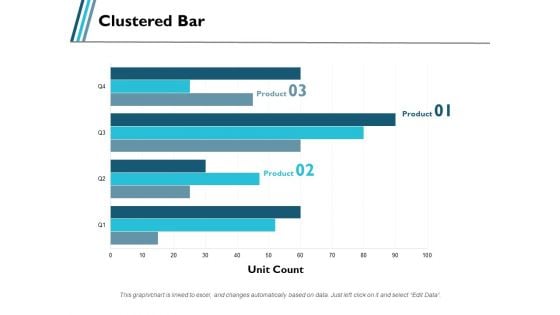
Clustered Bar Business Product Ppt PowerPoint Presentation Gallery Background
This is a clustered bar business product ppt powerpoint presentation gallery background. This is a three stage process. The stages in this process are business, management, marketing, percentage, product.
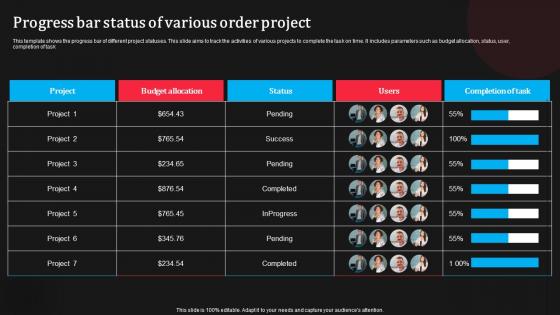
Progress Bar Status Of Various Order Project Inspiration Pdf
This template shows the progress bar of different project statuses. This slide aims to track the activities of various projects to complete the task on time. It includes parameters such as budget allocation, status, user,completion of task.Showcasing this set of slides titled Progress Bar Status Of Various Order Project Inspiration Pdf The topics addressed in these templates are Progress Bar Status, Various Order Project All the content presented in this PPT design is completely editable. Download it and make adjustments in color, background, font etc. as per your unique business setting. This template shows the progress bar of different project statuses. This slide aims to track the activities of various projects to complete the task on time. It includes parameters such as budget allocation, status, user,completion of task.
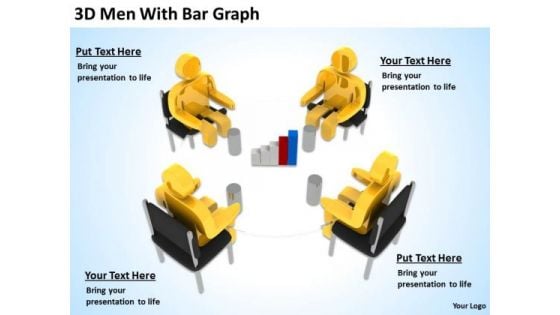
Business People Vector 3d Men With Bar Graph PowerPoint Slides
We present our business people vector 3d men with bar graph PowerPoint Slides.Use our People PowerPoint Templates because Our PowerPoint Templates and Slides are a sure bet. Gauranteed to win against all odds. Download and present our Business PowerPoint Templates because Our PowerPoint Templates and Slides will bullet point your ideas. See them fall into place one by one. Download and present our Flow Charts PowerPoint Templates because Our PowerPoint Templates and Slides are created by a hardworking bunch of busybees. Always flitting around with solutions gauranteed to please. Download our Marketing PowerPoint Templates because It can Bubble and burst with your ideas. Use our Shapes PowerPoint Templates because Our PowerPoint Templates and Slides will let you Leave a lasting impression to your audiences. They possess an inherent longstanding recall factor.Use these PowerPoint slides for presentations relating to 3d, accounting, analysis, bar, business, cartoon,cash, character, chart, clipart, committee, company, concept, corporate,council, directors, display, document, economics, executive, figure, finance,financial, goal, graph, group, growth, guy, human, humanoid, man, management,market, meeting, money, office, percentage, performance, pie, presentation, report,room, statistics, table, team. The prominent colors used in the PowerPoint template are Yellow, Black, Gray. Professionals tell us our business people vector 3d men with bar graph PowerPoint Slides have awesome images to get your point across. Professionals tell us our analysis PowerPoint templates and PPT Slides will help you be quick off the draw. Just enter your specific text and see your points hit home. People tell us our business people vector 3d men with bar graph PowerPoint Slides effectively help you save your valuable time. Customers tell us our bar PowerPoint templates and PPT Slides are effectively colour coded to prioritise your plans They automatically highlight the sequence of events you desire. The feedback we get is that our business people vector 3d men with bar graph PowerPoint Slides will generate and maintain the level of interest you desire. They will create the impression you want to imprint on your audience. Use our business PowerPoint templates and PPT Slides have awesome images to get your point across. Upgrade your presentation with our Business People Vector 3d Men With Bar Graph PowerPoint Slides. Download without worries with our money back guaranteee.
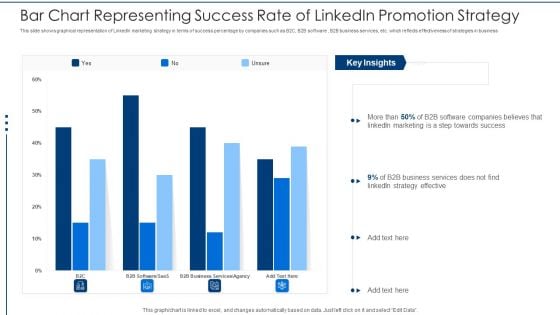
Bar Chart Representing Success Rate Of Linkedin Promotion Strategy Rules PDF
This slide shows graphical representation of LinkedIn marketing strategy in terms of success percentage by companies such as B2C, B2B software , B2B business services, etc. which reflects effectiveness of strategies in business Pitch your topic with ease and precision using this bar chart representing success rate of linkedin promotion strategy rules pdf. This layout presents information on bar chart representing success rate of linkedin promotion strategy. It is also available for immediate download and adjustment. So, changes can be made in the color, design, graphics or any other component to create a unique layout.
Multiple Projects Progress Tracking Report Tracking Report With Bar Graph Information PDF
This slide shows the status report of various projects in order to help the project manager to track their performance. It includes project names, no.of tasks, start and end date, days taken for completion, progress and remaining percentage of projects.Showcasing this set of slides titled Multiple Projects Progress Tracking Report Tracking Report With Bar Graph Information PDF. The topics addressed in these templates are Multiple Projects, Progress Tracking, Report Tracking Report. All the content presented in this PPT design is completely editable. Download it and make adjustments in color, background, font etc. as per your unique business setting.


 Continue with Email

 Home
Home


