Percentage Bar
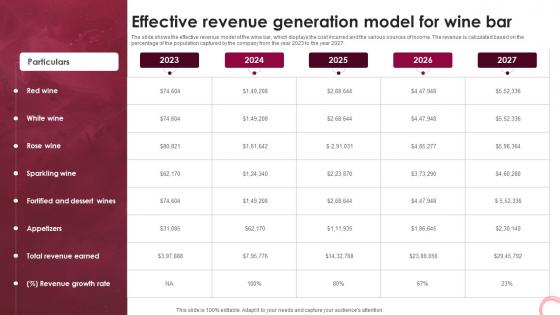
Wine Lounge Business Plan Effective Revenue Generation Model For Wine Bar BP SS V
The slide shows the effective revenue model of the wine bar, which displays the cost incurred and the various sources of income. The revenue is calculated based on the percentage of the population captured by the company from the year 2023 to the year 2027. Crafting an eye-catching presentation has never been more straightforward. Let your presentation shine with this tasteful yet straightforward Wine Lounge Business Plan Effective Revenue Generation Model For Wine Bar BP SS V template. It offers a minimalistic and classy look that is great for making a statement. The colors have been employed intelligently to add a bit of playfulness while still remaining professional. Construct the ideal Wine Lounge Business Plan Effective Revenue Generation Model For Wine Bar BP SS V that effortlessly grabs the attention of your audience Begin now and be certain to wow your customers The slide shows the effective revenue model of the wine bar, which displays the cost incurred and the various sources of income. The revenue is calculated based on the percentage of the population captured by the company from the year 2023 to the year 2027.
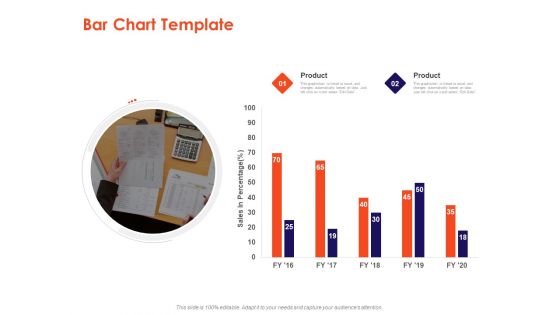
Understanding Business REQM Bar Chart Template Ppt Ideas Visual Aids PDF
Presenting this set of slides with name understanding business reqm bar chart template ppt ideas visual aids pdf. The topics discussed in these slides are product, sales, percentage. This is a completely editable PowerPoint presentation and is available for immediate download. Download now and impress your audience.
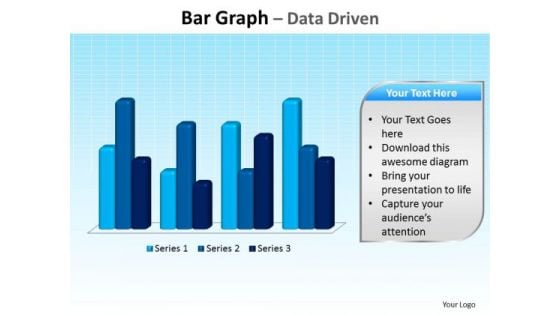
Business Education PowerPoint Templates Business Bar Graph Data Driven Ppt Slides
Business Education PowerPoint Templates Business bar graph data driven PPT Slides-This PowerPoint slide is a data driven Columns Chart. The number of columns depend on the data.-Business Editable PowerPoint Templates Business beveled column chart PPT Slides-This ppt can be used for concepts relating to-chart,, graph, growth, investment, , market, percentage, , presentation report, results, statistics, stock, success and business. Our Business Education PowerPoint Templates Business Bar Graph Data Driven Ppt Slides keep the faith alive. Belief in you will get stronger.
The Business People 3d Man Walking On Bar Graph Side PowerPoint Slides
We present our the business people 3d man walking on bar graph side PowerPoint Slides.Present our People PowerPoint Templates because Our PowerPoint Templates and Slides are created by a hardworking bunch of busybees. Always flitting around with solutions gauranteed to please. Present our Business PowerPoint Templates because Your success is our commitment. Our PowerPoint Templates and Slides will ensure you reach your goal. Use our Future PowerPoint Templates because you should once Tap the ingenuity of our PowerPoint Templates and Slides. They are programmed to succeed. Download and present our Success PowerPoint Templates because It can Conjure up grand ideas with our magical PowerPoint Templates and Slides. Leave everyone awestruck by the end of your presentation. Use our Process and Flows PowerPoint Templates because Our PowerPoint Templates and Slides provide you with a vast range of viable options. Select the appropriate ones and just fill in your text. Use these PowerPoint slides for presentations relating to 3d, aim, background, bar, business, chart, climbing, competition,concept, confident, corporate, design, executive, finance, financial, goal, graph,graphic, growing, growth, idea, illustration, market, men, people, percentage,person, phone, purple, race, rising, running, share, smart, succeed, success,successful, suit, walking, white, winner, worker, working. The prominent colors used in the PowerPoint template are Red, Gray, White. We assure you our the business people 3d man walking on bar graph side PowerPoint Slides will help them to explain complicated concepts. You can be sure our concept PowerPoint templates and PPT Slides will make the presenter look like a pro even if they are not computer savvy. Use our the business people 3d man walking on bar graph side PowerPoint Slides are second to none. We assure you our chart PowerPoint templates and PPT Slides are second to none. Use our the business people 3d man walking on bar graph side PowerPoint Slides will make the presenter successul in his career/life. Professionals tell us our background PowerPoint templates and PPT Slides are aesthetically designed to attract attention. We guarantee that they will grab all the eyeballs you need. Put our The Business People 3d Man Walking On Bar Graph Side PowerPoint Slides under examination. They will come out with flying colours.
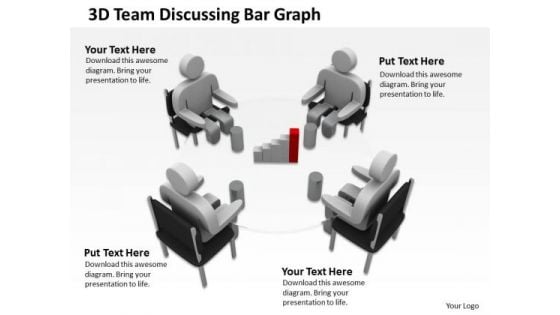
How To Draw Business Process Diagram 3d Team Discussing Bar Graph PowerPoint Templates
We present our how to draw business process diagram 3d team discussing bar graph PowerPoint templates.Download and present our Business PowerPoint Templates because It will get your audience in sync. Download and present our People PowerPoint Templates because You can Be the puppeteer with our PowerPoint Templates and Slides as your strings. Lead your team through the steps of your script. Use our Finance PowerPoint Templates because Our PowerPoint Templates and Slides are created by a hardworking bunch of busybees. Always flitting around with solutions gauranteed to please. Download and present our Symbol PowerPoint Templates because Our PowerPoint Templates and Slides will provide you a launch platform. Give a lift off to your ideas and send them into orbit. Download and present our Success PowerPoint Templates because You have gained great respect for your brilliant ideas. Use our PowerPoint Templates and Slides to strengthen and enhance your reputation.Use these PowerPoint slides for presentations relating to 3d, art, boardroom, budget, business, ceo, character, communication, concept, conference, corporate, council, discussion, economy, executive, finance, gold, graph, growth, icon, idea, idiom, illustration, isolated, lecture, manage, management, market, meet, metaphor, money, office, over, percentage, planning, presentation, projection, prospectus, report, study, summit, symbol, talk, team, white. The prominent colors used in the PowerPoint template are Red, Gray, Black. The feedback we get is that our how to draw business process diagram 3d team discussing bar graph PowerPoint templates are designed by a team of presentation professionals. Customers tell us our character PowerPoint templates and PPT Slides will impress their bosses and teams. The feedback we get is that our how to draw business process diagram 3d team discussing bar graph PowerPoint templates are designed by professionals Professionals tell us our business PowerPoint templates and PPT Slides are readymade to fit into any presentation structure. Presenters tell us our how to draw business process diagram 3d team discussing bar graph PowerPoint templates will make you look like a winner. You can be sure our ceo PowerPoint templates and PPT Slides provide you with a vast range of viable options. Select the appropriate ones and just fill in your text. Our How To Draw Business Process Diagram 3d Team Discussing Bar Graph PowerPoint Templates help you think on your feet. They provide you with ready answers.
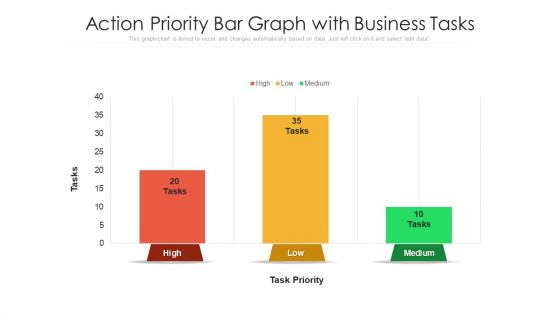
Action Priority Bar Graph With Business Tasks Ppt Layouts Graphics Download PDF
Showcasing this set of slides titled action priority bar graph with business tasks ppt layouts graphics download pdf. The topics addressed in these templates are action priority bar graph with business tasks. All the content presented in this PPT design is completely editable. Download it and make adjustments in color, background, font etc. as per your unique business setting.
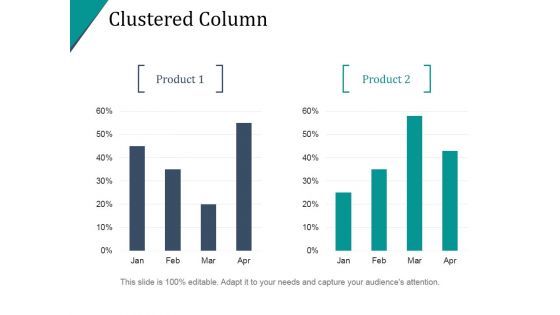
Clustered Column Ppt PowerPoint Presentation Infographic Template
This is a clustered column ppt powerpoint presentation infographic template. This is a two stage process. The stages in this process are finance, percentage, bar graph, business, marketing.
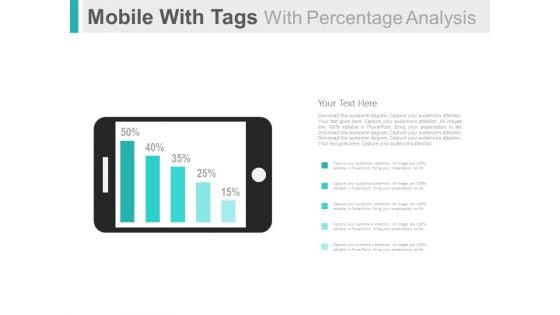
Mobile For Online Survey And Analysis Powerpoint Slides
This PowerPoint template has been designed with graphics of mobile and percentage bar graph. This PPT slide can be used to display online survey and analysis. You can download finance PowerPoint template to prepare awesome presentations.
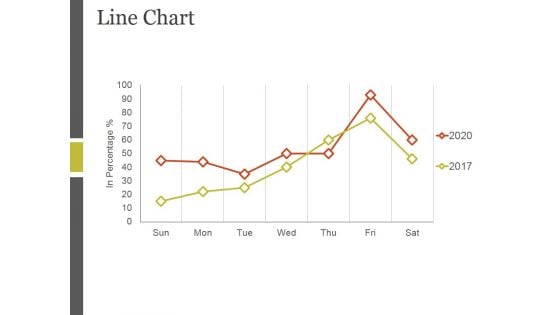
Line Chart Ppt PowerPoint Presentation Ideas Example
This is a line chart ppt powerpoint presentation ideas example. This is a two stage process. The stages in this process are sales in percentage, bar graph, business, marketing, growth.
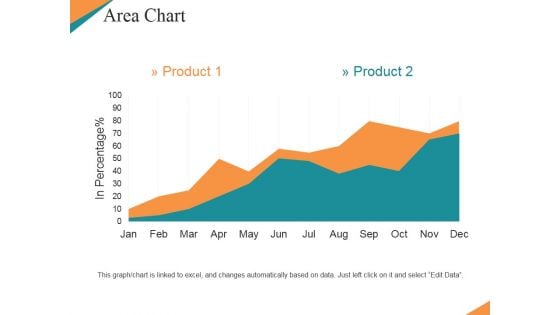
Area Chart Ppt PowerPoint Presentation Summary Templates
This is a area chart ppt powerpoint presentation summary templates. This is a two stage process. The stages in this process are product, in percentage, bar graph, growth, business.
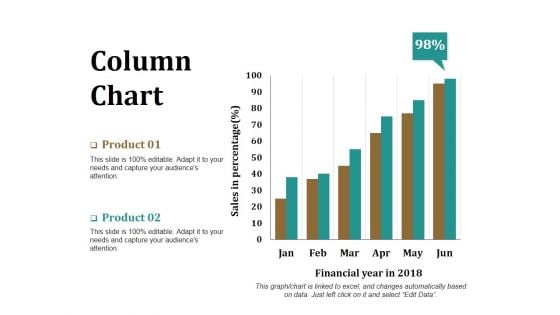
Column Chart Ppt PowerPoint Presentation Model Graphics Download
This is a column chart ppt powerpoint presentation model graphics download. This is a two stage process. The stages in this process are product, financial year, sales in percentage, bar graph, success.
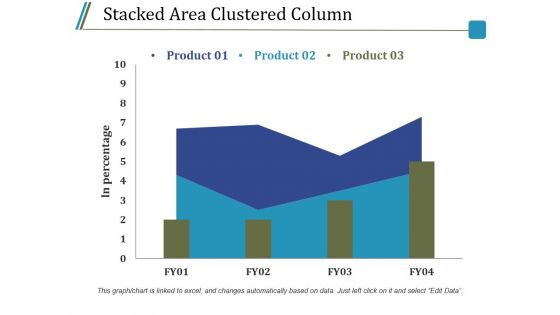
Stacked Area Clustered Column Ppt PowerPoint Presentation Model Guidelines
This is a stacked area clustered column ppt powerpoint presentation model guidelines. This is a three stage process. The stages in this process are product, in percentage, bar graph, growth, success.
Clustered Column Line Ppt PowerPoint Presentation Icon Ideas
This is a clustered column line ppt powerpoint presentation icon ideas. This is a three stage process. The stages in this process are product, in percentage, bar graph, success, growth.
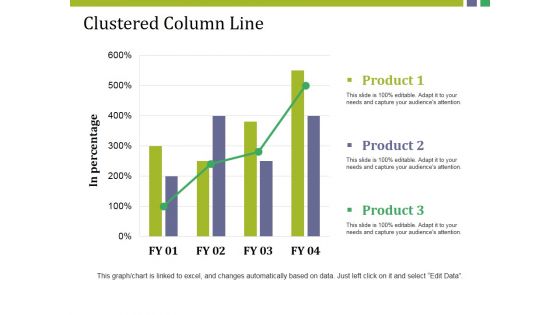
Clustered Column Line Ppt PowerPoint Presentation Pictures Example
This is a clustered column line ppt powerpoint presentation pictures example. This is a three stage process. The stages in this process are product, in percentage, bar graph, growth, success.
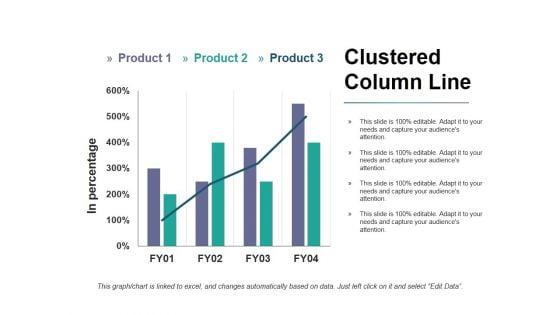
Clustered Column Line Ppt PowerPoint Presentation Infographic Template Pictures
This is a clustered column line ppt powerpoint presentation infographic template pictures. This is a three stage process. The stages in this process are product, in percentage, bar graph, growth, success.
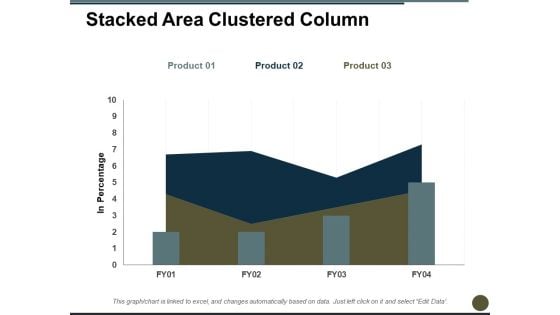
Stacked Area Clustered Column Ppt PowerPoint Presentation Professional Graphics
This is a stacked area clustered column ppt powerpoint presentation professional graphics. This is a three stage process. The stages in this process are in percentage, bar chart, product, growth, year.
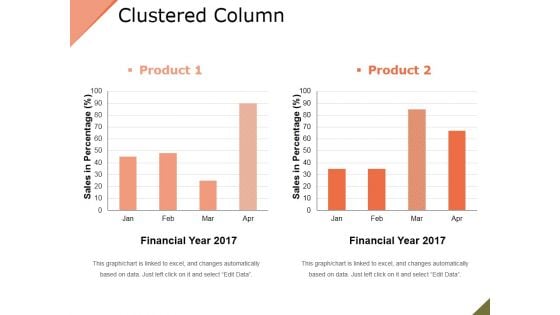
Clustered Column Ppt PowerPoint Presentation File Slide
This is a clustered column ppt powerpoint presentation file slide. This is a two stage process. The stages in this process are product, financial year, sales in percentage, bar graph.
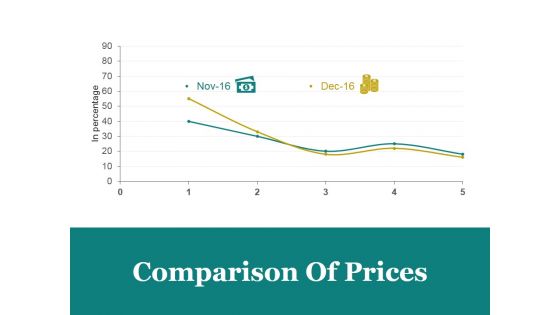
Comparison Of Prices Ppt PowerPoint Presentation Designs Download
This is a comparison of prices ppt powerpoint presentation designs download. This is a two stage process. The stages in this process are comparison of prices, marketing, in percentage, bar graph, business.
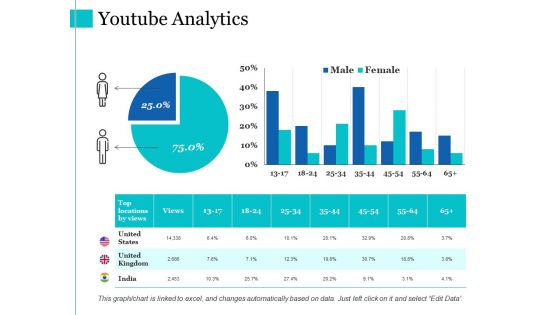
Youtube Analytics Ppt PowerPoint Presentation Layouts Graphic Images
This is a youtube analytics ppt powerpoint presentation layouts graphic images. This is a three stage process. The stages in this process are youtube analytics, finance, percentage, bar graph.
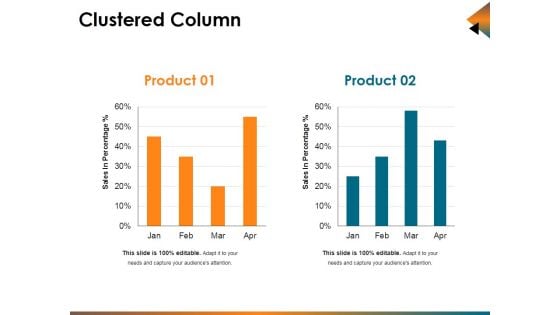
Clustered Column Ppt PowerPoint Presentation Infographic Template Background Designs
This is a clustered column ppt powerpoint presentation infographic template background designs. This is a two stage process. The stages in this process are sales in percentage, bar, business, marketing, planning.
Area Chart Ppt PowerPoint Presentation Icon Gallery
This is a area chart ppt powerpoint presentation icon gallery. This is a two stage process. The stages in this process are sales in percentage, product, bar graph.
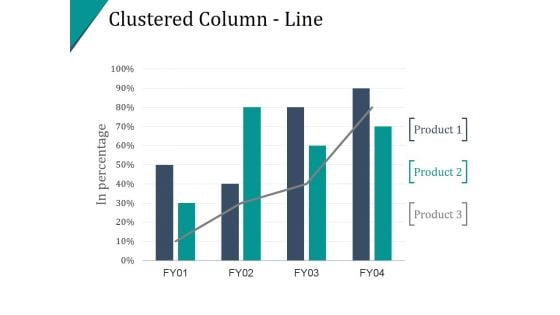
Clustered Column Line Ppt PowerPoint Presentation Samples
This is a clustered column line ppt powerpoint presentation samples. This is a four stage process. The stages in this process are finance, percentage, success, growth, bar graph.
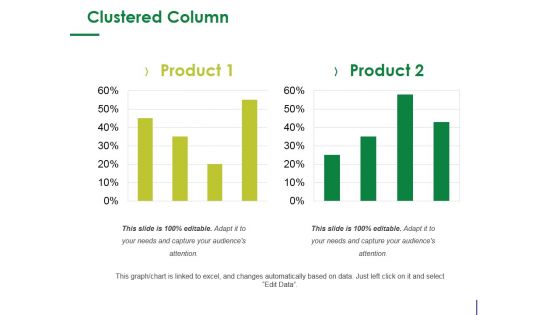
Clustered Column Ppt PowerPoint Presentation Ideas Show
This is a clustered column ppt powerpoint presentation ideas show. This is a two stage process. The stages in this process are product, percentage, finance, business, bar graph.
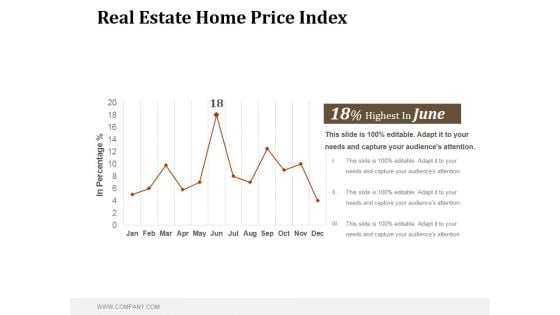
Real Estate Home Price Index Ppt PowerPoint Presentation Samples
This is a real estate home price index ppt powerpoint presentation samples. This is a one stage process. The stages in this process are in percentage, business, bar graph, marketing, success, management.
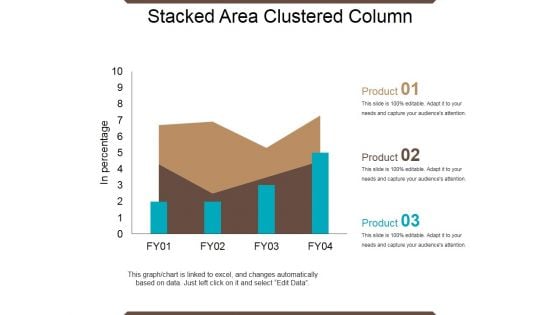
Stacked Area Clustered Column Ppt PowerPoint Presentation Show Guidelines
This is a stacked area clustered column ppt powerpoint presentation show guidelines. This is a four stage process. The stages in this process are in percentage, product, bar graph, growth, success.
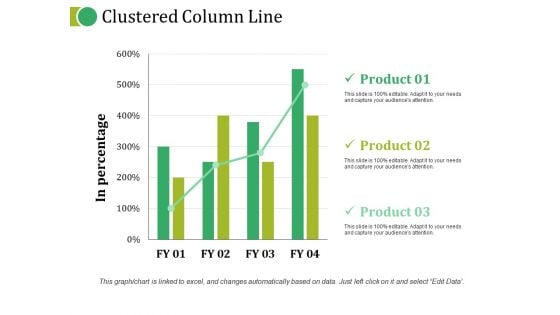
Clustered Column Line Ppt PowerPoint Presentation Topics
This is a clustered column line ppt powerpoint presentation topics. This is a three stage process. The stages in this process are product, in percentage, growth, bar graph, business.
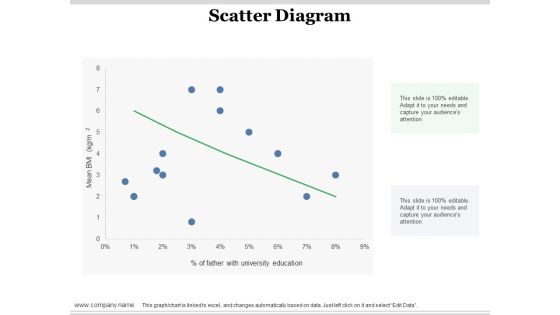
Scatter Diagram Ppt PowerPoint Presentation Infographic Template Design Ideas
This is a scatter diagram ppt powerpoint presentation infographic template design ideas. This is a one stage process. The stages in this process are scatter diagram, finance, in percentage, business, bar graph.
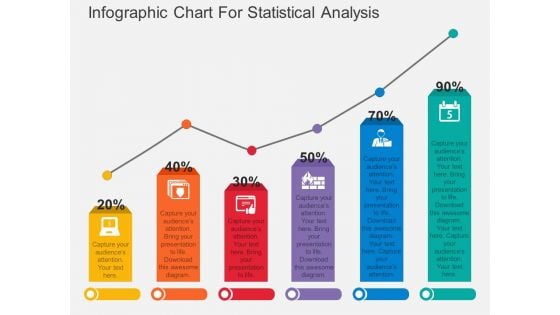
Infographic Chart For Statistical Analysis Powerpoint Template
Download this exclusive business diagram to display statistical analysis. This PowerPoint template contains bar chart with percentage values. This diagram is useful for business presentations.
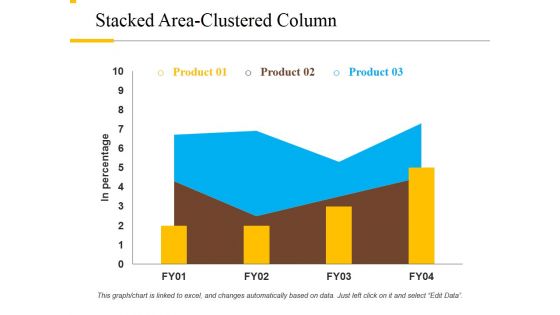
Stacked Area Clustered Column Ppt PowerPoint Presentation File Background Designs
This is a stacked area clustered column ppt powerpoint presentation file background designs. This is a three stage process. The stages in this process are product, in percentage, growth, success, bar graph.
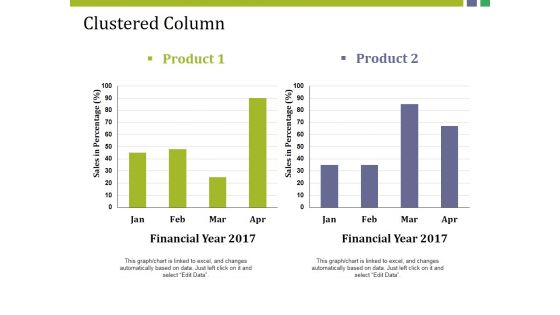
Clustered Column Ppt PowerPoint Presentation Gallery Structure
This is a clustered column ppt powerpoint presentation gallery structure. This is a two stage process. The stages in this process are product, sales in percentage, financial year, bar graph, finance.
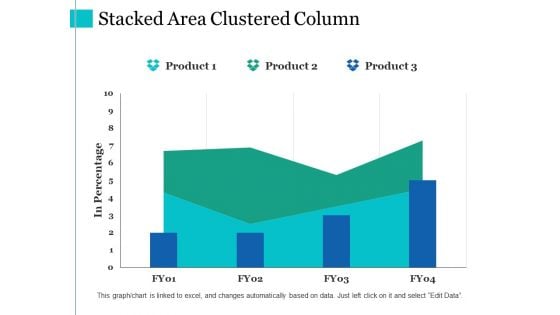
Stacked Area Clustered Column Ppt PowerPoint Presentation Summary Slides
This is a stacked area clustered column ppt powerpoint presentation summary slides. This is a three stage process. The stages in this process are product, in percentage, financial year, bar graph.
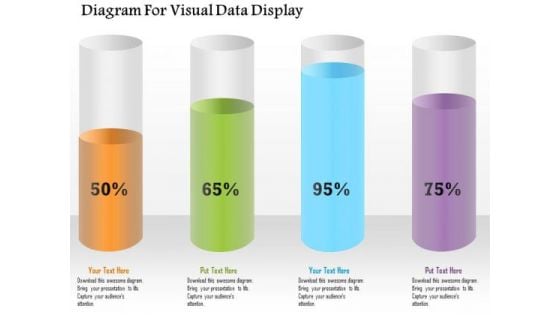
Business Diagram Diagram For Visual Data Display Presentation Template
Four colored cylindrical bars with percentage values are used to design this power point template. This diagram slide helps to display financial data analysis. Use this diagram for your business and finance related presentations.
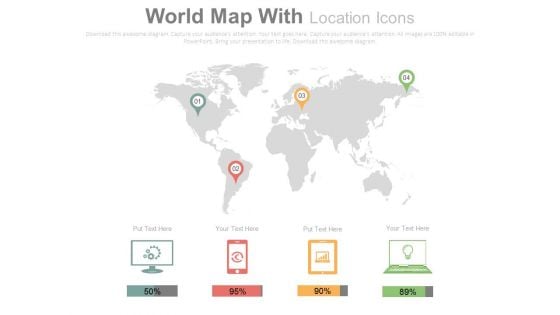
Electronic Devices Global Market Reports PowerPoint Slides
The fight between various gadget manufacturers, internet service providers and operating systems is no longer limited to any specific country. It has gone global and this slide can help present relevant data in a very modern and easy to understand and remember manner. This template has been created by our experienced designers keeping in mind the regular reporting and the data that is to be maintained regarding the number of users and their patterns by various technology companies. The slide has icons of a desktop, a smartphone, a tablet and a laptop accompanied with percentage bars. These can be effectively used to mark the percentage of users on each device, users accessing a website or an app on each device or the sales figures. The location pins can be used to mark the location with maximum number of users or the maximum sales from a location.
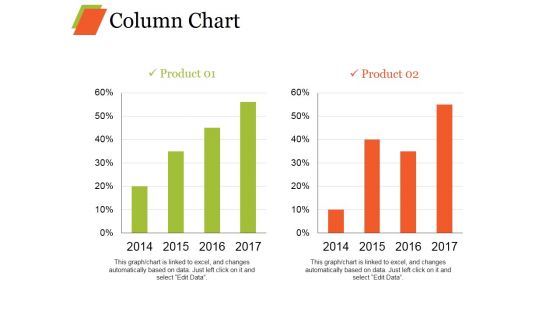
Column Chart Ppt PowerPoint Presentation Infographics Model
This is a column chart ppt powerpoint presentation infographics model. This is a two stage process. The stages in this process are bar graph, growth, product, percentage, year.
Column Chart Ppt PowerPoint Presentation Gallery Slide Portrait
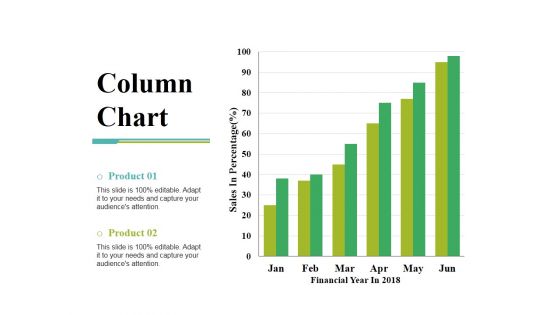
This is a column chart ppt powerpoint presentation gallery slide portrait. This is a two stage process. The stages in this process are sales in percentage, financial year, product, bar graph, growth.
Scatter Chart Ppt PowerPoint Presentation Model Show
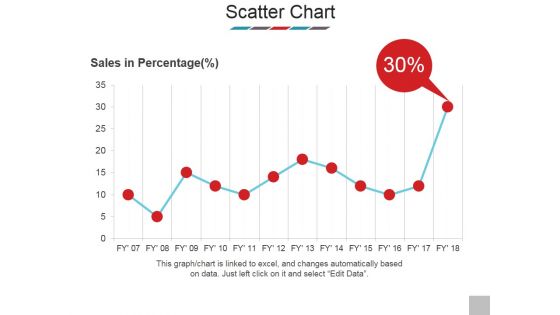
This is a scatter chart ppt powerpoint presentation model show. This is a one stage process. The stages in this process are sales in percentage, scatter chart, business, bar graph, marketing.
Column Chart Ppt PowerPoint Presentation Layouts Vector
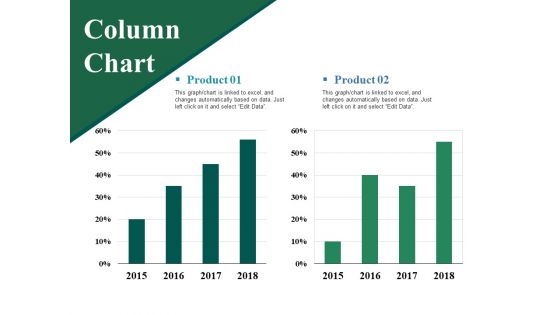
This is a column chart ppt powerpoint presentation layouts vector. This is a two stage process. The stages in this process are product, column chart, bar graph, percentage, finance.
Clustered Column Line Ppt PowerPoint Presentation Model Images
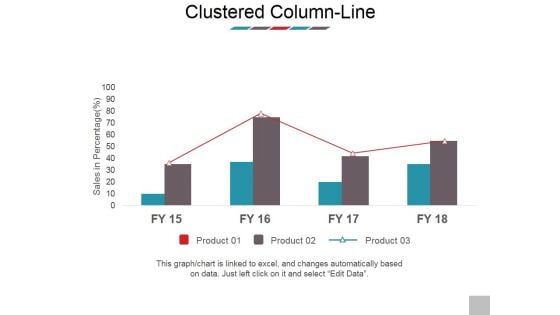
This is a clustered column line ppt powerpoint presentation model images. This is a four stage process. The stages in this process are sales in percentage, product, business, marketing, bar graph.
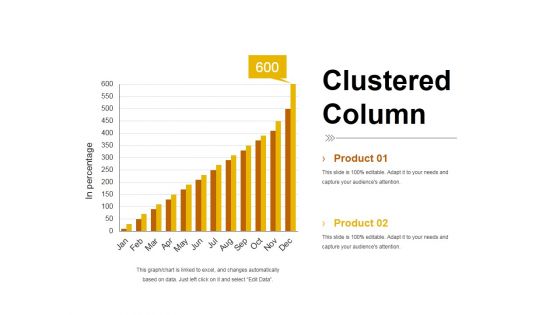
Clustered Column Template 2 Ppt PowerPoint Presentation Summary Smartart
This is a clustered column template 2 ppt powerpoint presentation summary smartart. This is a two stage process. The stages in this process are product, bar graph, in percentage, clustered column, growth.
Adjusted Roce Template 2 Ppt PowerPoint Presentation Icon Pictures
This is a adjusted roce template 2 ppt powerpoint presentation icon pictures. This is a five stage process. The stages in this process are bar graph, finance, percentage, business, marketing.
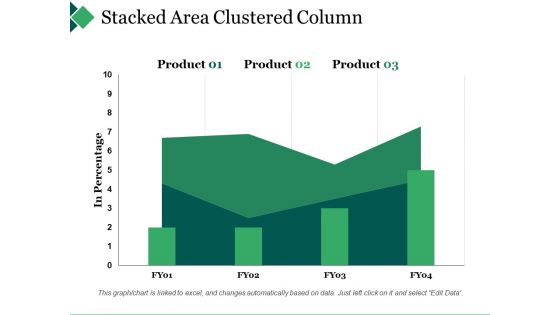
Stacked Area Clustered Column Ppt PowerPoint Presentation Gallery Gridlines
This is a stacked area clustered column ppt powerpoint presentation gallery gridlines. This is a three stage process. The stages in this process are bar graph, product, in percentage.
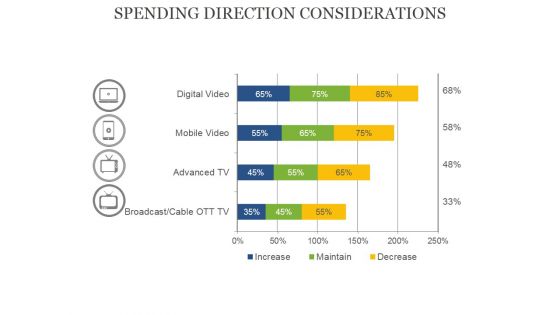
Spending Direction Considerations Ppt PowerPoint Presentation Portfolio Graphics Template
This is a spending direction considerations ppt powerpoint presentation portfolio graphics template. This is a four stage process. The stages in this process are bar graph, business, presentation, percentage, finance.
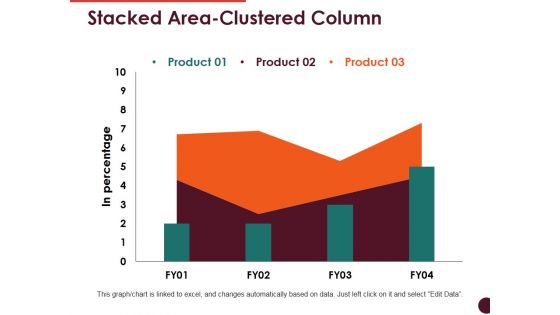
Stacked Area Clustered Column Ppt PowerPoint Presentation Summary Professional
This is a stacked area clustered column ppt powerpoint presentation summary professional. This is a three stage process. The stages in this process are product, bar graph, growth, success, in percentage.
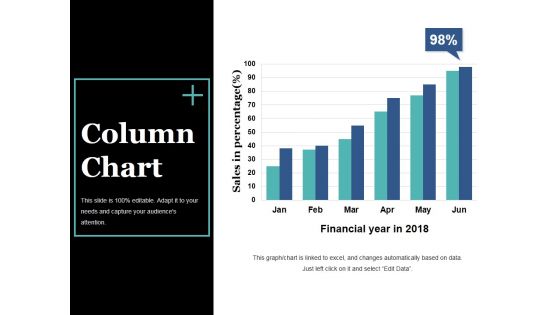
Column Chart Ppt PowerPoint Presentation Slides Visual Aids
This is a column chart ppt powerpoint presentation slides visual aids. This is a six stage process. The stages in this process are bar graph, growth, success, sales in percentage, financial year.
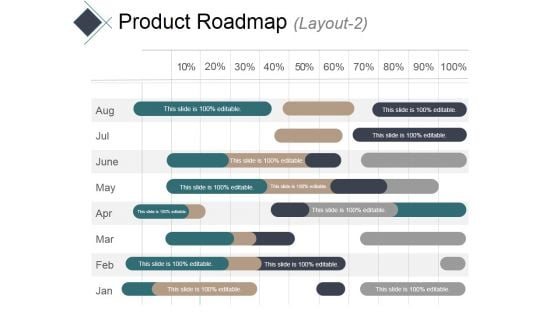
Product Roadmap Layout 2 Ppt PowerPoint Presentation Portfolio File Formats
This is a product roadmap layout 2 ppt powerpoint presentation portfolio file formats. This is a eight stage process. The stages in this process are bar, finance, analysis, planning, percentage.

Clustered Column Line Ppt PowerPoint Presentation Slide
This is a clustered column line ppt powerpoint presentation slide. This is a three stage process. The stages in this process are bar graph, growth, finance, product, sales in percentage.

Employees Weekly Task Output Status Summary Report Information PDF
This slide covers task completion output report sheet for a week. It includes task, assigned person, priority status and the task progress bar with percentage. Pitch your topic with ease and precision using this Employees Weekly Task Output Status Summary Report Information PDF. This layout presents information on Opening Meeting, Brainstorming Session, Media Engagement. It is also available for immediate download and adjustment. So, changes can be made in the color, design, graphics or any other component to create a unique layout.
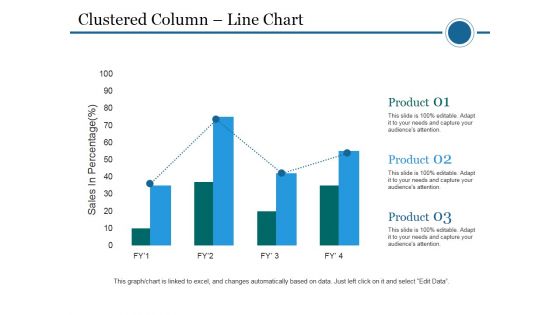
Clustered Column Line Chart Ppt PowerPoint Presentation File Pictures
This is a clustered column line chart ppt powerpoint presentation file pictures. This is a four stage process. The stages in this process are clustered bar, product, planning, business, sales in percentage.

Business Graph Up PowerPoint Templates And PowerPoint Themes 1012
Business Graph Up PowerPoint Templates And PowerPoint Themes 1012-This PowerPoint Template shows the Bar Graph with increasing percentage which signifies the Financial Growth. The Template signifies the concept of Team Work, Team Leader etc. The structure of our templates allows you to effectively highlight the key issues concerning the growth of your business.-Business Graph Up PowerPoint Templates And PowerPoint Themes 1012-This PowerPoint template can be used for presentations relating to-Business graph, success, arrows, business, signs, shapes Disentangle the web with our Business Graph Up PowerPoint Templates And PowerPoint Themes 1012. Seperate the various strands of thought.
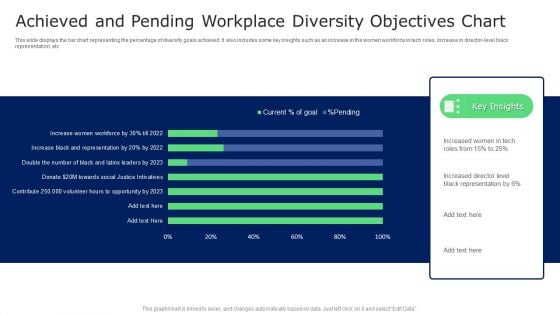
Achieved And Pending Workplace Diversity Objectives Chart Guidelines PDF
This slide displays the bar chart representing the percentage of diversity goals achieved. It also includes some key insights such as an increase in the women workforce in tech roles, increase in director level black representation, etc. Showcasing this set of slides titled Achieved And Pending Workplace Diversity Objectives Chart Guidelines PDF. The topics addressed in these templates are Achieved And Pending Workplace, Diversity Objectives Chart. All the content presented in this PPT design is completely editable. Download it and make adjustments in color, background, font etc. as per your unique business setting.
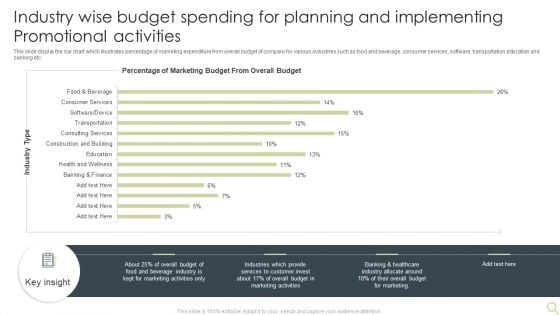
Industry Wise Budget Spending For Planning And Implementing Promotional Activities Introduction PDF
This slide display the bar chart which illustrates percentage of marketing expenditure from overall budget of company for various industries such as food and beverage, consumer services, software, transportation,education and banking etc. Showcasing this set of slides titled Industry Wise Budget Spending For Planning And Implementing Promotional Activities Introduction PDF. The topics addressed in these templates are Marketing, Beverage Industry, Budget. All the content presented in this PPT design is completely editable. Download it and make adjustments in color, background, font etc. as per your unique business setting.
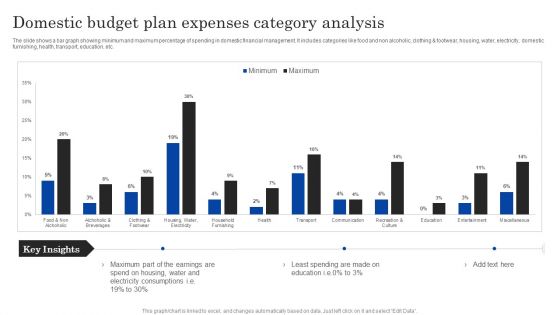
Domestic Budget Plan Expenses Category Analysis Ppt PowerPoint Presentation Layouts Inspiration PDF
The slide shows a bar graph showing minimum and maximum percentage of spending in domestic financial management. It includes categories like food and non alcoholic, clothing and footwear, housing, water, electricity, domestic furnishing, health, transport, education, etc.Showcasing this set of slides titled Domestic Budget Plan Expenses Category Analysis Ppt PowerPoint Presentation Layouts Inspiration PDF. The topics addressed in these templates are Part Earnings, Electricity Consumptions, Least Spending. All the content presented in this PPT design is completely editable. Download it and make adjustments in color, background, font etc. as per your unique business setting.

Success Graph Finance PowerPoint Templates And PowerPoint Themes 1012
Success Graph Finance PowerPoint Templates And PowerPoint Themes 1012-The Above PowerPoint Template shows the Bar graph of Several Components showing the Percentage of each component. It signifies the Concept of Growth, Finance, Investment etc. Prove how they mesh to motivate the company team and provide the steam to activate the composite machine. You have noted down some very fruitful ideas that have occurred to you at random moments. Organize them all and prioritize them effectively.-Success Graph Finance PowerPoint Templates And PowerPoint Themes 1012-This PowerPoint template can be used for presentations relating to-Business growth, Business, Finance, Marketing, Success, Symbol Bounce back with our Success Graph Finance PowerPoint Templates And PowerPoint Themes 1012. You will come out on top.
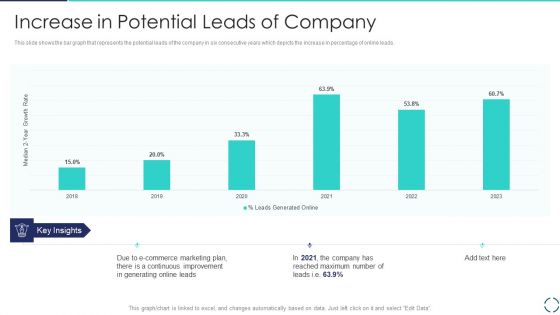
Optimizing E Business Promotion Plan Increase In Potential Leads Of Company Background PDF
This slide shows the bar graph that represents the potential leads of the company in six consecutive years which depicts the increase in percentage of online leads. Deliver an awe inspiring pitch with this creative Optimizing E Business Promotion Plan Increase In Potential Leads Of Company Background PDF bundle. Topics like Company, Increase Potential can be discussed with this completely editable template. It is available for immediate download depending on the needs and requirements of the user.
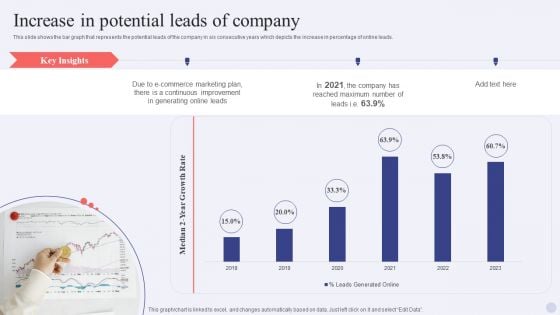
Electronic Commerce Systems Increase In Potential Leads Of Company Graphics PDF
This slide shows the bar graph that represents the potential leads of the company in six consecutive years which depicts the increase in percentage of online leads. Deliver an awe inspiring pitch with this creative Electronic Commerce Systems Increase In Potential Leads Of Company Graphics PDF bundle. Topics like E Commerce Marketing Plan, Generating Online Leads, Continuous Improvement can be discussed with this completely editable template. It is available for immediate download depending on the needs and requirements of the user.
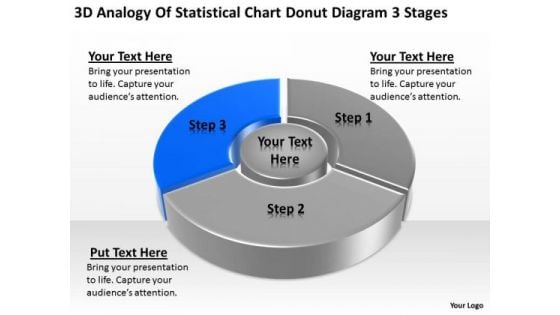
Statistical Chart Donut Diagram 3 Stages Ppt Samples Business Plan PowerPoint Slides
We present our statistical chart donut diagram 3 stages ppt samples business plan PowerPoint Slides.Download our Finance PowerPoint Templates because you should Experience excellence with our PowerPoint Templates and Slides. They will take your breath away. Present our Marketing PowerPoint Templates because our bewitching PowerPoint Templates and Slides will delight your audience with the magic of your words. Use our Sales PowerPoint Templates because You have gained great respect for your brilliant ideas. Use our PowerPoint Templates and Slides to strengthen and enhance your reputation. Download our Business PowerPoint Templates because You have a driving passion to excel in your field. Our PowerPoint Templates and Slides will prove ideal vehicles for your ideas. Download our Success PowerPoint Templates because You should Kick up a storm with our PowerPoint Templates and Slides. The heads of your listeners will swirl with your ideas.Use these PowerPoint slides for presentations relating to Chart, Business, Data, Donut, Market, Sales, Document, Economy, Display, Bar, Corporate, Income, Concept, Success, Presentation, Symbol, Diagram, Percentage, Graphic, Finance, Stock, Clean, Analysis, Report, Marketing, Accounting, Management, Graph, Colors, Forecast, Design, Growth, Competition, Progress, Profit, Information, Background, Trade, Investment, Statistic, Financial. The prominent colors used in the PowerPoint template are Blue, Gray, Black. Make the event with our Statistical Chart Donut Diagram 3 Stages Ppt Samples Business Plan PowerPoint Slides. Your thoughts will be really happening.
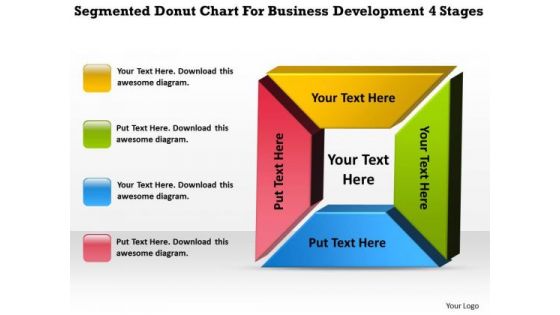
Donut Chart For Business Development 4 Stages Plan Excel PowerPoint Templates
We present our donut chart for business development 4 stages plan excel PowerPoint templates.Download our Finance PowerPoint Templates because Our PowerPoint Templates and Slides are created by a hardworking bunch of busybees. Always flitting around with solutions gauranteed to please. Present our Marketing PowerPoint Templates because Our PowerPoint Templates and Slides team portray an attitude of elegance. Personify this quality by using them regularly. Download and present our Shapes PowerPoint Templates because Our PowerPoint Templates and Slides are innately eco-friendly. Their high recall value negate the need for paper handouts. Download our Business PowerPoint Templates because It will mark the footprints of your journey. Illustrate how they will lead you to your desired destination. Download and present our Process and Flows PowerPoint Templates because Our PowerPoint Templates and Slides will provide you a launch platform. Give a lift off to your ideas and send them into orbit.Use these PowerPoint slides for presentations relating to chart, business, data, donut, market, sales, document, economy, display, bar, corporate, income, concept, success, presentation, symbol, diagram, percentage, graphic, finance, stock, clean, analysis, report, marketing, accounting, management, graph, forecast, design, growth, competition, progress, profit, information, background, trade, investment, statistic, financial, infographics, 3d. The prominent colors used in the PowerPoint template are Yellow, Green, Blue. Extend the effect with our Donut Chart For Business Development 4 Stages Plan Excel PowerPoint Templates. Get greater control of your domain.
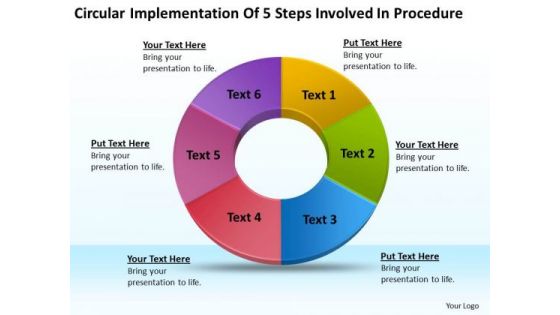
Implementation Of 5 Steps Involved Procedure Business Plan Online PowerPoint Templates
We present our implementation of 5 steps involved procedure business plan online PowerPoint templates.Use our Ring Charts PowerPoint Templates because It will Give impetus to the hopes of your colleagues. Our PowerPoint Templates and Slides will aid you in winning their trust. Download our Process and Flows PowerPoint Templates because Our PowerPoint Templates and Slides are the chords of your song. String them along and provide the lilt to your views. Download our Flow Charts PowerPoint Templates because Our PowerPoint Templates and Slides has conjured up a web of all you need with the help of our great team. Use them to string together your glistening ideas. Download our Business PowerPoint Templates because Our PowerPoint Templates and Slides help you meet the demand of the Market. Just browse and pick the slides that appeal to your intuitive senses. Use our Success PowerPoint Templates because You have a driving passion to excel in your field. Our PowerPoint Templates and Slides will prove ideal vehicles for your ideas.Use these PowerPoint slides for presentations relating to Pie, isolated, bar, business, concept, sign, render, spectrum, bright, diagram, circle, percentage, light, graphic, element, digital, report,marketing, abstract, graph, wheel, modern, creative, illustration, icon, chart, colour, up, web, design, color, colorful, painting, set, art, progress, effect, style,part, background, five, rainbow, pattern, financial. The prominent colors used in the PowerPoint template are Red, Yellow, Blue. Advance your career with our Implementation Of 5 Steps Involved Procedure Business Plan Online PowerPoint Templates. Download without worries with our money back guaranteee.
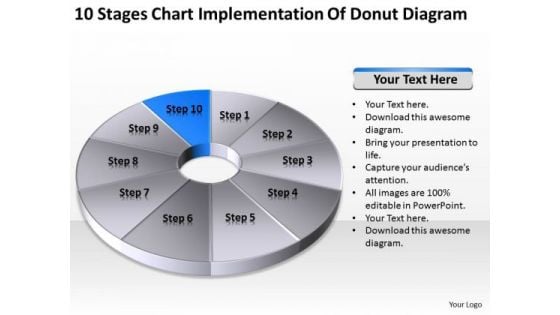
Chart Implementation Of Donut Diagram Ppt Business Plan Outline Template Free PowerPoint Templates
We present our chart implementation of donut diagram ppt business plan outline template free PowerPoint templates.Download our Ring Charts PowerPoint Templates because They will Put the wind in your sails. Skim smoothly over the choppy waters of the market. Present our Process and Flows PowerPoint Templates because They will Put the wind in your sails. Skim smoothly over the choppy waters of the market. Present our Flow Charts PowerPoint Templates because Our PowerPoint Templates and Slides will Embellish your thoughts. They will help you illustrate the brilliance of your ideas. Use our Marketing PowerPoint Templates because Our PowerPoint Templates and Slides come in all colours, shades and hues. They help highlight every nuance of your views. Download and present our Business PowerPoint Templates because It will Strengthen your hand with your thoughts. They have all the aces you need to win the day.Use these PowerPoint slides for presentations relating to Pie, chart, isolated, white, bar, business, concept, sign, render, spectrum, bright, diagram, circle, percentage, light, graphic,element, digital, report, marketing, abstract, graph, modern, creative, illustration, icon, up, web, design, painting, set, art, progress, effect, style, steps,ten,pattern, financial. The prominent colors used in the PowerPoint template are Gray, Blue, White. Access our Chart Implementation Of Donut Diagram Ppt Business Plan Outline Template Free PowerPoint Templates anytime,anywhere. They are available around the clock.
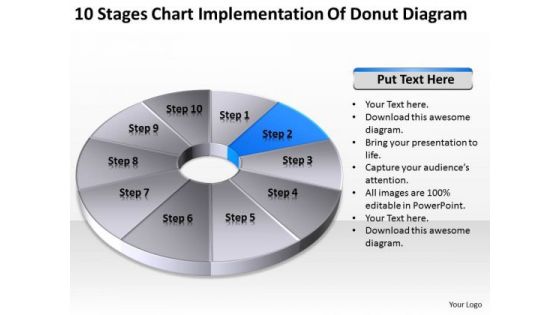
Chart Implementation Of Donut Diagram Ppt How To Wright Business Plan PowerPoint Templates
We present our chart implementation of donut diagram ppt how to wright business plan PowerPoint templates.Download and present our Ring Charts PowerPoint Templates because Our PowerPoint Templates and Slides help you pinpoint your timelines. Highlight the reasons for your deadlines with their use. Download and present our Process and Flows PowerPoint Templates because Your audience will believe you are the cats whiskers. Present our Flow Charts PowerPoint Templates because Our PowerPoint Templates and Slides are effectively colour coded to prioritise your plans They automatically highlight the sequence of events you desire. Use our Marketing PowerPoint Templates because Your ideas provide food for thought. Our PowerPoint Templates and Slides will help you create a dish to tickle the most discerning palate. Present our Business PowerPoint Templates because Our PowerPoint Templates and Slides will provide you a launch platform. Give a lift off to your ideas and send them into orbit.Use these PowerPoint slides for presentations relating to Pie, chart, isolated, white, bar, business, concept, sign, render, spectrum, bright, diagram, circle, percentage, light, graphic,element, digital, report, marketing, abstract, graph, modern, creative, illustration, icon, up, web, design, painting, set, art, progress, effect, style, steps,ten,pattern, financial. The prominent colors used in the PowerPoint template are Blue, Black, Gray. Accept accolades with our Chart Implementation Of Donut Diagram Ppt How To Wright Business Plan PowerPoint Templates. You will come out on top.


 Continue with Email

 Home
Home


