Percentage Charts

Bar Chart For Facts Stats Growth And Percentage Analysis Ppt PowerPoint Presentation Styles Infographic Template
Presenting this set of slides with name bar chart for facts stats growth and percentage analysis ppt powerpoint presentation styles infographic template. This is a six stage process. The stages in this process are education, growth, pencil bar graph. This is a completely editable PowerPoint presentation and is available for immediate download. Download now and impress your audience.
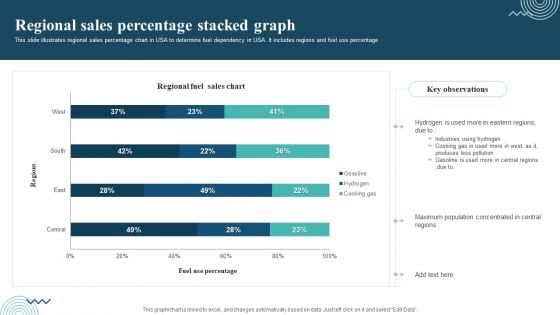
Regional Sales Percentage Stacked Graph Themes PDF
This slide illustrates regional sales percentage chart in USA to determine fuel dependency in USA. It includes regions and fuel use percentage. Pitch your topic with ease and precision using this Regional Sales Percentage Stacked Graph Themes PDF. This layout presents information on Regional Sales, Industries Using Hydrogen, Cooking Gas. It is also available for immediate download and adjustment. So, changes can be made in the color, design, graphics or any other component to create a unique layout.
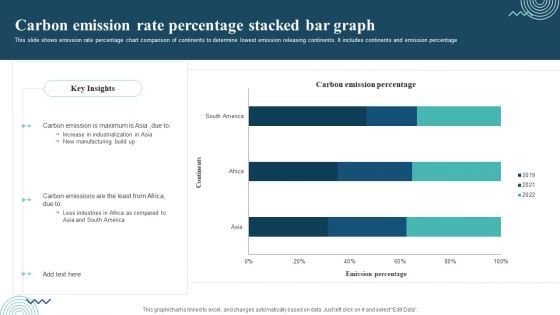
Carbon Emission Rate Percentage Stacked Bar Graph Rules PDF
This slide shows emission rate percentage chart comparison of continents to determine lowest emission releasing continents. It includes continents and emission percentage Showcasing this set of slides titled Carbon Emission Rate Percentage Stacked Bar Graph Rules PDF. The topics addressed in these templates are Carbon Emission, Increase In Industrialization, New Manufacturing. All the content presented in this PPT design is completely editable. Download it and make adjustments in color, background, font etc. as per your unique business setting.
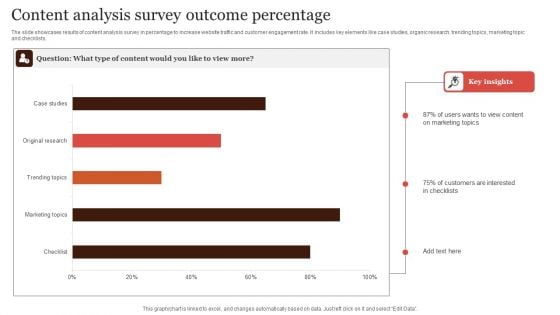
Content Analysis Survey Outcome Percentage Formats PDF
The slide showcases results of content analysis survey in percentage to increase website traffic and customer engagement rate. It includes key elements like case studies, organic research, trending topics, marketing topic and checklists. Showcasing this set of slides titled Content Analysis Survey Outcome Percentage Formats PDF. The topics addressed in these templates are Content Analysis, Survey Outcome Percentage. All the content presented in this PPT design is completely editable. Download it and make adjustments in color, background, font etc. as per your unique business setting.
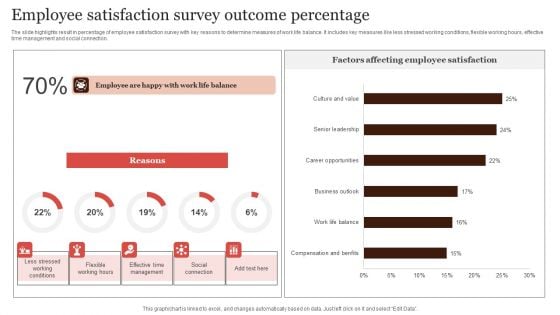
Employee Satisfaction Survey Outcome Percentage Graphics PDF
The slide highlights result in percentage of employee satisfaction survey with key reasons to determine measures of work life balance. It includes key measures like less stressed working conditions, flexible working hours, effective time management and social connection. Showcasing this set of slides titled Employee Satisfaction Survey Outcome Percentage Graphics PDF. The topics addressed in these templates are Factors Affecting, Employee Satisfaction, Survey Outcome Percentage. All the content presented in this PPT design is completely editable. Download it and make adjustments in color, background, font etc. as per your unique business setting.
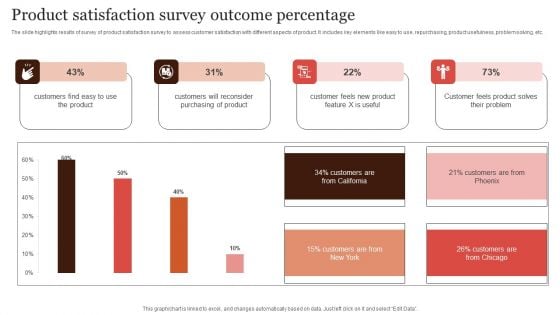
Product Satisfaction Survey Outcome Percentage Elements PDF
The slide highlights results of survey of product satisfaction survey to assess customer satisfaction with different aspects of product. It includes key elements like easy to use, repurchasing, product usefulness, problem solving, etc. Showcasing this set of slides titled Product Satisfaction Survey Outcome Percentage Elements PDF. The topics addressed in these templates are Customers Will Reconsider, Purchasing Of Product, Survey Outcome Percentage. All the content presented in this PPT design is completely editable. Download it and make adjustments in color, background, font etc. as per your unique business setting.
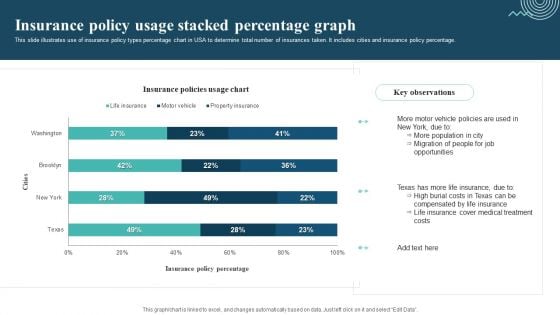
Insurance Policy Usage Stacked Percentage Graph Template PDF
This slide illustrates use of insurance policy types percentage chart in USA to determine total number of insurances taken. It includes cities and insurance policy percentage. Pitch your topic with ease and precision using this Insurance Policy Usage Stacked Percentage Graph Template PDF. This layout presents information on Motor Vehicle Policies, More Population, Migration Of People. It is also available for immediate download and adjustment. So, changes can be made in the color, design, graphics or any other component to create a unique layout.
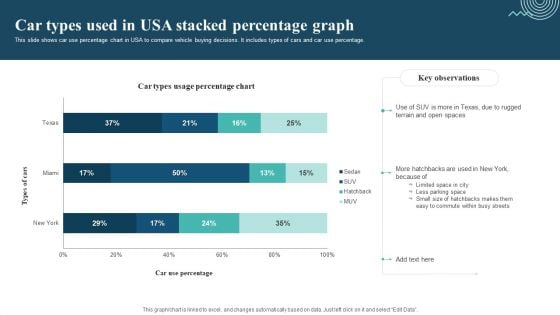
Car Types Used In Usa Stacked Percentage Graph Sample PDF
This slide shows car use percentage chart in USA to compare vehicle buying decisions. It includes types of cars and car use percentage. Pitch your topic with ease and precision using this Car Types Used In Usa Stacked Percentage Graph Sample PDF. This layout presents information on Limited Space In City, Less Parking Space, Easy To Commute. It is also available for immediate download and adjustment. So, changes can be made in the color, design, graphics or any other component to create a unique layout.
Financial Percentage Ppt PowerPoint Presentation Icon Templates
This is a financial percentage ppt powerpoint presentation icon templates. This is a three stage process. The stages in this process are business, marketing, management, financial.
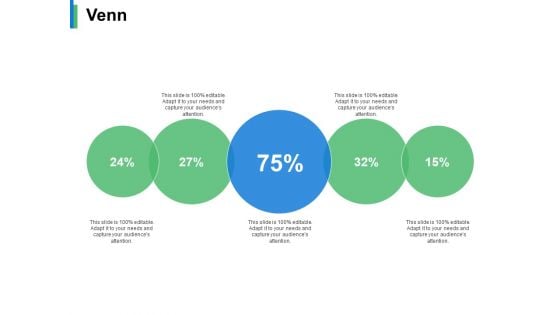
Venn Percentage Ppt PowerPoint Presentation Slides Vector
This is a venn percentage ppt powerpoint presentation slides vector. This is a five stage process. The stages in this process are business, management, strategy, analysis, percentage.
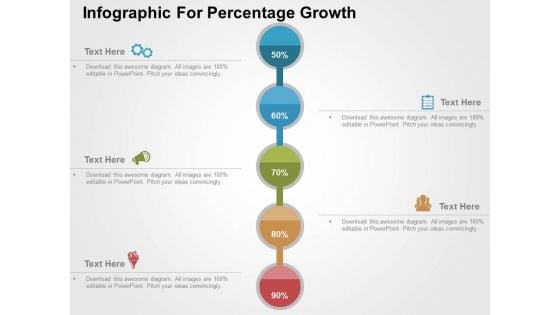
Infographic For Percentage Growth Powerpoint Templates
Create dynamic presentations with our professional template of infographic. This diagram helps to present percentage profit growth. Download this template to leave permanent impression on your audience.
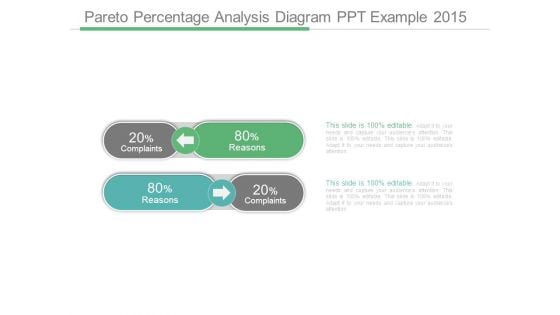
Pareto Percentage Analysis Diagram Ppt Example 2015
This is a pareto percentage analysis diagram ppt example 2015. This is a two stage process. The stages in this process are complaints, reasons.
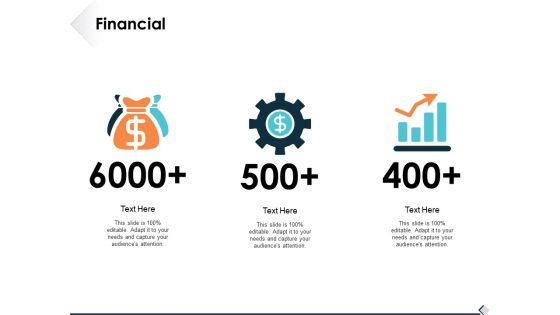
Financial Percentage Ppt PowerPoint Presentation File Gallery
This is a financial percentage ppt powerpoint presentation file gallery. This is a two stage process. The stages in this process are icons, finance, strategy, analysis, marketing.
Survey Outcome Percentage Report Icon Diagrams PDF
Presenting Survey Outcome Percentage Report Icon Diagrams PDF to dispense important information. This template comprises three stages. It also presents valuable insights into the topics including Survey Outcome, Percentage Report Icon. This is a completely customizable PowerPoint theme that can be put to use immediately. So, download it and address the topic impactfully.
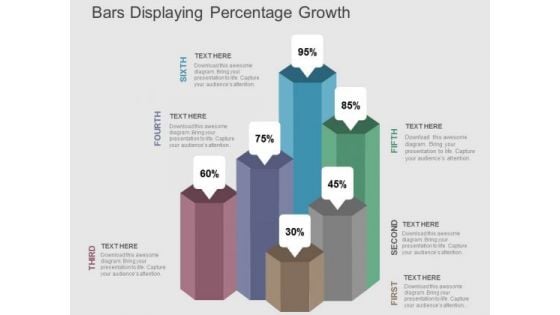
Bars Displaying Percentage Growth PowerPoint Templates
Our above PPT slide contains bar graph displaying percentage growth. This diagram of bar graph helps to depict statistical information. Use this diagram to impart more clarity to data and to create more sound impact on viewers.
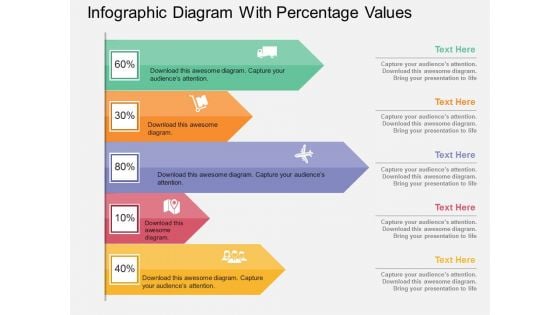
Infographic Diagram With Percentage Values Powerpoint Template
Visually support your presentation with our above template containing infographic diagram with percentage values. This diagram is excellent visual tools for explaining huge amounts of information where complex data needs to be explained immediately and clearly.
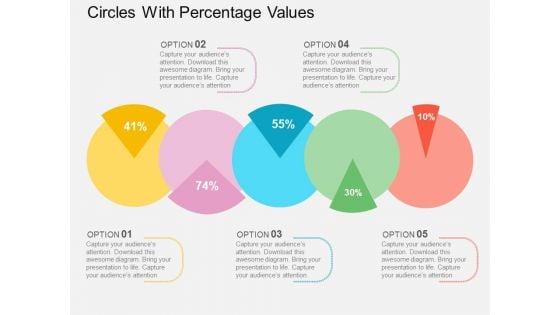
Circles With Percentage Values Powerpoint Templates
This PowerPoint template displays circles with percentage values. This business diagram is suitable for financial data analysis. Use this business diagram slide to highlight the key issues of your presentation.
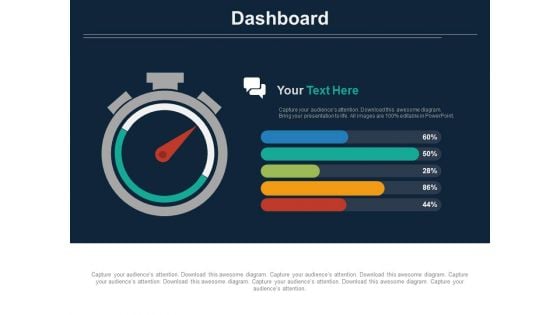
Stopwatch With Percentage Value Analysis Powerpoint Slides
The above template displays a diagram of stopwatch with percentage value. This diagram has been professionally designed to emphasize on time management. Grab center stage with this slide and capture the attention of your audience.
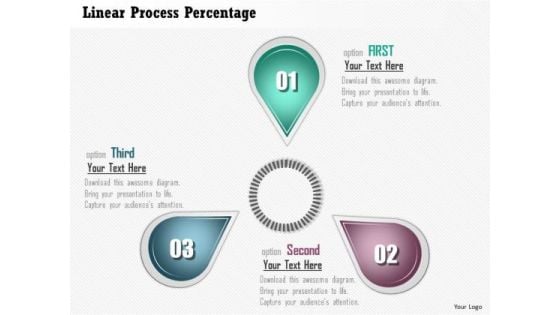
Business Diagram Linear Process Percentage Presentation Template
This slide contains linear process percentage diagram presentation template. This business diagram has been designed with graphic of three staged linear process diagram. This diagram has been crafted to display the concept of financial planning. Use this diagram for your finance and business related presentations.
Comparison Percentage Ppt PowerPoint Presentation Model Icon
Presenting this set of slides with name comparison percentage ppt powerpoint presentation model icon. This is a two stage process. The stages in this process are comparison, male, female, marketing, strategy. This is a completely editable PowerPoint presentation and is available for immediate download. Download now and impress your audience.
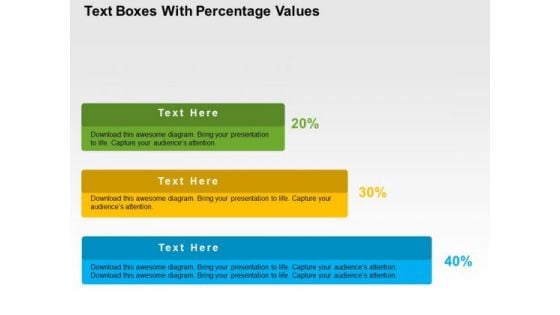
Text Boxes With Percentage Values PowerPoint Template
Growth analysis for business can be defined with this business diagram. This slide depicts text boxes in increasing flow. Present your views using this innovative slide and be assured of leaving a lasting impression
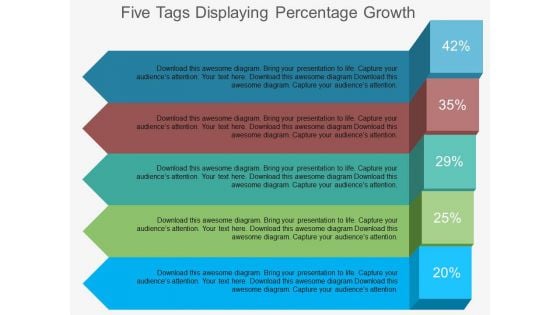
Five Tags Displaying Percentage Growth Powerpoint Template
This diagram contains colored tags infographic set. Download this diagram slide to display business planning and growth. This diagram is editable you can edit text, color, shade and style as per you need.
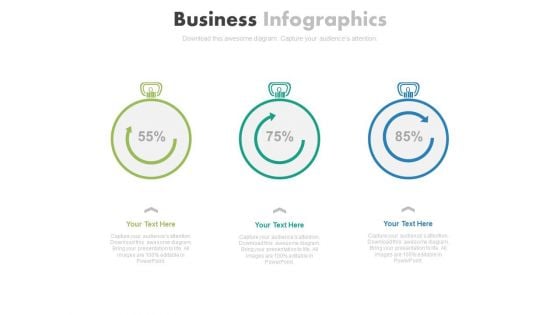
Three Stopwatches For Percentage Growth Powerpoint Slides
Three stopwatches have been displayed in this business slide. This business diagram helps to exhibit parameters of growth and development. Download this PowerPoint template to build an exclusive presentation.
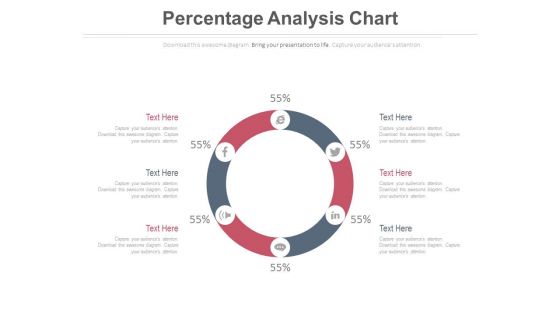
Circular Diagram For Percentage Analysis Powerpoint Slides
This PowerPoint slide has been designed with circular diagram with social media icons. This diagram slide may be used to display users of social media. Prove the viability of your ideas with this professional slide.
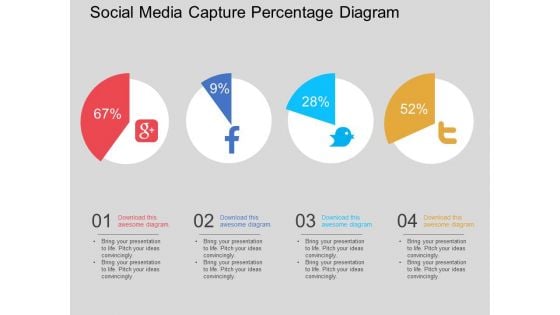
Social Media Capture Percentage Diagram Powerpoint Template
This PowerPoint template displays graphics of four circles with social media icons. This business diagram has been designed to exhibit ratios of social media users. Download this diagram slide to make impressive presentations.
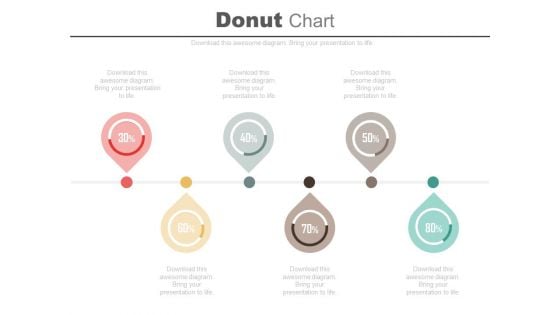
Six Pointers Percentage Timeline Diagram Powerpoint Slides
Profitability indicator ratios have been displayed this business slide. This PowerPoint template contains linear pointers timeline diagram. Use this professional diagram slide to build an exclusive presentation.
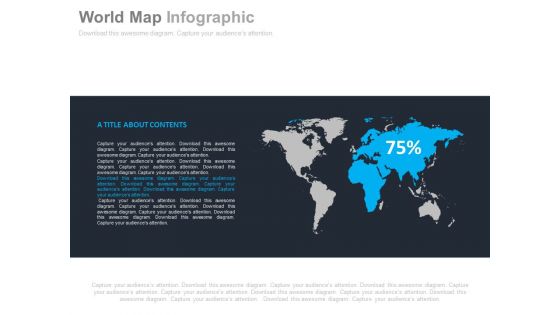
World Map With Percentage Value Powerpoint Slides
This professionally designed PowerPoint template displays diagram of world map. You can download this diagram to exhibit global business analysis. Above PPT slide is suitable for business presentation.
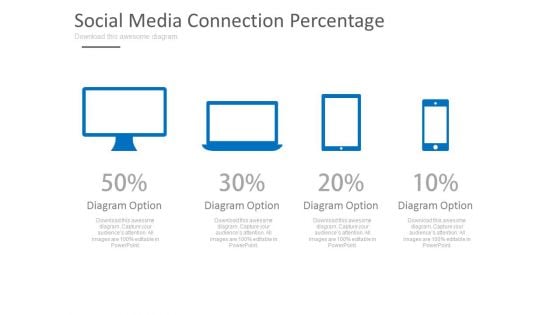
Computer Devices With Percentage Values Powerpoint Slides
This PPT slide displays graphics of computer, laptop, tablet and mobile. Use this PPT design to display comparison of computer devices. This PowerPoint template can be customized as per requirements of business education or any other theme.
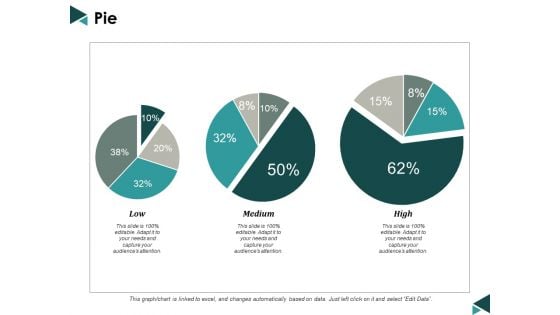
Pie Percentage Marketing Ppt Powerpoint Presentation Inspiration Show
This is a pie percentage marketing ppt powerpoint presentation inspiration show. This is a three stage process. The stages in this process are pie chart, percentage, marketing, business, analysis.
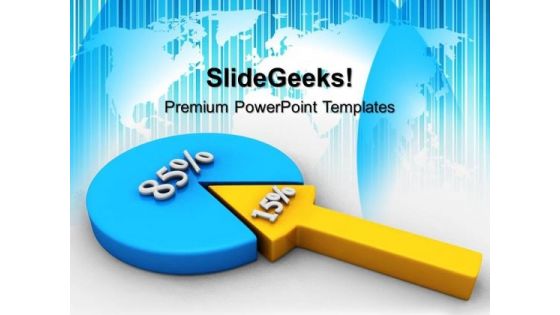
Percentage Pie Graph Marketing PowerPoint Templates And PowerPoint Themes 0412
Microsoft Powerpoint Templates and Background with percent proportion pie chart Enthuse your audience with your ideas. Our Percentage Pie Graph Marketing PowerPoint Templates And PowerPoint Themes 0412 will generate keenness.
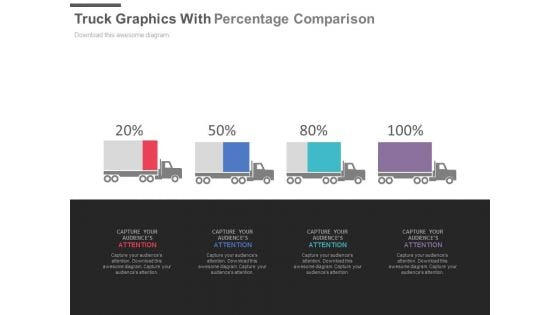
Four Trucks With Percentage Values For Comparison Powerpoint Slides
This PPT slide displays graphics of four trucks with percentage values. Use this PPT design to display logistics compare chart. This PowerPoint template can be customized as per requirements of business presentation.
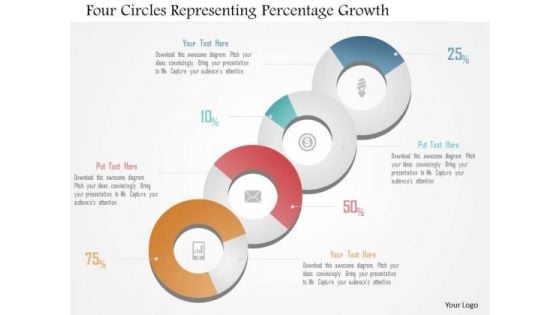
Business Diagram Four Circles Representing Percentage Growth Presentation Template
Our above slide displays four circles representing percentage growth. It helps to depict workflow or a process. This diagram offers a way for your audience to visually conceptualize the process.
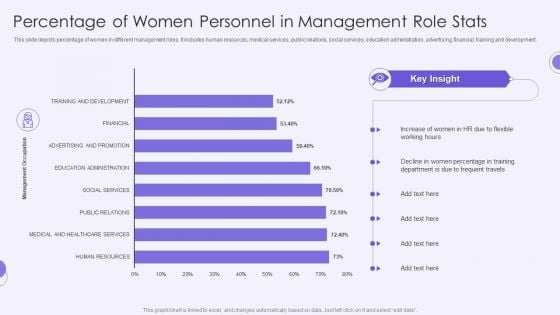
Percentage Of Women Personnel In Management Role Stats Clipart PDF
This slide depicts percentage of women in different management roles. It includes human resources, medical services, public relations, social services, education administration, advertising, financial, training and development.Showcasing this set of slides titled Percentage Of Women Personnel In Management Role Stats Clipart PDF. The topics addressed in these templates are Increase Women, Percentage In Training, Frequent Travels. All the content presented in this PPT design is completely editable. Download it and make adjustments in color, background, font etc. as per your unique business setting.
Product Percentage Change Graph Ppt PowerPoint Presentation Styles Icons PDF
Presenting this set of slides with name product percentage change graph ppt powerpoint presentation styles icons pdf. The topics discussed in these slide is product percentage change graph. This is a completely editable PowerPoint presentation and is available for immediate download. Download now and impress your audience.
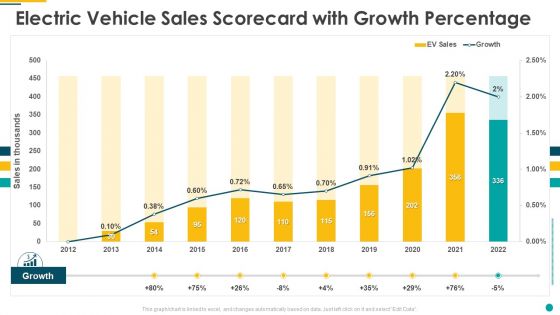
Electric Vehicle Sales Scorecard With Growth Percentage Portrait PDF
Deliver an awe inspiring pitch with this creative electric vehicle sales scorecard with growth percentage portrait pdf bundle. Topics like electric vehicle sales scorecard with growth percentage can be discussed with this completely editable template. It is available for immediate download depending on the needs and requirements of the user.
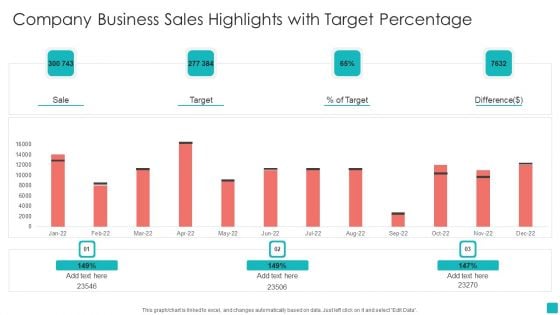
Company Business Sales Highlights With Target Percentage Background PDF
Pitch your topic with ease and precision using this Company Business Sales Highlights With Target Percentage Background PDF. This layout presents information on Company Business Sales Highlights, Target Percentage. It is also available for immediate download and adjustment. So, changes can be made in the color, design, graphics or any other component to create a unique layout.
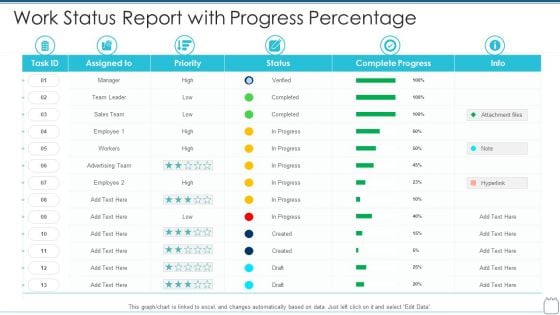
Work Status Report With Progress Percentage Structure PDF
Showcasing this set of slides titled work status report with progress percentage structure pdf . The topics addressed in these templates are work status report with progress percentage . All the content presented in this PPT design is completely editable. Download it and make adjustments in color, background, font etc. as per your unique business setting.
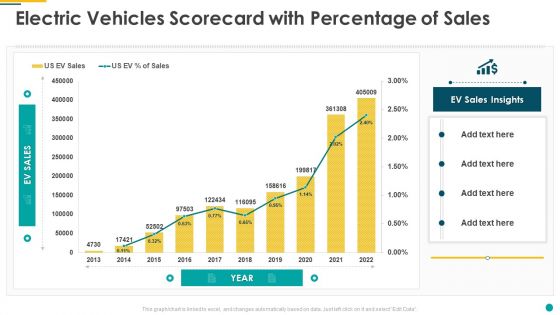
Electric Vehicles Scorecard With Percentage Of Sales Mockup PDF
Deliver and pitch your topic in the best possible manner with this electric vehicles scorecard with percentage of sales mockup pdf. Use them to share invaluable insights on electric vehicles scorecard with percentage of sales and impress your audience. This template can be altered and modified as per your expectations. So, grab it now.

Staffing Dashboard Showing Employees Salary Percentage Information PDF
Showcasing this set of slides titled Staffing Dashboard Showing Employees Salary Percentage Information PDF The topics addressed in these templates are Staffing Dashboard, Showing Employees, Salary Percentage All the content presented in this PPT design is completely editable. Download it and make adjustments in color, background, font etc. as per your unique business setting.
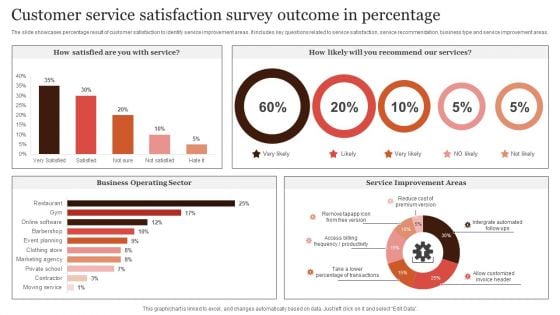
Customer Service Satisfaction Survey Outcome In Percentage Microsoft PDF
The slide showcases percentage result of customer satisfaction to identify service improvement areas. It includes key questions related to service satisfaction, service recommendation, business type and service improvement areas. Pitch your topic with ease and precision using this Customer Service Satisfaction Survey Outcome In Percentage Microsoft PDF. This layout presents information on Customer Service, Satisfaction Survey, Outcome In Percentage. It is also available for immediate download and adjustment. So, changes can be made in the color, design, graphics or any other component to create a unique layout.
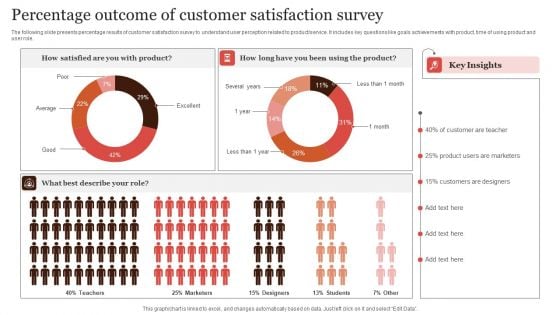
Percentage Outcome Of Customer Satisfaction Survey Infographics PDF
The following slide presents percentage results of customer satisfaction survey to understand user perception related to product or service. It includes key questions like goals achievements with product, time of using product and user role. Pitch your topic with ease and precision using this Percentage Outcome Of Customer Satisfaction Survey Infographics PDF. This layout presents information on Percentage Outcome, Customer Satisfaction Survey. It is also available for immediate download and adjustment. So, changes can be made in the color, design, graphics or any other component to create a unique layout.
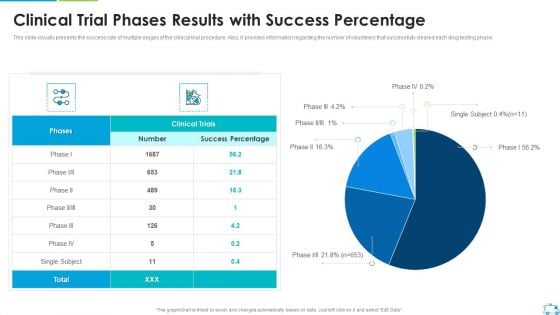
Clinical Trial Phases Results With Success Percentage Download PDF
This slide visually presents the success rate of multiple stages of the clinical trial procedure. Also, it provides information regarding the number of volunteers that successfully cleared each drug testing phase.Deliver an awe inspiring pitch with this creative Clinical Trial Phases Results With Success Percentage Download PDF bundle. Topics like Clinical Trial Phases Results With Success Percentage can be discussed with this completely editable template. It is available for immediate download depending on the needs and requirements of the user.
Business Ownership Structure With Their Percentage Icon Ppt Outline PDF
The slide provides the comparison of revenue and operating expenses for the year 2015 to 2020 historical and 2021 to 2024 forecasted. Deliver an awe inspiring pitch with this creative business ownership structure with their percentage icon ppt outline pdf bundle. Topics like business ownership structure with their percentage can be discussed with this completely editable template. It is available for immediate download depending on the needs and requirements of the user.
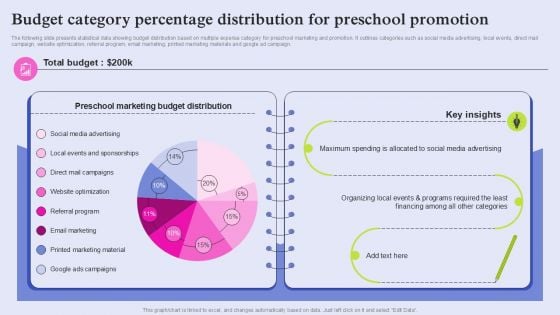
Budget Category Percentage Distribution For Preschool Promotion Graphics PDF
Online Shopping Survey Outcome In Percentage Icons PDF
The slide showcases percentage results to analyze experience of online shopping to identify areas for enhancing shopping experience. It includes key elements such as reasons for online shopping, elements considered by customers and shopping platforms. Pitch your topic with ease and precision using this Online Shopping Survey Outcome In Percentage Icons PDF. This layout presents information on Price Comparison, Product Information, Online Reviews. It is also available for immediate download and adjustment. So, changes can be made in the color, design, graphics or any other component to create a unique layout.
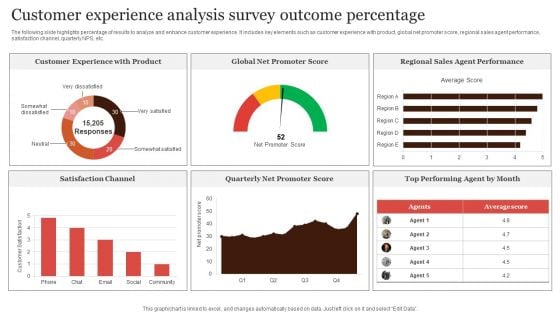
Customer Experience Analysis Survey Outcome Percentage Portrait PDF
The following slide highlights percentage of results to analyze and enhance customer experience. It includes key elements such as customer experience with product, global net promoter score, regional sales agent performance, satisfaction channel, quarterly NPS, etc. Pitch your topic with ease and precision using this Customer Experience Analysis Survey Outcome Percentage Portrait PDF. This layout presents information on Customer Experience, Promoter Score, Regional Sales. It is also available for immediate download and adjustment. So, changes can be made in the color, design, graphics or any other component to create a unique layout.
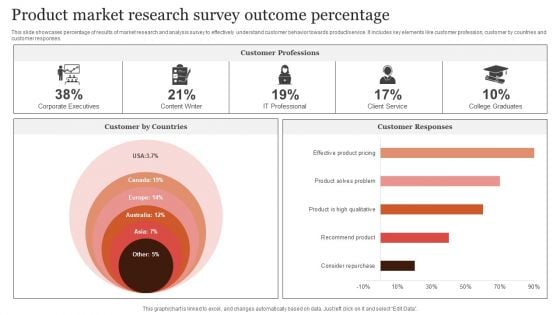
Product Market Research Survey Outcome Percentage Elements PDF
This slide showcases percentage of results of market research and analysis survey to effectively understand customer behavior towards product or service. It includes key elements like customer profession, customer by countries and customer responses. Pitch your topic with ease and precision using this Product Market Research Survey Outcome Percentage Elements PDF. This layout presents information on Customer By Countries, Customer Professions, Customer Responses. It is also available for immediate download and adjustment. So, changes can be made in the color, design, graphics or any other component to create a unique layout.
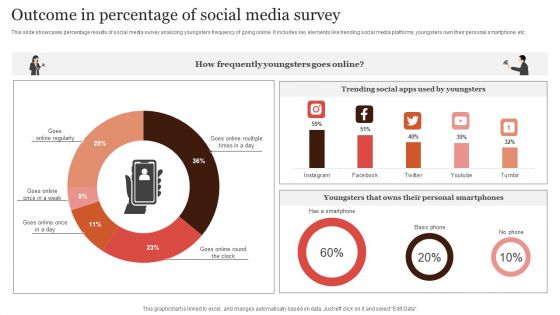
Outcome In Percentage Of Social Media Survey Demonstration PDF
This slide showcases percentage results of social media survey analyzing youngsters frequency of going online. It includes key elements like trending social media platforms, youngsters own their personal smartphone, etc. Showcasing this set of slides titled Outcome In Percentage Of Social Media Survey Demonstration PDF. The topics addressed in these templates are Frequently Youngsters, Trending Social Apps, Personal Smartphones. All the content presented in this PPT design is completely editable. Download it and make adjustments in color, background, font etc. as per your unique business setting.
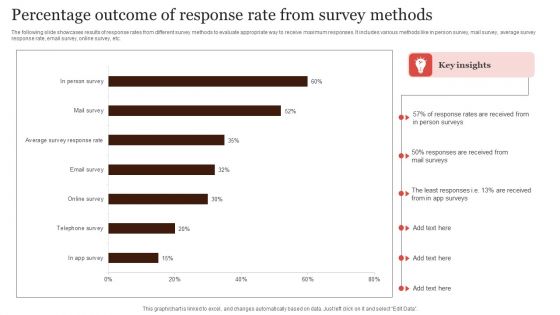
Percentage Outcome Of Response Rate From Survey Methods Guidelines PDF
The following slide showcases results of response rates from different survey methods to evaluate appropriate way to receive maximum responses. It includes various methods like in person survey, mail survey, average survey response rate, email survey, online survey, etc. Showcasing this set of slides titled Percentage Outcome Of Response Rate From Survey Methods Guidelines PDF. The topics addressed in these templates are Percentage Outcome, Response Rate, Survey Methods. All the content presented in this PPT design is completely editable. Download it and make adjustments in color, background, font etc. as per your unique business setting.
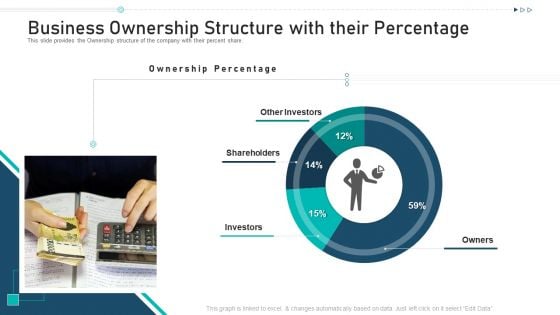
Business Ownership Structure With Their Percentage Ppt Slides Elements PDF
This slide provides the Ownership structure of the company with their percent share. Deliver an awe inspiring pitch with this creative business ownership structure with their percentage ppt slides elements pdf bundle. Topics like other investors, shareholders, investors, owners can be discussed with this completely editable template. It is available for immediate download depending on the needs and requirements of the user.
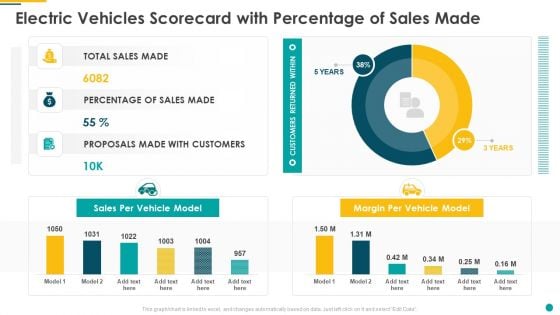
Electric Vehicles Scorecard With Percentage Of Sales Made Pictures PDF
Deliver an awe inspiring pitch with this creative electric vehicles scorecard with percentage of sales made pictures pdf bundle. Topics like sales per vehicle model, margin per vehicle model, customers returned within can be discussed with this completely editable template. It is available for immediate download depending on the needs and requirements of the user.
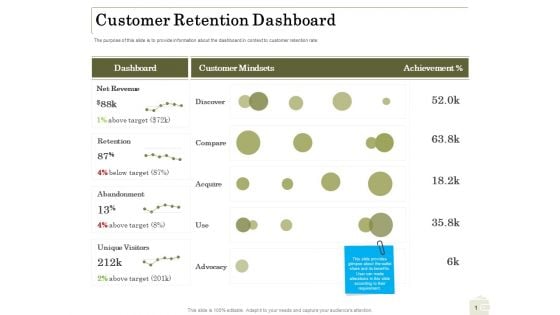
Percentage Share Customer Expenditure Customer Retention Dashboard Background PDF
Presenting this set of slides with name percentage share customer expenditure customer retention dashboard background pdf. The topics discussed in these slides are revenue, target, abandonment, retention, dashboard. This is a completely editable PowerPoint presentation and is available for immediate download. Download now and impress your audience.
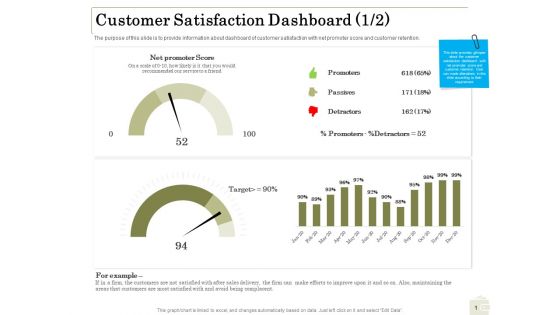
Percentage Share Customer Expenditure Customer Satisfaction Dashboard Areas Designs PDF
Presenting this set of slides with name percentage share customer expenditure customer satisfaction dashboard areas designs pdf. The topics discussed in these slides are promoters, passives, detractors, target. This is a completely editable PowerPoint presentation and is available for immediate download. Download now and impress your audience.
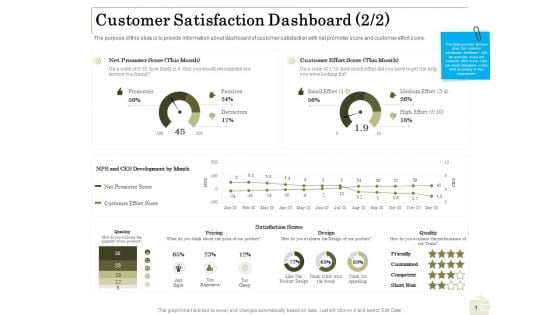
Percentage Share Customer Expenditure Customer Satisfaction Dashboard Score Mockup PDF
Presenting this set of slides with name percentage share customer expenditure customer satisfaction dashboard score mockup pdf. The topics discussed in these slides are design, pricing, quality, development. This is a completely editable PowerPoint presentation and is available for immediate download. Download now and impress your audience.
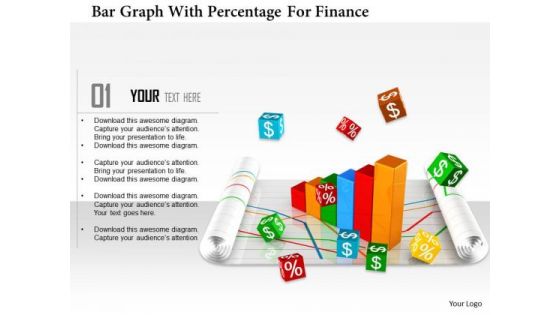
Stock Photo Bar Graph With Percentage For Finance PowerPoint Slide
This Power Point template has been designed with graphic of bar graph and percentage value. This image slide contains the concept of finance and accounting. Use this editable diagram for your business and finance related presentations.
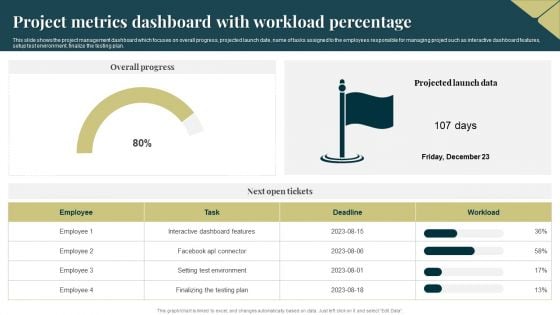
Project Metrics Dashboard With Workload Percentage Ideas PDF
This slide shows the project management dashboard which focuses on overall progress, projected launch date, name of tasks assigned to the employees responsible for managing project such as interactive dashboard features, setup test environment, finalize the testing plan. Showcasing this set of slides titled Project Metrics Dashboard With Workload Percentage Ideas PDF. The topics addressed in these templates are Environment, Plan, Dashboard. All the content presented in this PPT design is completely editable. Download it and make adjustments in color, background, font etc. as per your unique business setting.

Stacked Column Percentage Product Ppt PowerPoint Presentation Infographics Outfit
This is a stacked column percentage product ppt powerpoint presentation infographics outfit. This is a two stage process. The stages in this process are marketing, business, management, percentage, product.
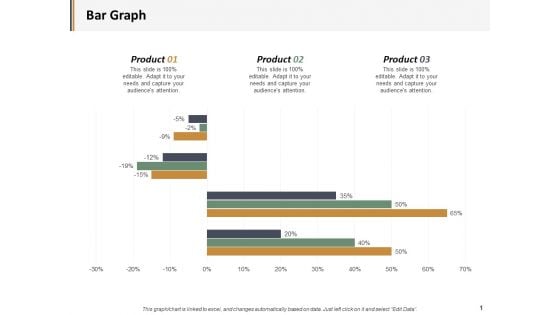
Bar Graph Percentage Product Ppt PowerPoint Presentation Layouts Microsoft
This is a bar graph percentage product ppt powerpoint presentation layouts microsoft. This is a three stage process. The stages in this process are business, management, marketing, percentage, product.
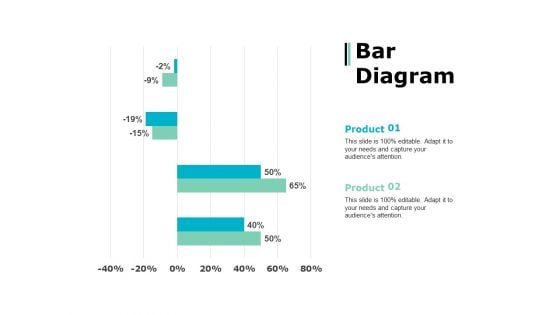
Bar Diagram Percentage Product Ppt PowerPoint Presentation Show Topics
This is a bar diagram percentage product ppt powerpoint presentation show topics. This is a two stage process. The stages in this process are percentage, product, business, management, marketing.
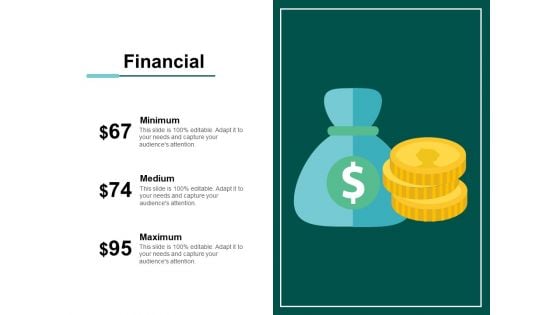
Financial Percentage Ppt PowerPoint Presentation Model Design Templates
This is a financial percentage ppt powerpoint presentation model design templates. This is a three stage process. The stages in this process are financial, minimum, maximum, marketing, strategy.


 Continue with Email

 Home
Home


